Project
Illumina Body Map 2 (GSE30611)
Navigation
Downloads
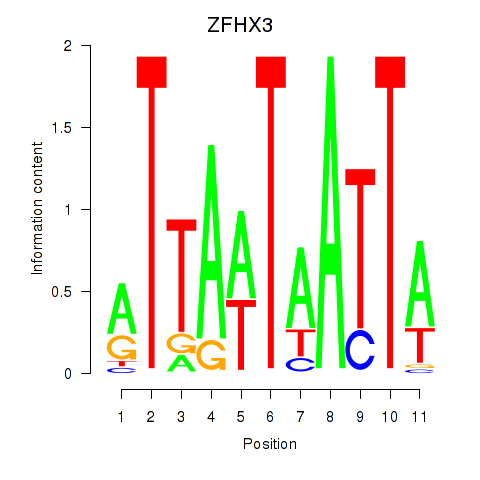
Results for ZFHX3
Z-value: 1.04
Motif logo
Transcription factors associated with ZFHX3
| Gene Symbol | Gene ID | Gene Info |
|---|---|---|
|
ZFHX3
|
ENSG00000140836.17 | zinc finger homeobox 3 |
Activity-expression correlation:
| Gene | Promoter | Pearson corr. coef. | P-value | Plot |
|---|---|---|---|---|
| ZFHX3 | hg38_v1_chr16_-_73048104_73048136 | -0.75 | 7.4e-07 | Click! |
Activity profile of ZFHX3 motif
Sorted Z-values of ZFHX3 motif
| Promoter | Log-likelihood | Transcript | Gene | Gene Info |
|---|---|---|---|---|
| chr4_-_154590735 | 18.42 |
ENST00000403106.8
ENST00000622532.1 ENST00000651975.1 |
FGA
|
fibrinogen alpha chain |
| chr1_-_159714581 | 10.80 |
ENST00000255030.9
ENST00000437342.1 ENST00000368112.5 ENST00000368111.5 ENST00000368110.1 |
CRP
|
C-reactive protein |
| chr1_+_62597510 | 10.75 |
ENST00000371129.4
|
ANGPTL3
|
angiopoietin like 3 |
| chr1_+_159587817 | 6.67 |
ENST00000255040.3
|
APCS
|
amyloid P component, serum |
| chr6_+_160702238 | 5.64 |
ENST00000366924.6
ENST00000308192.14 ENST00000418964.1 |
PLG
|
plasminogen |
| chr17_+_42900791 | 5.40 |
ENST00000592383.5
ENST00000253801.7 ENST00000585489.1 |
G6PC1
|
glucose-6-phosphatase catalytic subunit 1 |
| chr14_+_94561435 | 4.71 |
ENST00000557004.6
ENST00000555095.5 ENST00000298841.5 ENST00000554220.5 ENST00000553780.5 |
SERPINA4
SERPINA5
|
serpin family A member 4 serpin family A member 5 |
| chr9_-_121050264 | 3.96 |
ENST00000223642.3
|
C5
|
complement C5 |
| chr4_+_73481737 | 3.42 |
ENST00000226355.5
|
AFM
|
afamin |
| chr19_-_58353482 | 3.41 |
ENST00000263100.8
|
A1BG
|
alpha-1-B glycoprotein |
| chr2_+_233712905 | 3.40 |
ENST00000373414.4
|
UGT1A5
|
UDP glucuronosyltransferase family 1 member A5 |
| chr4_+_99574812 | 3.19 |
ENST00000422897.6
ENST00000265517.10 |
MTTP
|
microsomal triglyceride transfer protein |
| chr2_+_87748087 | 3.18 |
ENST00000359481.9
|
PLGLB2
|
plasminogen like B2 |
| chr20_-_7940444 | 3.14 |
ENST00000378789.4
|
HAO1
|
hydroxyacid oxidase 1 |
| chr2_+_233718734 | 3.10 |
ENST00000373409.8
|
UGT1A4
|
UDP glucuronosyltransferase family 1 member A4 |
| chr19_-_35812838 | 3.04 |
ENST00000653904.2
|
PRODH2
|
proline dehydrogenase 2 |
| chr17_+_4788926 | 2.86 |
ENST00000331264.8
|
GLTPD2
|
glycolipid transfer protein domain containing 2 |
| chr2_-_87021844 | 2.69 |
ENST00000355705.4
ENST00000409310.6 |
PLGLB1
|
plasminogen like B1 |
| chr15_+_58431985 | 2.62 |
ENST00000433326.2
ENST00000299022.10 |
LIPC
|
lipase C, hepatic type |
| chr1_-_197067234 | 2.47 |
ENST00000367412.2
|
F13B
|
coagulation factor XIII B chain |
| chr2_+_233729042 | 2.20 |
ENST00000482026.6
|
UGT1A3
|
UDP glucuronosyltransferase family 1 member A3 |
| chr6_-_160664270 | 1.86 |
ENST00000316300.10
|
LPA
|
lipoprotein(a) |
| chr7_-_44541262 | 1.85 |
ENST00000289547.8
ENST00000546276.5 ENST00000423141.1 |
NPC1L1
|
NPC1 like intracellular cholesterol transporter 1 |
| chr11_+_22674769 | 1.84 |
ENST00000532398.1
|
GAS2
|
growth arrest specific 2 |
| chr20_-_35147285 | 1.81 |
ENST00000374491.3
ENST00000374492.8 |
EDEM2
|
ER degradation enhancing alpha-mannosidase like protein 2 |
| chr4_+_3441960 | 1.65 |
ENST00000382774.8
ENST00000511533.1 |
HGFAC
|
HGF activator |
| chr20_+_43558968 | 1.53 |
ENST00000647834.1
ENST00000373100.7 ENST00000648083.1 ENST00000648530.1 |
SGK2
|
serum/glucocorticoid regulated kinase 2 |
| chr8_+_103819212 | 1.38 |
ENST00000515551.5
|
RIMS2
|
regulating synaptic membrane exocytosis 2 |
| chr11_+_72223918 | 1.30 |
ENST00000543234.1
|
INPPL1
|
inositol polyphosphate phosphatase like 1 |
| chr6_+_25754699 | 1.23 |
ENST00000439485.6
ENST00000377905.9 |
SLC17A4
|
solute carrier family 17 member 4 |
| chr7_-_44541318 | 1.16 |
ENST00000381160.8
|
NPC1L1
|
NPC1 like intracellular cholesterol transporter 1 |
| chr16_-_69351778 | 1.12 |
ENST00000288025.4
|
TMED6
|
transmembrane p24 trafficking protein 6 |
| chr8_+_103819244 | 1.11 |
ENST00000262231.14
ENST00000507740.5 ENST00000408894.6 |
RIMS2
|
regulating synaptic membrane exocytosis 2 |
| chr11_+_72223688 | 1.11 |
ENST00000540973.1
|
INPPL1
|
inositol polyphosphate phosphatase like 1 |
| chr12_-_130716264 | 1.10 |
ENST00000643940.1
|
RIMBP2
|
RIMS binding protein 2 |
| chr16_+_56191476 | 0.95 |
ENST00000262493.12
|
GNAO1
|
G protein subunit alpha o1 |
| chr3_-_114758940 | 0.93 |
ENST00000464560.5
|
ZBTB20
|
zinc finger and BTB domain containing 20 |
| chr3_-_39280021 | 0.89 |
ENST00000399220.3
|
CX3CR1
|
C-X3-C motif chemokine receptor 1 |
| chr3_+_77039836 | 0.86 |
ENST00000461745.5
|
ROBO2
|
roundabout guidance receptor 2 |
| chr2_-_2324642 | 0.84 |
ENST00000650485.1
ENST00000649207.1 |
MYT1L
|
myelin transcription factor 1 like |
| chr17_-_40999903 | 0.82 |
ENST00000391587.3
|
KRTAP3-2
|
keratin associated protein 3-2 |
| chr2_-_2324323 | 0.79 |
ENST00000648339.1
ENST00000647694.1 |
MYT1L
|
myelin transcription factor 1 like |
| chrM_-_14669 | 0.79 |
ENST00000361681.2
|
MT-ND6
|
mitochondrially encoded NADH:ubiquinone oxidoreductase core subunit 6 |
| chr6_-_116060859 | 0.78 |
ENST00000606080.2
|
FRK
|
fyn related Src family tyrosine kinase |
| chr14_+_39233908 | 0.77 |
ENST00000280082.4
|
MIA2
|
MIA SH3 domain ER export factor 2 |
| chr2_+_184598520 | 0.76 |
ENST00000302277.7
|
ZNF804A
|
zinc finger protein 804A |
| chr7_+_151028422 | 0.76 |
ENST00000542328.5
ENST00000461373.5 ENST00000297504.10 ENST00000358849.9 ENST00000498578.5 ENST00000477719.5 ENST00000477092.5 |
ABCB8
|
ATP binding cassette subfamily B member 8 |
| chr2_-_2324968 | 0.74 |
ENST00000649641.1
|
MYT1L
|
myelin transcription factor 1 like |
| chr12_+_54016879 | 0.70 |
ENST00000303406.4
|
HOXC4
|
homeobox C4 |
| chr22_-_30246739 | 0.69 |
ENST00000403987.3
ENST00000249075.4 |
LIF
|
LIF interleukin 6 family cytokine |
| chr2_-_2324935 | 0.69 |
ENST00000649709.1
|
MYT1L
|
myelin transcription factor 1 like |
| chrM_+_10464 | 0.68 |
ENST00000361335.1
|
MT-ND4L
|
mitochondrially encoded NADH:ubiquinone oxidoreductase core subunit 4L |
| chrM_+_8489 | 0.65 |
ENST00000361899.2
|
MT-ATP6
|
mitochondrially encoded ATP synthase membrane subunit 6 |
| chr15_+_76336755 | 0.64 |
ENST00000290759.9
|
ISL2
|
ISL LIM homeobox 2 |
| chr1_-_160579439 | 0.59 |
ENST00000368054.8
ENST00000368048.7 ENST00000311224.8 ENST00000368051.3 ENST00000534968.5 |
CD84
|
CD84 molecule |
| chr3_-_108529322 | 0.59 |
ENST00000273353.4
|
MYH15
|
myosin heavy chain 15 |
| chr2_-_60553474 | 0.57 |
ENST00000409351.5
|
BCL11A
|
BAF chromatin remodeling complex subunit BCL11A |
| chr14_-_100569780 | 0.57 |
ENST00000355173.7
|
BEGAIN
|
brain enriched guanylate kinase associated |
| chr8_-_18684033 | 0.56 |
ENST00000614430.3
|
PSD3
|
pleckstrin and Sec7 domain containing 3 |
| chr8_-_18684093 | 0.54 |
ENST00000428502.6
|
PSD3
|
pleckstrin and Sec7 domain containing 3 |
| chr10_-_72523936 | 0.53 |
ENST00000398763.8
ENST00000418483.6 ENST00000489666.2 |
MICU1
|
mitochondrial calcium uptake 1 |
| chr1_-_247758680 | 0.51 |
ENST00000408896.4
|
OR1C1
|
olfactory receptor family 1 subfamily C member 1 |
| chr3_-_167474026 | 0.48 |
ENST00000466903.1
ENST00000264677.8 |
SERPINI2
|
serpin family I member 2 |
| chr2_-_60553409 | 0.48 |
ENST00000358510.6
ENST00000643004.1 |
BCL11A
|
BAF chromatin remodeling complex subunit BCL11A |
| chrM_+_9207 | 0.45 |
ENST00000362079.2
|
MT-CO3
|
mitochondrially encoded cytochrome c oxidase III |
| chr6_-_116126120 | 0.44 |
ENST00000452729.1
ENST00000651968.1 ENST00000243222.8 |
COL10A1
|
collagen type X alpha 1 chain |
| chr4_-_99435134 | 0.43 |
ENST00000476959.5
ENST00000482593.5 |
ADH7
|
alcohol dehydrogenase 7 (class IV), mu or sigma polypeptide |
| chr10_+_116324440 | 0.42 |
ENST00000333254.4
|
CCDC172
|
coiled-coil domain containing 172 |
| chr2_+_158533185 | 0.41 |
ENST00000629219.1
|
PKP4
|
plakophilin 4 |
| chr4_-_99435336 | 0.41 |
ENST00000437033.7
|
ADH7
|
alcohol dehydrogenase 7 (class IV), mu or sigma polypeptide |
| chr4_+_70592253 | 0.41 |
ENST00000322937.10
ENST00000613447.4 |
AMBN
|
ameloblastin |
| chr5_-_116554858 | 0.40 |
ENST00000509665.1
|
SEMA6A
|
semaphorin 6A |
| chr8_-_144529048 | 0.40 |
ENST00000527462.1
ENST00000313465.5 ENST00000524821.6 |
C8orf82
|
chromosome 8 open reading frame 82 |
| chr3_+_35680932 | 0.40 |
ENST00000396481.6
|
ARPP21
|
cAMP regulated phosphoprotein 21 |
| chr12_-_7665897 | 0.39 |
ENST00000229304.5
|
APOBEC1
|
apolipoprotein B mRNA editing enzyme catalytic subunit 1 |
| chr17_-_41098084 | 0.38 |
ENST00000318329.6
ENST00000333822.5 |
KRTAP4-8
|
keratin associated protein 4-8 |
| chr3_+_35680994 | 0.38 |
ENST00000441454.5
|
ARPP21
|
cAMP regulated phosphoprotein 21 |
| chr11_+_5389377 | 0.37 |
ENST00000328611.5
|
OR51M1
|
olfactory receptor family 51 subfamily M member 1 |
| chr12_+_53954870 | 0.36 |
ENST00000243103.4
|
HOXC12
|
homeobox C12 |
| chr6_-_127918586 | 0.36 |
ENST00000626040.2
|
THEMIS
|
thymocyte selection associated |
| chr1_-_46551647 | 0.36 |
ENST00000481882.7
|
KNCN
|
kinocilin |
| chrM_+_14740 | 0.35 |
ENST00000361789.2
|
MT-CYB
|
mitochondrially encoded cytochrome b |
| chrX_+_85003863 | 0.33 |
ENST00000373173.7
|
APOOL
|
apolipoprotein O like |
| chr11_+_6199224 | 0.33 |
ENST00000311352.3
|
OR52W1
|
olfactory receptor family 52 subfamily W member 1 |
| chr11_-_75089754 | 0.32 |
ENST00000305159.3
|
OR2AT4
|
olfactory receptor family 2 subfamily AT member 4 |
| chrX_-_18672101 | 0.31 |
ENST00000379984.4
|
RS1
|
retinoschisin 1 |
| chr12_+_55330746 | 0.29 |
ENST00000641740.2
|
OR6C3
|
olfactory receptor family 6 subfamily C member 3 |
| chr7_+_36420163 | 0.28 |
ENST00000446635.5
|
ANLN
|
anillin actin binding protein |
| chr8_+_91101832 | 0.27 |
ENST00000518304.1
|
LRRC69
|
leucine rich repeat containing 69 |
| chr6_-_127918604 | 0.24 |
ENST00000537166.5
|
THEMIS
|
thymocyte selection associated |
| chr15_+_47339059 | 0.21 |
ENST00000560636.5
|
SEMA6D
|
semaphorin 6D |
| chr20_+_43559060 | 0.21 |
ENST00000485914.2
|
SGK2
|
serum/glucocorticoid regulated kinase 2 |
| chr15_-_42051190 | 0.20 |
ENST00000399518.3
|
PLA2G4E
|
phospholipase A2 group IVE |
| chr19_+_53962925 | 0.20 |
ENST00000270458.4
|
CACNG8
|
calcium voltage-gated channel auxiliary subunit gamma 8 |
| chr6_-_127918540 | 0.16 |
ENST00000368250.5
|
THEMIS
|
thymocyte selection associated |
| chrY_+_18546691 | 0.14 |
ENST00000309834.8
ENST00000307393.3 ENST00000382856.2 |
HSFY1
|
heat shock transcription factor Y-linked 1 |
| chr17_+_17782108 | 0.14 |
ENST00000395774.1
|
RAI1
|
retinoic acid induced 1 |
| chr10_-_126521439 | 0.13 |
ENST00000284694.11
ENST00000432642.5 |
C10orf90
|
chromosome 10 open reading frame 90 |
| chr12_-_56741535 | 0.13 |
ENST00000647707.1
|
ENSG00000285625.1
|
novel protein |
| chr7_+_33904911 | 0.13 |
ENST00000297161.6
|
BMPER
|
BMP binding endothelial regulator |
| chr14_-_20036038 | 0.12 |
ENST00000641664.1
ENST00000641904.1 |
OR4K13
|
olfactory receptor family 4 subfamily K member 13 |
| chr12_-_10169155 | 0.12 |
ENST00000539518.5
|
OLR1
|
oxidized low density lipoprotein receptor 1 |
| chr6_-_32407123 | 0.11 |
ENST00000374993.4
ENST00000544175.2 ENST00000454136.7 ENST00000446536.2 |
BTNL2
|
butyrophilin like 2 |
| chr6_+_47781982 | 0.11 |
ENST00000489301.6
ENST00000638973.1 ENST00000371211.6 ENST00000393699.2 |
OPN5
|
opsin 5 |
| chr12_+_64497968 | 0.10 |
ENST00000676593.1
ENST00000677093.1 |
TBK1
ENSG00000288665.1
|
TANK binding kinase 1 novel transcript |
| chr17_-_28406160 | 0.09 |
ENST00000618626.1
ENST00000612814.5 |
SLC46A1
|
solute carrier family 46 member 1 |
| chr1_-_35554930 | 0.07 |
ENST00000440579.5
ENST00000494948.1 |
KIAA0319L
|
KIAA0319 like |
| chr2_-_60553558 | 0.07 |
ENST00000642439.1
ENST00000356842.9 |
BCL11A
|
BAF chromatin remodeling complex subunit BCL11A |
| chr20_-_37178966 | 0.07 |
ENST00000422138.1
|
MROH8
|
maestro heat like repeat family member 8 |
| chr4_-_22443110 | 0.06 |
ENST00000508133.5
|
ADGRA3
|
adhesion G protein-coupled receptor A3 |
| chr8_-_69833338 | 0.04 |
ENST00000524945.5
|
SLCO5A1
|
solute carrier organic anion transporter family member 5A1 |
| chr18_+_34976928 | 0.03 |
ENST00000591734.5
ENST00000413393.5 ENST00000589180.5 ENST00000587359.5 |
MAPRE2
|
microtubule associated protein RP/EB family member 2 |
| chr11_-_559377 | 0.00 |
ENST00000486629.1
|
LMNTD2
|
lamin tail domain containing 2 |
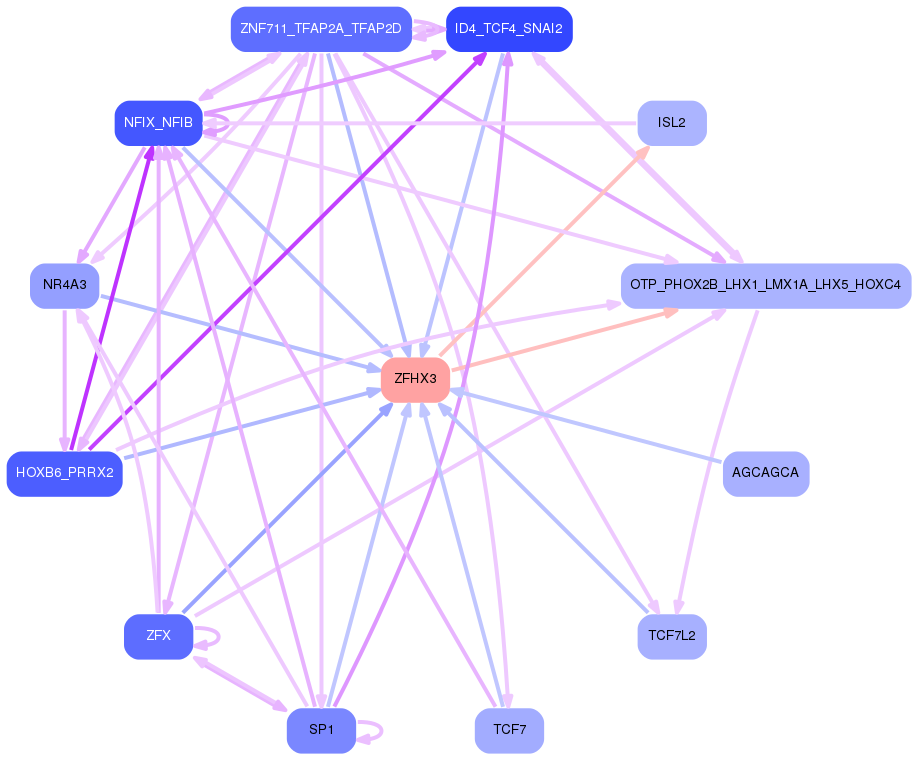
Network of associatons between targets according to the STRING database.

First level regulatory network of ZFHX3
Gene Ontology Analysis
Gene overrepresentation in biological process category:
| Log-likelihood per target | Total log-likelihood | Term | Description |
|---|---|---|---|
| 2.2 | 6.7 | GO:1903015 | regulation of exo-alpha-sialidase activity(GO:1903015) |
| 1.4 | 5.6 | GO:0052047 | positive regulation of fibrinolysis(GO:0051919) interaction with other organism via secreted substance involved in symbiotic interaction(GO:0052047) |
| 1.3 | 18.4 | GO:0043152 | induction of bacterial agglutination(GO:0043152) |
| 0.9 | 10.8 | GO:0051005 | negative regulation of phospholipase activity(GO:0010519) negative regulation of lipoprotein lipase activity(GO:0051005) |
| 0.8 | 4.7 | GO:0061107 | seminal vesicle development(GO:0061107) |
| 0.8 | 3.0 | GO:0010133 | proline catabolic process to glutamate(GO:0010133) |
| 0.7 | 8.7 | GO:0052696 | flavonoid glucuronidation(GO:0052696) xenobiotic glucuronidation(GO:0052697) |
| 0.7 | 4.0 | GO:0010760 | negative regulation of macrophage chemotaxis(GO:0010760) |
| 0.6 | 1.8 | GO:0036510 | trimming of terminal mannose on C branch(GO:0036510) |
| 0.5 | 10.8 | GO:0008228 | opsonization(GO:0008228) |
| 0.4 | 3.1 | GO:0009441 | glycolate metabolic process(GO:0009441) |
| 0.3 | 2.6 | GO:0034372 | very-low-density lipoprotein particle remodeling(GO:0034372) chylomicron remnant clearance(GO:0034382) triglyceride-rich lipoprotein particle clearance(GO:0071830) |
| 0.3 | 3.2 | GO:0034378 | chylomicron assembly(GO:0034378) |
| 0.2 | 0.9 | GO:0002881 | negative regulation of chronic inflammatory response to non-antigenic stimulus(GO:0002881) |
| 0.2 | 0.6 | GO:0021524 | visceral motor neuron differentiation(GO:0021524) |
| 0.2 | 0.8 | GO:0010430 | fatty acid omega-oxidation(GO:0010430) |
| 0.2 | 0.6 | GO:0032701 | negative regulation of interleukin-18 production(GO:0032701) |
| 0.2 | 2.5 | GO:0061669 | spontaneous neurotransmitter secretion(GO:0061669) spontaneous synaptic transmission(GO:0098814) |
| 0.2 | 0.7 | GO:0060708 | spongiotrophoblast differentiation(GO:0060708) |
| 0.1 | 3.0 | GO:0030299 | intestinal cholesterol absorption(GO:0030299) intestinal lipid absorption(GO:0098856) |
| 0.1 | 0.9 | GO:0050925 | negative regulation of negative chemotaxis(GO:0050925) |
| 0.1 | 0.4 | GO:0090310 | negative regulation of methylation-dependent chromatin silencing(GO:0090310) regulation of mRNA modification(GO:0090365) |
| 0.1 | 1.9 | GO:0034374 | low-density lipoprotein particle remodeling(GO:0034374) |
| 0.1 | 0.7 | GO:1904799 | regulation of neuron remodeling(GO:1904799) negative regulation of neuron remodeling(GO:1904800) negative regulation of branching morphogenesis of a nerve(GO:2000173) |
| 0.1 | 0.7 | GO:0042776 | mitochondrial ATP synthesis coupled proton transport(GO:0042776) |
| 0.1 | 0.3 | GO:0036367 | adaptation of rhodopsin mediated signaling(GO:0016062) light adaption(GO:0036367) |
| 0.1 | 0.3 | GO:0000921 | septin ring assembly(GO:0000921) septin ring organization(GO:0031106) |
| 0.1 | 3.1 | GO:0048665 | neuron fate specification(GO:0048665) |
| 0.0 | 3.5 | GO:0051180 | vitamin transport(GO:0051180) |
| 0.0 | 2.4 | GO:0046856 | phosphatidylinositol dephosphorylation(GO:0046856) |
| 0.0 | 0.5 | GO:0036444 | calcium ion transmembrane import into mitochondrion(GO:0036444) |
| 0.0 | 1.2 | GO:0035435 | phosphate ion transmembrane transport(GO:0035435) |
| 0.0 | 0.8 | GO:0043383 | negative T cell selection(GO:0043383) |
| 0.0 | 1.1 | GO:0032012 | regulation of ARF protein signal transduction(GO:0032012) |
| 0.0 | 0.4 | GO:0006122 | mitochondrial electron transport, ubiquinol to cytochrome c(GO:0006122) |
| 0.0 | 0.3 | GO:0042407 | cristae formation(GO:0042407) |
| 0.0 | 0.4 | GO:0006123 | mitochondrial electron transport, cytochrome c to oxygen(GO:0006123) |
| 0.0 | 1.0 | GO:0032728 | positive regulation of interferon-beta production(GO:0032728) |
| 0.0 | 1.1 | GO:0006120 | mitochondrial electron transport, NADH to ubiquinone(GO:0006120) |
| 0.0 | 1.0 | GO:0014072 | response to isoquinoline alkaloid(GO:0014072) response to morphine(GO:0043278) |
| 0.0 | 3.4 | GO:0002576 | platelet degranulation(GO:0002576) |
| 0.0 | 0.4 | GO:2001224 | positive regulation of neuron migration(GO:2001224) |
Gene overrepresentation in cellular component category:
| Log-likelihood per target | Total log-likelihood | Term | Description |
|---|---|---|---|
| 1.4 | 18.4 | GO:0005577 | fibrinogen complex(GO:0005577) |
| 1.2 | 4.7 | GO:0036028 | protein C inhibitor-TMPRSS7 complex(GO:0036024) protein C inhibitor-TMPRSS11E complex(GO:0036025) protein C inhibitor-PLAT complex(GO:0036026) protein C inhibitor-PLAU complex(GO:0036027) protein C inhibitor-thrombin complex(GO:0036028) protein C inhibitor-KLK3 complex(GO:0036029) protein C inhibitor-plasma kallikrein complex(GO:0036030) serine protease inhibitor complex(GO:0097180) protein C inhibitor-coagulation factor V complex(GO:0097181) protein C inhibitor-coagulation factor Xa complex(GO:0097182) protein C inhibitor-coagulation factor XI complex(GO:0097183) |
| 0.8 | 5.6 | GO:0031232 | extrinsic component of external side of plasma membrane(GO:0031232) other organism cell membrane(GO:0044218) other organism membrane(GO:0044279) |
| 0.5 | 4.0 | GO:0005579 | membrane attack complex(GO:0005579) |
| 0.2 | 0.7 | GO:0005753 | mitochondrial proton-transporting ATP synthase complex(GO:0005753) proton-transporting ATP synthase complex(GO:0045259) |
| 0.1 | 0.5 | GO:1990246 | uniplex complex(GO:1990246) |
| 0.1 | 0.3 | GO:0061617 | MICOS complex(GO:0061617) |
| 0.1 | 0.8 | GO:0043190 | ATP-binding cassette (ABC) transporter complex(GO:0043190) |
| 0.1 | 0.4 | GO:0032437 | cuticular plate(GO:0032437) |
| 0.1 | 4.5 | GO:1990777 | plasma lipoprotein particle(GO:0034358) lipoprotein particle(GO:1990777) |
| 0.1 | 13.5 | GO:0072562 | blood microparticle(GO:0072562) |
| 0.0 | 1.8 | GO:0044322 | endoplasmic reticulum quality control compartment(GO:0044322) |
| 0.0 | 3.1 | GO:0005782 | peroxisomal matrix(GO:0005782) microbody lumen(GO:0031907) |
| 0.0 | 2.5 | GO:0048786 | presynaptic active zone(GO:0048786) |
| 0.0 | 3.1 | GO:0031526 | brush border membrane(GO:0031526) |
| 0.0 | 0.3 | GO:0005826 | actomyosin contractile ring(GO:0005826) |
| 0.0 | 0.4 | GO:0045277 | respiratory chain complex IV(GO:0045277) |
| 0.0 | 0.6 | GO:0032982 | myosin filament(GO:0032982) |
| 0.0 | 12.2 | GO:0030027 | lamellipodium(GO:0030027) |
| 0.0 | 0.7 | GO:0070971 | endoplasmic reticulum exit site(GO:0070971) |
| 0.0 | 0.4 | GO:0045275 | mitochondrial respiratory chain complex III(GO:0005750) respiratory chain complex III(GO:0045275) |
| 0.0 | 0.4 | GO:0097225 | sperm midpiece(GO:0097225) |
| 0.0 | 0.9 | GO:0032809 | neuronal cell body membrane(GO:0032809) cell body membrane(GO:0044298) |
| 0.0 | 0.9 | GO:0030673 | axolemma(GO:0030673) |
| 0.0 | 1.2 | GO:0045095 | keratin filament(GO:0045095) |
| 0.0 | 0.8 | GO:0008180 | COP9 signalosome(GO:0008180) |
| 0.0 | 1.1 | GO:0070469 | respiratory chain(GO:0070469) |
| 0.0 | 0.9 | GO:0005834 | heterotrimeric G-protein complex(GO:0005834) |
| 0.0 | 0.4 | GO:0030057 | desmosome(GO:0030057) |
Gene overrepresentation in molecular function category:
| Log-likelihood per target | Total log-likelihood | Term | Description |
|---|---|---|---|
| 2.7 | 10.8 | GO:0033265 | choline binding(GO:0033265) |
| 1.9 | 5.6 | GO:1904854 | proteasome core complex binding(GO:1904854) |
| 1.0 | 3.1 | GO:0003973 | (S)-2-hydroxy-acid oxidase activity(GO:0003973) very-long-chain-(S)-2-hydroxy-acid oxidase activity(GO:0052852) long-chain-(S)-2-hydroxy-long-chain-acid oxidase activity(GO:0052853) medium-chain-(S)-2-hydroxy-acid oxidase activity(GO:0052854) |
| 0.9 | 3.4 | GO:0008431 | vitamin E binding(GO:0008431) |
| 0.8 | 6.7 | GO:0001849 | complement component C1q binding(GO:0001849) |
| 0.5 | 4.7 | GO:0032190 | acrosin binding(GO:0032190) |
| 0.3 | 10.8 | GO:0004859 | phospholipase inhibitor activity(GO:0004859) |
| 0.2 | 0.9 | GO:0016495 | C-X3-C chemokine receptor activity(GO:0016495) |
| 0.2 | 0.8 | GO:0004031 | aldehyde oxidase activity(GO:0004031) |
| 0.2 | 1.8 | GO:0004571 | mannosyl-oligosaccharide 1,2-alpha-mannosidase activity(GO:0004571) |
| 0.2 | 8.7 | GO:0015020 | glucuronosyltransferase activity(GO:0015020) |
| 0.2 | 4.5 | GO:0034185 | apolipoprotein binding(GO:0034185) |
| 0.2 | 2.4 | GO:0034485 | phosphatidylinositol-3,4,5-trisphosphate 5-phosphatase activity(GO:0034485) |
| 0.1 | 3.0 | GO:0031489 | myosin V binding(GO:0031489) |
| 0.1 | 3.0 | GO:0071949 | FAD binding(GO:0071949) |
| 0.1 | 0.9 | GO:0008046 | axon guidance receptor activity(GO:0008046) |
| 0.1 | 4.0 | GO:0008009 | chemokine activity(GO:0008009) |
| 0.1 | 1.2 | GO:0005436 | sodium:phosphate symporter activity(GO:0005436) |
| 0.0 | 0.9 | GO:0031821 | G-protein coupled serotonin receptor binding(GO:0031821) |
| 0.0 | 0.7 | GO:0001135 | transcription factor activity, RNA polymerase II transcription factor recruiting(GO:0001135) |
| 0.0 | 1.7 | GO:0017081 | chloride channel regulator activity(GO:0017081) |
| 0.0 | 0.4 | GO:0030021 | extracellular matrix structural constituent conferring compression resistance(GO:0030021) structural constituent of tooth enamel(GO:0030345) |
| 0.0 | 18.4 | GO:0030674 | protein binding, bridging(GO:0030674) |
| 0.0 | 0.4 | GO:0008121 | ubiquinol-cytochrome-c reductase activity(GO:0008121) oxidoreductase activity, acting on diphenols and related substances as donors, cytochrome as acceptor(GO:0016681) |
| 0.0 | 0.4 | GO:0004126 | cytidine deaminase activity(GO:0004126) |
| 0.0 | 3.2 | GO:0005548 | phospholipid transporter activity(GO:0005548) |
| 0.0 | 1.1 | GO:0005086 | ARF guanyl-nucleotide exchange factor activity(GO:0005086) |
| 0.0 | 0.1 | GO:0005502 | 11-cis retinal binding(GO:0005502) |
| 0.0 | 1.1 | GO:0050136 | NADH dehydrogenase (ubiquinone) activity(GO:0008137) NADH dehydrogenase (quinone) activity(GO:0050136) |
| 0.0 | 0.3 | GO:0010314 | phosphatidylinositol-5-phosphate binding(GO:0010314) |
| 0.0 | 0.2 | GO:0008970 | phosphatidylcholine 1-acylhydrolase activity(GO:0008970) |
| 0.0 | 0.4 | GO:0004129 | cytochrome-c oxidase activity(GO:0004129) heme-copper terminal oxidase activity(GO:0015002) oxidoreductase activity, acting on a heme group of donors, oxygen as acceptor(GO:0016676) |
| 0.0 | 0.1 | GO:0015350 | methotrexate transporter activity(GO:0015350) |
Gene overrepresentation in curated gene sets: canonical pathways category:
| Log-likelihood per target | Total log-likelihood | Term | Description |
|---|---|---|---|
| 0.3 | 18.4 | PID INTEGRIN2 PATHWAY | Beta2 integrin cell surface interactions |
| 0.1 | 2.4 | PID EPHA2 FWD PATHWAY | EPHA2 forward signaling |
| 0.1 | 7.5 | PID AMB2 NEUTROPHILS PATHWAY | amb2 Integrin signaling |
| 0.1 | 9.1 | PID IL6 7 PATHWAY | IL6-mediated signaling events |
| 0.1 | 4.7 | ST INTERLEUKIN 4 PATHWAY | Interleukin 4 (IL-4) Pathway |
| 0.1 | 10.2 | PID AVB3 INTEGRIN PATHWAY | Integrins in angiogenesis |
| 0.1 | 3.4 | ST PHOSPHOINOSITIDE 3 KINASE PATHWAY | PI3K Pathway |
| 0.0 | 0.9 | PID S1P S1P4 PATHWAY | S1P4 pathway |
| 0.0 | 1.8 | PID CASPASE PATHWAY | Caspase cascade in apoptosis |
Gene overrepresentation in curated gene sets: REACTOME pathways category:
| Log-likelihood per target | Total log-likelihood | Term | Description |
|---|---|---|---|
| 1.1 | 20.9 | REACTOME COMMON PATHWAY | Genes involved in Common Pathway |
| 0.8 | 10.8 | REACTOME CREATION OF C4 AND C2 ACTIVATORS | Genes involved in Creation of C4 and C2 activators |
| 0.3 | 8.7 | REACTOME GLUCURONIDATION | Genes involved in Glucuronidation |
| 0.2 | 5.8 | REACTOME CHYLOMICRON MEDIATED LIPID TRANSPORT | Genes involved in Chylomicron-mediated lipid transport |
| 0.2 | 5.6 | REACTOME REGULATION OF INSULIN LIKE GROWTH FACTOR IGF ACTIVITY BY INSULIN LIKE GROWTH FACTOR BINDING PROTEINS IGFBPS | Genes involved in Regulation of Insulin-like Growth Factor (IGF) Activity by Insulin-like Growth Factor Binding Proteins (IGFBPs) |
| 0.1 | 6.7 | REACTOME AMYLOIDS | Genes involved in Amyloids |
| 0.1 | 4.0 | REACTOME COMPLEMENT CASCADE | Genes involved in Complement cascade |
| 0.1 | 1.8 | REACTOME CALNEXIN CALRETICULIN CYCLE | Genes involved in Calnexin/calreticulin cycle |
| 0.1 | 1.9 | REACTOME LIPOPROTEIN METABOLISM | Genes involved in Lipoprotein metabolism |
| 0.0 | 1.8 | REACTOME CASPASE MEDIATED CLEAVAGE OF CYTOSKELETAL PROTEINS | Genes involved in Caspase-mediated cleavage of cytoskeletal proteins |
| 0.0 | 0.8 | REACTOME ETHANOL OXIDATION | Genes involved in Ethanol oxidation |
| 0.0 | 2.4 | REACTOME SYNTHESIS OF PIPS AT THE PLASMA MEMBRANE | Genes involved in Synthesis of PIPs at the plasma membrane |
| 0.0 | 0.6 | REACTOME OTHER SEMAPHORIN INTERACTIONS | Genes involved in Other semaphorin interactions |
| 0.0 | 0.9 | REACTOME G PROTEIN ACTIVATION | Genes involved in G-protein activation |
| 0.0 | 0.9 | REACTOME CHEMOKINE RECEPTORS BIND CHEMOKINES | Genes involved in Chemokine receptors bind chemokines |
| 0.0 | 0.9 | REACTOME SIGNALING BY ROBO RECEPTOR | Genes involved in Signaling by Robo receptor |