Project
Illumina Body Map 2 (GSE30611)
Navigation
Downloads
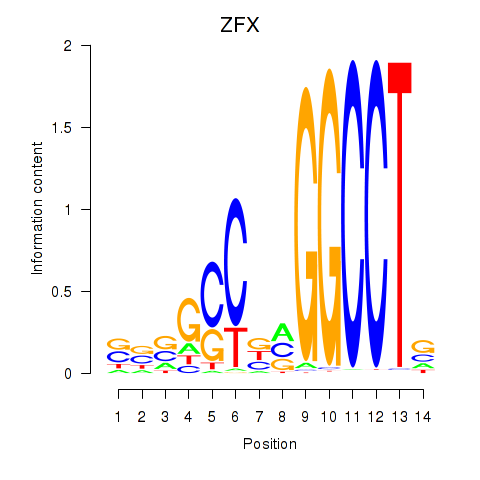
Results for ZFX
Z-value: 2.72
Motif logo
Transcription factors associated with ZFX
| Gene Symbol | Gene ID | Gene Info |
|---|---|---|
|
ZFX
|
ENSG00000005889.16 | zinc finger protein X-linked |
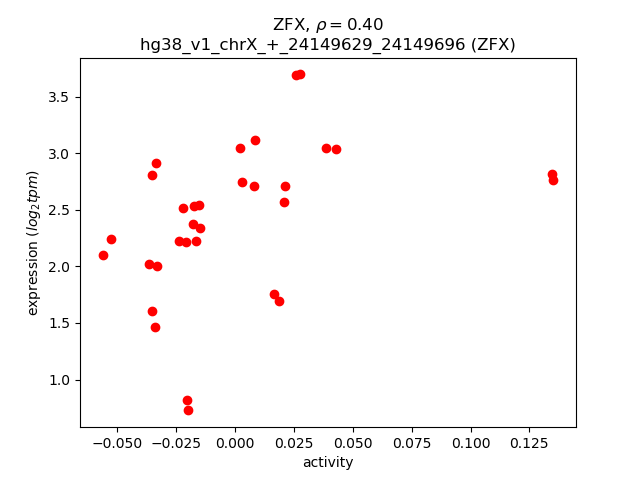
Activity-expression correlation:
| Gene | Promoter | Pearson corr. coef. | P-value | Plot |
|---|---|---|---|---|
| ZFX | hg38_v1_chrX_+_24149629_24149696 | 0.40 | 2.2e-02 | Click! |
Activity profile of ZFX motif
Sorted Z-values of ZFX motif
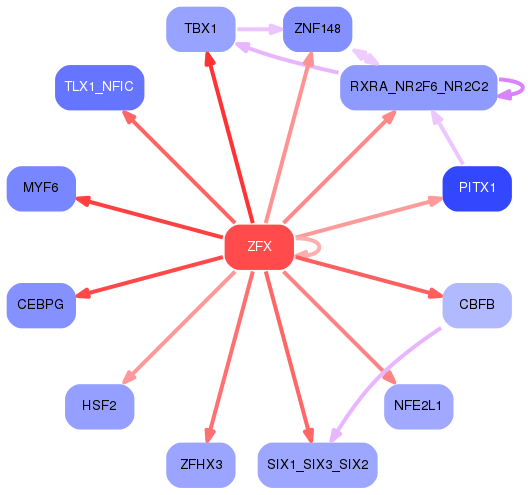
Network of associatons between targets according to the STRING database.

First level regulatory network of ZFX
Gene Ontology Analysis
Gene overrepresentation in biological process category:
| Log-likelihood per target | Total log-likelihood | Term | Description |
|---|---|---|---|
| 2.6 | 7.7 | GO:1903515 | calcium ion transport from cytosol to endoplasmic reticulum(GO:1903515) |
| 1.9 | 5.6 | GO:0070446 | cellular response to caloric restriction(GO:0061433) negative regulation of oligodendrocyte progenitor proliferation(GO:0070446) |
| 1.7 | 13.5 | GO:0060988 | lipid tube assembly(GO:0060988) |
| 1.6 | 4.7 | GO:2001037 | tongue muscle cell differentiation(GO:0035981) positive regulation of skeletal muscle fiber differentiation(GO:1902811) regulation of tongue muscle cell differentiation(GO:2001035) positive regulation of tongue muscle cell differentiation(GO:2001037) |
| 1.4 | 12.5 | GO:0031444 | slow-twitch skeletal muscle fiber contraction(GO:0031444) |
| 1.1 | 3.3 | GO:0007402 | ganglion mother cell fate determination(GO:0007402) |
| 1.1 | 3.2 | GO:2000729 | positive regulation of mesenchymal cell proliferation involved in ureter development(GO:2000729) |
| 0.9 | 7.5 | GO:0043353 | enucleate erythrocyte differentiation(GO:0043353) |
| 0.9 | 2.7 | GO:0075732 | viral penetration into host nucleus(GO:0075732) multi-organism nuclear import(GO:1902594) |
| 0.9 | 2.7 | GO:1903778 | protein localization to vacuolar membrane(GO:1903778) |
| 0.9 | 2.6 | GO:0001579 | medium-chain fatty acid transport(GO:0001579) |
| 0.8 | 2.5 | GO:0003420 | regulation of growth plate cartilage chondrocyte proliferation(GO:0003420) histone H3-R2 methylation(GO:0034970) |
| 0.8 | 0.8 | GO:0001732 | formation of cytoplasmic translation initiation complex(GO:0001732) |
| 0.8 | 2.3 | GO:1903774 | positive regulation of viral budding via host ESCRT complex(GO:1903774) |
| 0.8 | 0.8 | GO:0021747 | cochlear nucleus development(GO:0021747) |
| 0.7 | 2.2 | GO:0046901 | tetrahydrofolylpolyglutamate biosynthetic process(GO:0046901) |
| 0.7 | 2.2 | GO:0001543 | ovarian follicle rupture(GO:0001543) |
| 0.7 | 2.2 | GO:2000374 | regulation of oxygen metabolic process(GO:2000374) |
| 0.7 | 3.7 | GO:1903070 | negative regulation of ER-associated ubiquitin-dependent protein catabolic process(GO:1903070) |
| 0.7 | 2.9 | GO:1901143 | insulin catabolic process(GO:1901143) |
| 0.7 | 2.1 | GO:0045994 | positive regulation of translational initiation by iron(GO:0045994) |
| 0.7 | 2.1 | GO:0099557 | trans-synaptic signaling by trans-synaptic complex, modulating synaptic transmission(GO:0099557) |
| 0.7 | 3.5 | GO:0072365 | regulation of cellular ketone metabolic process by negative regulation of transcription from RNA polymerase II promoter(GO:0072365) |
| 0.7 | 2.7 | GO:0061461 | nitric oxide production involved in inflammatory response(GO:0002537) lysine import(GO:0034226) L-arginine import(GO:0043091) L-lysine import(GO:0061461) arginine import(GO:0090467) L-arginine transmembrane transport(GO:1903400) L-lysine import into cell(GO:1903410) |
| 0.7 | 2.0 | GO:0016340 | calcium-dependent cell-matrix adhesion(GO:0016340) |
| 0.7 | 2.0 | GO:0100057 | regulation of phenotypic switching by transcription from RNA polymerase II promoter(GO:0100057) regulation of hydrogen sulfide biosynthetic process(GO:1904826) positive regulation of hydrogen sulfide biosynthetic process(GO:1904828) |
| 0.6 | 5.0 | GO:0090625 | mRNA cleavage involved in gene silencing by siRNA(GO:0090625) |
| 0.6 | 4.4 | GO:0010636 | positive regulation of mitochondrial fusion(GO:0010636) |
| 0.6 | 10.5 | GO:0006600 | creatine metabolic process(GO:0006600) |
| 0.6 | 2.4 | GO:0061015 | snRNA import into nucleus(GO:0061015) |
| 0.6 | 2.9 | GO:1902499 | positive regulation of protein autoubiquitination(GO:1902499) |
| 0.6 | 3.4 | GO:0044861 | protein transport into plasma membrane raft(GO:0044861) |
| 0.6 | 2.8 | GO:1904059 | regulation of locomotor rhythm(GO:1904059) |
| 0.6 | 2.2 | GO:0072287 | metanephric distal tubule morphogenesis(GO:0072287) |
| 0.5 | 1.6 | GO:1903383 | neuron intrinsic apoptotic signaling pathway in response to hydrogen peroxide(GO:0036482) positive regulation of mitochondrial electron transport, NADH to ubiquinone(GO:1902958) regulation of hydrogen peroxide-induced neuron intrinsic apoptotic signaling pathway(GO:1903383) negative regulation of hydrogen peroxide-induced neuron intrinsic apoptotic signaling pathway(GO:1903384) |
| 0.5 | 1.6 | GO:0042040 | molybdenum incorporation into molybdenum-molybdopterin complex(GO:0018315) metal incorporation into metallo-molybdopterin complex(GO:0042040) glycine receptor clustering(GO:0072579) |
| 0.5 | 1.6 | GO:0030505 | inorganic diphosphate transport(GO:0030505) |
| 0.5 | 2.7 | GO:1903028 | positive regulation of opsonization(GO:1903028) |
| 0.5 | 1.6 | GO:0006533 | fumarate metabolic process(GO:0006106) aspartate biosynthetic process(GO:0006532) aspartate catabolic process(GO:0006533) |
| 0.5 | 1.6 | GO:0031393 | negative regulation of prostaglandin biosynthetic process(GO:0031393) histone H3-K9 deacetylation(GO:1990619) |
| 0.5 | 1.6 | GO:0014707 | branchiomeric skeletal muscle development(GO:0014707) |
| 0.5 | 1.6 | GO:0048859 | formation of anatomical boundary(GO:0048859) |
| 0.5 | 3.1 | GO:0093001 | glycolysis from storage polysaccharide through glucose-1-phosphate(GO:0093001) |
| 0.5 | 4.6 | GO:0010265 | SCF complex assembly(GO:0010265) |
| 0.5 | 1.5 | GO:0046338 | phosphatidylethanolamine catabolic process(GO:0046338) |
| 0.5 | 2.5 | GO:0016480 | negative regulation of transcription from RNA polymerase III promoter(GO:0016480) |
| 0.5 | 3.0 | GO:0072752 | cellular response to rapamycin(GO:0072752) |
| 0.5 | 1.5 | GO:0003365 | establishment of cell polarity involved in ameboidal cell migration(GO:0003365) |
| 0.5 | 7.3 | GO:0071316 | cellular response to nicotine(GO:0071316) |
| 0.5 | 6.1 | GO:0000414 | regulation of histone H3-K36 methylation(GO:0000414) |
| 0.5 | 2.3 | GO:0030806 | negative regulation of cyclic nucleotide catabolic process(GO:0030806) negative regulation of cAMP catabolic process(GO:0030821) |
| 0.5 | 1.8 | GO:1902775 | mitochondrial large ribosomal subunit assembly(GO:1902775) |
| 0.5 | 1.4 | GO:0046416 | D-amino acid metabolic process(GO:0046416) |
| 0.4 | 2.7 | GO:0019075 | virus maturation(GO:0019075) |
| 0.4 | 2.2 | GO:0042853 | alanine metabolic process(GO:0006522) alanine catabolic process(GO:0006524) pyruvate family amino acid metabolic process(GO:0009078) pyruvate family amino acid catabolic process(GO:0009080) L-alanine metabolic process(GO:0042851) L-alanine catabolic process(GO:0042853) |
| 0.4 | 2.2 | GO:0019542 | acetate biosynthetic process(GO:0019413) acetyl-CoA biosynthetic process from acetate(GO:0019427) propionate biosynthetic process(GO:0019542) |
| 0.4 | 1.3 | GO:1904395 | positive regulation of skeletal muscle acetylcholine-gated channel clustering(GO:1904395) |
| 0.4 | 2.6 | GO:0006127 | glycerophosphate shuttle(GO:0006127) |
| 0.4 | 2.9 | GO:0071896 | protein localization to adherens junction(GO:0071896) |
| 0.4 | 1.2 | GO:0097010 | eukaryotic translation initiation factor 4F complex assembly(GO:0097010) |
| 0.4 | 1.2 | GO:0097676 | histone H3-K36 dimethylation(GO:0097676) |
| 0.4 | 3.3 | GO:2000767 | positive regulation of cytoplasmic translation(GO:2000767) |
| 0.4 | 1.6 | GO:1903182 | regulation of SUMO transferase activity(GO:1903182) positive regulation of SUMO transferase activity(GO:1903755) |
| 0.4 | 1.2 | GO:1903033 | regulation of microtubule plus-end binding(GO:1903031) positive regulation of microtubule plus-end binding(GO:1903033) |
| 0.4 | 1.2 | GO:0010730 | negative regulation of hydrogen peroxide biosynthetic process(GO:0010730) |
| 0.4 | 4.8 | GO:0002191 | cap-dependent translational initiation(GO:0002191) |
| 0.4 | 7.6 | GO:0006975 | DNA damage induced protein phosphorylation(GO:0006975) |
| 0.4 | 0.8 | GO:0048320 | axial mesoderm formation(GO:0048320) |
| 0.4 | 1.2 | GO:0019417 | sulfur oxidation(GO:0019417) |
| 0.4 | 1.5 | GO:0006781 | succinyl-CoA pathway(GO:0006781) |
| 0.4 | 3.1 | GO:0086047 | membrane depolarization during Purkinje myocyte cell action potential(GO:0086047) |
| 0.4 | 5.0 | GO:1901407 | regulation of phosphorylation of RNA polymerase II C-terminal domain(GO:1901407) |
| 0.4 | 1.1 | GO:0072720 | response to dithiothreitol(GO:0072720) |
| 0.4 | 4.8 | GO:0048743 | positive regulation of skeletal muscle fiber development(GO:0048743) |
| 0.4 | 2.2 | GO:2000983 | regulation of ATP citrate synthase activity(GO:2000983) negative regulation of ATP citrate synthase activity(GO:2000984) |
| 0.4 | 3.3 | GO:0075044 | autophagy of host cells involved in interaction with symbiont(GO:0075044) autophagy involved in symbiotic interaction(GO:0075071) |
| 0.4 | 2.5 | GO:0031291 | Ran protein signal transduction(GO:0031291) |
| 0.4 | 1.8 | GO:0016240 | autophagosome docking(GO:0016240) |
| 0.4 | 8.9 | GO:0031441 | negative regulation of mRNA 3'-end processing(GO:0031441) |
| 0.4 | 1.8 | GO:2000653 | regulation of genetic imprinting(GO:2000653) |
| 0.4 | 4.2 | GO:0036481 | intrinsic apoptotic signaling pathway in response to hydrogen peroxide(GO:0036481) |
| 0.3 | 3.8 | GO:0035897 | proteolysis in other organism(GO:0035897) |
| 0.3 | 24.9 | GO:0003009 | skeletal muscle contraction(GO:0003009) |
| 0.3 | 1.4 | GO:2000753 | regulation of phospholipid scramblase activity(GO:1900161) positive regulation of phospholipid scramblase activity(GO:1900163) regulation of glucosylceramide catabolic process(GO:2000752) positive regulation of glucosylceramide catabolic process(GO:2000753) regulation of sphingomyelin catabolic process(GO:2000754) positive regulation of sphingomyelin catabolic process(GO:2000755) |
| 0.3 | 2.1 | GO:2001034 | positive regulation of double-strand break repair via nonhomologous end joining(GO:2001034) |
| 0.3 | 1.0 | GO:0035407 | histone H3-T11 phosphorylation(GO:0035407) |
| 0.3 | 1.7 | GO:0017196 | N-terminal peptidyl-methionine acetylation(GO:0017196) |
| 0.3 | 1.0 | GO:0003050 | regulation of systemic arterial blood pressure by atrial natriuretic peptide(GO:0003050) |
| 0.3 | 2.3 | GO:0075525 | viral translational termination-reinitiation(GO:0075525) |
| 0.3 | 3.0 | GO:0071279 | cellular response to cobalt ion(GO:0071279) |
| 0.3 | 3.3 | GO:1901341 | activation of store-operated calcium channel activity(GO:0032237) positive regulation of store-operated calcium channel activity(GO:1901341) |
| 0.3 | 0.3 | GO:1990051 | activation of protein kinase C activity(GO:1990051) |
| 0.3 | 1.9 | GO:0006432 | phenylalanyl-tRNA aminoacylation(GO:0006432) |
| 0.3 | 3.4 | GO:0036072 | intramembranous ossification(GO:0001957) direct ossification(GO:0036072) |
| 0.3 | 0.9 | GO:0044805 | late nucleophagy(GO:0044805) |
| 0.3 | 2.7 | GO:0022027 | interkinetic nuclear migration(GO:0022027) |
| 0.3 | 2.7 | GO:2000323 | negative regulation of glucocorticoid receptor signaling pathway(GO:2000323) |
| 0.3 | 0.9 | GO:0060151 | peroxisome localization(GO:0060151) microtubule-based peroxisome localization(GO:0060152) |
| 0.3 | 1.8 | GO:0033615 | mitochondrial proton-transporting ATP synthase complex assembly(GO:0033615) |
| 0.3 | 0.9 | GO:0000472 | endonucleolytic cleavage to generate mature 5'-end of SSU-rRNA from (SSU-rRNA, 5.8S rRNA, LSU-rRNA)(GO:0000472) rRNA 5'-end processing(GO:0000967) ncRNA 5'-end processing(GO:0034471) |
| 0.3 | 2.6 | GO:0046726 | positive regulation by virus of viral protein levels in host cell(GO:0046726) |
| 0.3 | 0.6 | GO:0035617 | stress granule disassembly(GO:0035617) |
| 0.3 | 0.9 | GO:0060957 | endocardial cell fate commitment(GO:0060957) endocardial cushion cell fate commitment(GO:0061445) |
| 0.3 | 1.5 | GO:0090402 | oncogene-induced cell senescence(GO:0090402) |
| 0.3 | 3.7 | GO:0036444 | calcium ion transmembrane import into mitochondrion(GO:0036444) |
| 0.3 | 1.7 | GO:0051138 | positive regulation of NK T cell differentiation(GO:0051138) |
| 0.3 | 2.0 | GO:0019086 | late viral transcription(GO:0019086) |
| 0.3 | 0.8 | GO:0099403 | negative regulation of maintenance of sister chromatid cohesion(GO:0034092) negative regulation of maintenance of mitotic sister chromatid cohesion(GO:0034183) maintenance of mitotic sister chromatid cohesion, telomeric(GO:0099403) mitotic sister chromatid cohesion, telomeric(GO:0099404) regulation of maintenance of mitotic sister chromatid cohesion, telomeric(GO:1904907) negative regulation of maintenance of mitotic sister chromatid cohesion, telomeric(GO:1904908) |
| 0.3 | 0.8 | GO:1903526 | negative regulation of membrane tubulation(GO:1903526) |
| 0.3 | 4.9 | GO:0006264 | mitochondrial DNA replication(GO:0006264) |
| 0.3 | 6.5 | GO:0051044 | positive regulation of membrane protein ectodomain proteolysis(GO:0051044) |
| 0.3 | 0.5 | GO:0034165 | positive regulation of toll-like receptor 9 signaling pathway(GO:0034165) |
| 0.3 | 2.6 | GO:2000195 | negative regulation of female gonad development(GO:2000195) |
| 0.3 | 1.5 | GO:0030951 | establishment or maintenance of microtubule cytoskeleton polarity(GO:0030951) |
| 0.3 | 4.3 | GO:0034497 | protein localization to pre-autophagosomal structure(GO:0034497) |
| 0.3 | 0.8 | GO:1900365 | positive regulation of mRNA polyadenylation(GO:1900365) |
| 0.2 | 10.4 | GO:2000810 | regulation of bicellular tight junction assembly(GO:2000810) |
| 0.2 | 1.7 | GO:0036018 | cellular response to erythropoietin(GO:0036018) |
| 0.2 | 0.7 | GO:0032877 | positive regulation of DNA endoreduplication(GO:0032877) |
| 0.2 | 0.7 | GO:0018002 | N-terminal peptidyl-serine acetylation(GO:0017198) N-terminal peptidyl-glutamic acid acetylation(GO:0018002) peptidyl-serine acetylation(GO:0030920) |
| 0.2 | 1.5 | GO:2000825 | positive regulation of androgen receptor activity(GO:2000825) |
| 0.2 | 1.0 | GO:0036496 | regulation of translational initiation by eIF2 alpha dephosphorylation(GO:0036496) |
| 0.2 | 2.7 | GO:0010748 | regulation of plasma membrane long-chain fatty acid transport(GO:0010746) negative regulation of plasma membrane long-chain fatty acid transport(GO:0010748) |
| 0.2 | 2.2 | GO:0021759 | globus pallidus development(GO:0021759) |
| 0.2 | 1.7 | GO:0060356 | leucine import(GO:0060356) |
| 0.2 | 1.4 | GO:0035900 | response to isolation stress(GO:0035900) |
| 0.2 | 0.7 | GO:0010904 | regulation of UDP-glucose catabolic process(GO:0010904) negative regulation of UDP-glucose catabolic process(GO:0010905) regulation of glycogen synthase activity, transferring glucose-1-phosphate(GO:1904226) negative regulation of glycogen synthase activity, transferring glucose-1-phosphate(GO:1904227) |
| 0.2 | 3.0 | GO:0061179 | negative regulation of insulin secretion involved in cellular response to glucose stimulus(GO:0061179) |
| 0.2 | 3.2 | GO:0048875 | chemical homeostasis within a tissue(GO:0048875) |
| 0.2 | 0.7 | GO:1903006 | flavin adenine dinucleotide metabolic process(GO:0072387) regulation of protein K63-linked deubiquitination(GO:1903004) positive regulation of protein K63-linked deubiquitination(GO:1903006) |
| 0.2 | 0.9 | GO:0085032 | modulation of signal transduction in other organism(GO:0044501) modulation by symbiont of host signal transduction pathway(GO:0052027) modulation of signal transduction in other organism involved in symbiotic interaction(GO:0052250) modulation by symbiont of host I-kappaB kinase/NF-kappaB cascade(GO:0085032) |
| 0.2 | 2.5 | GO:0006686 | sphingomyelin biosynthetic process(GO:0006686) |
| 0.2 | 1.3 | GO:1900126 | negative regulation of hyaluronan biosynthetic process(GO:1900126) |
| 0.2 | 0.7 | GO:0061010 | gall bladder development(GO:0061010) |
| 0.2 | 2.2 | GO:0018401 | peptidyl-proline hydroxylation to 4-hydroxy-L-proline(GO:0018401) |
| 0.2 | 1.5 | GO:0015801 | aromatic amino acid transport(GO:0015801) |
| 0.2 | 0.4 | GO:0006083 | acetate metabolic process(GO:0006083) |
| 0.2 | 1.1 | GO:0035574 | histone H4-K20 demethylation(GO:0035574) |
| 0.2 | 0.9 | GO:1904049 | negative regulation of spontaneous neurotransmitter secretion(GO:1904049) |
| 0.2 | 1.1 | GO:0071596 | ubiquitin-dependent protein catabolic process via the N-end rule pathway(GO:0071596) |
| 0.2 | 0.6 | GO:0000718 | nucleotide-excision repair, DNA damage removal(GO:0000718) DNA excision(GO:0044349) DNA 3' dephosphorylation(GO:0098503) DNA 3' dephosphorylation involved in DNA repair(GO:0098504) polynucleotide 3' dephosphorylation(GO:0098506) |
| 0.2 | 0.8 | GO:0044313 | protein K6-linked deubiquitination(GO:0044313) |
| 0.2 | 0.2 | GO:0071650 | negative regulation of chemokine (C-C motif) ligand 5 production(GO:0071650) |
| 0.2 | 3.1 | GO:1902916 | positive regulation of protein polyubiquitination(GO:1902916) |
| 0.2 | 2.6 | GO:0044804 | nucleophagy(GO:0044804) |
| 0.2 | 0.4 | GO:0007518 | myoblast fate determination(GO:0007518) |
| 0.2 | 1.2 | GO:1902045 | negative regulation of Fas signaling pathway(GO:1902045) |
| 0.2 | 1.0 | GO:2000176 | regulation of pro-T cell differentiation(GO:2000174) positive regulation of pro-T cell differentiation(GO:2000176) |
| 0.2 | 4.4 | GO:1904262 | negative regulation of TORC1 signaling(GO:1904262) |
| 0.2 | 1.2 | GO:0070562 | regulation of vitamin D receptor signaling pathway(GO:0070562) |
| 0.2 | 0.6 | GO:1990164 | histone H2A phosphorylation(GO:1990164) |
| 0.2 | 3.3 | GO:0039536 | negative regulation of RIG-I signaling pathway(GO:0039536) |
| 0.2 | 2.9 | GO:0014010 | Schwann cell proliferation(GO:0014010) |
| 0.2 | 3.1 | GO:0021817 | nucleokinesis involved in cell motility in cerebral cortex radial glia guided migration(GO:0021817) nuclear migration along microtubule(GO:0030473) |
| 0.2 | 1.2 | GO:1990785 | response to water-immersion restraint stress(GO:1990785) |
| 0.2 | 2.1 | GO:0034723 | DNA replication-dependent nucleosome assembly(GO:0006335) DNA replication-dependent nucleosome organization(GO:0034723) |
| 0.2 | 0.4 | GO:0090170 | regulation of Golgi inheritance(GO:0090170) |
| 0.2 | 3.4 | GO:0098719 | sodium ion import across plasma membrane(GO:0098719) sodium ion import into cell(GO:1990118) |
| 0.2 | 1.9 | GO:1904378 | maintenance of unfolded protein(GO:0036506) maintenance of unfolded protein involved in ERAD pathway(GO:1904378) |
| 0.2 | 1.3 | GO:0060373 | regulation of ventricular cardiac muscle cell membrane depolarization(GO:0060373) |
| 0.2 | 3.0 | GO:1901387 | positive regulation of voltage-gated calcium channel activity(GO:1901387) |
| 0.2 | 4.3 | GO:0045116 | protein neddylation(GO:0045116) |
| 0.2 | 3.1 | GO:0014733 | regulation of skeletal muscle adaptation(GO:0014733) |
| 0.2 | 1.1 | GO:0035803 | egg coat formation(GO:0035803) |
| 0.2 | 1.8 | GO:0034773 | histone H4-K20 trimethylation(GO:0034773) |
| 0.2 | 3.6 | GO:0039529 | RIG-I signaling pathway(GO:0039529) |
| 0.2 | 0.9 | GO:1903630 | regulation of aminoacyl-tRNA ligase activity(GO:1903630) |
| 0.2 | 0.9 | GO:0061056 | sclerotome development(GO:0061056) |
| 0.2 | 0.7 | GO:0002326 | B cell lineage commitment(GO:0002326) |
| 0.2 | 4.7 | GO:0043518 | negative regulation of DNA damage response, signal transduction by p53 class mediator(GO:0043518) |
| 0.2 | 0.5 | GO:1903538 | meiotic spindle elongation(GO:0051232) meiotic cell cycle process involved in oocyte maturation(GO:1903537) regulation of meiotic cell cycle process involved in oocyte maturation(GO:1903538) |
| 0.2 | 0.8 | GO:0075509 | receptor-mediated endocytosis of virus by host cell(GO:0019065) endocytosis involved in viral entry into host cell(GO:0075509) |
| 0.2 | 2.2 | GO:0014877 | response to muscle inactivity involved in regulation of muscle adaptation(GO:0014877) response to denervation involved in regulation of muscle adaptation(GO:0014894) |
| 0.2 | 3.5 | GO:0007084 | mitotic nuclear envelope reassembly(GO:0007084) |
| 0.2 | 1.3 | GO:0035093 | spermatogenesis, exchange of chromosomal proteins(GO:0035093) |
| 0.2 | 0.7 | GO:0090071 | negative regulation of ribosome biogenesis(GO:0090071) |
| 0.2 | 23.9 | GO:0010972 | negative regulation of G2/M transition of mitotic cell cycle(GO:0010972) |
| 0.2 | 3.4 | GO:0010510 | regulation of acetyl-CoA biosynthetic process from pyruvate(GO:0010510) |
| 0.2 | 2.7 | GO:0000338 | protein deneddylation(GO:0000338) |
| 0.2 | 1.1 | GO:0051532 | regulation of NFAT protein import into nucleus(GO:0051532) negative regulation of NFAT protein import into nucleus(GO:0051534) |
| 0.2 | 1.1 | GO:0051533 | positive regulation of NFAT protein import into nucleus(GO:0051533) |
| 0.2 | 0.5 | GO:0006463 | steroid hormone receptor complex assembly(GO:0006463) |
| 0.2 | 0.5 | GO:1901628 | excitatory chemical synaptic transmission(GO:0098976) positive regulation of postsynaptic membrane organization(GO:1901628) regulation of AMPA glutamate receptor clustering(GO:1904717) positive regulation of AMPA glutamate receptor clustering(GO:1904719) |
| 0.2 | 7.6 | GO:0006783 | heme biosynthetic process(GO:0006783) |
| 0.2 | 0.3 | GO:0071409 | cellular response to cycloheximide(GO:0071409) |
| 0.2 | 0.5 | GO:0031508 | pericentric heterochromatin assembly(GO:0031508) |
| 0.2 | 2.4 | GO:0035970 | peptidyl-threonine dephosphorylation(GO:0035970) |
| 0.2 | 0.9 | GO:0072656 | maintenance of protein location in mitochondrion(GO:0072656) |
| 0.2 | 0.5 | GO:0097536 | thymus epithelium morphogenesis(GO:0097536) |
| 0.1 | 4.2 | GO:0038180 | nerve growth factor signaling pathway(GO:0038180) |
| 0.1 | 3.0 | GO:0014029 | neural crest formation(GO:0014029) |
| 0.1 | 0.4 | GO:0060279 | positive regulation of ovulation(GO:0060279) |
| 0.1 | 0.4 | GO:1904328 | regulation of myofibroblast contraction(GO:1904328) myofibroblast contraction(GO:1990764) |
| 0.1 | 0.3 | GO:0032056 | positive regulation of translation in response to stress(GO:0032056) positive regulation of translation in response to endoplasmic reticulum stress(GO:0036493) |
| 0.1 | 0.6 | GO:0019521 | aldonic acid metabolic process(GO:0019520) D-gluconate metabolic process(GO:0019521) |
| 0.1 | 5.7 | GO:0005980 | glycogen catabolic process(GO:0005980) |
| 0.1 | 0.6 | GO:1904751 | positive regulation of protein localization to nucleolus(GO:1904751) |
| 0.1 | 1.0 | GO:2000467 | positive regulation of glycogen (starch) synthase activity(GO:2000467) |
| 0.1 | 5.8 | GO:0032007 | negative regulation of TOR signaling(GO:0032007) |
| 0.1 | 2.5 | GO:0060155 | platelet dense granule organization(GO:0060155) |
| 0.1 | 2.9 | GO:0033169 | histone H3-K9 demethylation(GO:0033169) |
| 0.1 | 1.6 | GO:2000628 | regulation of miRNA metabolic process(GO:2000628) |
| 0.1 | 0.4 | GO:0035880 | embryonic nail plate morphogenesis(GO:0035880) |
| 0.1 | 1.3 | GO:1903147 | negative regulation of mitophagy(GO:1903147) |
| 0.1 | 1.1 | GO:0030263 | apoptotic chromosome condensation(GO:0030263) |
| 0.1 | 1.9 | GO:0006610 | ribosomal protein import into nucleus(GO:0006610) |
| 0.1 | 6.6 | GO:0034198 | cellular response to amino acid starvation(GO:0034198) |
| 0.1 | 1.3 | GO:0030422 | production of siRNA involved in RNA interference(GO:0030422) |
| 0.1 | 0.4 | GO:0072361 | regulation of glycolytic process by regulation of transcription from RNA polymerase II promoter(GO:0072361) |
| 0.1 | 2.3 | GO:0098909 | regulation of cardiac muscle cell action potential involved in regulation of contraction(GO:0098909) |
| 0.1 | 1.8 | GO:0001672 | regulation of chromatin assembly or disassembly(GO:0001672) |
| 0.1 | 3.0 | GO:0016075 | rRNA catabolic process(GO:0016075) |
| 0.1 | 1.2 | GO:0071440 | regulation of histone H3-K14 acetylation(GO:0071440) |
| 0.1 | 0.9 | GO:0034088 | maintenance of sister chromatid cohesion(GO:0034086) maintenance of mitotic sister chromatid cohesion(GO:0034088) |
| 0.1 | 0.9 | GO:0044789 | modulation by host of viral release from host cell(GO:0044789) positive regulation by host of viral release from host cell(GO:0044791) |
| 0.1 | 1.4 | GO:0033211 | adiponectin-activated signaling pathway(GO:0033211) |
| 0.1 | 0.8 | GO:0009048 | dosage compensation(GO:0007549) dosage compensation by inactivation of X chromosome(GO:0009048) |
| 0.1 | 0.5 | GO:0035022 | positive regulation of Rac protein signal transduction(GO:0035022) |
| 0.1 | 1.4 | GO:0020027 | hemoglobin metabolic process(GO:0020027) |
| 0.1 | 1.3 | GO:0038110 | interleukin-2-mediated signaling pathway(GO:0038110) |
| 0.1 | 0.5 | GO:0009305 | protein biotinylation(GO:0009305) histone biotinylation(GO:0071110) |
| 0.1 | 0.5 | GO:0050823 | peptide stabilization(GO:0050822) peptide antigen stabilization(GO:0050823) |
| 0.1 | 1.9 | GO:0006851 | mitochondrial calcium ion transport(GO:0006851) |
| 0.1 | 2.6 | GO:0007289 | spermatid nucleus differentiation(GO:0007289) |
| 0.1 | 0.2 | GO:0048865 | stem cell fate commitment(GO:0048865) |
| 0.1 | 0.9 | GO:0051415 | interphase microtubule nucleation by interphase microtubule organizing center(GO:0051415) microtubule nucleation by microtubule organizing center(GO:0051418) |
| 0.1 | 2.5 | GO:0045948 | positive regulation of translational initiation(GO:0045948) |
| 0.1 | 0.6 | GO:1901594 | detection of temperature stimulus involved in thermoception(GO:0050960) positive regulation of gastric acid secretion(GO:0060454) response to capsazepine(GO:1901594) |
| 0.1 | 3.4 | GO:0006607 | NLS-bearing protein import into nucleus(GO:0006607) |
| 0.1 | 0.6 | GO:0090245 | axis elongation involved in somitogenesis(GO:0090245) |
| 0.1 | 0.3 | GO:0007174 | epidermal growth factor catabolic process(GO:0007174) |
| 0.1 | 1.7 | GO:0070934 | CRD-mediated mRNA stabilization(GO:0070934) |
| 0.1 | 0.8 | GO:0072383 | plus-end-directed vesicle transport along microtubule(GO:0072383) |
| 0.1 | 0.3 | GO:0071962 | mitotic sister chromatid cohesion, centromeric(GO:0071962) |
| 0.1 | 0.3 | GO:1990697 | protein depalmitoleylation(GO:1990697) |
| 0.1 | 5.2 | GO:0048255 | mRNA stabilization(GO:0048255) |
| 0.1 | 0.8 | GO:1900827 | maintenance of protein location in membrane(GO:0072658) maintenance of protein location in plasma membrane(GO:0072660) positive regulation of membrane depolarization during cardiac muscle cell action potential(GO:1900827) |
| 0.1 | 1.2 | GO:0060346 | bone trabecula formation(GO:0060346) |
| 0.1 | 0.8 | GO:0006384 | transcription initiation from RNA polymerase III promoter(GO:0006384) |
| 0.1 | 0.4 | GO:0006642 | triglyceride mobilization(GO:0006642) |
| 0.1 | 2.5 | GO:0048642 | negative regulation of skeletal muscle tissue development(GO:0048642) |
| 0.1 | 0.7 | GO:0042536 | negative regulation of tumor necrosis factor biosynthetic process(GO:0042536) |
| 0.1 | 1.4 | GO:0035331 | negative regulation of hippo signaling(GO:0035331) |
| 0.1 | 1.0 | GO:0038031 | non-canonical Wnt signaling pathway via JNK cascade(GO:0038031) |
| 0.1 | 1.1 | GO:0071963 | establishment or maintenance of cell polarity regulating cell shape(GO:0071963) |
| 0.1 | 1.0 | GO:0006621 | protein retention in ER lumen(GO:0006621) |
| 0.1 | 1.9 | GO:1904380 | endoplasmic reticulum mannose trimming(GO:1904380) |
| 0.1 | 1.8 | GO:0021694 | cerebellar Purkinje cell layer formation(GO:0021694) cerebellar Purkinje cell differentiation(GO:0021702) |
| 0.1 | 0.2 | GO:0036518 | chemorepulsion of dopaminergic neuron axon(GO:0036518) |
| 0.1 | 0.5 | GO:0032687 | negative regulation of interferon-alpha production(GO:0032687) |
| 0.1 | 1.2 | GO:0045475 | locomotor rhythm(GO:0045475) |
| 0.1 | 0.5 | GO:1902268 | negative regulation of polyamine transmembrane transport(GO:1902268) |
| 0.1 | 2.6 | GO:0043162 | ubiquitin-dependent protein catabolic process via the multivesicular body sorting pathway(GO:0043162) |
| 0.1 | 1.6 | GO:0071243 | cellular response to arsenic-containing substance(GO:0071243) |
| 0.1 | 0.4 | GO:0042357 | thiamine diphosphate metabolic process(GO:0042357) |
| 0.1 | 1.1 | GO:0090343 | positive regulation of cell aging(GO:0090343) positive regulation of cellular senescence(GO:2000774) |
| 0.1 | 0.3 | GO:0010793 | regulation of mRNA export from nucleus(GO:0010793) |
| 0.1 | 0.4 | GO:2000638 | regulation of SREBP signaling pathway(GO:2000638) negative regulation of SREBP signaling pathway(GO:2000639) |
| 0.1 | 1.3 | GO:0031468 | nuclear envelope reassembly(GO:0031468) |
| 0.1 | 0.9 | GO:0042791 | 5S class rRNA transcription from RNA polymerase III type 1 promoter(GO:0042791) tRNA transcription from RNA polymerase III promoter(GO:0042797) |
| 0.1 | 0.3 | GO:0034770 | histone H4-K20 methylation(GO:0034770) |
| 0.1 | 0.5 | GO:0071557 | histone H3-K27 demethylation(GO:0071557) |
| 0.1 | 0.3 | GO:0051754 | meiotic sister chromatid cohesion, centromeric(GO:0051754) |
| 0.1 | 1.6 | GO:1902659 | regulation of glucose mediated signaling pathway(GO:1902659) |
| 0.1 | 1.2 | GO:0019227 | neuronal action potential propagation(GO:0019227) action potential propagation(GO:0098870) |
| 0.1 | 0.6 | GO:0030886 | negative regulation of myeloid dendritic cell activation(GO:0030886) |
| 0.1 | 0.4 | GO:0015770 | disaccharide transport(GO:0015766) sucrose transport(GO:0015770) oligosaccharide transport(GO:0015772) |
| 0.1 | 0.4 | GO:0044856 | plasma membrane raft distribution(GO:0044855) plasma membrane raft localization(GO:0044856) plasma membrane raft polarization(GO:0044858) regulation of plasma membrane raft polarization(GO:1903906) |
| 0.1 | 1.1 | GO:0006189 | 'de novo' IMP biosynthetic process(GO:0006189) |
| 0.1 | 1.0 | GO:0006013 | mannose metabolic process(GO:0006013) |
| 0.1 | 0.3 | GO:0042256 | mature ribosome assembly(GO:0042256) |
| 0.1 | 3.0 | GO:0034243 | regulation of transcription elongation from RNA polymerase II promoter(GO:0034243) |
| 0.1 | 2.0 | GO:0061303 | cornea development in camera-type eye(GO:0061303) |
| 0.1 | 0.3 | GO:1904732 | regulation of electron carrier activity(GO:1904732) |
| 0.1 | 0.4 | GO:0035106 | operant conditioning(GO:0035106) |
| 0.1 | 1.6 | GO:1904424 | regulation of GTP binding(GO:1904424) |
| 0.1 | 0.3 | GO:0032804 | negative regulation of low-density lipoprotein particle receptor catabolic process(GO:0032804) |
| 0.1 | 7.5 | GO:0032981 | NADH dehydrogenase complex assembly(GO:0010257) mitochondrial respiratory chain complex I assembly(GO:0032981) mitochondrial respiratory chain complex I biogenesis(GO:0097031) |
| 0.1 | 0.8 | GO:0000715 | nucleotide-excision repair, DNA damage recognition(GO:0000715) |
| 0.1 | 1.1 | GO:0032688 | negative regulation of interferon-beta production(GO:0032688) |
| 0.1 | 0.2 | GO:2000342 | negative regulation of chemokine (C-X-C motif) ligand 2 production(GO:2000342) |
| 0.1 | 0.7 | GO:0035246 | peptidyl-arginine N-methylation(GO:0035246) |
| 0.1 | 0.6 | GO:0035616 | histone H2B conserved C-terminal lysine deubiquitination(GO:0035616) |
| 0.1 | 1.8 | GO:0071688 | striated muscle myosin thick filament assembly(GO:0071688) |
| 0.1 | 0.3 | GO:0003186 | tricuspid valve morphogenesis(GO:0003186) |
| 0.1 | 3.9 | GO:0016574 | histone ubiquitination(GO:0016574) |
| 0.1 | 3.1 | GO:0002026 | regulation of the force of heart contraction(GO:0002026) |
| 0.1 | 3.3 | GO:0044458 | motile cilium assembly(GO:0044458) |
| 0.1 | 0.3 | GO:0051490 | negative regulation of filopodium assembly(GO:0051490) |
| 0.1 | 0.3 | GO:0045647 | negative regulation of erythrocyte differentiation(GO:0045647) |
| 0.1 | 2.2 | GO:0060351 | cartilage development involved in endochondral bone morphogenesis(GO:0060351) |
| 0.1 | 0.2 | GO:0090035 | regulation of chaperone-mediated protein complex assembly(GO:0090034) positive regulation of chaperone-mediated protein complex assembly(GO:0090035) |
| 0.1 | 0.8 | GO:0097500 | receptor localization to nonmotile primary cilium(GO:0097500) |
| 0.1 | 0.4 | GO:0015878 | biotin transport(GO:0015878) pantothenate transmembrane transport(GO:0015887) |
| 0.1 | 0.7 | GO:0070537 | histone H2A K63-linked deubiquitination(GO:0070537) |
| 0.1 | 0.2 | GO:1901383 | negative regulation of chorionic trophoblast cell proliferation(GO:1901383) |
| 0.1 | 1.2 | GO:0007094 | mitotic spindle assembly checkpoint(GO:0007094) |
| 0.1 | 3.6 | GO:0003016 | respiratory system process(GO:0003016) |
| 0.1 | 0.1 | GO:0010040 | response to iron(II) ion(GO:0010040) |
| 0.1 | 0.4 | GO:1902164 | regulation of DNA damage response, signal transduction by p53 class mediator resulting in transcription of p21 class mediator(GO:1902162) positive regulation of DNA damage response, signal transduction by p53 class mediator resulting in transcription of p21 class mediator(GO:1902164) |
| 0.1 | 0.5 | GO:0000183 | chromatin silencing at rDNA(GO:0000183) |
| 0.1 | 0.7 | GO:2000786 | positive regulation of autophagosome assembly(GO:2000786) |
| 0.1 | 0.2 | GO:0070407 | oxidation-dependent protein catabolic process(GO:0070407) |
| 0.1 | 2.8 | GO:0061014 | positive regulation of mRNA catabolic process(GO:0061014) |
| 0.1 | 0.2 | GO:0051836 | translocation of peptides or proteins into host(GO:0042000) translocation of peptides or proteins into host cell cytoplasm(GO:0044053) translocation of molecules into host(GO:0044417) translocation of peptides or proteins into other organism involved in symbiotic interaction(GO:0051808) translocation of molecules into other organism involved in symbiotic interaction(GO:0051836) |
| 0.1 | 0.3 | GO:1903432 | regulation of TORC1 signaling(GO:1903432) |
| 0.1 | 0.5 | GO:0071475 | cellular hyperosmotic salinity response(GO:0071475) double-strand break repair via classical nonhomologous end joining(GO:0097680) |
| 0.1 | 0.4 | GO:0000379 | tRNA-type intron splice site recognition and cleavage(GO:0000379) |
| 0.1 | 0.6 | GO:1902231 | positive regulation of intrinsic apoptotic signaling pathway in response to DNA damage(GO:1902231) |
| 0.1 | 0.3 | GO:0060922 | cardiac septum cell differentiation(GO:0003292) atrioventricular node cell differentiation(GO:0060922) atrioventricular node cell development(GO:0060928) |
| 0.1 | 0.5 | GO:1990035 | calcium ion import across plasma membrane(GO:0098703) calcium ion import into cell(GO:1990035) |
| 0.1 | 0.5 | GO:0030242 | pexophagy(GO:0030242) |
| 0.1 | 2.4 | GO:0097421 | liver regeneration(GO:0097421) |
| 0.1 | 0.2 | GO:2000110 | negative regulation of macrophage apoptotic process(GO:2000110) |
| 0.1 | 4.3 | GO:0030490 | maturation of SSU-rRNA(GO:0030490) |
| 0.1 | 1.7 | GO:0031572 | G2 DNA damage checkpoint(GO:0031572) |
| 0.1 | 0.6 | GO:1904354 | negative regulation of telomere capping(GO:1904354) |
| 0.1 | 0.9 | GO:0043117 | positive regulation of vascular permeability(GO:0043117) |
| 0.1 | 0.7 | GO:0030656 | regulation of vitamin metabolic process(GO:0030656) |
| 0.1 | 0.3 | GO:0061484 | hematopoietic stem cell homeostasis(GO:0061484) |
| 0.1 | 2.0 | GO:0046337 | phosphatidylethanolamine metabolic process(GO:0046337) |
| 0.1 | 0.4 | GO:0006177 | GMP biosynthetic process(GO:0006177) |
| 0.1 | 0.6 | GO:0061740 | protein targeting to lysosome involved in chaperone-mediated autophagy(GO:0061740) protein targeting to vacuole involved in autophagy(GO:0071211) |
| 0.1 | 1.0 | GO:0090110 | cargo loading into COPII-coated vesicle(GO:0090110) |
| 0.1 | 0.3 | GO:0006287 | base-excision repair, gap-filling(GO:0006287) |
| 0.1 | 0.4 | GO:0021993 | initiation of neural tube closure(GO:0021993) |
| 0.1 | 2.0 | GO:2000369 | regulation of clathrin-mediated endocytosis(GO:2000369) |
| 0.1 | 0.8 | GO:0032790 | ribosome disassembly(GO:0032790) |
| 0.1 | 0.8 | GO:0000463 | maturation of LSU-rRNA from tricistronic rRNA transcript (SSU-rRNA, 5.8S rRNA, LSU-rRNA)(GO:0000463) |
| 0.1 | 0.4 | GO:0090241 | negative regulation of histone H4 acetylation(GO:0090241) |
| 0.1 | 0.2 | GO:0045875 | negative regulation of sister chromatid cohesion(GO:0045875) |
| 0.1 | 7.4 | GO:0006890 | retrograde vesicle-mediated transport, Golgi to ER(GO:0006890) |
| 0.1 | 1.1 | GO:2000643 | positive regulation of early endosome to late endosome transport(GO:2000643) |
| 0.1 | 1.0 | GO:0045717 | negative regulation of fatty acid biosynthetic process(GO:0045717) |
| 0.1 | 0.5 | GO:1903608 | protein localization to cytoplasmic stress granule(GO:1903608) |
| 0.1 | 1.4 | GO:0016254 | preassembly of GPI anchor in ER membrane(GO:0016254) |
| 0.1 | 1.0 | GO:0098780 | response to mitochondrial depolarisation(GO:0098780) |
| 0.1 | 1.0 | GO:0051014 | actin filament severing(GO:0051014) |
| 0.1 | 0.2 | GO:0072396 | response to cell cycle checkpoint signaling(GO:0072396) response to DNA integrity checkpoint signaling(GO:0072402) response to DNA damage checkpoint signaling(GO:0072423) |
| 0.1 | 0.5 | GO:0051315 | attachment of mitotic spindle microtubules to kinetochore(GO:0051315) |
| 0.1 | 2.6 | GO:0000154 | rRNA modification(GO:0000154) |
| 0.1 | 0.5 | GO:0007296 | vitellogenesis(GO:0007296) |
| 0.1 | 2.2 | GO:0045070 | positive regulation of viral genome replication(GO:0045070) |
| 0.1 | 0.8 | GO:0010960 | magnesium ion homeostasis(GO:0010960) |
| 0.1 | 0.5 | GO:0043589 | skin morphogenesis(GO:0043589) |
| 0.1 | 2.9 | GO:0061418 | regulation of transcription from RNA polymerase II promoter in response to hypoxia(GO:0061418) |
| 0.1 | 0.2 | GO:1900625 | regulation of monocyte aggregation(GO:1900623) positive regulation of monocyte aggregation(GO:1900625) |
| 0.1 | 0.4 | GO:0006049 | UDP-N-acetylglucosamine catabolic process(GO:0006049) |
| 0.1 | 0.2 | GO:0061511 | centriole elongation(GO:0061511) |
| 0.1 | 0.5 | GO:0032483 | regulation of Rab protein signal transduction(GO:0032483) |
| 0.1 | 1.5 | GO:1904778 | regulation of protein localization to cell cortex(GO:1904776) positive regulation of protein localization to cell cortex(GO:1904778) |
| 0.1 | 0.1 | GO:0034729 | histone H3-K79 methylation(GO:0034729) |
| 0.1 | 0.2 | GO:0048561 | establishment of organ orientation(GO:0048561) |
| 0.1 | 0.3 | GO:0043985 | histone H4-R3 methylation(GO:0043985) |
| 0.1 | 0.7 | GO:0000212 | meiotic spindle organization(GO:0000212) |
| 0.1 | 1.8 | GO:0045736 | negative regulation of cyclin-dependent protein serine/threonine kinase activity(GO:0045736) |
| 0.1 | 1.3 | GO:0030262 | apoptotic nuclear changes(GO:0030262) |
| 0.1 | 3.3 | GO:0043171 | peptide catabolic process(GO:0043171) |
| 0.1 | 0.5 | GO:0017183 | peptidyl-diphthamide metabolic process(GO:0017182) peptidyl-diphthamide biosynthetic process from peptidyl-histidine(GO:0017183) |
| 0.1 | 0.9 | GO:0051608 | histamine transport(GO:0051608) |
| 0.1 | 0.5 | GO:0010724 | regulation of definitive erythrocyte differentiation(GO:0010724) |
| 0.1 | 0.7 | GO:0018095 | protein polyglutamylation(GO:0018095) |
| 0.1 | 0.6 | GO:0006268 | DNA unwinding involved in DNA replication(GO:0006268) |
| 0.1 | 0.6 | GO:0018026 | peptidyl-lysine monomethylation(GO:0018026) |
| 0.1 | 1.1 | GO:0016180 | snRNA processing(GO:0016180) |
| 0.1 | 4.4 | GO:0051438 | regulation of ubiquitin-protein transferase activity(GO:0051438) |
| 0.1 | 1.9 | GO:0009081 | branched-chain amino acid metabolic process(GO:0009081) |
| 0.1 | 0.5 | GO:0030213 | hyaluronan biosynthetic process(GO:0030213) |
| 0.0 | 2.4 | GO:0050435 | beta-amyloid metabolic process(GO:0050435) |
| 0.0 | 1.3 | GO:0016024 | CDP-diacylglycerol biosynthetic process(GO:0016024) |
| 0.0 | 0.2 | GO:0036414 | protein citrullination(GO:0018101) histone citrullination(GO:0036414) |
| 0.0 | 0.6 | GO:0060372 | regulation of atrial cardiac muscle cell membrane repolarization(GO:0060372) |
| 0.0 | 1.2 | GO:0006123 | mitochondrial electron transport, cytochrome c to oxygen(GO:0006123) |
| 0.0 | 1.2 | GO:0006750 | glutathione biosynthetic process(GO:0006750) |
| 0.0 | 0.7 | GO:0031998 | regulation of fatty acid beta-oxidation(GO:0031998) |
| 0.0 | 1.7 | GO:0046339 | diacylglycerol metabolic process(GO:0046339) |
| 0.0 | 0.7 | GO:0045835 | negative regulation of meiotic nuclear division(GO:0045835) |
| 0.0 | 0.1 | GO:0033386 | geranylgeranyl diphosphate metabolic process(GO:0033385) geranylgeranyl diphosphate biosynthetic process(GO:0033386) |
| 0.0 | 2.3 | GO:0018146 | keratan sulfate biosynthetic process(GO:0018146) |
| 0.0 | 0.5 | GO:0000389 | mRNA 3'-splice site recognition(GO:0000389) |
| 0.0 | 2.4 | GO:1903861 | positive regulation of dendrite extension(GO:1903861) |
| 0.0 | 0.4 | GO:0071493 | cellular response to UV-B(GO:0071493) |
| 0.0 | 2.7 | GO:0010501 | RNA secondary structure unwinding(GO:0010501) |
| 0.0 | 1.5 | GO:0014887 | muscle hypertrophy in response to stress(GO:0003299) cardiac muscle adaptation(GO:0014887) cardiac muscle hypertrophy in response to stress(GO:0014898) |
| 0.0 | 0.4 | GO:0036093 | male germ cell proliferation(GO:0002176) germ cell proliferation(GO:0036093) |
| 0.0 | 1.3 | GO:0050434 | positive regulation of viral transcription(GO:0050434) |
| 0.0 | 0.5 | GO:0048227 | plasma membrane to endosome transport(GO:0048227) |
| 0.0 | 0.2 | GO:0060371 | regulation of atrial cardiac muscle cell membrane depolarization(GO:0060371) |
| 0.0 | 0.3 | GO:1900264 | regulation of DNA-directed DNA polymerase activity(GO:1900262) positive regulation of DNA-directed DNA polymerase activity(GO:1900264) |
| 0.0 | 0.5 | GO:0010032 | meiotic chromosome condensation(GO:0010032) |
| 0.0 | 0.1 | GO:0060981 | cell migration involved in coronary angiogenesis(GO:0060981) metanephric glomerular mesangial cell proliferation involved in metanephros development(GO:0072262) |
| 0.0 | 0.5 | GO:1901529 | positive regulation of anion channel activity(GO:1901529) |
| 0.0 | 0.6 | GO:0045945 | positive regulation of transcription from RNA polymerase III promoter(GO:0045945) |
| 0.0 | 0.5 | GO:0097396 | response to interleukin-17(GO:0097396) cellular response to interleukin-17(GO:0097398) |
| 0.0 | 1.2 | GO:0010667 | negative regulation of cardiac muscle cell apoptotic process(GO:0010667) |
| 0.0 | 0.1 | GO:0033140 | negative regulation of peptidyl-serine phosphorylation of STAT protein(GO:0033140) |
| 0.0 | 0.8 | GO:0018023 | peptidyl-lysine trimethylation(GO:0018023) |
| 0.0 | 0.6 | GO:0060159 | regulation of dopamine receptor signaling pathway(GO:0060159) |
| 0.0 | 0.4 | GO:0032927 | positive regulation of activin receptor signaling pathway(GO:0032927) |
| 0.0 | 0.2 | GO:0061635 | regulation of protein complex stability(GO:0061635) |
| 0.0 | 0.2 | GO:0021942 | radial glia guided migration of Purkinje cell(GO:0021942) |
| 0.0 | 0.0 | GO:1900222 | negative regulation of beta-amyloid clearance(GO:1900222) |
| 0.0 | 0.7 | GO:0045839 | negative regulation of mitotic nuclear division(GO:0045839) |
| 0.0 | 0.1 | GO:0021526 | medial motor column neuron differentiation(GO:0021526) |
| 0.0 | 0.4 | GO:0042997 | negative regulation of Golgi to plasma membrane protein transport(GO:0042997) |
| 0.0 | 0.6 | GO:0090494 | dopamine uptake involved in synaptic transmission(GO:0051583) catecholamine uptake involved in synaptic transmission(GO:0051934) catecholamine uptake(GO:0090493) dopamine uptake(GO:0090494) |
| 0.0 | 1.7 | GO:0050873 | brown fat cell differentiation(GO:0050873) |
| 0.0 | 0.2 | GO:0033387 | putrescine biosynthetic process from ornithine(GO:0033387) |
| 0.0 | 0.4 | GO:0009256 | 10-formyltetrahydrofolate metabolic process(GO:0009256) |
| 0.0 | 0.0 | GO:0039534 | regulation of MDA-5 signaling pathway(GO:0039533) negative regulation of MDA-5 signaling pathway(GO:0039534) |
| 0.0 | 0.2 | GO:0030576 | Cajal body organization(GO:0030576) |
| 0.0 | 0.1 | GO:0051987 | positive regulation of attachment of spindle microtubules to kinetochore(GO:0051987) |
| 0.0 | 0.2 | GO:0030961 | peptidyl-arginine hydroxylation(GO:0030961) |
| 0.0 | 0.8 | GO:0006614 | SRP-dependent cotranslational protein targeting to membrane(GO:0006614) |
| 0.0 | 2.4 | GO:1902475 | L-alpha-amino acid transmembrane transport(GO:1902475) |
| 0.0 | 0.2 | GO:0002357 | defense response to tumor cell(GO:0002357) |
| 0.0 | 0.3 | GO:1900383 | regulation of synaptic plasticity by receptor localization to synapse(GO:1900383) |
| 0.0 | 0.2 | GO:1902460 | regulation of mesenchymal stem cell proliferation(GO:1902460) positive regulation of mesenchymal stem cell proliferation(GO:1902462) |
| 0.0 | 0.9 | GO:0031498 | chromatin disassembly(GO:0031498) |
| 0.0 | 1.5 | GO:0048536 | spleen development(GO:0048536) |
| 0.0 | 1.5 | GO:0051568 | histone H3-K4 methylation(GO:0051568) |
| 0.0 | 0.1 | GO:0015785 | UDP-galactose transport(GO:0015785) UDP-galactose transmembrane transport(GO:0072334) |
| 0.0 | 1.7 | GO:0048009 | insulin-like growth factor receptor signaling pathway(GO:0048009) |
| 0.0 | 0.2 | GO:0097052 | L-kynurenine metabolic process(GO:0097052) |
| 0.0 | 0.6 | GO:0040032 | post-embryonic body morphogenesis(GO:0040032) |
| 0.0 | 0.3 | GO:0043970 | histone H3-K9 acetylation(GO:0043970) |
| 0.0 | 0.1 | GO:0070318 | positive regulation of G0 to G1 transition(GO:0070318) |
| 0.0 | 0.1 | GO:0002032 | desensitization of G-protein coupled receptor protein signaling pathway by arrestin(GO:0002032) |
| 0.0 | 1.6 | GO:0006383 | transcription from RNA polymerase III promoter(GO:0006383) |
| 0.0 | 0.7 | GO:0046069 | cGMP catabolic process(GO:0046069) |
| 0.0 | 0.5 | GO:0042276 | error-prone translesion synthesis(GO:0042276) |
| 0.0 | 0.3 | GO:0000710 | meiotic mismatch repair(GO:0000710) |
| 0.0 | 0.8 | GO:1901642 | nucleoside transmembrane transport(GO:1901642) |
| 0.0 | 0.7 | GO:0006482 | protein demethylation(GO:0006482) protein dealkylation(GO:0008214) |
| 0.0 | 0.6 | GO:0030150 | protein import into mitochondrial matrix(GO:0030150) |
| 0.0 | 1.7 | GO:0097576 | vacuole fusion(GO:0097576) |
| 0.0 | 0.4 | GO:1904948 | midbrain dopaminergic neuron differentiation(GO:1904948) |
| 0.0 | 0.2 | GO:0036260 | 7-methylguanosine RNA capping(GO:0009452) RNA capping(GO:0036260) |
| 0.0 | 1.8 | GO:0007077 | mitotic nuclear envelope disassembly(GO:0007077) |
| 0.0 | 0.7 | GO:0007021 | tubulin complex assembly(GO:0007021) |
| 0.0 | 0.2 | GO:0018343 | protein farnesylation(GO:0018343) |
| 0.0 | 1.1 | GO:0046676 | negative regulation of insulin secretion(GO:0046676) |
| 0.0 | 1.2 | GO:0003301 | physiological muscle hypertrophy(GO:0003298) physiological cardiac muscle hypertrophy(GO:0003301) cell growth involved in cardiac muscle cell development(GO:0061049) |
| 0.0 | 0.4 | GO:0006283 | transcription-coupled nucleotide-excision repair(GO:0006283) |
| 0.0 | 0.5 | GO:1904353 | regulation of telomere capping(GO:1904353) positive regulation of telomere capping(GO:1904355) |
| 0.0 | 0.6 | GO:0051290 | protein heterotetramerization(GO:0051290) |
| 0.0 | 1.2 | GO:0015988 | energy coupled proton transmembrane transport, against electrochemical gradient(GO:0015988) ATP hydrolysis coupled proton transport(GO:0015991) |
| 0.0 | 0.7 | GO:0071294 | cellular response to zinc ion(GO:0071294) |
| 0.0 | 0.2 | GO:0048702 | embryonic neurocranium morphogenesis(GO:0048702) |
| 0.0 | 1.0 | GO:0016239 | positive regulation of macroautophagy(GO:0016239) |
| 0.0 | 0.3 | GO:0031017 | exocrine pancreas development(GO:0031017) |
| 0.0 | 0.4 | GO:0032957 | inositol trisphosphate metabolic process(GO:0032957) |
| 0.0 | 0.4 | GO:0008090 | retrograde axonal transport(GO:0008090) |
| 0.0 | 0.5 | GO:0071361 | cellular response to ethanol(GO:0071361) |
| 0.0 | 0.5 | GO:0070586 | cell-cell adhesion involved in gastrulation(GO:0070586) |
| 0.0 | 0.3 | GO:0050884 | neuromuscular process controlling posture(GO:0050884) |
| 0.0 | 0.4 | GO:0006388 | tRNA splicing, via endonucleolytic cleavage and ligation(GO:0006388) |
| 0.0 | 1.4 | GO:0000186 | activation of MAPKK activity(GO:0000186) |
| 0.0 | 0.3 | GO:0032786 | positive regulation of DNA-templated transcription, elongation(GO:0032786) |
| 0.0 | 0.1 | GO:0006701 | progesterone biosynthetic process(GO:0006701) |
| 0.0 | 0.2 | GO:0035871 | protein K11-linked deubiquitination(GO:0035871) |
| 0.0 | 2.5 | GO:0032233 | positive regulation of actin filament bundle assembly(GO:0032233) |
| 0.0 | 2.5 | GO:0045773 | positive regulation of axon extension(GO:0045773) |
| 0.0 | 0.3 | GO:0015760 | hexose phosphate transport(GO:0015712) glucose-6-phosphate transport(GO:0015760) |
| 0.0 | 0.6 | GO:0051560 | mitochondrial calcium ion homeostasis(GO:0051560) |
| 0.0 | 1.2 | GO:0006298 | mismatch repair(GO:0006298) |
| 0.0 | 0.5 | GO:0034384 | high-density lipoprotein particle clearance(GO:0034384) |
| 0.0 | 3.1 | GO:0006334 | nucleosome assembly(GO:0006334) |
| 0.0 | 0.7 | GO:0006622 | protein targeting to lysosome(GO:0006622) |
| 0.0 | 0.4 | GO:0016559 | peroxisome fission(GO:0016559) |
| 0.0 | 0.2 | GO:0097647 | calcitonin family receptor signaling pathway(GO:0097646) amylin receptor signaling pathway(GO:0097647) |
| 0.0 | 0.5 | GO:0045723 | positive regulation of fatty acid biosynthetic process(GO:0045723) |
| 0.0 | 0.3 | GO:0008343 | adult feeding behavior(GO:0008343) |
| 0.0 | 0.4 | GO:0042255 | ribosome assembly(GO:0042255) |
| 0.0 | 0.5 | GO:1902894 | negative regulation of pri-miRNA transcription from RNA polymerase II promoter(GO:1902894) |
| 0.0 | 0.7 | GO:0007172 | signal complex assembly(GO:0007172) |
| 0.0 | 0.5 | GO:0060539 | diaphragm development(GO:0060539) |
| 0.0 | 0.3 | GO:2000601 | positive regulation of Arp2/3 complex-mediated actin nucleation(GO:2000601) |
| 0.0 | 2.0 | GO:0032465 | regulation of cytokinesis(GO:0032465) |
| 0.0 | 0.4 | GO:0097264 | self proteolysis(GO:0097264) |
| 0.0 | 0.1 | GO:0036451 | cap mRNA methylation(GO:0036451) |
| 0.0 | 0.3 | GO:0006568 | tryptophan metabolic process(GO:0006568) |
| 0.0 | 0.8 | GO:2000144 | positive regulation of DNA-templated transcription, initiation(GO:2000144) |
| 0.0 | 0.6 | GO:0002091 | negative regulation of receptor internalization(GO:0002091) |
| 0.0 | 0.8 | GO:0043968 | histone H2A acetylation(GO:0043968) |
| 0.0 | 0.1 | GO:0031054 | pre-miRNA processing(GO:0031054) |
| 0.0 | 0.1 | GO:1903659 | regulation of complement-dependent cytotoxicity(GO:1903659) |
| 0.0 | 0.6 | GO:0006505 | GPI anchor metabolic process(GO:0006505) GPI anchor biosynthetic process(GO:0006506) |
| 0.0 | 0.2 | GO:0030638 | polyketide metabolic process(GO:0030638) daunorubicin metabolic process(GO:0044597) doxorubicin metabolic process(GO:0044598) |
| 0.0 | 0.8 | GO:0030049 | muscle filament sliding(GO:0030049) actin-myosin filament sliding(GO:0033275) |
| 0.0 | 0.3 | GO:0097034 | mitochondrial respiratory chain complex IV biogenesis(GO:0097034) |
| 0.0 | 0.1 | GO:0035627 | ceramide transport(GO:0035627) |
| 0.0 | 2.5 | GO:0070126 | mitochondrial translational elongation(GO:0070125) mitochondrial translational termination(GO:0070126) |
| 0.0 | 0.5 | GO:0007016 | cytoskeletal anchoring at plasma membrane(GO:0007016) |
| 0.0 | 1.0 | GO:0072661 | protein targeting to plasma membrane(GO:0072661) |
| 0.0 | 1.6 | GO:0006368 | transcription elongation from RNA polymerase II promoter(GO:0006368) |
| 0.0 | 0.3 | GO:0038003 | opioid receptor signaling pathway(GO:0038003) |
| 0.0 | 0.4 | GO:0006513 | protein monoubiquitination(GO:0006513) |
| 0.0 | 0.1 | GO:1990108 | protein linear deubiquitination(GO:1990108) |
| 0.0 | 0.4 | GO:0010569 | regulation of double-strand break repair via homologous recombination(GO:0010569) |
| 0.0 | 0.4 | GO:0033599 | regulation of mammary gland epithelial cell proliferation(GO:0033599) |
| 0.0 | 0.1 | GO:0097021 | lymphocyte migration into lymphoid organs(GO:0097021) |
| 0.0 | 0.0 | GO:0009436 | glyoxylate catabolic process(GO:0009436) |
| 0.0 | 0.1 | GO:0045062 | extrathymic T cell selection(GO:0045062) |
| 0.0 | 0.3 | GO:0071157 | negative regulation of cell cycle arrest(GO:0071157) |
| 0.0 | 0.2 | GO:0070560 | protein secretion by platelet(GO:0070560) |
| 0.0 | 0.3 | GO:0090140 | regulation of mitochondrial fission(GO:0090140) |
| 0.0 | 0.8 | GO:0016601 | Rac protein signal transduction(GO:0016601) |
| 0.0 | 0.1 | GO:0070358 | actin polymerization-dependent cell motility(GO:0070358) |
| 0.0 | 0.5 | GO:0001964 | startle response(GO:0001964) |
| 0.0 | 0.2 | GO:0032074 | negative regulation of nuclease activity(GO:0032074) |
| 0.0 | 0.1 | GO:0006659 | phosphatidylserine biosynthetic process(GO:0006659) |
| 0.0 | 0.0 | GO:0002874 | regulation of chronic inflammatory response to antigenic stimulus(GO:0002874) positive regulation of chronic inflammatory response to antigenic stimulus(GO:0002876) |
| 0.0 | 1.0 | GO:0042273 | ribosomal large subunit biogenesis(GO:0042273) |
| 0.0 | 0.4 | GO:0072189 | ureter development(GO:0072189) |
| 0.0 | 0.7 | GO:0045214 | sarcomere organization(GO:0045214) |
| 0.0 | 0.4 | GO:0031648 | protein destabilization(GO:0031648) |
| 0.0 | 0.1 | GO:0019255 | glucose 1-phosphate metabolic process(GO:0019255) |
| 0.0 | 0.2 | GO:0007196 | adenylate cyclase-inhibiting G-protein coupled glutamate receptor signaling pathway(GO:0007196) |
| 0.0 | 0.5 | GO:0000387 | spliceosomal snRNP assembly(GO:0000387) |
| 0.0 | 0.2 | GO:0010571 | positive regulation of nuclear cell cycle DNA replication(GO:0010571) |
| 0.0 | 1.1 | GO:0046580 | negative regulation of Ras protein signal transduction(GO:0046580) |
| 0.0 | 0.4 | GO:0006465 | signal peptide processing(GO:0006465) |
| 0.0 | 0.1 | GO:0001833 | inner cell mass cell proliferation(GO:0001833) |
| 0.0 | 0.1 | GO:0002084 | protein depalmitoylation(GO:0002084) |
| 0.0 | 0.2 | GO:0046838 | phosphorylated carbohydrate dephosphorylation(GO:0046838) inositol phosphate dephosphorylation(GO:0046855) |
| 0.0 | 0.0 | GO:0061181 | regulation of chondrocyte development(GO:0061181) |
| 0.0 | 0.3 | GO:0048026 | positive regulation of mRNA splicing, via spliceosome(GO:0048026) |
| 0.0 | 2.3 | GO:0042254 | ribosome biogenesis(GO:0042254) |
| 0.0 | 0.1 | GO:0031936 | negative regulation of chromatin silencing(GO:0031936) |
| 0.0 | 0.5 | GO:0071450 | cellular response to oxygen radical(GO:0071450) cellular response to superoxide(GO:0071451) |
| 0.0 | 0.6 | GO:0007339 | binding of sperm to zona pellucida(GO:0007339) |
| 0.0 | 0.1 | GO:1900029 | positive regulation of ruffle assembly(GO:1900029) |
| 0.0 | 0.5 | GO:0006378 | mRNA polyadenylation(GO:0006378) RNA polyadenylation(GO:0043631) |
| 0.0 | 0.1 | GO:0032225 | regulation of synaptic transmission, dopaminergic(GO:0032225) |
| 0.0 | 0.2 | GO:0051967 | negative regulation of synaptic transmission, glutamatergic(GO:0051967) |
| 0.0 | 0.1 | GO:0007406 | negative regulation of neuroblast proliferation(GO:0007406) |
| 0.0 | 1.3 | GO:0006968 | cellular defense response(GO:0006968) |
| 0.0 | 0.7 | GO:1904893 | negative regulation of JAK-STAT cascade(GO:0046426) negative regulation of STAT cascade(GO:1904893) |
| 0.0 | 0.2 | GO:0036158 | outer dynein arm assembly(GO:0036158) |
| 0.0 | 0.3 | GO:0002089 | lens morphogenesis in camera-type eye(GO:0002089) |
| 0.0 | 6.9 | GO:0007283 | spermatogenesis(GO:0007283) |
| 0.0 | 0.4 | GO:0006418 | tRNA aminoacylation for protein translation(GO:0006418) |
| 0.0 | 0.3 | GO:0015695 | organic cation transport(GO:0015695) |
| 0.0 | 0.2 | GO:0009437 | carnitine metabolic process(GO:0009437) |
| 0.0 | 0.3 | GO:0006744 | ubiquinone metabolic process(GO:0006743) ubiquinone biosynthetic process(GO:0006744) quinone biosynthetic process(GO:1901663) |
Gene overrepresentation in cellular component category:
| Log-likelihood per target | Total log-likelihood | Term | Description |
|---|---|---|---|
| 4.6 | 13.8 | GO:0060987 | lipid tube(GO:0060987) |
| 1.7 | 8.4 | GO:0016938 | kinesin I complex(GO:0016938) |
| 1.1 | 23.3 | GO:0005861 | troponin complex(GO:0005861) |
| 1.0 | 7.2 | GO:0097513 | myosin II filament(GO:0097513) |
| 1.0 | 3.0 | GO:0016222 | procollagen-proline 4-dioxygenase complex(GO:0016222) |
| 1.0 | 3.9 | GO:0097629 | extrinsic component of omegasome membrane(GO:0097629) |
| 0.8 | 2.4 | GO:0070195 | growth hormone receptor complex(GO:0070195) |
| 0.8 | 5.5 | GO:0005971 | ribonucleoside-diphosphate reductase complex(GO:0005971) |
| 0.7 | 2.8 | GO:0034455 | t-UTP complex(GO:0034455) |
| 0.7 | 3.4 | GO:0036501 | UFD1-NPL4 complex(GO:0036501) |
| 0.6 | 7.0 | GO:0008282 | ATP-sensitive potassium channel complex(GO:0008282) |
| 0.6 | 0.6 | GO:0034750 | Scrib-APC-beta-catenin complex(GO:0034750) |
| 0.6 | 3.4 | GO:0005967 | mitochondrial pyruvate dehydrogenase complex(GO:0005967) |
| 0.6 | 3.9 | GO:0009331 | glycerol-3-phosphate dehydrogenase complex(GO:0009331) |
| 0.5 | 2.2 | GO:1990730 | VCP-NSFL1C complex(GO:1990730) |
| 0.5 | 7.9 | GO:0032541 | cortical endoplasmic reticulum(GO:0032541) |
| 0.5 | 2.1 | GO:0005745 | m-AAA complex(GO:0005745) |
| 0.5 | 5.7 | GO:0005964 | phosphorylase kinase complex(GO:0005964) |
| 0.5 | 10.8 | GO:0061700 | GATOR2 complex(GO:0061700) |
| 0.5 | 0.5 | GO:0070993 | translation preinitiation complex(GO:0070993) |
| 0.5 | 0.5 | GO:1903349 | omegasome membrane(GO:1903349) |
| 0.5 | 5.2 | GO:0072687 | meiotic spindle(GO:0072687) |
| 0.5 | 1.4 | GO:0030689 | Noc complex(GO:0030689) |
| 0.5 | 1.9 | GO:0009328 | phenylalanine-tRNA ligase complex(GO:0009328) |
| 0.4 | 7.7 | GO:0097470 | ribbon synapse(GO:0097470) |
| 0.4 | 5.1 | GO:0008541 | proteasome regulatory particle, lid subcomplex(GO:0008541) |
| 0.4 | 4.6 | GO:0016011 | dystroglycan complex(GO:0016011) |
| 0.4 | 1.6 | GO:1990356 | sumoylated E2 ligase complex(GO:1990356) |
| 0.4 | 2.4 | GO:0031436 | BRCA1-BARD1 complex(GO:0031436) |
| 0.4 | 4.4 | GO:0031314 | extrinsic component of mitochondrial inner membrane(GO:0031314) |
| 0.4 | 5.9 | GO:0034464 | BBSome(GO:0034464) |
| 0.4 | 2.3 | GO:0032044 | DSIF complex(GO:0032044) |
| 0.4 | 7.0 | GO:0070578 | RISC-loading complex(GO:0070578) |
| 0.3 | 1.0 | GO:0034515 | proteasome storage granule(GO:0034515) |
| 0.3 | 2.0 | GO:0033186 | CAF-1 complex(GO:0033186) |
| 0.3 | 3.3 | GO:0031464 | Cul4A-RING E3 ubiquitin ligase complex(GO:0031464) |
| 0.3 | 2.3 | GO:0005945 | 6-phosphofructokinase complex(GO:0005945) |
| 0.3 | 1.0 | GO:0032116 | SMC loading complex(GO:0032116) |
| 0.3 | 2.0 | GO:0044308 | axonal spine(GO:0044308) |
| 0.3 | 1.9 | GO:1990876 | cytoplasmic side of nuclear pore(GO:1990876) |
| 0.3 | 2.6 | GO:0033503 | HULC complex(GO:0033503) |
| 0.3 | 1.3 | GO:0005726 | perichromatin fibrils(GO:0005726) |
| 0.3 | 2.4 | GO:0031332 | RISC complex(GO:0016442) RNAi effector complex(GO:0031332) |
| 0.3 | 1.1 | GO:0044307 | dendritic branch(GO:0044307) |
| 0.3 | 6.0 | GO:0016281 | eukaryotic translation initiation factor 4F complex(GO:0016281) |
| 0.3 | 3.9 | GO:0031462 | Cul2-RING ubiquitin ligase complex(GO:0031462) |
| 0.3 | 4.3 | GO:0031597 | cytosolic proteasome complex(GO:0031597) |
| 0.2 | 3.7 | GO:0044352 | pinosome(GO:0044352) macropinosome(GO:0044354) |
| 0.2 | 4.5 | GO:0005844 | polysome(GO:0005844) |
| 0.2 | 1.9 | GO:1990452 | Parkin-FBXW7-Cul1 ubiquitin ligase complex(GO:1990452) |
| 0.2 | 1.7 | GO:0033553 | rDNA heterochromatin(GO:0033553) |
| 0.2 | 2.0 | GO:0005827 | polar microtubule(GO:0005827) |
| 0.2 | 1.8 | GO:0031415 | NatA complex(GO:0031415) |
| 0.2 | 1.5 | GO:0032311 | angiogenin-PRI complex(GO:0032311) |
| 0.2 | 1.9 | GO:0031428 | box C/D snoRNP complex(GO:0031428) |
| 0.2 | 7.9 | GO:0031306 | intrinsic component of mitochondrial outer membrane(GO:0031306) |
| 0.2 | 1.3 | GO:0090498 | extrinsic component of Golgi membrane(GO:0090498) |
| 0.2 | 1.0 | GO:0008275 | gamma-tubulin small complex(GO:0008275) |
| 0.2 | 4.8 | GO:0035102 | PRC1 complex(GO:0035102) |
| 0.2 | 0.8 | GO:0031933 | telomeric heterochromatin(GO:0031933) |
| 0.2 | 2.9 | GO:0019773 | proteasome core complex, alpha-subunit complex(GO:0019773) |
| 0.2 | 0.8 | GO:0043614 | multi-eIF complex(GO:0043614) |
| 0.2 | 1.5 | GO:0005947 | mitochondrial alpha-ketoglutarate dehydrogenase complex(GO:0005947) |
| 0.2 | 2.9 | GO:0031931 | TORC1 complex(GO:0031931) |
| 0.2 | 2.2 | GO:0000808 | origin recognition complex(GO:0000808) nuclear origin of replication recognition complex(GO:0005664) |
| 0.2 | 2.4 | GO:0033256 | I-kappaB/NF-kappaB complex(GO:0033256) |
| 0.2 | 2.1 | GO:0097504 | Gemini of coiled bodies(GO:0097504) |
| 0.2 | 1.0 | GO:0048179 | activin receptor complex(GO:0048179) |
| 0.2 | 1.9 | GO:0072379 | BAT3 complex(GO:0071818) ER membrane insertion complex(GO:0072379) |
| 0.2 | 0.6 | GO:0097636 | intrinsic component of autophagosome membrane(GO:0097636) integral component of autophagosome membrane(GO:0097637) |
| 0.2 | 1.5 | GO:0035985 | senescence-associated heterochromatin focus(GO:0035985) |
| 0.2 | 1.1 | GO:0035859 | Seh1-associated complex(GO:0035859) |
| 0.2 | 3.2 | GO:0030663 | COPI-coated vesicle membrane(GO:0030663) |
| 0.2 | 0.6 | GO:0000333 | telomerase catalytic core complex(GO:0000333) |
| 0.2 | 1.5 | GO:0005845 | mRNA cap binding complex(GO:0005845) |
| 0.1 | 1.8 | GO:0000506 | glycosylphosphatidylinositol-N-acetylglucosaminyltransferase (GPI-GnT) complex(GO:0000506) |
| 0.1 | 0.9 | GO:0017101 | aminoacyl-tRNA synthetase multienzyme complex(GO:0017101) |
| 0.1 | 1.9 | GO:0016600 | flotillin complex(GO:0016600) |
| 0.1 | 0.9 | GO:0044326 | dendritic spine neck(GO:0044326) |
| 0.1 | 0.9 | GO:0031466 | Cul5-RING ubiquitin ligase complex(GO:0031466) |
| 0.1 | 0.3 | GO:0002193 | MAML1-RBP-Jkappa- ICN1 complex(GO:0002193) |
| 0.1 | 0.8 | GO:0002081 | outer acrosomal membrane(GO:0002081) |
| 0.1 | 4.0 | GO:0005852 | eukaryotic translation initiation factor 3 complex(GO:0005852) |
| 0.1 | 1.3 | GO:0061574 | ASAP complex(GO:0061574) |
| 0.1 | 0.7 | GO:0002133 | polycystin complex(GO:0002133) |
| 0.1 | 2.9 | GO:0034993 | microtubule organizing center attachment site(GO:0034992) LINC complex(GO:0034993) |
| 0.1 | 0.5 | GO:0034271 | phosphatidylinositol 3-kinase complex, class III, type I(GO:0034271) phosphatidylinositol 3-kinase complex, class III, type II(GO:0034272) |
| 0.1 | 0.5 | GO:0071920 | cleavage body(GO:0071920) |
| 0.1 | 0.7 | GO:0005958 | DNA-dependent protein kinase-DNA ligase 4 complex(GO:0005958) |
| 0.1 | 0.6 | GO:0035061 | interchromatin granule(GO:0035061) |
| 0.1 | 0.8 | GO:0071942 | XPC complex(GO:0071942) |
| 0.1 | 0.3 | GO:0032419 | extrinsic component of lysosome membrane(GO:0032419) |
| 0.1 | 9.8 | GO:0010494 | cytoplasmic stress granule(GO:0010494) |
| 0.1 | 0.7 | GO:0016035 | zeta DNA polymerase complex(GO:0016035) |
| 0.1 | 2.4 | GO:0005665 | DNA-directed RNA polymerase II, core complex(GO:0005665) |
| 0.1 | 2.1 | GO:0034045 | pre-autophagosomal structure membrane(GO:0034045) |
| 0.1 | 0.4 | GO:0005850 | eukaryotic translation initiation factor 2 complex(GO:0005850) |
| 0.1 | 1.6 | GO:0030314 | junctional membrane complex(GO:0030314) |
| 0.1 | 4.5 | GO:0000421 | autophagosome membrane(GO:0000421) |
| 0.1 | 2.2 | GO:0000815 | ESCRT III complex(GO:0000815) |
| 0.1 | 1.0 | GO:0031414 | N-terminal protein acetyltransferase complex(GO:0031414) |
| 0.1 | 3.1 | GO:0001518 | voltage-gated sodium channel complex(GO:0001518) |
| 0.1 | 13.9 | GO:0016528 | sarcoplasm(GO:0016528) |
| 0.1 | 0.5 | GO:0045272 | plasma membrane respiratory chain complex I(GO:0045272) |
| 0.1 | 0.5 | GO:0043564 | Ku70:Ku80 complex(GO:0043564) |
| 0.1 | 0.5 | GO:0002945 | cyclin K-CDK13 complex(GO:0002945) |
| 0.1 | 1.6 | GO:0000813 | ESCRT I complex(GO:0000813) |
| 0.1 | 1.8 | GO:0036513 | Derlin-1 retrotranslocation complex(GO:0036513) |
| 0.1 | 0.9 | GO:0000127 | transcription factor TFIIIC complex(GO:0000127) |
| 0.1 | 0.5 | GO:0031467 | Cul7-RING ubiquitin ligase complex(GO:0031467) |
| 0.1 | 0.1 | GO:0030678 | mitochondrial ribonuclease P complex(GO:0030678) |
| 0.1 | 0.3 | GO:0005956 | protein kinase CK2 complex(GO:0005956) |
| 0.1 | 4.5 | GO:0005859 | muscle myosin complex(GO:0005859) |
| 0.1 | 2.8 | GO:0070971 | endoplasmic reticulum exit site(GO:0070971) |
| 0.1 | 0.7 | GO:0031519 | PcG protein complex(GO:0031519) |
| 0.1 | 0.5 | GO:0000799 | nuclear condensin complex(GO:0000799) |
| 0.1 | 1.7 | GO:0005671 | Ada2/Gcn5/Ada3 transcription activator complex(GO:0005671) |
| 0.1 | 0.8 | GO:1990316 | ATG1/ULK1 kinase complex(GO:1990316) |
| 0.1 | 2.8 | GO:0030877 | beta-catenin destruction complex(GO:0030877) |
| 0.1 | 4.9 | GO:0000502 | proteasome complex(GO:0000502) |
| 0.1 | 2.3 | GO:0005666 | DNA-directed RNA polymerase III complex(GO:0005666) |
| 0.1 | 2.2 | GO:0071004 | U2-type prespliceosome(GO:0071004) |
| 0.1 | 0.7 | GO:0016589 | NURF complex(GO:0016589) |
| 0.1 | 11.1 | GO:0005643 | nuclear pore(GO:0005643) |
| 0.1 | 1.4 | GO:0005751 | mitochondrial respiratory chain complex IV(GO:0005751) |
| 0.1 | 1.0 | GO:0016593 | Cdc73/Paf1 complex(GO:0016593) |
| 0.1 | 5.3 | GO:0009295 | nucleoid(GO:0009295) mitochondrial nucleoid(GO:0042645) |
| 0.1 | 0.8 | GO:0005786 | signal recognition particle, endoplasmic reticulum targeting(GO:0005786) |
| 0.1 | 4.6 | GO:0030964 | mitochondrial respiratory chain complex I(GO:0005747) NADH dehydrogenase complex(GO:0030964) respiratory chain complex I(GO:0045271) |
| 0.1 | 0.6 | GO:0044666 | MLL3/4 complex(GO:0044666) |
| 0.1 | 2.0 | GO:0044322 | endoplasmic reticulum quality control compartment(GO:0044322) |
| 0.1 | 3.7 | GO:0031092 | platelet alpha granule membrane(GO:0031092) |
| 0.1 | 0.5 | GO:0070876 | SOSS complex(GO:0070876) |
| 0.1 | 4.4 | GO:0016592 | mediator complex(GO:0016592) |
| 0.1 | 1.7 | GO:0060077 | inhibitory synapse(GO:0060077) |
| 0.1 | 0.3 | GO:0030892 | mitotic cohesin complex(GO:0030892) |
| 0.1 | 1.5 | GO:0000177 | cytoplasmic exosome (RNase complex)(GO:0000177) |
| 0.1 | 0.5 | GO:0042825 | MHC class I peptide loading complex(GO:0042824) TAP complex(GO:0042825) |
| 0.1 | 0.8 | GO:0001940 | male pronucleus(GO:0001940) |
| 0.1 | 1.1 | GO:0000322 | storage vacuole(GO:0000322) |
| 0.1 | 0.5 | GO:0070552 | BRISC complex(GO:0070552) |
| 0.1 | 1.5 | GO:0014731 | spectrin-associated cytoskeleton(GO:0014731) |
| 0.1 | 1.0 | GO:0008290 | F-actin capping protein complex(GO:0008290) |
| 0.1 | 0.5 | GO:0042765 | GPI-anchor transamidase complex(GO:0042765) |
| 0.1 | 1.1 | GO:0032039 | integrator complex(GO:0032039) |
| 0.1 | 1.5 | GO:0000164 | protein phosphatase type 1 complex(GO:0000164) |
| 0.1 | 1.9 | GO:0036379 | striated muscle thin filament(GO:0005865) myofilament(GO:0036379) |
| 0.1 | 0.3 | GO:0032301 | MutSalpha complex(GO:0032301) |
| 0.1 | 1.7 | GO:0000780 | condensed nuclear chromosome, centromeric region(GO:0000780) |
| 0.1 | 0.3 | GO:0033596 | TSC1-TSC2 complex(GO:0033596) |
| 0.1 | 9.3 | GO:0000118 | histone deacetylase complex(GO:0000118) |
| 0.1 | 0.2 | GO:0005606 | laminin-1 complex(GO:0005606) |
| 0.1 | 0.4 | GO:0000214 | tRNA-intron endonuclease complex(GO:0000214) |
| 0.1 | 0.6 | GO:0097427 | microtubule bundle(GO:0097427) |
| 0.1 | 1.2 | GO:0044232 | organelle membrane contact site(GO:0044232) |
| 0.1 | 0.6 | GO:0005787 | signal peptidase complex(GO:0005787) |
| 0.1 | 1.4 | GO:0043205 | microfibril(GO:0001527) fibril(GO:0043205) |
| 0.1 | 1.8 | GO:0031083 | BLOC-1 complex(GO:0031083) |
| 0.1 | 0.3 | GO:0070826 | paraferritin complex(GO:0070826) |
| 0.1 | 1.7 | GO:0031527 | filopodium membrane(GO:0031527) |
| 0.1 | 1.0 | GO:0048188 | Set1C/COMPASS complex(GO:0048188) |
| 0.1 | 0.7 | GO:0033588 | Elongator holoenzyme complex(GO:0033588) |
| 0.1 | 0.3 | GO:0030915 | Smc5-Smc6 complex(GO:0030915) |
| 0.1 | 3.1 | GO:0043034 | costamere(GO:0043034) |
| 0.1 | 5.1 | GO:0017053 | transcriptional repressor complex(GO:0017053) |
| 0.1 | 0.6 | GO:0098559 | cytoplasmic side of early endosome membrane(GO:0098559) |
| 0.1 | 0.8 | GO:0070937 | CRD-mediated mRNA stability complex(GO:0070937) |
| 0.1 | 0.3 | GO:0043625 | delta DNA polymerase complex(GO:0043625) |
| 0.1 | 1.4 | GO:0005719 | nuclear euchromatin(GO:0005719) |
| 0.1 | 1.3 | GO:0033202 | Ino80 complex(GO:0031011) DNA helicase complex(GO:0033202) |
| 0.1 | 1.8 | GO:0071564 | npBAF complex(GO:0071564) |
| 0.1 | 0.4 | GO:0032021 | NELF complex(GO:0032021) |
| 0.0 | 0.8 | GO:0033391 | chromatoid body(GO:0033391) |
| 0.0 | 1.3 | GO:0005952 | cAMP-dependent protein kinase complex(GO:0005952) |
| 0.0 | 0.3 | GO:0032444 | activin responsive factor complex(GO:0032444) |
| 0.0 | 0.8 | GO:0070776 | H3 histone acetyltransferase complex(GO:0070775) MOZ/MORF histone acetyltransferase complex(GO:0070776) |
| 0.0 | 0.7 | GO:0097486 | multivesicular body lumen(GO:0097486) |
| 0.0 | 0.2 | GO:0035841 | growing cell tip(GO:0035838) new growing cell tip(GO:0035841) |
| 0.0 | 0.4 | GO:1990745 | EARP complex(GO:1990745) |
| 0.0 | 0.1 | GO:0000805 | X chromosome(GO:0000805) |
| 0.0 | 0.4 | GO:0031673 | H zone(GO:0031673) |
| 0.0 | 0.7 | GO:0060091 | kinocilium(GO:0060091) |
| 0.0 | 0.7 | GO:0097346 | Swr1 complex(GO:0000812) INO80-type complex(GO:0097346) |
| 0.0 | 4.1 | GO:0000794 | condensed nuclear chromosome(GO:0000794) |
| 0.0 | 1.9 | GO:0035869 | ciliary transition zone(GO:0035869) |
| 0.0 | 0.3 | GO:0070436 | Grb2-EGFR complex(GO:0070436) |
| 0.0 | 0.4 | GO:0005663 | DNA replication factor C complex(GO:0005663) |
| 0.0 | 0.7 | GO:0098643 | fibrillar collagen trimer(GO:0005583) banded collagen fibril(GO:0098643) |
| 0.0 | 0.7 | GO:0030008 | TRAPP complex(GO:0030008) |
| 0.0 | 0.3 | GO:0071595 | Nem1-Spo7 phosphatase complex(GO:0071595) |
| 0.0 | 0.4 | GO:0030127 | COPII vesicle coat(GO:0030127) |
| 0.0 | 0.3 | GO:0072589 | box H/ACA scaRNP complex(GO:0072589) box H/ACA telomerase RNP complex(GO:0090661) |
| 0.0 | 0.7 | GO:0033179 | proton-transporting V-type ATPase, V0 domain(GO:0033179) |
| 0.0 | 2.6 | GO:0030173 | integral component of Golgi membrane(GO:0030173) |
| 0.0 | 0.2 | GO:0070531 | BRCA1-A complex(GO:0070531) |
| 0.0 | 2.7 | GO:0005776 | autophagosome(GO:0005776) |
| 0.0 | 1.8 | GO:0030140 | trans-Golgi network transport vesicle(GO:0030140) |
| 0.0 | 4.0 | GO:0016605 | PML body(GO:0016605) |
| 0.0 | 1.2 | GO:0031143 | pseudopodium(GO:0031143) |
| 0.0 | 1.4 | GO:0035371 | microtubule plus-end(GO:0035371) |
| 0.0 | 18.3 | GO:0016607 | nuclear speck(GO:0016607) |
| 0.0 | 3.3 | GO:0022625 | cytosolic large ribosomal subunit(GO:0022625) |
| 0.0 | 6.1 | GO:0001650 | fibrillar center(GO:0001650) |
| 0.0 | 4.5 | GO:0101002 | ficolin-1-rich granule(GO:0101002) ficolin-1-rich granule lumen(GO:1904813) |
| 0.0 | 0.2 | GO:0035749 | myelin sheath adaxonal region(GO:0035749) |
| 0.0 | 0.2 | GO:1903440 | calcitonin family receptor complex(GO:1903439) amylin receptor complex(GO:1903440) |
| 0.0 | 0.6 | GO:0035253 | ciliary rootlet(GO:0035253) |
| 0.0 | 0.5 | GO:0071339 | MLL1/2 complex(GO:0044665) MLL1 complex(GO:0071339) |
| 0.0 | 6.0 | GO:0090575 | RNA polymerase II transcription factor complex(GO:0090575) |
| 0.0 | 0.6 | GO:0032591 | dendritic spine membrane(GO:0032591) |
| 0.0 | 1.0 | GO:0005680 | anaphase-promoting complex(GO:0005680) |
| 0.0 | 2.4 | GO:0000785 | chromatin(GO:0000785) |
| 0.0 | 7.2 | GO:0005667 | transcription factor complex(GO:0005667) |
| 0.0 | 0.3 | GO:0005662 | DNA replication factor A complex(GO:0005662) |
| 0.0 | 0.9 | GO:0031305 | intrinsic component of mitochondrial inner membrane(GO:0031304) integral component of mitochondrial inner membrane(GO:0031305) |
| 0.0 | 0.9 | GO:0005763 | organellar small ribosomal subunit(GO:0000314) mitochondrial small ribosomal subunit(GO:0005763) |
| 0.0 | 0.6 | GO:0071013 | catalytic step 2 spliceosome(GO:0071013) |
| 0.0 | 0.7 | GO:0030867 | rough endoplasmic reticulum membrane(GO:0030867) |
| 0.0 | 1.9 | GO:0033116 | endoplasmic reticulum-Golgi intermediate compartment membrane(GO:0033116) |
| 0.0 | 0.1 | GO:0017109 | glutamate-cysteine ligase complex(GO:0017109) |
| 0.0 | 1.2 | GO:0016235 | aggresome(GO:0016235) |
| 0.0 | 0.3 | GO:0072487 | MSL complex(GO:0072487) |
| 0.0 | 0.4 | GO:0017119 | Golgi transport complex(GO:0017119) |
| 0.0 | 0.1 | GO:0030914 | STAGA complex(GO:0030914) |
| 0.0 | 0.7 | GO:0000159 | protein phosphatase type 2A complex(GO:0000159) |
| 0.0 | 1.4 | GO:0001772 | immunological synapse(GO:0001772) |
| 0.0 | 0.1 | GO:0031390 | Ctf18 RFC-like complex(GO:0031390) |
| 0.0 | 0.4 | GO:0008385 | IkappaB kinase complex(GO:0008385) |
| 0.0 | 0.6 | GO:0051233 | spindle midzone(GO:0051233) |
| 0.0 | 1.0 | GO:0034364 | high-density lipoprotein particle(GO:0034364) |
| 0.0 | 1.3 | GO:0001533 | cornified envelope(GO:0001533) |
| 0.0 | 71.8 | GO:0005654 | nucleoplasm(GO:0005654) |
| 0.0 | 0.3 | GO:0031209 | SCAR complex(GO:0031209) |
| 0.0 | 0.3 | GO:1990712 | HFE-transferrin receptor complex(GO:1990712) |
| 0.0 | 0.3 | GO:0032993 | protein-DNA complex(GO:0032993) |
| 0.0 | 0.3 | GO:0001891 | phagocytic cup(GO:0001891) |
| 0.0 | 1.6 | GO:0005778 | peroxisomal membrane(GO:0005778) microbody membrane(GO:0031903) |
| 0.0 | 0.2 | GO:0072546 | ER membrane protein complex(GO:0072546) |
| 0.0 | 0.4 | GO:0097440 | apical dendrite(GO:0097440) |
| 0.0 | 1.3 | GO:0036064 | ciliary basal body(GO:0036064) |
| 0.0 | 0.2 | GO:0033178 | proton-transporting two-sector ATPase complex, catalytic domain(GO:0033178) |
| 0.0 | 2.3 | GO:0043204 | perikaryon(GO:0043204) |
| 0.0 | 0.2 | GO:0032592 | integral component of mitochondrial membrane(GO:0032592) |
| 0.0 | 0.0 | GO:0048237 | rough endoplasmic reticulum lumen(GO:0048237) |
| 0.0 | 0.1 | GO:0071797 | LUBAC complex(GO:0071797) |
| 0.0 | 0.7 | GO:0000315 | organellar large ribosomal subunit(GO:0000315) mitochondrial large ribosomal subunit(GO:0005762) |
Gene overrepresentation in molecular function category:
| Log-likelihood per target | Total log-likelihood | Term | Description |
|---|---|---|---|
| 2.6 | 7.7 | GO:0031775 | lutropin-choriogonadotropic hormone receptor binding(GO:0031775) calcium-transporting ATPase activity involved in regulation of cardiac muscle cell membrane potential(GO:0086039) |
| 1.9 | 5.6 | GO:0046970 | NAD-dependent histone deacetylase activity (H4-K16 specific)(GO:0046970) |
| 1.7 | 23.3 | GO:0031014 | troponin T binding(GO:0031014) |
| 1.2 | 3.7 | GO:0008193 | tRNA guanylyltransferase activity(GO:0008193) |
| 1.0 | 5.0 | GO:0098808 | mRNA cap binding(GO:0098808) |
| 1.0 | 2.9 | GO:0031626 | beta-endorphin binding(GO:0031626) |
| 1.0 | 2.9 | GO:0000994 | RNA polymerase III core binding(GO:0000994) |
| 0.8 | 5.5 | GO:0016728 | ribonucleoside-diphosphate reductase activity, thioredoxin disulfide as acceptor(GO:0004748) oxidoreductase activity, acting on CH or CH2 groups, disulfide as acceptor(GO:0016728) ribonucleoside-diphosphate reductase activity(GO:0061731) |
| 0.7 | 2.2 | GO:0047635 | L-alanine:2-oxoglutarate aminotransferase activity(GO:0004021) alanine-oxo-acid transaminase activity(GO:0047635) |
| 0.7 | 2.2 | GO:0004326 | tetrahydrofolylpolyglutamate synthase activity(GO:0004326) dihydrofolate synthase activity(GO:0008841) |
| 0.7 | 2.8 | GO:0017077 | oxidative phosphorylation uncoupler activity(GO:0017077) |
| 0.7 | 2.7 | GO:0005289 | high-affinity basic amino acid transmembrane transporter activity(GO:0005287) high-affinity arginine transmembrane transporter activity(GO:0005289) high-affinity lysine transmembrane transporter activity(GO:0005292) |
| 0.7 | 5.2 | GO:0004111 | creatine kinase activity(GO:0004111) |
| 0.6 | 7.5 | GO:0042799 | histone methyltransferase activity (H4-K20 specific)(GO:0042799) |
| 0.6 | 3.1 | GO:0086062 | voltage-gated sodium channel activity involved in Purkinje myocyte action potential(GO:0086062) |
| 0.6 | 18.9 | GO:0048156 | tau protein binding(GO:0048156) |
| 0.6 | 7.0 | GO:0015272 | ATP-activated inward rectifier potassium channel activity(GO:0015272) |
| 0.5 | 2.2 | GO:0071987 | WD40-repeat domain binding(GO:0071987) |
| 0.5 | 1.6 | GO:0008940 | nitrate reductase activity(GO:0008940) molybdopterin adenylyltransferase activity(GO:0061598) molybdopterin molybdotransferase activity(GO:0061599) |
| 0.5 | 1.6 | GO:0080130 | L-aspartate:2-oxoglutarate aminotransferase activity(GO:0004069) L-phenylalanine:2-oxoglutarate aminotransferase activity(GO:0080130) |
| 0.5 | 2.6 | GO:0052590 | sn-glycerol-3-phosphate:ubiquinone oxidoreductase activity(GO:0052590) sn-glycerol-3-phosphate:ubiquinone-8 oxidoreductase activity(GO:0052591) |
| 0.5 | 5.7 | GO:0004689 | phosphorylase kinase activity(GO:0004689) |
| 0.5 | 1.6 | GO:0032129 | histone deacetylase activity (H3-K9 specific)(GO:0032129) NAD-dependent histone deacetylase activity (H3-K9 specific)(GO:0046969) |
| 0.5 | 2.0 | GO:0004306 | ethanolamine-phosphate cytidylyltransferase activity(GO:0004306) |
| 0.5 | 2.4 | GO:0030622 | U4atac snRNA binding(GO:0030622) |
| 0.5 | 1.4 | GO:0016855 | L-serine ammonia-lyase activity(GO:0003941) racemase and epimerase activity, acting on amino acids and derivatives(GO:0016855) racemase activity, acting on amino acids and derivatives(GO:0036361) amino-acid racemase activity(GO:0047661) |
| 0.5 | 2.7 | GO:0032038 | myosin II heavy chain binding(GO:0032038) |
| 0.4 | 3.1 | GO:0005166 | neurotrophin p75 receptor binding(GO:0005166) |
| 0.4 | 2.1 | GO:0004886 | 9-cis retinoic acid receptor activity(GO:0004886) |
| 0.4 | 1.7 | GO:0051538 | 3 iron, 4 sulfur cluster binding(GO:0051538) |
| 0.4 | 2.5 | GO:0033188 | sphingomyelin synthase activity(GO:0033188) ceramide cholinephosphotransferase activity(GO:0047493) |
| 0.4 | 3.7 | GO:0061133 | endopeptidase activator activity(GO:0061133) |
| 0.4 | 1.2 | GO:0034057 | RNA strand-exchange activity(GO:0034057) |
| 0.4 | 1.6 | GO:0061656 | SUMO conjugating enzyme activity(GO:0061656) |
| 0.4 | 1.5 | GO:0015173 | aromatic amino acid transmembrane transporter activity(GO:0015173) |
| 0.4 | 3.0 | GO:0004656 | procollagen-proline 4-dioxygenase activity(GO:0004656) |
| 0.4 | 2.2 | GO:0004740 | pyruvate dehydrogenase (acetyl-transferring) kinase activity(GO:0004740) |
| 0.4 | 1.8 | GO:0070180 | large ribosomal subunit rRNA binding(GO:0070180) |
| 0.3 | 5.8 | GO:0004707 | MAP kinase activity(GO:0004707) |
| 0.3 | 4.4 | GO:0070087 | chromo shadow domain binding(GO:0070087) |
| 0.3 | 1.3 | GO:0034584 | piRNA binding(GO:0034584) |
| 0.3 | 1.0 | GO:0005128 | erythropoietin receptor binding(GO:0005128) interleukin-3 receptor binding(GO:0005135) |
| 0.3 | 1.6 | GO:0004572 | mannosyl-oligosaccharide 1,3-1,6-alpha-mannosidase activity(GO:0004572) |
| 0.3 | 4.1 | GO:0034618 | arginine binding(GO:0034618) |
| 0.3 | 2.2 | GO:0003987 | acetate-CoA ligase activity(GO:0003987) |
| 0.3 | 0.9 | GO:0001222 | transcription corepressor binding(GO:0001222) |
| 0.3 | 0.9 | GO:0004165 | dodecenoyl-CoA delta-isomerase activity(GO:0004165) |
| 0.3 | 2.5 | GO:1904288 | BAT3 complex binding(GO:1904288) |
| 0.3 | 1.9 | GO:0004826 | phenylalanine-tRNA ligase activity(GO:0004826) |
| 0.3 | 4.3 | GO:0004128 | cytochrome-b5 reductase activity, acting on NAD(P)H(GO:0004128) |
| 0.3 | 1.5 | GO:0004775 | succinate-CoA ligase (ADP-forming) activity(GO:0004775) |
| 0.3 | 0.9 | GO:0005046 | KDEL sequence binding(GO:0005046) |
| 0.3 | 4.4 | GO:1901612 | cardiolipin binding(GO:1901612) |
| 0.3 | 1.5 | GO:0003680 | AT DNA binding(GO:0003680) |
| 0.3 | 1.1 | GO:0010465 | nerve growth factor receptor activity(GO:0010465) neurotensin receptor activity, non-G-protein coupled(GO:0030379) |
| 0.3 | 1.1 | GO:0004641 | phosphoribosylamine-glycine ligase activity(GO:0004637) phosphoribosylformylglycinamidine cyclo-ligase activity(GO:0004641) phosphoribosylglycinamide formyltransferase activity(GO:0004644) |
| 0.3 | 2.5 | GO:0031730 | CCR5 chemokine receptor binding(GO:0031730) |
| 0.3 | 1.4 | GO:0005010 | insulin-like growth factor-activated receptor activity(GO:0005010) |
| 0.3 | 3.2 | GO:0070739 | protein-glutamic acid ligase activity(GO:0070739) |
| 0.3 | 8.4 | GO:0008190 | eukaryotic initiation factor 4E binding(GO:0008190) |
| 0.3 | 2.6 | GO:0030160 | GKAP/Homer scaffold activity(GO:0030160) |
| 0.3 | 2.3 | GO:0003872 | 6-phosphofructokinase activity(GO:0003872) |
| 0.3 | 0.8 | GO:0019781 | NEDD8 activating enzyme activity(GO:0019781) |
| 0.3 | 1.0 | GO:0047223 | beta-1,3-galactosyl-O-glycosyl-glycoprotein beta-1,3-N-acetylglucosaminyltransferase activity(GO:0047223) |
| 0.3 | 0.8 | GO:0097677 | STAT family protein binding(GO:0097677) |
| 0.2 | 5.2 | GO:0010857 | calcium-dependent protein kinase activity(GO:0010857) |
| 0.2 | 0.7 | GO:1990190 | peptide-glutamate-N-acetyltransferase activity(GO:1990190) |
| 0.2 | 0.2 | GO:0070546 | L-phenylalanine aminotransferase activity(GO:0070546) |
| 0.2 | 0.7 | GO:0016309 | 1-phosphatidylinositol-5-phosphate 4-kinase activity(GO:0016309) |
| 0.2 | 12.4 | GO:0008139 | nuclear localization sequence binding(GO:0008139) |
| 0.2 | 5.3 | GO:0044213 | intronic transcription regulatory region sequence-specific DNA binding(GO:0001161) intronic transcription regulatory region DNA binding(GO:0044213) |
| 0.2 | 6.4 | GO:0030898 | actin-dependent ATPase activity(GO:0030898) |
| 0.2 | 2.5 | GO:0035242 | protein-arginine omega-N asymmetric methyltransferase activity(GO:0035242) |
| 0.2 | 8.4 | GO:0008301 | DNA binding, bending(GO:0008301) |
| 0.2 | 0.7 | GO:0008330 | protein tyrosine/threonine phosphatase activity(GO:0008330) |
| 0.2 | 1.1 | GO:0035575 | histone demethylase activity (H4-K20 specific)(GO:0035575) |
| 0.2 | 1.9 | GO:0004727 | prenylated protein tyrosine phosphatase activity(GO:0004727) |
| 0.2 | 1.3 | GO:0004741 | [pyruvate dehydrogenase (lipoamide)] phosphatase activity(GO:0004741) |
| 0.2 | 0.6 | GO:0046403 | polynucleotide 3'-phosphatase activity(GO:0046403) |
| 0.2 | 3.4 | GO:0015386 | potassium:proton antiporter activity(GO:0015386) |
| 0.2 | 0.8 | GO:0032427 | GBD domain binding(GO:0032427) |
| 0.2 | 0.6 | GO:0000386 | second spliceosomal transesterification activity(GO:0000386) |
| 0.2 | 1.9 | GO:0099580 | ion antiporter activity involved in regulation of postsynaptic membrane potential(GO:0099580) |
| 0.2 | 0.6 | GO:0032453 | histone demethylase activity (H3-K4 specific)(GO:0032453) |
| 0.2 | 1.6 | GO:0035184 | histone threonine kinase activity(GO:0035184) |
| 0.2 | 1.0 | GO:0047066 | phospholipid-hydroperoxide glutathione peroxidase activity(GO:0047066) |
| 0.2 | 1.7 | GO:0046975 | histone methyltransferase activity (H3-K36 specific)(GO:0046975) |
| 0.2 | 17.3 | GO:0004712 | protein serine/threonine/tyrosine kinase activity(GO:0004712) |
| 0.2 | 0.4 | GO:0003918 | DNA topoisomerase type II (ATP-hydrolyzing) activity(GO:0003918) DNA topoisomerase II activity(GO:0061505) |
| 0.2 | 8.6 | GO:0051010 | microtubule plus-end binding(GO:0051010) |
| 0.2 | 2.5 | GO:1990247 | N6-methyladenosine-containing RNA binding(GO:1990247) |
| 0.2 | 1.8 | GO:0005315 | inorganic phosphate transmembrane transporter activity(GO:0005315) |
| 0.2 | 2.0 | GO:0070883 | pre-miRNA binding(GO:0070883) |
| 0.2 | 1.1 | GO:0019237 | centromeric DNA binding(GO:0019237) |
| 0.2 | 1.8 | GO:0017176 | phosphatidylinositol N-acetylglucosaminyltransferase activity(GO:0017176) |
| 0.2 | 3.5 | GO:0043425 | bHLH transcription factor binding(GO:0043425) |
| 0.2 | 2.6 | GO:0005049 | nuclear export signal receptor activity(GO:0005049) |
| 0.2 | 2.1 | GO:0008046 | axon guidance receptor activity(GO:0008046) |
| 0.2 | 0.7 | GO:0070697 | activin receptor binding(GO:0070697) |
| 0.2 | 0.9 | GO:0004616 | phosphogluconate dehydrogenase (decarboxylating) activity(GO:0004616) |
| 0.2 | 2.2 | GO:0015288 | porin activity(GO:0015288) |
| 0.2 | 1.3 | GO:0001165 | RNA polymerase I upstream control element sequence-specific DNA binding(GO:0001165) |
| 0.2 | 3.5 | GO:0042809 | vitamin D receptor binding(GO:0042809) |
| 0.2 | 0.5 | GO:0015275 | stretch-activated, cation-selective, calcium channel activity(GO:0015275) |
| 0.2 | 7.5 | GO:0070577 | lysine-acetylated histone binding(GO:0070577) |
| 0.2 | 0.8 | GO:0004803 | transposase activity(GO:0004803) |
| 0.2 | 2.1 | GO:0008420 | CTD phosphatase activity(GO:0008420) |
| 0.2 | 7.4 | GO:0071837 | HMG box domain binding(GO:0071837) |
| 0.2 | 1.2 | GO:0004430 | 1-phosphatidylinositol 4-kinase activity(GO:0004430) |
| 0.2 | 3.2 | GO:0004861 | cyclin-dependent protein serine/threonine kinase inhibitor activity(GO:0004861) |
| 0.2 | 2.1 | GO:0030274 | LIM domain binding(GO:0030274) |
| 0.2 | 1.4 | GO:0004699 | calcium-independent protein kinase C activity(GO:0004699) |
| 0.2 | 3.0 | GO:0017034 | Rap guanyl-nucleotide exchange factor activity(GO:0017034) |
| 0.2 | 1.1 | GO:0004045 | aminoacyl-tRNA hydrolase activity(GO:0004045) |
| 0.1 | 2.2 | GO:0008504 | monoamine transmembrane transporter activity(GO:0008504) |
| 0.1 | 1.6 | GO:0005432 | calcium:sodium antiporter activity(GO:0005432) |
| 0.1 | 1.3 | GO:0043237 | laminin-1 binding(GO:0043237) |
| 0.1 | 0.4 | GO:0016497 | substance K receptor activity(GO:0016497) |
| 0.1 | 1.8 | GO:0008142 | oxysterol binding(GO:0008142) |
| 0.1 | 1.8 | GO:0008494 | translation activator activity(GO:0008494) |
| 0.1 | 2.6 | GO:0015245 | fatty acid transporter activity(GO:0015245) |
| 0.1 | 1.5 | GO:1990226 | histone methyltransferase binding(GO:1990226) |
| 0.1 | 4.0 | GO:0044548 | S100 protein binding(GO:0044548) |
| 0.1 | 0.8 | GO:0031749 | D2 dopamine receptor binding(GO:0031749) |
| 0.1 | 1.1 | GO:0050815 | phosphoserine binding(GO:0050815) |
| 0.1 | 0.4 | GO:0033906 | hyaluronoglucuronidase activity(GO:0033906) |
| 0.1 | 0.3 | GO:0004874 | aryl hydrocarbon receptor activity(GO:0004874) |
| 0.1 | 1.3 | GO:0036402 | proteasome-activating ATPase activity(GO:0036402) |
| 0.1 | 0.4 | GO:0052830 | inositol tetrakisphosphate 1-kinase activity(GO:0047325) inositol-1,3,4-trisphosphate 6-kinase activity(GO:0052725) inositol-1,3,4-trisphosphate 5-kinase activity(GO:0052726) inositol-1,3,4,5,6-pentakisphosphate 1-phosphatase activity(GO:0052825) inositol-1,3,4,6-tetrakisphosphate 6-phosphatase activity(GO:0052830) inositol-1,3,4,6-tetrakisphosphate 1-phosphatase activity(GO:0052831) inositol-3,4,6-trisphosphate 1-kinase activity(GO:0052835) |
| 0.1 | 1.0 | GO:0001055 | RNA polymerase II activity(GO:0001055) |
| 0.1 | 2.5 | GO:0000339 | RNA cap binding(GO:0000339) |
| 0.1 | 8.6 | GO:0001103 | RNA polymerase II repressing transcription factor binding(GO:0001103) |
| 0.1 | 3.7 | GO:0008242 | omega peptidase activity(GO:0008242) |
| 0.1 | 0.4 | GO:0050333 | thiamin-triphosphatase activity(GO:0050333) |
| 0.1 | 1.5 | GO:0043023 | ribosomal large subunit binding(GO:0043023) |
| 0.1 | 0.4 | GO:0052816 | medium-chain acyl-CoA hydrolase activity(GO:0052815) long-chain acyl-CoA hydrolase activity(GO:0052816) |
| 0.1 | 3.8 | GO:0097602 | cullin family protein binding(GO:0097602) |
| 0.1 | 3.7 | GO:0035259 | glucocorticoid receptor binding(GO:0035259) |
| 0.1 | 1.5 | GO:0031545 | peptidyl-proline 4-dioxygenase activity(GO:0031545) |
| 0.1 | 0.1 | GO:0004357 | glutamate-cysteine ligase activity(GO:0004357) |
| 0.1 | 0.5 | GO:0004078 | biotin-[acetyl-CoA-carboxylase] ligase activity(GO:0004077) biotin-[methylcrotonoyl-CoA-carboxylase] ligase activity(GO:0004078) biotin-[methylmalonyl-CoA-carboxytransferase] ligase activity(GO:0004079) biotin-[propionyl-CoA-carboxylase (ATP-hydrolyzing)] ligase activity(GO:0004080) biotin-protein ligase activity(GO:0018271) |
| 0.1 | 0.9 | GO:0043199 | sulfate binding(GO:0043199) |
| 0.1 | 0.4 | GO:0090541 | MIT domain binding(GO:0090541) |
| 0.1 | 3.5 | GO:1990381 | ubiquitin-specific protease binding(GO:1990381) |
| 0.1 | 4.6 | GO:0008143 | poly(A) binding(GO:0008143) |
| 0.1 | 0.4 | GO:0000252 | C-3 sterol dehydrogenase (C-4 sterol decarboxylase) activity(GO:0000252) sterol-4-alpha-carboxylate 3-dehydrogenase (decarboxylating) activity(GO:0047012) |
| 0.1 | 3.7 | GO:0070003 | threonine-type endopeptidase activity(GO:0004298) threonine-type peptidase activity(GO:0070003) |
| 0.1 | 0.7 | GO:0004677 | DNA-dependent protein kinase activity(GO:0004677) |
| 0.1 | 1.5 | GO:0008428 | ribonuclease inhibitor activity(GO:0008428) |
| 0.1 | 6.6 | GO:0048487 | beta-tubulin binding(GO:0048487) |
| 0.1 | 2.3 | GO:0032454 | histone demethylase activity (H3-K9 specific)(GO:0032454) |
| 0.1 | 0.5 | GO:0004487 | methylenetetrahydrofolate dehydrogenase (NAD+) activity(GO:0004487) |
| 0.1 | 0.9 | GO:0008853 | exodeoxyribonuclease III activity(GO:0008853) |
| 0.1 | 0.3 | GO:0052858 | peptidyl-lysine N-acetyltransferase activity, acting on acetyl phosphate as donor(GO:0052858) |
| 0.1 | 0.6 | GO:0008457 | beta-galactosyl-N-acetylglucosaminylgalactosylglucosyl-ceramide beta-1,3-acetylglucosaminyltransferase activity(GO:0008457) lactosylceramide 1,3-N-acetyl-beta-D-glucosaminyltransferase activity(GO:0047256) |
| 0.1 | 0.4 | GO:0008665 | 2'-phosphotransferase activity(GO:0008665) |
| 0.1 | 0.3 | GO:1990699 | palmitoleyl hydrolase activity(GO:1990699) |
| 0.1 | 1.1 | GO:0032190 | acrosin binding(GO:0032190) |
| 0.1 | 1.5 | GO:0047499 | calcium-independent phospholipase A2 activity(GO:0047499) |
| 0.1 | 0.6 | GO:0042954 | lipoprotein transporter activity(GO:0042954) |
| 0.1 | 1.1 | GO:0003831 | beta-N-acetylglucosaminylglycopeptide beta-1,4-galactosyltransferase activity(GO:0003831) |
| 0.1 | 2.0 | GO:0019855 | calcium channel inhibitor activity(GO:0019855) |
| 0.1 | 8.0 | GO:0003743 | translation initiation factor activity(GO:0003743) |
| 0.1 | 3.3 | GO:0070006 | metalloaminopeptidase activity(GO:0070006) |
| 0.1 | 0.6 | GO:0032422 | purine-rich negative regulatory element binding(GO:0032422) |
| 0.1 | 0.8 | GO:0030942 | signal recognition particle binding(GO:0005047) endoplasmic reticulum signal peptide binding(GO:0030942) |
| 0.1 | 0.5 | GO:0070139 | ubiquitin-like protein-specific endopeptidase activity(GO:0070137) SUMO-specific endopeptidase activity(GO:0070139) |
| 0.1 | 0.3 | GO:0032143 | single thymine insertion binding(GO:0032143) |
| 0.1 | 6.2 | GO:0061631 | ubiquitin conjugating enzyme activity(GO:0061631) ubiquitin-like protein conjugating enzyme activity(GO:0061650) |
| 0.1 | 0.7 | GO:0030171 | voltage-gated proton channel activity(GO:0030171) |
| 0.1 | 0.4 | GO:0008384 | IkappaB kinase activity(GO:0008384) |
| 0.1 | 0.3 | GO:0008900 | hydrogen:potassium-exchanging ATPase activity(GO:0008900) |
| 0.1 | 0.5 | GO:0008073 | ornithine decarboxylase inhibitor activity(GO:0008073) |
| 0.1 | 10.0 | GO:0001190 | transcriptional activator activity, RNA polymerase II transcription factor binding(GO:0001190) transcriptional repressor activity, RNA polymerase II activating transcription factor binding(GO:0098811) |
| 0.1 | 0.9 | GO:0004176 | ATP-dependent peptidase activity(GO:0004176) |
| 0.1 | 0.5 | GO:0052798 | beta-galactoside alpha-2,3-sialyltransferase activity(GO:0052798) |
| 0.1 | 2.2 | GO:0017025 | TBP-class protein binding(GO:0017025) |
| 0.1 | 0.5 | GO:0015433 | peptide antigen-transporting ATPase activity(GO:0015433) |
| 0.1 | 0.6 | GO:0042731 | PH domain binding(GO:0042731) |
| 0.1 | 0.4 | GO:0050816 | phosphothreonine binding(GO:0050816) |
| 0.1 | 3.3 | GO:0016922 | ligand-dependent nuclear receptor binding(GO:0016922) |
| 0.1 | 0.9 | GO:0051011 | microtubule minus-end binding(GO:0051011) |
| 0.1 | 6.1 | GO:0031491 | nucleosome binding(GO:0031491) |
| 0.1 | 1.1 | GO:0004726 | non-membrane spanning protein tyrosine phosphatase activity(GO:0004726) |
| 0.1 | 7.5 | GO:0070888 | E-box binding(GO:0070888) |
| 0.1 | 0.5 | GO:0071558 | histone demethylase activity (H3-K27 specific)(GO:0071558) |
| 0.1 | 1.9 | GO:0005095 | GTPase inhibitor activity(GO:0005095) |
| 0.1 | 3.5 | GO:0030159 | receptor signaling complex scaffold activity(GO:0030159) |
| 0.1 | 0.9 | GO:0008865 | glucokinase activity(GO:0004340) hexokinase activity(GO:0004396) fructokinase activity(GO:0008865) mannokinase activity(GO:0019158) |
| 0.1 | 0.5 | GO:0045131 | pre-mRNA branch point binding(GO:0045131) |
| 0.1 | 2.1 | GO:0035925 | mRNA 3'-UTR AU-rich region binding(GO:0035925) |
| 0.1 | 2.3 | GO:0001056 | RNA polymerase III activity(GO:0001056) |
| 0.1 | 0.4 | GO:0048273 | mitogen-activated protein kinase p38 binding(GO:0048273) |
| 0.1 | 0.4 | GO:0015154 | sucrose:proton symporter activity(GO:0008506) sucrose transmembrane transporter activity(GO:0008515) disaccharide transmembrane transporter activity(GO:0015154) oligosaccharide transmembrane transporter activity(GO:0015157) |
| 0.1 | 3.9 | GO:0004683 | calmodulin-dependent protein kinase activity(GO:0004683) |
| 0.1 | 0.6 | GO:0032184 | SUMO polymer binding(GO:0032184) |
| 0.1 | 1.6 | GO:0003836 | beta-galactoside (CMP) alpha-2,3-sialyltransferase activity(GO:0003836) |
| 0.1 | 15.3 | GO:0043130 | ubiquitin binding(GO:0043130) |
| 0.1 | 0.8 | GO:0048406 | nerve growth factor binding(GO:0048406) |
| 0.1 | 0.3 | GO:0050309 | glucose-6-phosphatase activity(GO:0004346) sugar-terminal-phosphatase activity(GO:0050309) |
| 0.1 | 1.6 | GO:0001223 | transcription coactivator binding(GO:0001223) |
| 0.1 | 0.7 | GO:0015235 | cobalamin transporter activity(GO:0015235) |
| 0.1 | 1.7 | GO:0001206 | transcriptional repressor activity, RNA polymerase II distal enhancer sequence-specific binding(GO:0001206) |
| 0.1 | 6.0 | GO:0019894 | kinesin binding(GO:0019894) |
| 0.1 | 5.1 | GO:0008137 | NADH dehydrogenase (ubiquinone) activity(GO:0008137) NADH dehydrogenase (quinone) activity(GO:0050136) |
| 0.1 | 6.0 | GO:0030507 | spectrin binding(GO:0030507) |
| 0.1 | 0.7 | GO:0016274 | arginine N-methyltransferase activity(GO:0016273) protein-arginine N-methyltransferase activity(GO:0016274) |
| 0.1 | 1.0 | GO:0033192 | calmodulin-dependent protein phosphatase activity(GO:0033192) |
| 0.1 | 0.6 | GO:0000179 | rRNA (adenine-N6,N6-)-dimethyltransferase activity(GO:0000179) |
| 0.1 | 0.2 | GO:0036033 | mediator complex binding(GO:0036033) |
| 0.1 | 0.7 | GO:1990405 | protein antigen binding(GO:1990405) |
| 0.1 | 0.4 | GO:0010484 | H3 histone acetyltransferase activity(GO:0010484) |
| 0.1 | 0.5 | GO:0004719 | protein-L-isoaspartate (D-aspartate) O-methyltransferase activity(GO:0004719) |
| 0.1 | 1.0 | GO:0070181 | small ribosomal subunit rRNA binding(GO:0070181) |
| 0.1 | 0.4 | GO:0003963 | RNA-3'-phosphate cyclase activity(GO:0003963) |
| 0.1 | 1.1 | GO:0003857 | 3-hydroxyacyl-CoA dehydrogenase activity(GO:0003857) |
| 0.1 | 0.7 | GO:0070728 | leucine binding(GO:0070728) |
| 0.1 | 1.6 | GO:0042800 | histone methyltransferase activity (H3-K4 specific)(GO:0042800) |
| 0.1 | 0.6 | GO:0097603 | temperature-gated ion channel activity(GO:0097603) |
| 0.1 | 3.2 | GO:0005521 | lamin binding(GO:0005521) |
| 0.1 | 0.2 | GO:0086059 | voltage-gated calcium channel activity involved SA node cell action potential(GO:0086059) |
| 0.1 | 0.5 | GO:0051575 | 5'-deoxyribose-5-phosphate lyase activity(GO:0051575) |
| 0.1 | 0.8 | GO:0008553 | hydrogen-exporting ATPase activity, phosphorylative mechanism(GO:0008553) |
| 0.1 | 0.2 | GO:0016434 | rRNA (cytosine) methyltransferase activity(GO:0016434) |
| 0.1 | 1.5 | GO:0098847 | sequence-specific single stranded DNA binding(GO:0098847) |
| 0.1 | 0.5 | GO:0035473 | lipase binding(GO:0035473) |
| 0.1 | 0.5 | GO:0003923 | GPI-anchor transamidase activity(GO:0003923) |
| 0.1 | 0.6 | GO:0086083 | cell adhesive protein binding involved in bundle of His cell-Purkinje myocyte communication(GO:0086083) |
| 0.1 | 5.6 | GO:0004004 | ATP-dependent RNA helicase activity(GO:0004004) |
| 0.1 | 0.3 | GO:0016971 | flavin-linked sulfhydryl oxidase activity(GO:0016971) |
| 0.1 | 2.9 | GO:0004709 | MAP kinase kinase kinase activity(GO:0004709) |
| 0.1 | 4.1 | GO:0070063 | RNA polymerase binding(GO:0070063) |
| 0.1 | 8.4 | GO:0008307 | structural constituent of muscle(GO:0008307) |
| 0.1 | 0.2 | GO:0031716 | calcitonin receptor activity(GO:0004948) calcitonin receptor binding(GO:0031716) |
| 0.1 | 1.4 | GO:0008349 | MAP kinase kinase kinase kinase activity(GO:0008349) |
| 0.1 | 0.6 | GO:0016812 | hydrolase activity, acting on carbon-nitrogen (but not peptide) bonds, in cyclic amides(GO:0016812) |
| 0.1 | 0.2 | GO:0050146 | nucleoside phosphotransferase activity(GO:0050146) |
| 0.1 | 0.4 | GO:0003827 | alpha-1,3-mannosylglycoprotein 2-beta-N-acetylglucosaminyltransferase activity(GO:0003827) |
| 0.1 | 0.3 | GO:0015086 | cadmium ion transmembrane transporter activity(GO:0015086) cobalt ion transmembrane transporter activity(GO:0015087) lead ion transmembrane transporter activity(GO:0015094) ferrous iron uptake transmembrane transporter activity(GO:0015639) |
| 0.1 | 6.0 | GO:0004843 | thiol-dependent ubiquitin-specific protease activity(GO:0004843) |
| 0.1 | 2.3 | GO:0003841 | 1-acylglycerol-3-phosphate O-acyltransferase activity(GO:0003841) |
| 0.1 | 1.0 | GO:0016846 | carbon-sulfur lyase activity(GO:0016846) |
| 0.1 | 2.6 | GO:0008157 | protein phosphatase 1 binding(GO:0008157) |
| 0.1 | 1.0 | GO:0032182 | ubiquitin-like protein binding(GO:0032182) |
| 0.1 | 1.4 | GO:0019992 | diacylglycerol binding(GO:0019992) |
| 0.1 | 0.2 | GO:0004853 | uroporphyrinogen decarboxylase activity(GO:0004853) |
| 0.1 | 0.2 | GO:0070984 | SET domain binding(GO:0070984) |
| 0.1 | 0.7 | GO:0004118 | cGMP-stimulated cyclic-nucleotide phosphodiesterase activity(GO:0004118) |
| 0.1 | 0.3 | GO:1903136 | cuprous ion binding(GO:1903136) |
| 0.1 | 0.2 | GO:0038100 | nodal binding(GO:0038100) |
| 0.0 | 0.3 | GO:0008273 | calcium, potassium:sodium antiporter activity(GO:0008273) |
| 0.0 | 0.2 | GO:0004668 | protein-arginine deiminase activity(GO:0004668) |
| 0.0 | 0.4 | GO:0036132 | 13-prostaglandin reductase activity(GO:0036132) 15-oxoprostaglandin 13-oxidase activity(GO:0047522) |
| 0.0 | 0.5 | GO:0004972 | NMDA glutamate receptor activity(GO:0004972) |
| 0.0 | 0.3 | GO:0001888 | glucuronyl-galactosyl-proteoglycan 4-alpha-N-acetylglucosaminyltransferase activity(GO:0001888) |
| 0.0 | 0.3 | GO:0097027 | ubiquitin-protein transferase activator activity(GO:0097027) |
| 0.0 | 1.2 | GO:0003995 | acyl-CoA dehydrogenase activity(GO:0003995) |
| 0.0 | 14.7 | GO:0061630 | ubiquitin protein ligase activity(GO:0061630) |
| 0.0 | 0.2 | GO:0043183 | vascular endothelial growth factor receptor 1 binding(GO:0043183) |
| 0.0 | 0.1 | GO:0034416 | bisphosphoglycerate phosphatase activity(GO:0034416) |
| 0.0 | 0.1 | GO:0004416 | hydroxyacylglutathione hydrolase activity(GO:0004416) |
| 0.0 | 0.6 | GO:0070410 | co-SMAD binding(GO:0070410) |
| 0.0 | 0.2 | GO:0000026 | alpha-1,2-mannosyltransferase activity(GO:0000026) |
| 0.0 | 0.7 | GO:0030020 | extracellular matrix structural constituent conferring tensile strength(GO:0030020) |
| 0.0 | 0.3 | GO:0003964 | telomerase activity(GO:0003720) RNA-directed DNA polymerase activity(GO:0003964) |
| 0.0 | 0.3 | GO:0017162 | aryl hydrocarbon receptor binding(GO:0017162) |
| 0.0 | 1.4 | GO:0005212 | structural constituent of eye lens(GO:0005212) |
| 0.0 | 1.3 | GO:0008308 | voltage-gated anion channel activity(GO:0008308) |
| 0.0 | 0.2 | GO:0033829 | O-fucosylpeptide 3-beta-N-acetylglucosaminyltransferase activity(GO:0033829) |
| 0.0 | 2.3 | GO:0043531 | ADP binding(GO:0043531) |
| 0.0 | 0.4 | GO:0016618 | hydroxypyruvate reductase activity(GO:0016618) glyoxylate reductase (NADP) activity(GO:0030267) |
| 0.0 | 1.2 | GO:0071949 | FAD binding(GO:0071949) |
| 0.0 | 1.1 | GO:1990841 | promoter-specific chromatin binding(GO:1990841) |
| 0.0 | 0.6 | GO:0050700 | CARD domain binding(GO:0050700) |
| 0.0 | 0.2 | GO:0004301 | epoxide hydrolase activity(GO:0004301) |
| 0.0 | 0.6 | GO:0032050 | clathrin heavy chain binding(GO:0032050) |
| 0.0 | 0.4 | GO:0000213 | tRNA-intron endonuclease activity(GO:0000213) |
| 0.0 | 5.3 | GO:0031072 | heat shock protein binding(GO:0031072) |
| 0.0 | 1.8 | GO:0005109 | frizzled binding(GO:0005109) |
| 0.0 | 0.4 | GO:0033170 | DNA clamp loader activity(GO:0003689) protein-DNA loading ATPase activity(GO:0033170) |
| 0.0 | 0.5 | GO:0051864 | histone demethylase activity (H3-K36 specific)(GO:0051864) |
| 0.0 | 2.9 | GO:0008138 | protein tyrosine/serine/threonine phosphatase activity(GO:0008138) |
| 0.0 | 0.8 | GO:0070411 | I-SMAD binding(GO:0070411) |
| 0.0 | 1.2 | GO:0016676 | cytochrome-c oxidase activity(GO:0004129) heme-copper terminal oxidase activity(GO:0015002) oxidoreductase activity, acting on a heme group of donors(GO:0016675) oxidoreductase activity, acting on a heme group of donors, oxygen as acceptor(GO:0016676) |
| 0.0 | 0.1 | GO:0005459 | UDP-galactose transmembrane transporter activity(GO:0005459) |
| 0.0 | 2.2 | GO:0042826 | histone deacetylase binding(GO:0042826) |
| 0.0 | 0.6 | GO:0016861 | intramolecular oxidoreductase activity, interconverting aldoses and ketoses(GO:0016861) |
| 0.0 | 0.2 | GO:0016230 | sphingomyelin phosphodiesterase activator activity(GO:0016230) |
| 0.0 | 0.5 | GO:0005007 | fibroblast growth factor-activated receptor activity(GO:0005007) |
| 0.0 | 0.5 | GO:0047429 | nucleoside-triphosphate diphosphatase activity(GO:0047429) |
| 0.0 | 0.4 | GO:0044323 | retinoic acid-responsive element binding(GO:0044323) |
| 0.0 | 1.5 | GO:0036459 | thiol-dependent ubiquitinyl hydrolase activity(GO:0036459) |
| 0.0 | 0.9 | GO:0070034 | telomerase RNA binding(GO:0070034) |
| 0.0 | 1.5 | GO:0051539 | 4 iron, 4 sulfur cluster binding(GO:0051539) |
| 0.0 | 2.1 | GO:0004177 | aminopeptidase activity(GO:0004177) |
| 0.0 | 1.0 | GO:0001965 | G-protein alpha-subunit binding(GO:0001965) |
| 0.0 | 0.1 | GO:0005019 | platelet-derived growth factor beta-receptor activity(GO:0005019) |
| 0.0 | 0.9 | GO:0030515 | snoRNA binding(GO:0030515) |
| 0.0 | 0.2 | GO:0005168 | neurotrophin TRKA receptor binding(GO:0005168) |
| 0.0 | 0.8 | GO:0019843 | rRNA binding(GO:0019843) |
| 0.0 | 9.0 | GO:0003713 | transcription coactivator activity(GO:0003713) |
| 0.0 | 6.6 | GO:0001078 | transcriptional repressor activity, RNA polymerase II core promoter proximal region sequence-specific binding(GO:0001078) |
| 0.0 | 0.2 | GO:0004300 | enoyl-CoA hydratase activity(GO:0004300) |
| 0.0 | 0.4 | GO:0030280 | structural constituent of epidermis(GO:0030280) |
| 0.0 | 0.4 | GO:0015279 | store-operated calcium channel activity(GO:0015279) |
| 0.0 | 0.8 | GO:0042162 | telomeric DNA binding(GO:0042162) |
| 0.0 | 0.5 | GO:0008140 | cAMP response element binding protein binding(GO:0008140) |
| 0.0 | 0.8 | GO:0043395 | heparan sulfate proteoglycan binding(GO:0043395) |
| 0.0 | 0.4 | GO:0008517 | folic acid transporter activity(GO:0008517) |
| 0.0 | 0.7 | GO:0008327 | methyl-CpG binding(GO:0008327) |
| 0.0 | 0.5 | GO:0015101 | organic cation transmembrane transporter activity(GO:0015101) |
| 0.0 | 0.1 | GO:0004161 | dimethylallyltranstransferase activity(GO:0004161) geranyltranstransferase activity(GO:0004337) |
| 0.0 | 1.4 | GO:0016279 | protein-lysine N-methyltransferase activity(GO:0016279) |
| 0.0 | 1.6 | GO:0016303 | 1-phosphatidylinositol-3-kinase activity(GO:0016303) |
| 0.0 | 0.2 | GO:0001640 | adenylate cyclase inhibiting G-protein coupled glutamate receptor activity(GO:0001640) G-protein coupled glutamate receptor activity(GO:0098988) |
| 0.0 | 9.6 | GO:0003712 | transcription cofactor activity(GO:0003712) |
| 0.0 | 0.6 | GO:0005344 | oxygen transporter activity(GO:0005344) |
| 0.0 | 0.5 | GO:0043225 | anion transmembrane-transporting ATPase activity(GO:0043225) |
| 0.0 | 0.1 | GO:0004483 | mRNA (nucleoside-2'-O-)-methyltransferase activity(GO:0004483) |
| 0.0 | 0.6 | GO:0051537 | 2 iron, 2 sulfur cluster binding(GO:0051537) |
| 0.0 | 0.3 | GO:0004985 | opioid receptor activity(GO:0004985) |
| 0.0 | 0.1 | GO:0004515 | nicotinate-nucleotide adenylyltransferase activity(GO:0004515) |
| 0.0 | 1.1 | GO:0005123 | death receptor binding(GO:0005123) |
| 0.0 | 0.2 | GO:0004095 | carnitine O-palmitoyltransferase activity(GO:0004095) |
| 0.0 | 0.1 | GO:0043008 | ATP-dependent protein binding(GO:0043008) |
| 0.0 | 0.6 | GO:0051430 | corticotropin-releasing hormone receptor 1 binding(GO:0051430) |
| 0.0 | 1.0 | GO:0016896 | 3'-5'-exoribonuclease activity(GO:0000175) exoribonuclease activity, producing 5'-phosphomonoesters(GO:0016896) |
| 0.0 | 0.7 | GO:0005545 | 1-phosphatidylinositol binding(GO:0005545) |
| 0.0 | 0.3 | GO:0097371 | MDM2/MDM4 family protein binding(GO:0097371) |
| 0.0 | 0.4 | GO:0008432 | JUN kinase binding(GO:0008432) |
| 0.0 | 0.1 | GO:0098821 | BMP receptor activity(GO:0098821) |
| 0.0 | 0.9 | GO:0015269 | calcium-activated potassium channel activity(GO:0015269) |
| 0.0 | 0.2 | GO:0002162 | dystroglycan binding(GO:0002162) |
| 0.0 | 0.4 | GO:0052629 | phosphatidylinositol-3,5-bisphosphate 3-phosphatase activity(GO:0052629) |
| 0.0 | 0.1 | GO:0051748 | UTP:glucose-1-phosphate uridylyltransferase activity(GO:0003983) UTP-monosaccharide-1-phosphate uridylyltransferase activity(GO:0051748) |
| 0.0 | 0.4 | GO:0051019 | mitogen-activated protein kinase binding(GO:0051019) |
| 0.0 | 0.4 | GO:0003899 | DNA-directed RNA polymerase activity(GO:0003899) |
| 0.0 | 1.3 | GO:0030971 | receptor tyrosine kinase binding(GO:0030971) |
| 0.0 | 1.0 | GO:0030676 | Rac guanyl-nucleotide exchange factor activity(GO:0030676) |
| 0.0 | 0.1 | GO:0061769 | ribosylnicotinamide kinase activity(GO:0050262) ribosylnicotinate kinase activity(GO:0061769) |
| 0.0 | 0.1 | GO:0016361 | activin receptor activity, type I(GO:0016361) |
| 0.0 | 0.3 | GO:0015187 | glycine transmembrane transporter activity(GO:0015187) |
| 0.0 | 0.1 | GO:0015321 | sodium-dependent phosphate transmembrane transporter activity(GO:0015321) |
| 0.0 | 0.4 | GO:0055056 | D-glucose transmembrane transporter activity(GO:0055056) |
| 0.0 | 0.3 | GO:0080025 | phosphatidylinositol-3,5-bisphosphate binding(GO:0080025) |
| 0.0 | 0.7 | GO:0004198 | calcium-dependent cysteine-type endopeptidase activity(GO:0004198) |
| 0.0 | 0.5 | GO:0016805 | dipeptidase activity(GO:0016805) |
| 0.0 | 0.2 | GO:0003835 | beta-galactoside alpha-2,6-sialyltransferase activity(GO:0003835) |
| 0.0 | 1.0 | GO:0032266 | phosphatidylinositol-3-phosphate binding(GO:0032266) |
| 0.0 | 0.2 | GO:0035252 | UDP-xylosyltransferase activity(GO:0035252) xylosyltransferase activity(GO:0042285) |
| 0.0 | 3.8 | GO:0003735 | structural constituent of ribosome(GO:0003735) |
| 0.0 | 0.2 | GO:0000774 | adenyl-nucleotide exchange factor activity(GO:0000774) |
| 0.0 | 0.2 | GO:0019789 | SUMO transferase activity(GO:0019789) |
| 0.0 | 1.6 | GO:0008565 | protein transporter activity(GO:0008565) |
| 0.0 | 1.4 | GO:0030276 | clathrin binding(GO:0030276) |
| 0.0 | 0.2 | GO:0035612 | AP-2 adaptor complex binding(GO:0035612) |
| 0.0 | 0.4 | GO:0070064 | proline-rich region binding(GO:0070064) |
| 0.0 | 0.4 | GO:0016875 | aminoacyl-tRNA ligase activity(GO:0004812) ligase activity, forming carbon-oxygen bonds(GO:0016875) ligase activity, forming aminoacyl-tRNA and related compounds(GO:0016876) |
| 0.0 | 1.3 | GO:0015179 | L-amino acid transmembrane transporter activity(GO:0015179) |
| 0.0 | 0.3 | GO:0051428 | peptide hormone receptor binding(GO:0051428) |
| 0.0 | 0.2 | GO:0003688 | DNA replication origin binding(GO:0003688) |
| 0.0 | 0.6 | GO:0051721 | protein phosphatase 2A binding(GO:0051721) |
| 0.0 | 0.5 | GO:0015248 | sterol transporter activity(GO:0015248) |
| 0.0 | 0.1 | GO:0046624 | sphingolipid transporter activity(GO:0046624) |
| 0.0 | 0.3 | GO:0004993 | G-protein coupled serotonin receptor activity(GO:0004993) |
| 0.0 | 0.2 | GO:0086008 | voltage-gated potassium channel activity involved in cardiac muscle cell action potential repolarization(GO:0086008) |
| 0.0 | 0.1 | GO:0004983 | neuropeptide Y receptor activity(GO:0004983) |
| 0.0 | 0.2 | GO:0008429 | phosphatidylethanolamine binding(GO:0008429) |
| 0.0 | 0.2 | GO:0017166 | vinculin binding(GO:0017166) |
| 0.0 | 0.1 | GO:0016900 | oxidoreductase activity, acting on the CH-OH group of donors, disulfide as acceptor(GO:0016900) vitamin-K-epoxide reductase (warfarin-sensitive) activity(GO:0047057) |
Gene overrepresentation in curated gene sets: canonical pathways category:
| Log-likelihood per target | Total log-likelihood | Term | Description |
|---|---|---|---|
| 0.3 | 8.8 | PID P38 GAMMA DELTA PATHWAY | Signaling mediated by p38-gamma and p38-delta |
| 0.3 | 1.2 | PID IL2 PI3K PATHWAY | IL2 signaling events mediated by PI3K |
| 0.2 | 1.7 | PID MET PATHWAY | Signaling events mediated by Hepatocyte Growth Factor Receptor (c-Met) |
| 0.2 | 10.2 | PID HDAC CLASSIII PATHWAY | Signaling events mediated by HDAC Class III |
| 0.2 | 9.9 | PID SMAD2 3PATHWAY | Regulation of cytoplasmic and nuclear SMAD2/3 signaling |
| 0.2 | 1.3 | PID PI3KCI AKT PATHWAY | Class I PI3K signaling events mediated by Akt |
| 0.2 | 8.5 | PID RETINOIC ACID PATHWAY | Retinoic acid receptors-mediated signaling |
| 0.2 | 15.4 | PID ARF6 TRAFFICKING PATHWAY | Arf6 trafficking events |
| 0.2 | 13.9 | PID HNF3B PATHWAY | FOXA2 and FOXA3 transcription factor networks |
| 0.1 | 0.8 | PID INSULIN PATHWAY | Insulin Pathway |
| 0.1 | 11.1 | PID IFNG PATHWAY | IFN-gamma pathway |
| 0.1 | 2.7 | PID CIRCADIAN PATHWAY | Circadian rhythm pathway |
| 0.1 | 1.8 | ST PAC1 RECEPTOR PATHWAY | PAC1 Receptor Pathway |
| 0.1 | 4.7 | PID BETA CATENIN DEG PATHWAY | Degradation of beta catenin |
| 0.1 | 7.0 | PID BARD1 PATHWAY | BARD1 signaling events |
| 0.1 | 0.9 | PID ALK2 PATHWAY | ALK2 signaling events |
| 0.1 | 9.5 | PID P53 REGULATION PATHWAY | p53 pathway |
| 0.1 | 2.4 | PID ERB GENOMIC PATHWAY | Validated nuclear estrogen receptor beta network |
| 0.1 | 11.4 | PID RB 1PATHWAY | Regulation of retinoblastoma protein |
| 0.1 | 3.3 | PID FOXO PATHWAY | FoxO family signaling |
| 0.1 | 4.8 | ST P38 MAPK PATHWAY | p38 MAPK Pathway |
| 0.1 | 2.6 | PID HIF1A PATHWAY | Hypoxic and oxygen homeostasis regulation of HIF-1-alpha |
| 0.1 | 6.6 | PID ATF2 PATHWAY | ATF-2 transcription factor network |
| 0.1 | 5.5 | SIG INSULIN RECEPTOR PATHWAY IN CARDIAC MYOCYTES | Genes related to the insulin receptor pathway |
| 0.1 | 0.7 | ST INTERFERON GAMMA PATHWAY | Interferon gamma pathway. |
| 0.1 | 0.8 | PID HDAC CLASSII PATHWAY | Signaling events mediated by HDAC Class II |
| 0.1 | 4.0 | PID AR TF PATHWAY | Regulation of Androgen receptor activity |
| 0.1 | 2.5 | PID EPO PATHWAY | EPO signaling pathway |
| 0.1 | 0.8 | PID FAK PATHWAY | Signaling events mediated by focal adhesion kinase |
| 0.1 | 6.8 | PID ERA GENOMIC PATHWAY | Validated nuclear estrogen receptor alpha network |
| 0.1 | 4.2 | PID HNF3A PATHWAY | FOXA1 transcription factor network |
| 0.1 | 1.0 | PID FRA PATHWAY | Validated transcriptional targets of AP1 family members Fra1 and Fra2 |
| 0.1 | 7.5 | PID MTOR 4PATHWAY | mTOR signaling pathway |
| 0.1 | 3.0 | ST JNK MAPK PATHWAY | JNK MAPK Pathway |
| 0.1 | 0.9 | PID PTP1B PATHWAY | Signaling events mediated by PTP1B |
| 0.1 | 0.3 | PID TCR JNK PATHWAY | JNK signaling in the CD4+ TCR pathway |
| 0.1 | 2.9 | PID ERBB2 ERBB3 PATHWAY | ErbB2/ErbB3 signaling events |
| 0.1 | 2.6 | PID HES HEY PATHWAY | Notch-mediated HES/HEY network |
| 0.1 | 0.6 | ST PHOSPHOINOSITIDE 3 KINASE PATHWAY | PI3K Pathway |
| 0.1 | 1.8 | PID PRL SIGNALING EVENTS PATHWAY | Signaling events mediated by PRL |
| 0.1 | 1.6 | PID NECTIN PATHWAY | Nectin adhesion pathway |
| 0.1 | 5.9 | PID MYC ACTIV PATHWAY | Validated targets of C-MYC transcriptional activation |
| 0.0 | 3.8 | PID HIF1 TFPATHWAY | HIF-1-alpha transcription factor network |
| 0.0 | 4.6 | PID ILK PATHWAY | Integrin-linked kinase signaling |
| 0.0 | 1.0 | PID RAS PATHWAY | Regulation of Ras family activation |
| 0.0 | 0.7 | PID P38 MKK3 6PATHWAY | p38 MAPK signaling pathway |
| 0.0 | 1.9 | PID LKB1 PATHWAY | LKB1 signaling events |
| 0.0 | 3.9 | PID CMYB PATHWAY | C-MYB transcription factor network |
| 0.0 | 0.9 | PID DNA PK PATHWAY | DNA-PK pathway in nonhomologous end joining |
| 0.0 | 2.9 | PID CD8 TCR PATHWAY | TCR signaling in naïve CD8+ T cells |
| 0.0 | 0.4 | PID MYC PATHWAY | C-MYC pathway |
| 0.0 | 0.6 | PID MAPK TRK PATHWAY | Trk receptor signaling mediated by the MAPK pathway |
| 0.0 | 1.2 | PID BMP PATHWAY | BMP receptor signaling |
| 0.0 | 2.3 | PID REG GR PATHWAY | Glucocorticoid receptor regulatory network |
| 0.0 | 4.7 | PID P53 DOWNSTREAM PATHWAY | Direct p53 effectors |
| 0.0 | 1.3 | PID IL12 2PATHWAY | IL12-mediated signaling events |
| 0.0 | 1.9 | SIG CHEMOTAXIS | Genes related to chemotaxis |
| 0.0 | 0.3 | PID ERBB1 RECEPTOR PROXIMAL PATHWAY | EGF receptor (ErbB1) signaling pathway |
| 0.0 | 1.0 | PID DELTA NP63 PATHWAY | Validated transcriptional targets of deltaNp63 isoforms |
| 0.0 | 2.0 | WNT SIGNALING | Genes related to Wnt-mediated signal transduction |
| 0.0 | 1.3 | PID SHP2 PATHWAY | SHP2 signaling |
| 0.0 | 0.3 | PID SYNDECAN 2 PATHWAY | Syndecan-2-mediated signaling events |
| 0.0 | 0.2 | PID EPHRINB REV PATHWAY | Ephrin B reverse signaling |
| 0.0 | 0.0 | PID IL2 STAT5 PATHWAY | IL2 signaling events mediated by STAT5 |
| 0.0 | 0.6 | PID P75 NTR PATHWAY | p75(NTR)-mediated signaling |
| 0.0 | 0.4 | PID TRAIL PATHWAY | TRAIL signaling pathway |
| 0.0 | 0.3 | PID CD8 TCR DOWNSTREAM PATHWAY | Downstream signaling in naïve CD8+ T cells |
| 0.0 | 0.5 | PID ECADHERIN NASCENT AJ PATHWAY | E-cadherin signaling in the nascent adherens junction |
| 0.0 | 1.0 | PID AVB3 INTEGRIN PATHWAY | Integrins in angiogenesis |
Gene overrepresentation in curated gene sets: REACTOME pathways category:
| Log-likelihood per target | Total log-likelihood | Term | Description |
|---|---|---|---|
| 0.4 | 1.5 | REACTOME SOS MEDIATED SIGNALLING | Genes involved in SOS-mediated signalling |
| 0.4 | 26.8 | REACTOME STRIATED MUSCLE CONTRACTION | Genes involved in Striated Muscle Contraction |
| 0.4 | 13.0 | REACTOME PLATELET CALCIUM HOMEOSTASIS | Genes involved in Platelet calcium homeostasis |
| 0.3 | 6.2 | REACTOME DSCAM INTERACTIONS | Genes involved in DSCAM interactions |
| 0.3 | 12.4 | REACTOME SEMA4D INDUCED CELL MIGRATION AND GROWTH CONE COLLAPSE | Genes involved in Sema4D induced cell migration and growth-cone collapse |
| 0.2 | 2.1 | REACTOME CYTOSOLIC TRNA AMINOACYLATION | Genes involved in Cytosolic tRNA aminoacylation |
| 0.2 | 3.4 | REACTOME APOPTOSIS INDUCED DNA FRAGMENTATION | Genes involved in Apoptosis induced DNA fragmentation |
| 0.2 | 4.8 | REACTOME MTORC1 MEDIATED SIGNALLING | Genes involved in mTORC1-mediated signalling |
| 0.2 | 8.4 | REACTOME CELL EXTRACELLULAR MATRIX INTERACTIONS | Genes involved in Cell-extracellular matrix interactions |
| 0.2 | 11.7 | REACTOME DOWNREGULATION OF SMAD2 3 SMAD4 TRANSCRIPTIONAL ACTIVITY | Genes involved in Downregulation of SMAD2/3:SMAD4 transcriptional activity |
| 0.2 | 5.7 | REACTOME GLYCOGEN BREAKDOWN GLYCOGENOLYSIS | Genes involved in Glycogen breakdown (glycogenolysis) |
| 0.2 | 8.3 | REACTOME KINESINS | Genes involved in Kinesins |
| 0.2 | 1.9 | REACTOME SCF BETA TRCP MEDIATED DEGRADATION OF EMI1 | Genes involved in SCF-beta-TrCP mediated degradation of Emi1 |
| 0.2 | 12.2 | REACTOME VIF MEDIATED DEGRADATION OF APOBEC3G | Genes involved in Vif-mediated degradation of APOBEC3G |
| 0.2 | 3.4 | REACTOME REGULATION OF PYRUVATE DEHYDROGENASE PDH COMPLEX | Genes involved in Regulation of pyruvate dehydrogenase (PDH) complex |
| 0.2 | 5.7 | REACTOME RAS ACTIVATION UOPN CA2 INFUX THROUGH NMDA RECEPTOR | Genes involved in Ras activation uopn Ca2+ infux through NMDA receptor |
| 0.2 | 1.4 | REACTOME RNA POL I PROMOTER OPENING | Genes involved in RNA Polymerase I Promoter Opening |
| 0.2 | 7.6 | REACTOME SIGNALING BY FGFR1 FUSION MUTANTS | Genes involved in Signaling by FGFR1 fusion mutants |
| 0.2 | 2.9 | REACTOME MITOCHONDRIAL FATTY ACID BETA OXIDATION | Genes involved in Mitochondrial Fatty Acid Beta-Oxidation |
| 0.2 | 0.3 | REACTOME REGULATION OF RHEB GTPASE ACTIVITY BY AMPK | Genes involved in Regulation of Rheb GTPase activity by AMPK |
| 0.1 | 0.9 | REACTOME ELONGATION ARREST AND RECOVERY | Genes involved in Elongation arrest and recovery |
| 0.1 | 2.8 | REACTOME GLUCOSE TRANSPORT | Genes involved in Glucose transport |
| 0.1 | 2.3 | REACTOME RNA POL III CHAIN ELONGATION | Genes involved in RNA Polymerase III Chain Elongation |
| 0.1 | 1.5 | REACTOME APOBEC3G MEDIATED RESISTANCE TO HIV1 INFECTION | Genes involved in APOBEC3G mediated resistance to HIV-1 infection |
| 0.1 | 3.2 | REACTOME ARMS MEDIATED ACTIVATION | Genes involved in ARMS-mediated activation |
| 0.1 | 5.0 | REACTOME CASPASE MEDIATED CLEAVAGE OF CYTOSKELETAL PROTEINS | Genes involved in Caspase-mediated cleavage of cytoskeletal proteins |
| 0.1 | 2.2 | REACTOME ETHANOL OXIDATION | Genes involved in Ethanol oxidation |
| 0.1 | 8.5 | REACTOME AMINO ACID TRANSPORT ACROSS THE PLASMA MEMBRANE | Genes involved in Amino acid transport across the plasma membrane |
| 0.1 | 3.1 | REACTOME CITRIC ACID CYCLE TCA CYCLE | Genes involved in Citric acid cycle (TCA cycle) |
| 0.1 | 3.8 | REACTOME ABORTIVE ELONGATION OF HIV1 TRANSCRIPT IN THE ABSENCE OF TAT | Genes involved in Abortive elongation of HIV-1 transcript in the absence of Tat |
| 0.1 | 2.3 | REACTOME PROLACTIN RECEPTOR SIGNALING | Genes involved in Prolactin receptor signaling |
| 0.1 | 8.7 | REACTOME RESPIRATORY ELECTRON TRANSPORT ATP SYNTHESIS BY CHEMIOSMOTIC COUPLING AND HEAT PRODUCTION BY UNCOUPLING PROTEINS | Genes involved in Respiratory electron transport, ATP synthesis by chemiosmotic coupling, and heat production by uncoupling proteins. |
| 0.1 | 1.2 | REACTOME JNK C JUN KINASES PHOSPHORYLATION AND ACTIVATION MEDIATED BY ACTIVATED HUMAN TAK1 | Genes involved in JNK (c-Jun kinases) phosphorylation and activation mediated by activated human TAK1 |
| 0.1 | 6.3 | REACTOME BMAL1 CLOCK NPAS2 ACTIVATES CIRCADIAN EXPRESSION | Genes involved in BMAL1:CLOCK/NPAS2 Activates Circadian Expression |
| 0.1 | 3.7 | REACTOME SYNTHESIS AND INTERCONVERSION OF NUCLEOTIDE DI AND TRIPHOSPHATES | Genes involved in Synthesis and interconversion of nucleotide di- and triphosphates |
| 0.1 | 0.5 | REACTOME ACYL CHAIN REMODELLING OF PG | Genes involved in Acyl chain remodelling of PG |
| 0.1 | 6.6 | REACTOME METABOLISM OF NON CODING RNA | Genes involved in Metabolism of non-coding RNA |
| 0.1 | 4.9 | REACTOME INTERACTION BETWEEN L1 AND ANKYRINS | Genes involved in Interaction between L1 and Ankyrins |
| 0.1 | 1.5 | REACTOME ERKS ARE INACTIVATED | Genes involved in ERKs are inactivated |
| 0.1 | 1.5 | REACTOME PURINE RIBONUCLEOSIDE MONOPHOSPHATE BIOSYNTHESIS | Genes involved in Purine ribonucleoside monophosphate biosynthesis |
| 0.1 | 2.0 | REACTOME SYNTHESIS OF PE | Genes involved in Synthesis of PE |
| 0.1 | 5.9 | REACTOME FORMATION OF THE TERNARY COMPLEX AND SUBSEQUENTLY THE 43S COMPLEX | Genes involved in Formation of the ternary complex, and subsequently, the 43S complex |
| 0.1 | 1.2 | REACTOME ACTIVATION OF THE MRNA UPON BINDING OF THE CAP BINDING COMPLEX AND EIFS AND SUBSEQUENT BINDING TO 43S | Genes involved in Activation of the mRNA upon binding of the cap-binding complex and eIFs, and subsequent binding to 43S |
| 0.1 | 3.1 | REACTOME KERATAN SULFATE BIOSYNTHESIS | Genes involved in Keratan sulfate biosynthesis |
| 0.1 | 3.3 | REACTOME ANTIVIRAL MECHANISM BY IFN STIMULATED GENES | Genes involved in Antiviral mechanism by IFN-stimulated genes |
| 0.1 | 2.3 | REACTOME AMINO ACID SYNTHESIS AND INTERCONVERSION TRANSAMINATION | Genes involved in Amino acid synthesis and interconversion (transamination) |
| 0.1 | 2.0 | REACTOME ACTIVATED TAK1 MEDIATES P38 MAPK ACTIVATION | Genes involved in activated TAK1 mediates p38 MAPK activation |
| 0.1 | 2.1 | REACTOME SIGNALING BY NODAL | Genes involved in Signaling by NODAL |
| 0.1 | 2.5 | REACTOME TRANSCRIPTIONAL ACTIVITY OF SMAD2 SMAD3 SMAD4 HETEROTRIMER | Genes involved in Transcriptional activity of SMAD2/SMAD3:SMAD4 heterotrimer |
| 0.1 | 0.8 | REACTOME ERK MAPK TARGETS | Genes involved in ERK/MAPK targets |
| 0.1 | 1.0 | REACTOME ABACAVIR TRANSPORT AND METABOLISM | Genes involved in Abacavir transport and metabolism |
| 0.1 | 1.5 | REACTOME OXYGEN DEPENDENT PROLINE HYDROXYLATION OF HYPOXIA INDUCIBLE FACTOR ALPHA | Genes involved in Oxygen-dependent Proline Hydroxylation of Hypoxia-inducible Factor Alpha |
| 0.1 | 2.8 | REACTOME HORMONE SENSITIVE LIPASE HSL MEDIATED TRIACYLGLYCEROL HYDROLYSIS | Genes involved in Hormone-sensitive lipase (HSL)-mediated triacylglycerol hydrolysis |
| 0.1 | 0.7 | REACTOME REGULATION OF ORNITHINE DECARBOXYLASE ODC | Genes involved in Regulation of ornithine decarboxylase (ODC) |
| 0.1 | 1.3 | REACTOME IL 7 SIGNALING | Genes involved in Interleukin-7 signaling |
| 0.1 | 2.8 | REACTOME SYNTHESIS OF PA | Genes involved in Synthesis of PA |
| 0.1 | 1.3 | REACTOME NFKB ACTIVATION THROUGH FADD RIP1 PATHWAY MEDIATED BY CASPASE 8 AND10 | Genes involved in NF-kB activation through FADD/RIP-1 pathway mediated by caspase-8 and -10 |
| 0.1 | 4.3 | REACTOME INWARDLY RECTIFYING K CHANNELS | Genes involved in Inwardly rectifying K+ channels |
| 0.1 | 1.2 | REACTOME CTNNB1 PHOSPHORYLATION CASCADE | Genes involved in Beta-catenin phosphorylation cascade |
| 0.1 | 4.1 | REACTOME REGULATION OF MRNA STABILITY BY PROTEINS THAT BIND AU RICH ELEMENTS | Genes involved in Regulation of mRNA Stability by Proteins that Bind AU-rich Elements |
| 0.1 | 6.7 | REACTOME GOLGI ASSOCIATED VESICLE BIOGENESIS | Genes involved in Golgi Associated Vesicle Biogenesis |
| 0.1 | 0.5 | REACTOME REGULATION OF HYPOXIA INDUCIBLE FACTOR HIF BY OXYGEN | Genes involved in Regulation of Hypoxia-inducible Factor (HIF) by Oxygen |
| 0.1 | 0.5 | REACTOME INTEGRATION OF PROVIRUS | Genes involved in Integration of provirus |
| 0.0 | 1.6 | REACTOME SIGNALING BY HIPPO | Genes involved in Signaling by Hippo |
| 0.0 | 1.4 | REACTOME SYNTHESIS OF GLYCOSYLPHOSPHATIDYLINOSITOL GPI | Genes involved in Synthesis of glycosylphosphatidylinositol (GPI) |
| 0.0 | 0.9 | REACTOME YAP1 AND WWTR1 TAZ STIMULATED GENE EXPRESSION | Genes involved in YAP1- and WWTR1 (TAZ)-stimulated gene expression |
| 0.0 | 12.3 | REACTOME ANTIGEN PROCESSING UBIQUITINATION PROTEASOME DEGRADATION | Genes involved in Antigen processing: Ubiquitination & Proteasome degradation |
| 0.0 | 0.6 | REACTOME REPAIR SYNTHESIS FOR GAP FILLING BY DNA POL IN TC NER | Genes involved in Repair synthesis for gap-filling by DNA polymerase in TC-NER |
| 0.0 | 2.5 | REACTOME MITOCHONDRIAL PROTEIN IMPORT | Genes involved in Mitochondrial Protein Import |
| 0.0 | 0.5 | REACTOME RNA POL III TRANSCRIPTION INITIATION FROM TYPE 3 PROMOTER | Genes involved in RNA Polymerase III Transcription Initiation From Type 3 Promoter |
| 0.0 | 1.6 | REACTOME FORMATION OF INCISION COMPLEX IN GG NER | Genes involved in Formation of incision complex in GG-NER |
| 0.0 | 0.9 | REACTOME SYNTHESIS SECRETION AND DEACYLATION OF GHRELIN | Genes involved in Synthesis, Secretion, and Deacylation of Ghrelin |
| 0.0 | 1.2 | REACTOME G0 AND EARLY G1 | Genes involved in G0 and Early G1 |
| 0.0 | 2.1 | REACTOME PIP3 ACTIVATES AKT SIGNALING | Genes involved in PIP3 activates AKT signaling |
| 0.0 | 2.3 | REACTOME GLYCOLYSIS | Genes involved in Glycolysis |
| 0.0 | 0.5 | REACTOME RNA POL III TRANSCRIPTION INITIATION FROM TYPE 2 PROMOTER | Genes involved in RNA Polymerase III Transcription Initiation From Type 2 Promoter |
| 0.0 | 1.1 | REACTOME GRB2 SOS PROVIDES LINKAGE TO MAPK SIGNALING FOR INTERGRINS | Genes involved in GRB2:SOS provides linkage to MAPK signaling for Intergrins |
| 0.0 | 0.8 | REACTOME EGFR DOWNREGULATION | Genes involved in EGFR downregulation |
| 0.0 | 0.4 | REACTOME PLATELET SENSITIZATION BY LDL | Genes involved in Platelet sensitization by LDL |
| 0.0 | 0.8 | REACTOME REGULATION OF KIT SIGNALING | Genes involved in Regulation of KIT signaling |
| 0.0 | 0.6 | REACTOME NA CL DEPENDENT NEUROTRANSMITTER TRANSPORTERS | Genes involved in Na+/Cl- dependent neurotransmitter transporters |
| 0.0 | 2.9 | REACTOME MYOGENESIS | Genes involved in Myogenesis |
| 0.0 | 3.3 | REACTOME INFLUENZA VIRAL RNA TRANSCRIPTION AND REPLICATION | Genes involved in Influenza Viral RNA Transcription and Replication |
| 0.0 | 0.6 | REACTOME RETROGRADE NEUROTROPHIN SIGNALLING | Genes involved in Retrograde neurotrophin signalling |
| 0.0 | 1.6 | REACTOME ASSOCIATION OF TRIC CCT WITH TARGET PROTEINS DURING BIOSYNTHESIS | Genes involved in Association of TriC/CCT with target proteins during biosynthesis |
| 0.0 | 0.8 | REACTOME TRAF6 MEDIATED IRF7 ACTIVATION | Genes involved in TRAF6 mediated IRF7 activation |
| 0.0 | 1.2 | REACTOME ACTIVATED AMPK STIMULATES FATTY ACID OXIDATION IN MUSCLE | Genes involved in Activated AMPK stimulates fatty-acid oxidation in muscle |
| 0.0 | 0.5 | REACTOME POST TRANSLATIONAL MODIFICATION SYNTHESIS OF GPI ANCHORED PROTEINS | Genes involved in Post-translational modification: synthesis of GPI-anchored proteins |
| 0.0 | 0.3 | REACTOME GLYCOPROTEIN HORMONES | Genes involved in Glycoprotein hormones |
| 0.0 | 0.7 | REACTOME APOPTOTIC CLEAVAGE OF CELLULAR PROTEINS | Genes involved in Apoptotic cleavage of cellular proteins |
| 0.0 | 0.6 | REACTOME PROCESSING OF INTRONLESS PRE MRNAS | Genes involved in Processing of Intronless Pre-mRNAs |
| 0.0 | 0.6 | REACTOME PROSTACYCLIN SIGNALLING THROUGH PROSTACYCLIN RECEPTOR | Genes involved in Prostacyclin signalling through prostacyclin receptor |
| 0.0 | 0.9 | REACTOME INSULIN RECEPTOR RECYCLING | Genes involved in Insulin receptor recycling |
| 0.0 | 0.3 | REACTOME SIGNAL ATTENUATION | Genes involved in Signal attenuation |
| 0.0 | 2.6 | REACTOME TRANSCRIPTIONAL REGULATION OF WHITE ADIPOCYTE DIFFERENTIATION | Genes involved in Transcriptional Regulation of White Adipocyte Differentiation |
| 0.0 | 0.5 | REACTOME MRNA SPLICING MINOR PATHWAY | Genes involved in mRNA Splicing - Minor Pathway |
| 0.0 | 1.1 | REACTOME GLUTATHIONE CONJUGATION | Genes involved in Glutathione conjugation |
| 0.0 | 0.2 | REACTOME G ALPHA Z SIGNALLING EVENTS | Genes involved in G alpha (z) signalling events |
| 0.0 | 2.2 | REACTOME METABOLISM OF VITAMINS AND COFACTORS | Genes involved in Metabolism of vitamins and cofactors |
| 0.0 | 0.7 | REACTOME NONSENSE MEDIATED DECAY ENHANCED BY THE EXON JUNCTION COMPLEX | Genes involved in Nonsense Mediated Decay Enhanced by the Exon Junction Complex |
| 0.0 | 0.5 | REACTOME DEADENYLATION OF MRNA | Genes involved in Deadenylation of mRNA |
| 0.0 | 2.5 | REACTOME FACTORS INVOLVED IN MEGAKARYOCYTE DEVELOPMENT AND PLATELET PRODUCTION | Genes involved in Factors involved in megakaryocyte development and platelet production |
| 0.0 | 0.5 | REACTOME MITOCHONDRIAL TRNA AMINOACYLATION | Genes involved in Mitochondrial tRNA aminoacylation |
| 0.0 | 0.3 | REACTOME SEROTONIN RECEPTORS | Genes involved in Serotonin receptors |
| 0.0 | 0.2 | REACTOME CIRCADIAN CLOCK | Genes involved in Circadian Clock |
| 0.0 | 1.0 | REACTOME TRANSPORT OF VITAMINS NUCLEOSIDES AND RELATED MOLECULES | Genes involved in Transport of vitamins, nucleosides, and related molecules |
| 0.0 | 2.2 | REACTOME TRANSPORT OF INORGANIC CATIONS ANIONS AND AMINO ACIDS OLIGOPEPTIDES | Genes involved in Transport of inorganic cations/anions and amino acids/oligopeptides |
| 0.0 | 0.2 | REACTOME DEPOSITION OF NEW CENPA CONTAINING NUCLEOSOMES AT THE CENTROMERE | Genes involved in Deposition of New CENPA-containing Nucleosomes at the Centromere |
| 0.0 | 0.6 | REACTOME DOUBLE STRAND BREAK REPAIR | Genes involved in Double-Strand Break Repair |
| 0.0 | 0.5 | REACTOME HYALURONAN METABOLISM | Genes involved in Hyaluronan metabolism |
| 0.0 | 0.2 | REACTOME PRE NOTCH PROCESSING IN GOLGI | Genes involved in Pre-NOTCH Processing in Golgi |
| 0.0 | 2.6 | REACTOME METABOLISM OF AMINO ACIDS AND DERIVATIVES | Genes involved in Metabolism of amino acids and derivatives |
| 0.0 | 0.1 | REACTOME ACYL CHAIN REMODELLING OF PI | Genes involved in Acyl chain remodelling of PI |
| 0.0 | 0.3 | REACTOME EXTENSION OF TELOMERES | Genes involved in Extension of Telomeres |
| 0.0 | 1.4 | REACTOME MITOTIC PROMETAPHASE | Genes involved in Mitotic Prometaphase |
| 0.0 | 0.8 | REACTOME SIGNALING BY ROBO RECEPTOR | Genes involved in Signaling by Robo receptor |
| 0.0 | 0.1 | REACTOME SIGNALLING TO RAS | Genes involved in Signalling to RAS |
| 0.0 | 0.7 | REACTOME TRANSPORT TO THE GOLGI AND SUBSEQUENT MODIFICATION | Genes involved in Transport to the Golgi and subsequent modification |
| 0.0 | 0.2 | REACTOME CLASS C 3 METABOTROPIC GLUTAMATE PHEROMONE RECEPTORS | Genes involved in Class C/3 (Metabotropic glutamate/pheromone receptors) |
| 0.0 | 0.1 | REACTOME REGULATED PROTEOLYSIS OF P75NTR | Genes involved in Regulated proteolysis of p75NTR |
| 0.0 | 0.3 | REACTOME SIGNAL TRANSDUCTION BY L1 | Genes involved in Signal transduction by L1 |