Project
Illumina Body Map 2 (GSE30611)
Navigation
Downloads
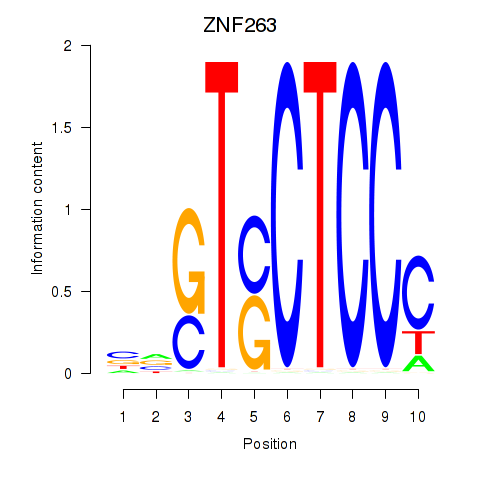
Results for ZNF263
Z-value: 1.83
Motif logo
Transcription factors associated with ZNF263
| Gene Symbol | Gene ID | Gene Info |
|---|---|---|
|
ZNF263
|
ENSG00000006194.10 | zinc finger protein 263 |
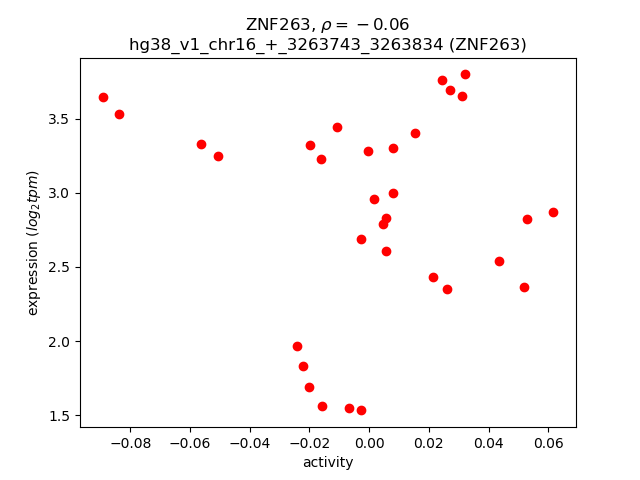
Activity-expression correlation:
| Gene | Promoter | Pearson corr. coef. | P-value | Plot |
|---|---|---|---|---|
| ZNF263 | hg38_v1_chr16_+_3263743_3263834 | -0.06 | 7.4e-01 | Click! |
Activity profile of ZNF263 motif
Sorted Z-values of ZNF263 motif
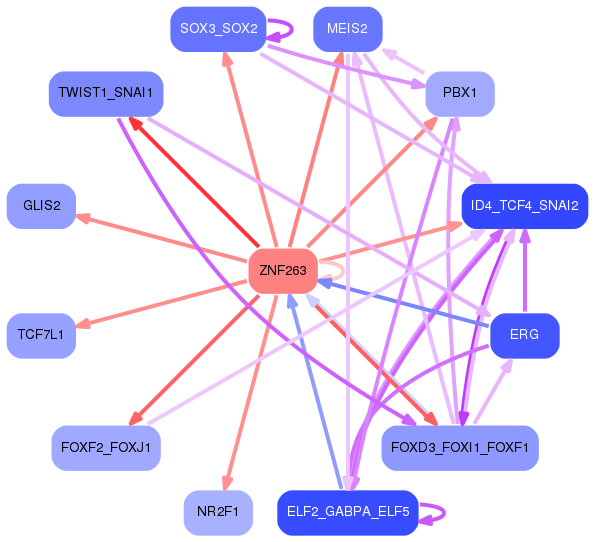
Network of associatons between targets according to the STRING database.

First level regulatory network of ZNF263
Gene Ontology Analysis
Gene overrepresentation in biological process category:
| Log-likelihood per target | Total log-likelihood | Term | Description |
|---|---|---|---|
| 1.8 | 5.3 | GO:1901492 | positive regulation of lymphangiogenesis(GO:1901492) |
| 1.5 | 4.4 | GO:1904956 | regulation of midbrain dopaminergic neuron differentiation(GO:1904956) |
| 1.2 | 3.7 | GO:0060981 | cell migration involved in coronary angiogenesis(GO:0060981) |
| 1.2 | 7.3 | GO:0090131 | mesenchyme migration(GO:0090131) |
| 1.2 | 3.5 | GO:2000276 | negative regulation of oxidative phosphorylation uncoupler activity(GO:2000276) cell proliferation involved in heart valve development(GO:2000793) |
| 1.1 | 3.3 | GO:0038162 | erythropoietin-mediated signaling pathway(GO:0038162) mast cell proliferation(GO:0070662) |
| 1.1 | 5.3 | GO:0061304 | retinal blood vessel morphogenesis(GO:0061304) |
| 0.9 | 3.5 | GO:0048749 | compound eye development(GO:0048749) |
| 0.8 | 5.1 | GO:0061760 | antifungal innate immune response(GO:0061760) |
| 0.8 | 5.9 | GO:2000860 | positive regulation of mineralocorticoid secretion(GO:2000857) positive regulation of aldosterone secretion(GO:2000860) |
| 0.8 | 3.2 | GO:0043006 | activation of phospholipase A2 activity by calcium-mediated signaling(GO:0043006) |
| 0.8 | 3.1 | GO:0044691 | tooth eruption(GO:0044691) |
| 0.8 | 3.9 | GO:0090341 | negative regulation of secretion of lysosomal enzymes(GO:0090341) |
| 0.8 | 1.5 | GO:0008050 | female courtship behavior(GO:0008050) |
| 0.8 | 10.5 | GO:0007621 | negative regulation of female receptivity(GO:0007621) |
| 0.7 | 4.4 | GO:0060994 | regulation of transcription from RNA polymerase II promoter involved in kidney development(GO:0060994) |
| 0.7 | 6.6 | GO:2000124 | regulation of endocannabinoid signaling pathway(GO:2000124) |
| 0.7 | 2.2 | GO:0070563 | negative regulation of vitamin D receptor signaling pathway(GO:0070563) |
| 0.7 | 5.2 | GO:0060455 | negative regulation of gastric acid secretion(GO:0060455) |
| 0.6 | 1.9 | GO:0030974 | thiamine pyrophosphate transport(GO:0030974) |
| 0.6 | 3.2 | GO:0097102 | endothelial tip cell fate specification(GO:0097102) |
| 0.6 | 8.5 | GO:0034465 | response to carbon monoxide(GO:0034465) |
| 0.6 | 4.8 | GO:0033591 | response to L-ascorbic acid(GO:0033591) |
| 0.6 | 1.7 | GO:0015920 | lipopolysaccharide transport(GO:0015920) |
| 0.6 | 1.1 | GO:0072190 | ureter urothelium development(GO:0072190) ureter morphogenesis(GO:0072197) |
| 0.6 | 1.7 | GO:0043465 | fermentation(GO:0006113) regulation of fermentation(GO:0043465) |
| 0.6 | 1.7 | GO:0002585 | positive regulation of antigen processing and presentation of peptide or polysaccharide antigen via MHC class II(GO:0002582) positive regulation of antigen processing and presentation of peptide antigen(GO:0002585) positive regulation of antigen processing and presentation of peptide antigen via MHC class II(GO:0002588) |
| 0.5 | 3.8 | GO:0086100 | endothelin receptor signaling pathway(GO:0086100) |
| 0.5 | 1.6 | GO:1903280 | negative regulation of calcium:sodium antiporter activity(GO:1903280) |
| 0.5 | 2.1 | GO:2000297 | negative regulation of synapse maturation(GO:2000297) |
| 0.5 | 4.8 | GO:0055064 | chloride ion homeostasis(GO:0055064) |
| 0.5 | 1.6 | GO:0045715 | negative regulation of low-density lipoprotein particle receptor biosynthetic process(GO:0045715) |
| 0.5 | 3.2 | GO:1902283 | negative regulation of primary amine oxidase activity(GO:1902283) |
| 0.5 | 3.6 | GO:0061364 | apoptotic process involved in luteolysis(GO:0061364) |
| 0.5 | 1.5 | GO:0035922 | pulmonary valve formation(GO:0003193) foramen ovale closure(GO:0035922) regulation of bundle of His cell action potential(GO:0098905) |
| 0.5 | 3.0 | GO:0015862 | uridine transport(GO:0015862) |
| 0.5 | 2.4 | GO:0007181 | transforming growth factor beta receptor complex assembly(GO:0007181) |
| 0.5 | 1.9 | GO:0048073 | regulation of eye pigmentation(GO:0048073) |
| 0.5 | 1.8 | GO:0032811 | negative regulation of epinephrine secretion(GO:0032811) epidermal growth factor-activated receptor transactivation by G-protein coupled receptor signaling pathway(GO:0035625) |
| 0.5 | 4.1 | GO:2001137 | positive regulation of endocytic recycling(GO:2001137) |
| 0.4 | 5.7 | GO:0048251 | elastic fiber assembly(GO:0048251) |
| 0.4 | 1.3 | GO:0001970 | positive regulation of activation of membrane attack complex(GO:0001970) |
| 0.4 | 3.0 | GO:1904862 | inhibitory synapse assembly(GO:1904862) |
| 0.4 | 1.7 | GO:2001226 | negative regulation of chloride transport(GO:2001226) |
| 0.4 | 0.4 | GO:1903526 | negative regulation of membrane tubulation(GO:1903526) |
| 0.4 | 2.1 | GO:0035426 | extracellular matrix-cell signaling(GO:0035426) |
| 0.4 | 1.2 | GO:0051387 | negative regulation of neurotrophin TRK receptor signaling pathway(GO:0051387) |
| 0.4 | 1.2 | GO:0036323 | vascular endothelial growth factor receptor-1 signaling pathway(GO:0036323) |
| 0.4 | 1.2 | GO:0061537 | glycine secretion(GO:0061536) glycine secretion, neurotransmission(GO:0061537) |
| 0.4 | 1.1 | GO:0070315 | G1 to G0 transition involved in cell differentiation(GO:0070315) |
| 0.4 | 1.5 | GO:0097112 | gamma-aminobutyric acid receptor clustering(GO:0097112) |
| 0.4 | 4.8 | GO:0030091 | protein repair(GO:0030091) |
| 0.4 | 1.1 | GO:0021793 | chemorepulsion of branchiomotor axon(GO:0021793) |
| 0.4 | 3.6 | GO:0060318 | regulation of definitive erythrocyte differentiation(GO:0010724) definitive erythrocyte differentiation(GO:0060318) |
| 0.3 | 1.4 | GO:0061443 | endocardial cushion cell differentiation(GO:0061443) |
| 0.3 | 1.4 | GO:0006781 | succinyl-CoA pathway(GO:0006781) |
| 0.3 | 1.0 | GO:0071504 | cellular response to heparin(GO:0071504) |
| 0.3 | 1.0 | GO:0032304 | negative regulation of icosanoid secretion(GO:0032304) |
| 0.3 | 0.3 | GO:1902949 | positive regulation of tau-protein kinase activity(GO:1902949) |
| 0.3 | 0.7 | GO:0090274 | regulation of somatostatin secretion(GO:0090273) positive regulation of somatostatin secretion(GO:0090274) |
| 0.3 | 1.6 | GO:0090118 | receptor-mediated endocytosis of low-density lipoprotein particle involved in cholesterol transport(GO:0090118) |
| 0.3 | 1.3 | GO:0018277 | protein deamination(GO:0018277) |
| 0.3 | 1.3 | GO:1901165 | positive regulation of trophoblast cell migration(GO:1901165) |
| 0.3 | 1.3 | GO:0061461 | nitric oxide production involved in inflammatory response(GO:0002537) lysine import(GO:0034226) L-arginine import(GO:0043091) L-lysine import(GO:0061461) arginine import(GO:0090467) L-arginine transmembrane transport(GO:1903400) L-lysine import into cell(GO:1903410) |
| 0.3 | 5.8 | GO:1900747 | negative regulation of vascular endothelial growth factor signaling pathway(GO:1900747) |
| 0.3 | 1.5 | GO:0044856 | plasma membrane raft distribution(GO:0044855) plasma membrane raft localization(GO:0044856) plasma membrane raft polarization(GO:0044858) regulation of plasma membrane raft polarization(GO:1903906) |
| 0.3 | 3.3 | GO:0007168 | receptor guanylyl cyclase signaling pathway(GO:0007168) |
| 0.3 | 1.2 | GO:0051795 | positive regulation of catagen(GO:0051795) |
| 0.3 | 0.9 | GO:0002025 | vasodilation by norepinephrine-epinephrine involved in regulation of systemic arterial blood pressure(GO:0002025) |
| 0.3 | 1.4 | GO:2000111 | positive regulation of macrophage apoptotic process(GO:2000111) |
| 0.3 | 4.3 | GO:2000680 | rubidium ion transport(GO:0035826) regulation of rubidium ion transport(GO:2000680) |
| 0.3 | 0.9 | GO:0000103 | sulfate assimilation(GO:0000103) |
| 0.3 | 1.7 | GO:0014846 | esophagus smooth muscle contraction(GO:0014846) |
| 0.3 | 3.9 | GO:2000427 | positive regulation of apoptotic cell clearance(GO:2000427) |
| 0.3 | 0.8 | GO:1901069 | guanosine-containing compound catabolic process(GO:1901069) |
| 0.3 | 3.0 | GO:0045163 | clustering of voltage-gated potassium channels(GO:0045163) |
| 0.3 | 1.1 | GO:0045903 | positive regulation of translational fidelity(GO:0045903) |
| 0.3 | 1.1 | GO:1990166 | protein localization to site of double-strand break(GO:1990166) |
| 0.3 | 1.8 | GO:0051012 | microtubule sliding(GO:0051012) |
| 0.2 | 0.7 | GO:0097274 | urea homeostasis(GO:0097274) |
| 0.2 | 1.0 | GO:1903984 | regulation of transcription from RNA polymerase II promoter in response to arsenic-containing substance(GO:0061394) positive regulation of TRAIL-activated apoptotic signaling pathway(GO:1903984) |
| 0.2 | 1.4 | GO:0035105 | sterol regulatory element binding protein import into nucleus(GO:0035105) |
| 0.2 | 0.7 | GO:0010512 | negative regulation of phosphatidylinositol biosynthetic process(GO:0010512) |
| 0.2 | 0.7 | GO:1903762 | positive regulation of voltage-gated potassium channel activity involved in ventricular cardiac muscle cell action potential repolarization(GO:1903762) positive regulation of ventricular cardiac muscle cell action potential(GO:1903947) positive regulation of membrane repolarization during ventricular cardiac muscle cell action potential(GO:1905026) positive regulation of membrane repolarization during cardiac muscle cell action potential(GO:1905033) |
| 0.2 | 1.6 | GO:1902031 | regulation of NADP metabolic process(GO:1902031) |
| 0.2 | 0.7 | GO:0035754 | B cell chemotaxis(GO:0035754) |
| 0.2 | 1.1 | GO:1904491 | protein localization to ciliary transition zone(GO:1904491) |
| 0.2 | 0.6 | GO:0098904 | regulation of AV node cell action potential(GO:0098904) |
| 0.2 | 0.2 | GO:0006679 | glucosylceramide biosynthetic process(GO:0006679) |
| 0.2 | 0.9 | GO:0060367 | subpallium cell proliferation in forebrain(GO:0022012) lateral ganglionic eminence cell proliferation(GO:0022018) lambdoid suture morphogenesis(GO:0060366) sagittal suture morphogenesis(GO:0060367) anterior semicircular canal development(GO:0060873) lateral semicircular canal development(GO:0060875) |
| 0.2 | 1.3 | GO:0071874 | cellular response to norepinephrine stimulus(GO:0071874) |
| 0.2 | 1.7 | GO:0033504 | floor plate development(GO:0033504) |
| 0.2 | 1.0 | GO:0060748 | tertiary branching involved in mammary gland duct morphogenesis(GO:0060748) |
| 0.2 | 3.3 | GO:0021869 | forebrain ventricular zone progenitor cell division(GO:0021869) |
| 0.2 | 5.6 | GO:0035810 | positive regulation of urine volume(GO:0035810) |
| 0.2 | 0.6 | GO:0099540 | synaptic signaling via neuropeptide(GO:0099538) trans-synaptic signaling by neuropeptide(GO:0099540) trans-synaptic signaling by neuropeptide, modulating synaptic transmission(GO:0099551) |
| 0.2 | 2.4 | GO:0097116 | gephyrin clustering involved in postsynaptic density assembly(GO:0097116) |
| 0.2 | 0.9 | GO:0002001 | renal response to blood flow involved in circulatory renin-angiotensin regulation of systemic arterial blood pressure(GO:0001999) renin secretion into blood stream(GO:0002001) |
| 0.2 | 0.4 | GO:0035865 | cellular response to potassium ion(GO:0035865) |
| 0.2 | 2.0 | GO:0007185 | transmembrane receptor protein tyrosine phosphatase signaling pathway(GO:0007185) |
| 0.2 | 1.2 | GO:0071896 | protein localization to adherens junction(GO:0071896) |
| 0.2 | 0.7 | GO:1901842 | negative regulation of high voltage-gated calcium channel activity(GO:1901842) |
| 0.2 | 0.7 | GO:0019074 | viral genome packaging(GO:0019072) viral RNA genome packaging(GO:0019074) |
| 0.2 | 1.7 | GO:0010739 | positive regulation of protein kinase A signaling(GO:0010739) |
| 0.2 | 1.0 | GO:0060370 | susceptibility to T cell mediated cytotoxicity(GO:0060370) |
| 0.2 | 0.8 | GO:0097210 | response to gonadotropin-releasing hormone(GO:0097210) cellular response to gonadotropin-releasing hormone(GO:0097211) |
| 0.2 | 1.0 | GO:0002803 | positive regulation of antimicrobial peptide production(GO:0002225) positive regulation of antibacterial peptide production(GO:0002803) |
| 0.2 | 8.3 | GO:0045663 | positive regulation of myoblast differentiation(GO:0045663) |
| 0.2 | 0.5 | GO:0097187 | dentinogenesis(GO:0097187) |
| 0.2 | 0.6 | GO:1900042 | positive regulation of interleukin-2 secretion(GO:1900042) |
| 0.2 | 4.1 | GO:2000404 | regulation of T cell migration(GO:2000404) |
| 0.2 | 0.6 | GO:0003430 | growth plate cartilage chondrocyte growth(GO:0003430) |
| 0.2 | 3.0 | GO:0031274 | positive regulation of pseudopodium assembly(GO:0031274) |
| 0.2 | 0.9 | GO:2000503 | positive regulation of natural killer cell chemotaxis(GO:2000503) |
| 0.2 | 4.0 | GO:0090026 | positive regulation of monocyte chemotaxis(GO:0090026) |
| 0.2 | 1.2 | GO:0055011 | atrial cardiac muscle cell differentiation(GO:0055011) atrial cardiac muscle cell development(GO:0055014) |
| 0.2 | 5.7 | GO:0008211 | glucocorticoid metabolic process(GO:0008211) |
| 0.2 | 0.8 | GO:0010513 | regulation of phosphatidylinositol biosynthetic process(GO:0010511) positive regulation of phosphatidylinositol biosynthetic process(GO:0010513) |
| 0.2 | 0.6 | GO:1904479 | negative regulation of intestinal absorption(GO:1904479) |
| 0.1 | 2.7 | GO:0016576 | histone dephosphorylation(GO:0016576) |
| 0.1 | 0.6 | GO:0060979 | vasculogenesis involved in coronary vascular morphogenesis(GO:0060979) |
| 0.1 | 0.6 | GO:0045586 | regulation of gamma-delta T cell differentiation(GO:0045586) |
| 0.1 | 0.1 | GO:0060584 | regulation of prostaglandin-endoperoxide synthase activity(GO:0060584) positive regulation of prostaglandin-endoperoxide synthase activity(GO:0060585) |
| 0.1 | 1.3 | GO:0000255 | allantoin metabolic process(GO:0000255) |
| 0.1 | 1.6 | GO:0097012 | cellular response to granulocyte macrophage colony-stimulating factor stimulus(GO:0097011) response to granulocyte macrophage colony-stimulating factor(GO:0097012) |
| 0.1 | 0.8 | GO:0034197 | acylglycerol transport(GO:0034196) triglyceride transport(GO:0034197) |
| 0.1 | 1.4 | GO:0032962 | positive regulation of inositol trisphosphate biosynthetic process(GO:0032962) |
| 0.1 | 1.7 | GO:0043951 | negative regulation of cAMP-mediated signaling(GO:0043951) |
| 0.1 | 1.0 | GO:0070370 | heat acclimation(GO:0010286) cellular heat acclimation(GO:0070370) |
| 0.1 | 0.4 | GO:0002416 | IgG immunoglobulin transcytosis in epithelial cells mediated by FcRn immunoglobulin receptor(GO:0002416) |
| 0.1 | 0.9 | GO:0045200 | establishment or maintenance of neuroblast polarity(GO:0045196) establishment of neuroblast polarity(GO:0045200) |
| 0.1 | 0.6 | GO:0016199 | axon midline choice point recognition(GO:0016199) |
| 0.1 | 2.5 | GO:0048368 | lateral mesoderm development(GO:0048368) |
| 0.1 | 1.4 | GO:2000795 | negative regulation of epithelial cell proliferation involved in lung morphogenesis(GO:2000795) |
| 0.1 | 1.2 | GO:0021853 | cerebral cortex GABAergic interneuron migration(GO:0021853) interneuron migration(GO:1904936) |
| 0.1 | 4.5 | GO:0014850 | response to muscle activity(GO:0014850) |
| 0.1 | 0.5 | GO:2000546 | positive regulation of cell chemotaxis to fibroblast growth factor(GO:1904849) positive regulation of endothelial cell chemotaxis to fibroblast growth factor(GO:2000546) |
| 0.1 | 0.5 | GO:0030208 | dermatan sulfate biosynthetic process(GO:0030208) |
| 0.1 | 1.5 | GO:1901621 | negative regulation of smoothened signaling pathway involved in dorsal/ventral neural tube patterning(GO:1901621) |
| 0.1 | 0.9 | GO:0030035 | microspike assembly(GO:0030035) |
| 0.1 | 0.7 | GO:0045629 | negative regulation of T-helper 2 cell differentiation(GO:0045629) |
| 0.1 | 1.2 | GO:1904879 | positive regulation of calcium ion transmembrane transport via high voltage-gated calcium channel(GO:1904879) |
| 0.1 | 3.9 | GO:0034389 | lipid particle organization(GO:0034389) |
| 0.1 | 1.8 | GO:0051044 | positive regulation of membrane protein ectodomain proteolysis(GO:0051044) |
| 0.1 | 1.1 | GO:0055129 | L-proline biosynthetic process(GO:0055129) |
| 0.1 | 0.8 | GO:1901963 | regulation of cell proliferation involved in outflow tract morphogenesis(GO:1901963) |
| 0.1 | 1.4 | GO:0035507 | regulation of myosin-light-chain-phosphatase activity(GO:0035507) |
| 0.1 | 0.8 | GO:0033029 | regulation of neutrophil apoptotic process(GO:0033029) |
| 0.1 | 0.4 | GO:1905167 | positive regulation of lysosomal protein catabolic process(GO:1905167) |
| 0.1 | 0.6 | GO:0014050 | negative regulation of glutamate secretion(GO:0014050) |
| 0.1 | 1.3 | GO:0009950 | dorsal/ventral axis specification(GO:0009950) |
| 0.1 | 1.6 | GO:0070327 | thyroid hormone transport(GO:0070327) |
| 0.1 | 0.7 | GO:0044339 | canonical Wnt signaling pathway involved in osteoblast differentiation(GO:0044339) |
| 0.1 | 1.5 | GO:0002043 | blood vessel endothelial cell proliferation involved in sprouting angiogenesis(GO:0002043) |
| 0.1 | 0.3 | GO:1902309 | negative regulation of peptidyl-serine dephosphorylation(GO:1902309) |
| 0.1 | 0.8 | GO:0003383 | apical constriction(GO:0003383) |
| 0.1 | 2.8 | GO:0042249 | establishment of planar polarity of embryonic epithelium(GO:0042249) |
| 0.1 | 0.5 | GO:1902460 | regulation of mesenchymal stem cell proliferation(GO:1902460) positive regulation of mesenchymal stem cell proliferation(GO:1902462) |
| 0.1 | 0.8 | GO:0042986 | positive regulation of amyloid precursor protein biosynthetic process(GO:0042986) |
| 0.1 | 0.3 | GO:1900127 | positive regulation of hyaluronan biosynthetic process(GO:1900127) |
| 0.1 | 1.0 | GO:0001714 | endodermal cell fate specification(GO:0001714) |
| 0.1 | 0.5 | GO:0060028 | convergent extension involved in axis elongation(GO:0060028) |
| 0.1 | 1.8 | GO:1901642 | nucleoside transmembrane transport(GO:1901642) |
| 0.1 | 1.0 | GO:0033564 | anterior/posterior axon guidance(GO:0033564) |
| 0.1 | 0.5 | GO:0060087 | relaxation of vascular smooth muscle(GO:0060087) |
| 0.1 | 0.3 | GO:2000642 | negative regulation of early endosome to late endosome transport(GO:2000642) |
| 0.1 | 2.6 | GO:0030277 | maintenance of gastrointestinal epithelium(GO:0030277) |
| 0.1 | 0.7 | GO:0014807 | regulation of somitogenesis(GO:0014807) |
| 0.1 | 3.1 | GO:0022010 | central nervous system myelination(GO:0022010) axon ensheathment in central nervous system(GO:0032291) |
| 0.1 | 0.5 | GO:0097091 | synaptic vesicle clustering(GO:0097091) |
| 0.1 | 2.0 | GO:0010839 | negative regulation of keratinocyte proliferation(GO:0010839) |
| 0.1 | 1.0 | GO:0021902 | commitment of neuronal cell to specific neuron type in forebrain(GO:0021902) |
| 0.1 | 0.3 | GO:1904106 | protein localization to microvillus(GO:1904106) |
| 0.1 | 1.8 | GO:0043568 | positive regulation of insulin-like growth factor receptor signaling pathway(GO:0043568) |
| 0.1 | 2.7 | GO:0003094 | glomerular filtration(GO:0003094) |
| 0.1 | 0.6 | GO:0070086 | ubiquitin-dependent endocytosis(GO:0070086) |
| 0.1 | 0.5 | GO:0061086 | negative regulation of histone H3-K27 methylation(GO:0061086) |
| 0.1 | 0.7 | GO:0060399 | positive regulation of growth hormone receptor signaling pathway(GO:0060399) |
| 0.1 | 1.8 | GO:0046325 | negative regulation of glucose import(GO:0046325) |
| 0.1 | 1.2 | GO:0001886 | endothelial cell morphogenesis(GO:0001886) |
| 0.1 | 0.3 | GO:0060686 | neural fold elevation formation(GO:0021502) regulation of prostatic bud formation(GO:0060685) negative regulation of prostatic bud formation(GO:0060686) nephrogenic mesenchyme morphogenesis(GO:0072134) allantois development(GO:1905069) |
| 0.1 | 1.6 | GO:0036066 | protein O-linked fucosylation(GO:0036066) |
| 0.1 | 0.9 | GO:2000467 | positive regulation of glycogen (starch) synthase activity(GO:2000467) |
| 0.1 | 0.3 | GO:0038158 | granulocyte colony-stimulating factor signaling pathway(GO:0038158) |
| 0.1 | 0.6 | GO:0032439 | endosome localization(GO:0032439) |
| 0.1 | 2.8 | GO:0038063 | collagen-activated tyrosine kinase receptor signaling pathway(GO:0038063) |
| 0.1 | 1.8 | GO:2000194 | regulation of female gonad development(GO:2000194) |
| 0.1 | 3.9 | GO:0051764 | actin crosslink formation(GO:0051764) |
| 0.1 | 2.6 | GO:0019511 | peptidyl-proline hydroxylation(GO:0019511) |
| 0.1 | 0.6 | GO:0050915 | sensory perception of sour taste(GO:0050915) |
| 0.1 | 0.3 | GO:0051596 | methylglyoxal catabolic process to D-lactate via S-lactoyl-glutathione(GO:0019243) methylglyoxal catabolic process(GO:0051596) methylglyoxal catabolic process to lactate(GO:0061727) |
| 0.1 | 1.7 | GO:0007220 | Notch receptor processing(GO:0007220) |
| 0.1 | 1.0 | GO:0021794 | thalamus development(GO:0021794) |
| 0.1 | 3.0 | GO:0033622 | integrin activation(GO:0033622) |
| 0.1 | 2.0 | GO:0061577 | calcium ion transmembrane transport via high voltage-gated calcium channel(GO:0061577) |
| 0.1 | 2.2 | GO:2001256 | regulation of store-operated calcium entry(GO:2001256) |
| 0.1 | 2.2 | GO:0033539 | fatty acid beta-oxidation using acyl-CoA dehydrogenase(GO:0033539) |
| 0.1 | 1.0 | GO:0035694 | mitochondrial protein catabolic process(GO:0035694) |
| 0.1 | 2.3 | GO:0098868 | bone growth(GO:0098868) |
| 0.1 | 1.0 | GO:0051549 | regulation of keratinocyte migration(GO:0051547) positive regulation of keratinocyte migration(GO:0051549) |
| 0.1 | 0.3 | GO:0060529 | ectoderm and mesoderm interaction(GO:0007499) epidermal cell division(GO:0010481) regulation of epidermal cell division(GO:0010482) female genitalia morphogenesis(GO:0048807) squamous basal epithelial stem cell differentiation involved in prostate gland acinus development(GO:0060529) |
| 0.1 | 2.5 | GO:0019934 | cGMP-mediated signaling(GO:0019934) |
| 0.1 | 0.4 | GO:0009098 | branched-chain amino acid biosynthetic process(GO:0009082) leucine biosynthetic process(GO:0009098) valine biosynthetic process(GO:0009099) |
| 0.1 | 0.3 | GO:0048743 | positive regulation of skeletal muscle fiber development(GO:0048743) |
| 0.1 | 0.8 | GO:2000324 | positive regulation of glucocorticoid receptor signaling pathway(GO:2000324) |
| 0.1 | 1.9 | GO:0090136 | epithelial cell-cell adhesion(GO:0090136) |
| 0.1 | 0.2 | GO:1903937 | response to acrylamide(GO:1903937) |
| 0.1 | 1.1 | GO:0014722 | regulation of skeletal muscle contraction by calcium ion signaling(GO:0014722) |
| 0.1 | 1.2 | GO:0060316 | positive regulation of ryanodine-sensitive calcium-release channel activity(GO:0060316) |
| 0.1 | 1.5 | GO:0035414 | negative regulation of catenin import into nucleus(GO:0035414) |
| 0.1 | 0.5 | GO:0032487 | regulation of Rap protein signal transduction(GO:0032487) |
| 0.1 | 0.9 | GO:0070120 | ciliary neurotrophic factor-mediated signaling pathway(GO:0070120) |
| 0.1 | 3.0 | GO:0031954 | positive regulation of protein autophosphorylation(GO:0031954) |
| 0.1 | 0.5 | GO:0060011 | Sertoli cell proliferation(GO:0060011) |
| 0.1 | 0.8 | GO:0097338 | response to clozapine(GO:0097338) |
| 0.1 | 1.0 | GO:0051665 | membrane raft localization(GO:0051665) |
| 0.1 | 0.3 | GO:0072287 | metanephric distal tubule morphogenesis(GO:0072287) |
| 0.1 | 0.2 | GO:0032849 | positive regulation of cellular pH reduction(GO:0032849) |
| 0.1 | 1.2 | GO:0034380 | high-density lipoprotein particle assembly(GO:0034380) |
| 0.1 | 0.3 | GO:0015788 | UDP-N-acetylglucosamine transport(GO:0015788) UDP-N-acetylglucosamine transmembrane transport(GO:1990569) |
| 0.1 | 0.5 | GO:0030311 | poly-N-acetyllactosamine biosynthetic process(GO:0030311) |
| 0.1 | 0.7 | GO:0003402 | planar cell polarity pathway involved in axis elongation(GO:0003402) |
| 0.1 | 0.2 | GO:0046416 | D-amino acid metabolic process(GO:0046416) |
| 0.1 | 1.3 | GO:0006703 | estrogen biosynthetic process(GO:0006703) |
| 0.1 | 0.6 | GO:1904220 | regulation of serine C-palmitoyltransferase activity(GO:1904220) |
| 0.1 | 1.2 | GO:0051601 | exocyst localization(GO:0051601) |
| 0.1 | 0.3 | GO:1904806 | regulation of protein oxidation(GO:1904806) positive regulation of protein oxidation(GO:1904808) |
| 0.1 | 3.2 | GO:0016339 | calcium-dependent cell-cell adhesion via plasma membrane cell adhesion molecules(GO:0016339) |
| 0.1 | 0.5 | GO:0070164 | negative regulation of adiponectin secretion(GO:0070164) |
| 0.1 | 0.4 | GO:0060526 | prostate glandular acinus morphogenesis(GO:0060526) prostate epithelial cord arborization involved in prostate glandular acinus morphogenesis(GO:0060527) |
| 0.1 | 8.6 | GO:0030449 | regulation of complement activation(GO:0030449) |
| 0.1 | 0.6 | GO:0001878 | response to yeast(GO:0001878) |
| 0.1 | 0.6 | GO:0051639 | actin filament network formation(GO:0051639) |
| 0.1 | 0.8 | GO:0006449 | regulation of translational termination(GO:0006449) |
| 0.1 | 0.2 | GO:0070317 | negative regulation of G0 to G1 transition(GO:0070317) |
| 0.1 | 0.4 | GO:1903377 | negative regulation of oxidative stress-induced neuron intrinsic apoptotic signaling pathway(GO:1903377) |
| 0.1 | 1.5 | GO:0032060 | bleb assembly(GO:0032060) |
| 0.1 | 0.8 | GO:2000353 | positive regulation of endothelial cell apoptotic process(GO:2000353) |
| 0.1 | 1.1 | GO:0015732 | prostaglandin transport(GO:0015732) |
| 0.1 | 0.2 | GO:0090310 | negative regulation of methylation-dependent chromatin silencing(GO:0090310) |
| 0.1 | 0.5 | GO:1902287 | trigeminal nerve morphogenesis(GO:0021636) trigeminal nerve structural organization(GO:0021637) semaphorin-plexin signaling pathway involved in axon guidance(GO:1902287) |
| 0.1 | 0.5 | GO:0061767 | negative regulation of lung blood pressure(GO:0061767) |
| 0.1 | 0.8 | GO:1903012 | positive regulation of bone development(GO:1903012) |
| 0.1 | 0.5 | GO:0071847 | TNFSF11-mediated signaling pathway(GO:0071847) |
| 0.1 | 0.3 | GO:0006177 | GMP biosynthetic process(GO:0006177) |
| 0.1 | 1.0 | GO:0042355 | fucose catabolic process(GO:0019317) L-fucose metabolic process(GO:0042354) L-fucose catabolic process(GO:0042355) |
| 0.1 | 0.8 | GO:2000623 | regulation of nuclear-transcribed mRNA catabolic process, nonsense-mediated decay(GO:2000622) negative regulation of nuclear-transcribed mRNA catabolic process, nonsense-mediated decay(GO:2000623) |
| 0.1 | 0.3 | GO:0019542 | acetate biosynthetic process(GO:0019413) acetyl-CoA biosynthetic process from acetate(GO:0019427) propionate biosynthetic process(GO:0019542) |
| 0.1 | 0.6 | GO:0000389 | mRNA 3'-splice site recognition(GO:0000389) |
| 0.1 | 0.2 | GO:0043335 | protein unfolding(GO:0043335) |
| 0.1 | 0.7 | GO:0051608 | histamine transport(GO:0051608) |
| 0.1 | 0.1 | GO:0071451 | cellular response to oxygen radical(GO:0071450) cellular response to superoxide(GO:0071451) |
| 0.1 | 0.3 | GO:0003409 | optic cup structural organization(GO:0003409) |
| 0.1 | 0.8 | GO:0046629 | gamma-delta T cell activation(GO:0046629) |
| 0.1 | 0.3 | GO:0030047 | actin modification(GO:0030047) |
| 0.1 | 1.2 | GO:0019371 | cyclooxygenase pathway(GO:0019371) |
| 0.1 | 0.4 | GO:1904424 | regulation of GTP binding(GO:1904424) |
| 0.1 | 1.0 | GO:0032331 | negative regulation of chondrocyte differentiation(GO:0032331) |
| 0.1 | 0.1 | GO:0021718 | superior olivary nucleus development(GO:0021718) superior olivary nucleus maturation(GO:0021722) |
| 0.1 | 0.5 | GO:0071763 | nuclear membrane organization(GO:0071763) |
| 0.1 | 0.3 | GO:1902361 | mitochondrial pyruvate transport(GO:0006850) mitochondrial pyruvate transmembrane transport(GO:1902361) |
| 0.1 | 0.2 | GO:0072014 | proximal tubule development(GO:0072014) |
| 0.1 | 2.0 | GO:0030252 | growth hormone secretion(GO:0030252) |
| 0.0 | 0.1 | GO:1904897 | regulation of hepatic stellate cell proliferation(GO:1904897) positive regulation of hepatic stellate cell proliferation(GO:1904899) hepatic stellate cell proliferation(GO:1990922) |
| 0.0 | 1.2 | GO:0006884 | cell volume homeostasis(GO:0006884) |
| 0.0 | 1.1 | GO:0030497 | fatty acid elongation(GO:0030497) |
| 0.0 | 0.5 | GO:0000101 | sulfur amino acid transport(GO:0000101) |
| 0.0 | 1.4 | GO:0006693 | prostanoid metabolic process(GO:0006692) prostaglandin metabolic process(GO:0006693) |
| 0.0 | 0.6 | GO:0070494 | regulation of thrombin receptor signaling pathway(GO:0070494) negative regulation of thrombin receptor signaling pathway(GO:0070495) |
| 0.0 | 1.9 | GO:0048512 | circadian behavior(GO:0048512) |
| 0.0 | 0.2 | GO:0002182 | cytoplasmic translational elongation(GO:0002182) regulation of cytoplasmic translational elongation(GO:1900247) negative regulation of cytoplasmic translational elongation(GO:1900248) |
| 0.0 | 1.1 | GO:0045671 | negative regulation of osteoclast differentiation(GO:0045671) |
| 0.0 | 0.2 | GO:0060214 | endocardium formation(GO:0060214) |
| 0.0 | 0.1 | GO:0007402 | ganglion mother cell fate determination(GO:0007402) formation of anatomical boundary(GO:0048859) |
| 0.0 | 0.3 | GO:0098886 | modification of dendritic spine(GO:0098886) |
| 0.0 | 0.2 | GO:0045014 | carbon catabolite repression of transcription(GO:0045013) negative regulation of transcription by glucose(GO:0045014) |
| 0.0 | 3.9 | GO:0070206 | protein trimerization(GO:0070206) |
| 0.0 | 0.1 | GO:1905049 | negative regulation of metallopeptidase activity(GO:1905049) |
| 0.0 | 0.4 | GO:0070940 | dephosphorylation of RNA polymerase II C-terminal domain(GO:0070940) |
| 0.0 | 0.2 | GO:0000451 | rRNA 2'-O-methylation(GO:0000451) |
| 0.0 | 0.1 | GO:0032242 | regulation of nucleoside transport(GO:0032242) positive regulation of necroptotic process(GO:0060545) |
| 0.0 | 0.3 | GO:0097026 | dendritic cell dendrite assembly(GO:0097026) |
| 0.0 | 2.8 | GO:0055078 | sodium ion homeostasis(GO:0055078) |
| 0.0 | 1.5 | GO:0030325 | adrenal gland development(GO:0030325) |
| 0.0 | 0.5 | GO:0098907 | regulation of SA node cell action potential(GO:0098907) |
| 0.0 | 2.3 | GO:0030866 | cortical actin cytoskeleton organization(GO:0030866) |
| 0.0 | 0.2 | GO:0071921 | establishment of sister chromatid cohesion(GO:0034085) cohesin loading(GO:0071921) regulation of cohesin loading(GO:0071922) |
| 0.0 | 0.8 | GO:0007175 | negative regulation of epidermal growth factor-activated receptor activity(GO:0007175) |
| 0.0 | 1.5 | GO:0048009 | insulin-like growth factor receptor signaling pathway(GO:0048009) |
| 0.0 | 0.2 | GO:0060605 | tube lumen cavitation(GO:0060605) salivary gland cavitation(GO:0060662) |
| 0.0 | 0.6 | GO:0006930 | substrate-dependent cell migration, cell extension(GO:0006930) |
| 0.0 | 2.0 | GO:0042572 | retinol metabolic process(GO:0042572) |
| 0.0 | 1.3 | GO:0035435 | phosphate ion transmembrane transport(GO:0035435) |
| 0.0 | 0.9 | GO:0097623 | potassium ion export across plasma membrane(GO:0097623) |
| 0.0 | 7.3 | GO:0007044 | cell-substrate junction assembly(GO:0007044) |
| 0.0 | 0.3 | GO:0061743 | motor learning(GO:0061743) maintenance of synapse structure(GO:0099558) |
| 0.0 | 0.5 | GO:0099525 | presynaptic dense core granule exocytosis(GO:0099525) |
| 0.0 | 0.2 | GO:0001880 | Mullerian duct regression(GO:0001880) |
| 0.0 | 0.4 | GO:0006572 | tyrosine catabolic process(GO:0006572) |
| 0.0 | 0.2 | GO:0045229 | cell envelope organization(GO:0043163) external encapsulating structure organization(GO:0045229) |
| 0.0 | 5.0 | GO:0098869 | cellular oxidant detoxification(GO:0098869) |
| 0.0 | 0.3 | GO:0051684 | maintenance of Golgi location(GO:0051684) |
| 0.0 | 1.1 | GO:0009312 | oligosaccharide biosynthetic process(GO:0009312) |
| 0.0 | 0.2 | GO:0046952 | ketone body catabolic process(GO:0046952) |
| 0.0 | 0.5 | GO:0016191 | synaptic vesicle uncoating(GO:0016191) |
| 0.0 | 1.0 | GO:0043517 | positive regulation of DNA damage response, signal transduction by p53 class mediator(GO:0043517) |
| 0.0 | 0.7 | GO:1901838 | positive regulation of transcription of nuclear large rRNA transcript from RNA polymerase I promoter(GO:1901838) |
| 0.0 | 0.6 | GO:0051481 | negative regulation of cytosolic calcium ion concentration(GO:0051481) |
| 0.0 | 0.4 | GO:0046950 | cellular ketone body metabolic process(GO:0046950) ketone body biosynthetic process(GO:0046951) |
| 0.0 | 0.9 | GO:0055003 | cardiac myofibril assembly(GO:0055003) |
| 0.0 | 0.6 | GO:0045793 | positive regulation of cell size(GO:0045793) |
| 0.0 | 0.1 | GO:0032917 | polyamine acetylation(GO:0032917) spermidine acetylation(GO:0032918) |
| 0.0 | 0.1 | GO:0060754 | positive regulation of mast cell chemotaxis(GO:0060754) |
| 0.0 | 0.0 | GO:0036367 | adaptation of rhodopsin mediated signaling(GO:0016062) light adaption(GO:0036367) |
| 0.0 | 0.7 | GO:0010944 | negative regulation of transcription by competitive promoter binding(GO:0010944) |
| 0.0 | 0.5 | GO:0050884 | neuromuscular process controlling posture(GO:0050884) |
| 0.0 | 0.6 | GO:0089711 | L-glutamate transmembrane transport(GO:0089711) |
| 0.0 | 0.1 | GO:0032877 | positive regulation of DNA endoreduplication(GO:0032877) |
| 0.0 | 1.0 | GO:0014009 | glial cell proliferation(GO:0014009) |
| 0.0 | 0.6 | GO:2000096 | positive regulation of Wnt signaling pathway, planar cell polarity pathway(GO:2000096) |
| 0.0 | 1.4 | GO:0030206 | chondroitin sulfate biosynthetic process(GO:0030206) |
| 0.0 | 0.8 | GO:0010996 | response to auditory stimulus(GO:0010996) |
| 0.0 | 0.2 | GO:0001994 | norepinephrine-epinephrine vasoconstriction involved in regulation of systemic arterial blood pressure(GO:0001994) |
| 0.0 | 0.1 | GO:1901620 | common bile duct development(GO:0061009) regulation of smoothened signaling pathway involved in dorsal/ventral neural tube patterning(GO:1901620) |
| 0.0 | 0.4 | GO:0015868 | purine ribonucleotide transport(GO:0015868) |
| 0.0 | 0.6 | GO:0014002 | astrocyte development(GO:0014002) |
| 0.0 | 1.3 | GO:0048268 | clathrin coat assembly(GO:0048268) |
| 0.0 | 1.4 | GO:0090383 | phagosome acidification(GO:0090383) |
| 0.0 | 0.0 | GO:0030222 | eosinophil differentiation(GO:0030222) |
| 0.0 | 0.2 | GO:0044334 | canonical Wnt signaling pathway involved in positive regulation of epithelial to mesenchymal transition(GO:0044334) |
| 0.0 | 0.6 | GO:0061377 | mammary gland alveolus development(GO:0060749) mammary gland lobule development(GO:0061377) |
| 0.0 | 0.6 | GO:0005513 | detection of calcium ion(GO:0005513) |
| 0.0 | 2.6 | GO:0016266 | O-glycan processing(GO:0016266) |
| 0.0 | 2.1 | GO:0000413 | protein peptidyl-prolyl isomerization(GO:0000413) |
| 0.0 | 0.6 | GO:0018026 | peptidyl-lysine monomethylation(GO:0018026) |
| 0.0 | 0.1 | GO:1903613 | regulation of protein tyrosine phosphatase activity(GO:1903613) positive regulation of protein tyrosine phosphatase activity(GO:1903615) |
| 0.0 | 0.2 | GO:0051418 | interphase microtubule nucleation by interphase microtubule organizing center(GO:0051415) microtubule nucleation by microtubule organizing center(GO:0051418) |
| 0.0 | 0.4 | GO:0010922 | positive regulation of phosphatase activity(GO:0010922) |
| 0.0 | 0.0 | GO:0097477 | lateral motor column neuron migration(GO:0097477) |
| 0.0 | 0.1 | GO:0002415 | immunoglobulin transcytosis in epithelial cells mediated by polymeric immunoglobulin receptor(GO:0002415) |
| 0.0 | 1.6 | GO:0006636 | unsaturated fatty acid biosynthetic process(GO:0006636) |
| 0.0 | 0.5 | GO:0060314 | regulation of ryanodine-sensitive calcium-release channel activity(GO:0060314) |
| 0.0 | 0.1 | GO:0090362 | positive regulation of platelet-derived growth factor production(GO:0090362) |
| 0.0 | 0.8 | GO:0042994 | cytoplasmic sequestering of transcription factor(GO:0042994) |
| 0.0 | 0.1 | GO:0051821 | negative regulation of transcription from RNA polymerase II promoter in response to UV-induced DNA damage(GO:0010768) transmission of virus(GO:0019089) dissemination or transmission of symbiont from host(GO:0044007) dissemination or transmission of organism from other organism involved in symbiotic interaction(GO:0051821) |
| 0.0 | 1.0 | GO:0019835 | cytolysis(GO:0019835) |
| 0.0 | 0.8 | GO:0035767 | endothelial cell chemotaxis(GO:0035767) |
| 0.0 | 0.4 | GO:0006348 | chromatin silencing at telomere(GO:0006348) |
| 0.0 | 0.4 | GO:0046855 | phosphorylated carbohydrate dephosphorylation(GO:0046838) inositol phosphate dephosphorylation(GO:0046855) |
| 0.0 | 0.4 | GO:2000651 | positive regulation of sodium ion transmembrane transporter activity(GO:2000651) |
| 0.0 | 0.3 | GO:0048846 | axon extension involved in axon guidance(GO:0048846) neuron projection extension involved in neuron projection guidance(GO:1902284) |
| 0.0 | 0.2 | GO:0010816 | substance P catabolic process(GO:0010814) calcitonin catabolic process(GO:0010816) endothelin maturation(GO:0034959) |
| 0.0 | 0.5 | GO:1904714 | regulation of chaperone-mediated autophagy(GO:1904714) |
| 0.0 | 0.3 | GO:2000811 | negative regulation of anoikis(GO:2000811) |
| 0.0 | 0.7 | GO:0002548 | monocyte chemotaxis(GO:0002548) |
| 0.0 | 1.1 | GO:0007190 | activation of adenylate cyclase activity(GO:0007190) |
| 0.0 | 0.2 | GO:0031284 | positive regulation of guanylate cyclase activity(GO:0031284) |
| 0.0 | 0.2 | GO:0006621 | protein retention in ER lumen(GO:0006621) |
| 0.0 | 0.0 | GO:0035928 | rRNA import into mitochondrion(GO:0035928) |
| 0.0 | 0.4 | GO:0045722 | positive regulation of gluconeogenesis(GO:0045722) |
| 0.0 | 1.0 | GO:0035329 | hippo signaling(GO:0035329) |
| 0.0 | 1.0 | GO:0032410 | negative regulation of transporter activity(GO:0032410) |
| 0.0 | 0.3 | GO:0031069 | hair follicle morphogenesis(GO:0031069) |
| 0.0 | 1.0 | GO:0001580 | detection of chemical stimulus involved in sensory perception of bitter taste(GO:0001580) |
| 0.0 | 0.3 | GO:0042754 | negative regulation of circadian rhythm(GO:0042754) |
| 0.0 | 1.5 | GO:0006730 | one-carbon metabolic process(GO:0006730) |
| 0.0 | 0.1 | GO:1904381 | Golgi apparatus mannose trimming(GO:1904381) |
| 0.0 | 0.8 | GO:0007194 | negative regulation of adenylate cyclase activity(GO:0007194) |
| 0.0 | 0.1 | GO:0000967 | endonucleolytic cleavage to generate mature 5'-end of SSU-rRNA from (SSU-rRNA, 5.8S rRNA, LSU-rRNA)(GO:0000472) rRNA 5'-end processing(GO:0000967) ncRNA 5'-end processing(GO:0034471) |
| 0.0 | 1.4 | GO:2001238 | positive regulation of extrinsic apoptotic signaling pathway(GO:2001238) |
| 0.0 | 0.8 | GO:0007413 | axonal fasciculation(GO:0007413) |
| 0.0 | 0.1 | GO:0016185 | synaptic vesicle budding from presynaptic endocytic zone membrane(GO:0016185) |
| 0.0 | 1.5 | GO:2000181 | negative regulation of angiogenesis(GO:0016525) negative regulation of blood vessel morphogenesis(GO:2000181) |
| 0.0 | 0.2 | GO:0034435 | steroid esterification(GO:0034433) sterol esterification(GO:0034434) cholesterol esterification(GO:0034435) |
| 0.0 | 2.7 | GO:0006501 | C-terminal protein lipidation(GO:0006501) |
| 0.0 | 0.5 | GO:0043153 | entrainment of circadian clock by photoperiod(GO:0043153) |
| 0.0 | 0.5 | GO:0034975 | protein folding in endoplasmic reticulum(GO:0034975) |
| 0.0 | 1.0 | GO:0007205 | protein kinase C-activating G-protein coupled receptor signaling pathway(GO:0007205) |
| 0.0 | 0.3 | GO:0051967 | negative regulation of synaptic transmission, glutamatergic(GO:0051967) |
| 0.0 | 0.7 | GO:0008045 | motor neuron axon guidance(GO:0008045) |
| 0.0 | 0.0 | GO:0090133 | mesendoderm migration(GO:0090133) cell migration involved in mesendoderm migration(GO:0090134) |
| 0.0 | 0.3 | GO:0010155 | regulation of proton transport(GO:0010155) |
| 0.0 | 0.4 | GO:0035721 | intraciliary retrograde transport(GO:0035721) |
| 0.0 | 0.3 | GO:1900029 | positive regulation of ruffle assembly(GO:1900029) |
| 0.0 | 0.2 | GO:0070475 | rRNA base methylation(GO:0070475) |
| 0.0 | 0.2 | GO:0002934 | desmosome organization(GO:0002934) |
| 0.0 | 0.5 | GO:0003334 | keratinocyte development(GO:0003334) |
| 0.0 | 0.5 | GO:0007250 | activation of NF-kappaB-inducing kinase activity(GO:0007250) |
| 0.0 | 0.2 | GO:0042670 | retinal cone cell differentiation(GO:0042670) retinal cone cell development(GO:0046549) |
| 0.0 | 0.9 | GO:1904659 | hexose transmembrane transport(GO:0035428) glucose transmembrane transport(GO:1904659) |
| 0.0 | 0.3 | GO:0098789 | pre-mRNA cleavage required for polyadenylation(GO:0098789) |
| 0.0 | 0.3 | GO:1901798 | positive regulation of signal transduction by p53 class mediator(GO:1901798) |
| 0.0 | 0.7 | GO:0032731 | positive regulation of interleukin-1 beta production(GO:0032731) |
| 0.0 | 1.0 | GO:0000289 | nuclear-transcribed mRNA poly(A) tail shortening(GO:0000289) |
| 0.0 | 0.2 | GO:0016540 | protein autoprocessing(GO:0016540) |
| 0.0 | 0.5 | GO:0010765 | positive regulation of sodium ion transport(GO:0010765) |
| 0.0 | 0.3 | GO:0015693 | magnesium ion transport(GO:0015693) |
| 0.0 | 0.1 | GO:2000286 | receptor internalization involved in canonical Wnt signaling pathway(GO:2000286) |
| 0.0 | 0.2 | GO:0048680 | positive regulation of axon regeneration(GO:0048680) |
| 0.0 | 0.0 | GO:1900019 | regulation of protein kinase C activity(GO:1900019) positive regulation of protein kinase C activity(GO:1900020) |
| 0.0 | 0.9 | GO:1901998 | toxin transport(GO:1901998) |
| 0.0 | 0.2 | GO:0045046 | protein import into peroxisome membrane(GO:0045046) |
| 0.0 | 0.2 | GO:0002087 | regulation of respiratory gaseous exchange by neurological system process(GO:0002087) |
| 0.0 | 0.7 | GO:0034142 | toll-like receptor 4 signaling pathway(GO:0034142) |
| 0.0 | 0.2 | GO:0036010 | protein localization to endosome(GO:0036010) |
| 0.0 | 1.5 | GO:0030574 | collagen catabolic process(GO:0030574) |
| 0.0 | 0.0 | GO:0097327 | response to antineoplastic agent(GO:0097327) negative regulation of synaptic vesicle exocytosis(GO:2000301) |
| 0.0 | 1.7 | GO:0051592 | response to calcium ion(GO:0051592) |
| 0.0 | 0.7 | GO:0006783 | heme biosynthetic process(GO:0006783) |
| 0.0 | 0.6 | GO:0051457 | maintenance of protein location in nucleus(GO:0051457) |
| 0.0 | 0.4 | GO:0003091 | renal water homeostasis(GO:0003091) |
| 0.0 | 0.3 | GO:0071801 | regulation of podosome assembly(GO:0071801) |
| 0.0 | 0.5 | GO:0006768 | biotin metabolic process(GO:0006768) |
| 0.0 | 0.2 | GO:2000169 | negative regulation of peptidyl-cysteine S-nitrosylation(GO:1902083) regulation of peptidyl-cysteine S-nitrosylation(GO:2000169) |
| 0.0 | 0.1 | GO:0046909 | intermembrane transport(GO:0046909) protein transport from ciliary membrane to plasma membrane(GO:1903445) |
| 0.0 | 0.9 | GO:0006040 | amino sugar metabolic process(GO:0006040) |
| 0.0 | 0.0 | GO:0046900 | tetrahydrofolylpolyglutamate metabolic process(GO:0046900) |
| 0.0 | 0.1 | GO:0000270 | peptidoglycan metabolic process(GO:0000270) peptidoglycan catabolic process(GO:0009253) |
| 0.0 | 0.7 | GO:0045638 | negative regulation of myeloid cell differentiation(GO:0045638) |
| 0.0 | 0.1 | GO:2000676 | positive regulation of type B pancreatic cell apoptotic process(GO:2000676) |
| 0.0 | 0.3 | GO:0090050 | positive regulation of cell migration involved in sprouting angiogenesis(GO:0090050) |
| 0.0 | 0.6 | GO:0034243 | regulation of transcription elongation from RNA polymerase II promoter(GO:0034243) |
| 0.0 | 1.6 | GO:0070268 | cornification(GO:0070268) |
| 0.0 | 0.4 | GO:0000042 | protein targeting to Golgi(GO:0000042) |
| 0.0 | 0.0 | GO:0001757 | somite specification(GO:0001757) |
| 0.0 | 0.7 | GO:0045454 | cell redox homeostasis(GO:0045454) |
| 0.0 | 0.2 | GO:2001224 | positive regulation of neuron migration(GO:2001224) |
| 0.0 | 3.2 | GO:0098742 | cell-cell adhesion via plasma-membrane adhesion molecules(GO:0098742) |
| 0.0 | 0.9 | GO:0015914 | phospholipid transport(GO:0015914) |
| 0.0 | 2.2 | GO:0000184 | nuclear-transcribed mRNA catabolic process, nonsense-mediated decay(GO:0000184) |
| 0.0 | 0.1 | GO:1990403 | embryonic brain development(GO:1990403) |
| 0.0 | 0.0 | GO:0071447 | cellular response to hydroperoxide(GO:0071447) |
| 0.0 | 0.2 | GO:0016973 | poly(A)+ mRNA export from nucleus(GO:0016973) |
| 0.0 | 0.6 | GO:0034446 | substrate adhesion-dependent cell spreading(GO:0034446) |
Gene overrepresentation in cellular component category:
| Log-likelihood per target | Total log-likelihood | Term | Description |
|---|---|---|---|
| 1.1 | 3.2 | GO:0097489 | multivesicular body, internal vesicle lumen(GO:0097489) |
| 1.0 | 3.1 | GO:0005584 | collagen type I trimer(GO:0005584) |
| 0.9 | 3.5 | GO:0034684 | integrin alphav-beta5 complex(GO:0034684) |
| 0.5 | 7.3 | GO:0005587 | collagen type IV trimer(GO:0005587) |
| 0.5 | 2.4 | GO:0071149 | TEAD-2-YAP complex(GO:0071149) |
| 0.5 | 2.3 | GO:0038039 | G-protein coupled receptor heterodimeric complex(GO:0038039) |
| 0.4 | 5.8 | GO:0098647 | collagen type VI trimer(GO:0005589) collagen beaded filament(GO:0098647) |
| 0.4 | 9.3 | GO:0031089 | platelet dense granule lumen(GO:0031089) |
| 0.4 | 1.1 | GO:0070195 | growth hormone receptor complex(GO:0070195) |
| 0.4 | 3.8 | GO:0097443 | sorting endosome(GO:0097443) |
| 0.3 | 2.4 | GO:0034673 | inhibin-betaglycan-ActRII complex(GO:0034673) |
| 0.3 | 1.0 | GO:1990622 | CHOP-ATF3 complex(GO:1990622) |
| 0.3 | 4.9 | GO:0005862 | muscle thin filament tropomyosin(GO:0005862) |
| 0.2 | 3.4 | GO:0005583 | fibrillar collagen trimer(GO:0005583) banded collagen fibril(GO:0098643) |
| 0.2 | 1.2 | GO:0005641 | nuclear envelope lumen(GO:0005641) |
| 0.2 | 19.9 | GO:0005581 | collagen trimer(GO:0005581) |
| 0.2 | 3.3 | GO:0008074 | guanylate cyclase complex, soluble(GO:0008074) |
| 0.2 | 1.6 | GO:0002116 | semaphorin receptor complex(GO:0002116) |
| 0.2 | 0.8 | GO:0030056 | hemidesmosome(GO:0030056) |
| 0.1 | 2.1 | GO:0030314 | junctional membrane complex(GO:0030314) |
| 0.1 | 1.0 | GO:0097209 | epidermal lamellar body(GO:0097209) |
| 0.1 | 0.9 | GO:0044393 | microspike(GO:0044393) |
| 0.1 | 3.3 | GO:0031088 | platelet dense granule membrane(GO:0031088) |
| 0.1 | 0.3 | GO:0034680 | integrin alpha10-beta1 complex(GO:0034680) |
| 0.1 | 1.9 | GO:0030478 | actin cap(GO:0030478) |
| 0.1 | 0.6 | GO:0014701 | junctional sarcoplasmic reticulum membrane(GO:0014701) |
| 0.1 | 3.0 | GO:0060077 | inhibitory synapse(GO:0060077) |
| 0.1 | 3.0 | GO:1990454 | L-type voltage-gated calcium channel complex(GO:1990454) |
| 0.1 | 2.8 | GO:0005652 | nuclear lamina(GO:0005652) |
| 0.1 | 0.9 | GO:0070110 | ciliary neurotrophic factor receptor complex(GO:0070110) |
| 0.1 | 3.8 | GO:0071682 | endocytic vesicle lumen(GO:0071682) |
| 0.1 | 17.0 | GO:0005901 | caveola(GO:0005901) |
| 0.1 | 1.8 | GO:0042641 | actomyosin(GO:0042641) |
| 0.1 | 0.5 | GO:1990851 | Wnt-Frizzled-LRP5/6 complex(GO:1990851) |
| 0.1 | 4.8 | GO:0044295 | axonal growth cone(GO:0044295) |
| 0.1 | 0.2 | GO:0036457 | keratohyalin granule(GO:0036457) |
| 0.1 | 1.2 | GO:0046696 | lipopolysaccharide receptor complex(GO:0046696) |
| 0.1 | 3.3 | GO:0034706 | sodium channel complex(GO:0034706) |
| 0.1 | 2.2 | GO:0031362 | anchored component of external side of plasma membrane(GO:0031362) |
| 0.1 | 0.6 | GO:1990393 | 3M complex(GO:1990393) |
| 0.1 | 1.6 | GO:0008091 | spectrin(GO:0008091) |
| 0.1 | 1.3 | GO:0005751 | mitochondrial respiratory chain complex IV(GO:0005751) |
| 0.1 | 3.0 | GO:0042629 | mast cell granule(GO:0042629) |
| 0.1 | 0.5 | GO:0072687 | meiotic spindle(GO:0072687) |
| 0.1 | 0.3 | GO:0002133 | polycystin complex(GO:0002133) |
| 0.1 | 5.2 | GO:0014704 | intercalated disc(GO:0014704) |
| 0.1 | 1.0 | GO:0005915 | zonula adherens(GO:0005915) |
| 0.1 | 0.2 | GO:0016939 | kinesin II complex(GO:0016939) |
| 0.1 | 1.1 | GO:0030130 | clathrin coat of trans-Golgi network vesicle(GO:0030130) |
| 0.1 | 8.9 | GO:0005604 | basement membrane(GO:0005604) |
| 0.1 | 3.8 | GO:0031093 | platelet alpha granule lumen(GO:0031093) |
| 0.1 | 0.1 | GO:0005924 | cell-substrate adherens junction(GO:0005924) |
| 0.1 | 0.1 | GO:0016533 | cyclin-dependent protein kinase 5 holoenzyme complex(GO:0016533) |
| 0.1 | 3.7 | GO:0031941 | filamentous actin(GO:0031941) |
| 0.0 | 1.6 | GO:0043218 | compact myelin(GO:0043218) |
| 0.0 | 1.2 | GO:0036038 | MKS complex(GO:0036038) |
| 0.0 | 0.2 | GO:0033596 | TSC1-TSC2 complex(GO:0033596) |
| 0.0 | 19.5 | GO:0005788 | endoplasmic reticulum lumen(GO:0005788) |
| 0.0 | 0.2 | GO:0008275 | gamma-tubulin small complex(GO:0008275) |
| 0.0 | 1.6 | GO:0030014 | CCR4-NOT complex(GO:0030014) |
| 0.0 | 0.6 | GO:0071141 | SMAD protein complex(GO:0071141) |
| 0.0 | 1.4 | GO:0032982 | myosin filament(GO:0032982) |
| 0.0 | 0.1 | GO:0070685 | macropinocytic cup(GO:0070685) |
| 0.0 | 0.6 | GO:0071144 | SMAD2-SMAD3 protein complex(GO:0071144) |
| 0.0 | 0.4 | GO:0035985 | senescence-associated heterochromatin focus(GO:0035985) |
| 0.0 | 1.4 | GO:0016471 | vacuolar proton-transporting V-type ATPase complex(GO:0016471) |
| 0.0 | 3.9 | GO:0097610 | cleavage furrow(GO:0032154) cell surface furrow(GO:0097610) |
| 0.0 | 1.2 | GO:0044300 | cerebellar mossy fiber(GO:0044300) |
| 0.0 | 0.2 | GO:0070435 | Shc-EGFR complex(GO:0070435) |
| 0.0 | 0.4 | GO:0031428 | box C/D snoRNP complex(GO:0031428) |
| 0.0 | 0.5 | GO:0005853 | eukaryotic translation elongation factor 1 complex(GO:0005853) |
| 0.0 | 0.5 | GO:0072546 | ER membrane protein complex(GO:0072546) |
| 0.0 | 0.7 | GO:0005847 | mRNA cleavage and polyadenylation specificity factor complex(GO:0005847) |
| 0.0 | 4.4 | GO:0043202 | lysosomal lumen(GO:0043202) |
| 0.0 | 5.5 | GO:0072562 | blood microparticle(GO:0072562) |
| 0.0 | 1.2 | GO:0031307 | integral component of mitochondrial outer membrane(GO:0031307) |
| 0.0 | 1.0 | GO:0031528 | microvillus membrane(GO:0031528) |
| 0.0 | 1.5 | GO:0090545 | NuRD complex(GO:0016581) CHD-type complex(GO:0090545) |
| 0.0 | 0.4 | GO:0042382 | paraspeckles(GO:0042382) |
| 0.0 | 1.3 | GO:0005719 | nuclear euchromatin(GO:0005719) |
| 0.0 | 0.2 | GO:0060053 | neurofilament cytoskeleton(GO:0060053) |
| 0.0 | 0.6 | GO:0030914 | STAGA complex(GO:0030914) |
| 0.0 | 8.6 | GO:0043209 | myelin sheath(GO:0043209) |
| 0.0 | 17.5 | GO:0031012 | extracellular matrix(GO:0031012) |
| 0.0 | 0.2 | GO:0070876 | SOSS complex(GO:0070876) |
| 0.0 | 0.4 | GO:0016602 | CCAAT-binding factor complex(GO:0016602) |
| 0.0 | 0.2 | GO:0070369 | beta-catenin-TCF7L2 complex(GO:0070369) catenin-TCF7L2 complex(GO:0071664) |
| 0.0 | 0.1 | GO:0045179 | apical cortex(GO:0045179) |
| 0.0 | 3.4 | GO:0005811 | lipid particle(GO:0005811) |
| 0.0 | 0.8 | GO:0005952 | cAMP-dependent protein kinase complex(GO:0005952) |
| 0.0 | 0.8 | GO:0034364 | high-density lipoprotein particle(GO:0034364) |
| 0.0 | 2.4 | GO:0045095 | keratin filament(GO:0045095) |
| 0.0 | 0.4 | GO:0030991 | intraciliary transport particle A(GO:0030991) |
| 0.0 | 0.9 | GO:0000145 | exocyst(GO:0000145) |
| 0.0 | 1.0 | GO:1990124 | messenger ribonucleoprotein complex(GO:1990124) |
| 0.0 | 0.2 | GO:0042765 | GPI-anchor transamidase complex(GO:0042765) |
| 0.0 | 1.4 | GO:0035861 | site of double-strand break(GO:0035861) |
| 0.0 | 0.7 | GO:0097546 | ciliary base(GO:0097546) |
| 0.0 | 0.2 | GO:0031302 | intrinsic component of endosome membrane(GO:0031302) |
| 0.0 | 0.2 | GO:0005885 | Arp2/3 protein complex(GO:0005885) |
| 0.0 | 3.8 | GO:0043679 | axon terminus(GO:0043679) |
| 0.0 | 0.5 | GO:0036057 | filtration diaphragm(GO:0036056) slit diaphragm(GO:0036057) |
| 0.0 | 1.8 | GO:0030173 | integral component of Golgi membrane(GO:0030173) |
| 0.0 | 1.6 | GO:0005902 | microvillus(GO:0005902) |
| 0.0 | 16.8 | GO:0005925 | focal adhesion(GO:0005925) |
| 0.0 | 1.7 | GO:0031907 | peroxisomal matrix(GO:0005782) microbody lumen(GO:0031907) |
| 0.0 | 0.3 | GO:0043083 | synaptic cleft(GO:0043083) |
| 0.0 | 2.3 | GO:0060170 | ciliary membrane(GO:0060170) |
| 0.0 | 0.3 | GO:0033256 | I-kappaB/NF-kappaB complex(GO:0033256) |
| 0.0 | 0.3 | GO:0043194 | axon initial segment(GO:0043194) |
| 0.0 | 0.6 | GO:0097517 | stress fiber(GO:0001725) contractile actin filament bundle(GO:0097517) |
| 0.0 | 0.3 | GO:0031211 | serine C-palmitoyltransferase complex(GO:0017059) endoplasmic reticulum palmitoyltransferase complex(GO:0031211) |
| 0.0 | 0.2 | GO:0071437 | invadopodium(GO:0071437) |
| 0.0 | 3.3 | GO:0042383 | sarcolemma(GO:0042383) |
| 0.0 | 0.1 | GO:0044308 | axonal spine(GO:0044308) |
| 0.0 | 3.0 | GO:0008076 | voltage-gated potassium channel complex(GO:0008076) |
| 0.0 | 0.7 | GO:0005790 | smooth endoplasmic reticulum(GO:0005790) |
| 0.0 | 0.5 | GO:0000177 | cytoplasmic exosome (RNase complex)(GO:0000177) |
| 0.0 | 8.3 | GO:0016324 | apical plasma membrane(GO:0016324) |
| 0.0 | 1.0 | GO:0005834 | heterotrimeric G-protein complex(GO:0005834) |
| 0.0 | 0.6 | GO:0031304 | intrinsic component of mitochondrial inner membrane(GO:0031304) integral component of mitochondrial inner membrane(GO:0031305) |
| 0.0 | 0.1 | GO:1990745 | EARP complex(GO:1990745) |
| 0.0 | 0.1 | GO:0032584 | growth cone membrane(GO:0032584) |
| 0.0 | 1.1 | GO:0005882 | intermediate filament(GO:0005882) |
| 0.0 | 0.3 | GO:0002102 | podosome(GO:0002102) |
| 0.0 | 0.1 | GO:0032021 | NELF complex(GO:0032021) |
| 0.0 | 2.6 | GO:0043296 | apical junction complex(GO:0043296) |
| 0.0 | 0.1 | GO:0034274 | Atg12-Atg5-Atg16 complex(GO:0034274) |
| 0.0 | 0.4 | GO:0048188 | Set1C/COMPASS complex(GO:0048188) |
| 0.0 | 0.2 | GO:0031526 | brush border membrane(GO:0031526) |
| 0.0 | 0.0 | GO:0031251 | PAN complex(GO:0031251) |
| 0.0 | 0.1 | GO:0016327 | apicolateral plasma membrane(GO:0016327) |
| 0.0 | 2.8 | GO:0005795 | Golgi stack(GO:0005795) |
| 0.0 | 0.2 | GO:0030663 | COPI-coated vesicle membrane(GO:0030663) |
| 0.0 | 0.2 | GO:0031092 | platelet alpha granule membrane(GO:0031092) |
| 0.0 | 1.2 | GO:0034707 | chloride channel complex(GO:0034707) |
| 0.0 | 0.0 | GO:0035370 | UBC13-UEV1A complex(GO:0035370) |
| 0.0 | 1.4 | GO:0030672 | synaptic vesicle membrane(GO:0030672) exocytic vesicle membrane(GO:0099501) |
| 0.0 | 0.3 | GO:0032045 | guanyl-nucleotide exchange factor complex(GO:0032045) |
| 0.0 | 0.2 | GO:0000178 | exosome (RNase complex)(GO:0000178) |
| 0.0 | 0.1 | GO:0097136 | Bcl-2 family protein complex(GO:0097136) |
| 0.0 | 5.8 | GO:0043025 | neuronal cell body(GO:0043025) |
| 0.0 | 0.1 | GO:0044853 | plasma membrane raft(GO:0044853) |
| 0.0 | 0.6 | GO:0045171 | intercellular bridge(GO:0045171) |
Gene overrepresentation in molecular function category:
| Log-likelihood per target | Total log-likelihood | Term | Description |
|---|---|---|---|
| 2.2 | 8.8 | GO:0031751 | D4 dopamine receptor binding(GO:0031751) |
| 1.0 | 3.0 | GO:0003845 | 11-beta-hydroxysteroid dehydrogenase [NAD(P)] activity(GO:0003845) |
| 1.0 | 6.0 | GO:0016941 | natriuretic peptide receptor activity(GO:0016941) |
| 0.9 | 3.7 | GO:0005019 | platelet-derived growth factor beta-receptor activity(GO:0005019) |
| 0.8 | 8.5 | GO:0060072 | large conductance calcium-activated potassium channel activity(GO:0060072) |
| 0.8 | 2.4 | GO:0070123 | transforming growth factor beta receptor activity, type III(GO:0070123) |
| 0.7 | 2.2 | GO:0033791 | 3alpha,7alpha,12alpha-trihydroxy-5beta-cholestanoyl-CoA 24-hydroxylase activity(GO:0033791) |
| 0.6 | 1.9 | GO:0090422 | thiamine pyrophosphate transporter activity(GO:0090422) |
| 0.6 | 3.2 | GO:0005006 | epidermal growth factor-activated receptor activity(GO:0005006) |
| 0.6 | 1.3 | GO:0031696 | alpha-2C adrenergic receptor binding(GO:0031696) |
| 0.6 | 3.2 | GO:0052596 | tryptamine:oxygen oxidoreductase (deaminating) activity(GO:0052593) aminoacetone:oxygen oxidoreductase(deaminating) activity(GO:0052594) aliphatic-amine oxidase activity(GO:0052595) phenethylamine:oxygen oxidoreductase (deaminating) activity(GO:0052596) |
| 0.6 | 1.8 | GO:0004938 | alpha2-adrenergic receptor activity(GO:0004938) |
| 0.6 | 1.7 | GO:0070506 | high-density lipoprotein particle receptor activity(GO:0070506) |
| 0.6 | 2.3 | GO:0035373 | chondroitin sulfate proteoglycan binding(GO:0035373) |
| 0.5 | 3.8 | GO:0004962 | endothelin receptor activity(GO:0004962) |
| 0.5 | 3.8 | GO:0008273 | calcium, potassium:sodium antiporter activity(GO:0008273) |
| 0.5 | 2.2 | GO:0038085 | vascular endothelial growth factor binding(GO:0038085) |
| 0.5 | 4.8 | GO:0033743 | peptide-methionine (R)-S-oxide reductase activity(GO:0033743) |
| 0.5 | 5.2 | GO:0004957 | prostaglandin E receptor activity(GO:0004957) |
| 0.5 | 4.0 | GO:0005250 | A-type (transient outward) potassium channel activity(GO:0005250) |
| 0.5 | 4.4 | GO:0061133 | endopeptidase activator activity(GO:0061133) |
| 0.5 | 3.9 | GO:0032810 | sterol response element binding(GO:0032810) |
| 0.4 | 1.6 | GO:0072591 | citrate-L-glutamate ligase activity(GO:0072591) |
| 0.4 | 2.0 | GO:0005010 | insulin-like growth factor-activated receptor activity(GO:0005010) |
| 0.4 | 1.2 | GO:0036332 | VEGF-A-activated receptor activity(GO:0036326) VEGF-B-activated receptor activity(GO:0036327) placental growth factor-activated receptor activity(GO:0036332) |
| 0.4 | 2.3 | GO:0004965 | G-protein coupled GABA receptor activity(GO:0004965) |
| 0.4 | 6.4 | GO:0048407 | platelet-derived growth factor binding(GO:0048407) |
| 0.4 | 3.6 | GO:0048495 | Roundabout binding(GO:0048495) |
| 0.3 | 3.6 | GO:1904929 | coreceptor activity involved in Wnt signaling pathway, planar cell polarity pathway(GO:1904929) |
| 0.3 | 6.6 | GO:0047372 | acylglycerol lipase activity(GO:0047372) |
| 0.3 | 1.6 | GO:1990430 | extracellular matrix protein binding(GO:1990430) |
| 0.3 | 1.3 | GO:0005292 | high-affinity basic amino acid transmembrane transporter activity(GO:0005287) high-affinity arginine transmembrane transporter activity(GO:0005289) high-affinity lysine transmembrane transporter activity(GO:0005292) |
| 0.3 | 0.9 | GO:2001069 | glycogen binding(GO:2001069) |
| 0.3 | 0.9 | GO:0080023 | 3R-hydroxyacyl-CoA dehydratase activity(GO:0080023) |
| 0.3 | 1.9 | GO:0048101 | calcium- and calmodulin-regulated 3',5'-cyclic-GMP phosphodiesterase activity(GO:0048101) |
| 0.3 | 1.5 | GO:0086020 | gap junction hemi-channel activity(GO:0055077) gap junction channel activity involved in SA node cell-atrial cardiac muscle cell electrical coupling(GO:0086020) |
| 0.3 | 2.7 | GO:0005134 | interleukin-2 receptor binding(GO:0005134) |
| 0.3 | 3.9 | GO:0035374 | chondroitin sulfate binding(GO:0035374) |
| 0.3 | 2.1 | GO:0043237 | laminin-1 binding(GO:0043237) |
| 0.3 | 1.5 | GO:0016933 | extracellular-glycine-gated ion channel activity(GO:0016933) extracellular-glycine-gated chloride channel activity(GO:0016934) |
| 0.3 | 0.9 | GO:0051379 | epinephrine binding(GO:0051379) |
| 0.3 | 0.9 | GO:0004119 | cGMP-inhibited cyclic-nucleotide phosphodiesterase activity(GO:0004119) |
| 0.3 | 1.2 | GO:0015375 | glycine:sodium symporter activity(GO:0015375) |
| 0.3 | 5.8 | GO:0004089 | carbonate dehydratase activity(GO:0004089) |
| 0.3 | 0.8 | GO:0017129 | triglyceride binding(GO:0017129) |
| 0.3 | 1.4 | GO:0004775 | succinate-CoA ligase (ADP-forming) activity(GO:0004775) |
| 0.3 | 1.9 | GO:0046624 | sphingolipid transporter activity(GO:0046624) |
| 0.3 | 1.3 | GO:0016524 | latrotoxin receptor activity(GO:0016524) |
| 0.2 | 1.2 | GO:0019797 | procollagen-proline 3-dioxygenase activity(GO:0019797) |
| 0.2 | 1.0 | GO:0050698 | proteoglycan sulfotransferase activity(GO:0050698) |
| 0.2 | 1.2 | GO:0050220 | prostaglandin-E synthase activity(GO:0050220) |
| 0.2 | 1.1 | GO:0004157 | dihydropyrimidinase activity(GO:0004157) |
| 0.2 | 3.3 | GO:0070700 | BMP receptor binding(GO:0070700) |
| 0.2 | 1.5 | GO:0047045 | testosterone 17-beta-dehydrogenase (NADP+) activity(GO:0047045) |
| 0.2 | 0.8 | GO:0032089 | NACHT domain binding(GO:0032089) |
| 0.2 | 0.6 | GO:0060175 | brain-derived neurotrophic factor-activated receptor activity(GO:0060175) |
| 0.2 | 1.7 | GO:0001849 | complement component C1q binding(GO:0001849) |
| 0.2 | 1.7 | GO:0008449 | N-acetylglucosamine-6-sulfatase activity(GO:0008449) |
| 0.2 | 1.7 | GO:0070891 | lipoteichoic acid binding(GO:0070891) |
| 0.2 | 0.5 | GO:0071936 | coreceptor activity involved in Wnt signaling pathway(GO:0071936) coreceptor activity involved in canonical Wnt signaling pathway(GO:1904928) |
| 0.2 | 1.4 | GO:0004111 | creatine kinase activity(GO:0004111) |
| 0.2 | 1.7 | GO:0004720 | protein-lysine 6-oxidase activity(GO:0004720) |
| 0.2 | 1.9 | GO:0071532 | ankyrin repeat binding(GO:0071532) |
| 0.2 | 1.3 | GO:0019798 | procollagen-proline 4-dioxygenase activity(GO:0004656) procollagen-proline dioxygenase activity(GO:0019798) |
| 0.2 | 1.5 | GO:0001517 | N-acetylglucosamine 6-O-sulfotransferase activity(GO:0001517) |
| 0.2 | 5.0 | GO:0017049 | GTP-Rho binding(GO:0017049) |
| 0.2 | 0.5 | GO:0031755 | endothelial differentiation G-protein coupled receptor binding(GO:0031753) Edg-2 lysophosphatidic acid receptor binding(GO:0031755) |
| 0.2 | 5.1 | GO:0042043 | neurexin family protein binding(GO:0042043) |
| 0.2 | 1.1 | GO:0004966 | galanin receptor activity(GO:0004966) |
| 0.2 | 1.6 | GO:0015349 | thyroid hormone transmembrane transporter activity(GO:0015349) |
| 0.2 | 5.6 | GO:0005337 | nucleoside transmembrane transporter activity(GO:0005337) |
| 0.2 | 3.3 | GO:0070324 | thyroid hormone binding(GO:0070324) |
| 0.2 | 1.1 | GO:1990932 | 5.8S rRNA binding(GO:1990932) |
| 0.2 | 3.0 | GO:0019911 | structural constituent of myelin sheath(GO:0019911) |
| 0.2 | 2.0 | GO:0031995 | insulin-like growth factor II binding(GO:0031995) |
| 0.2 | 3.0 | GO:0005172 | vascular endothelial growth factor receptor binding(GO:0005172) |
| 0.1 | 0.6 | GO:0001601 | peptide YY receptor activity(GO:0001601) |
| 0.1 | 2.4 | GO:0032050 | clathrin heavy chain binding(GO:0032050) |
| 0.1 | 1.0 | GO:0044729 | hemi-methylated DNA-binding(GO:0044729) |
| 0.1 | 1.1 | GO:0004735 | pyrroline-5-carboxylate reductase activity(GO:0004735) |
| 0.1 | 0.9 | GO:0004471 | malate dehydrogenase (decarboxylating) (NAD+) activity(GO:0004471) malate dehydrogenase (decarboxylating) (NADP+) activity(GO:0004473) |
| 0.1 | 0.5 | GO:0004773 | steryl-sulfatase activity(GO:0004773) |
| 0.1 | 0.6 | GO:0048763 | calcium-induced calcium release activity(GO:0048763) |
| 0.1 | 1.2 | GO:0043426 | MRF binding(GO:0043426) |
| 0.1 | 0.6 | GO:0004619 | bisphosphoglycerate mutase activity(GO:0004082) phosphoglycerate mutase activity(GO:0004619) 2,3-bisphosphoglycerate-dependent phosphoglycerate mutase activity(GO:0046538) |
| 0.1 | 4.7 | GO:0004602 | glutathione peroxidase activity(GO:0004602) |
| 0.1 | 1.6 | GO:0070097 | delta-catenin binding(GO:0070097) |
| 0.1 | 1.2 | GO:0086083 | cell adhesive protein binding involved in bundle of His cell-Purkinje myocyte communication(GO:0086083) |
| 0.1 | 0.2 | GO:0005046 | KDEL sequence binding(GO:0005046) |
| 0.1 | 21.5 | GO:0005518 | collagen binding(GO:0005518) |
| 0.1 | 2.7 | GO:0008179 | adenylate cyclase binding(GO:0008179) |
| 0.1 | 1.9 | GO:0042608 | T cell receptor binding(GO:0042608) |
| 0.1 | 0.8 | GO:0044323 | retinoic acid-responsive element binding(GO:0044323) |
| 0.1 | 0.6 | GO:0045131 | pre-mRNA branch point binding(GO:0045131) |
| 0.1 | 0.6 | GO:0005111 | type 2 fibroblast growth factor receptor binding(GO:0005111) |
| 0.1 | 0.6 | GO:0044736 | acid-sensing ion channel activity(GO:0044736) |
| 0.1 | 2.3 | GO:0042813 | Wnt-activated receptor activity(GO:0042813) |
| 0.1 | 0.8 | GO:0031994 | insulin-like growth factor I binding(GO:0031994) |
| 0.1 | 0.9 | GO:0036132 | 13-prostaglandin reductase activity(GO:0036132) 15-oxoprostaglandin 13-oxidase activity(GO:0047522) |
| 0.1 | 0.5 | GO:0005173 | stem cell factor receptor binding(GO:0005173) |
| 0.1 | 1.4 | GO:0042731 | PH domain binding(GO:0042731) |
| 0.1 | 1.1 | GO:0001665 | alpha-N-acetylgalactosaminide alpha-2,6-sialyltransferase activity(GO:0001665) |
| 0.1 | 4.1 | GO:0004181 | metallocarboxypeptidase activity(GO:0004181) |
| 0.1 | 0.3 | GO:0004174 | electron-transferring-flavoprotein dehydrogenase activity(GO:0004174) oxidoreductase activity, acting on the CH-NH group of donors, quinone or similar compound as acceptor(GO:0016649) |
| 0.1 | 0.7 | GO:0003987 | acetate-CoA ligase activity(GO:0003987) |
| 0.1 | 2.5 | GO:0004745 | retinol dehydrogenase activity(GO:0004745) |
| 0.1 | 1.8 | GO:1990239 | steroid hormone binding(GO:1990239) |
| 0.1 | 0.8 | GO:0008079 | translation release factor activity(GO:0003747) translation termination factor activity(GO:0008079) |
| 0.1 | 1.4 | GO:0015280 | ligand-gated sodium channel activity(GO:0015280) |
| 0.1 | 0.4 | GO:0050211 | procollagen galactosyltransferase activity(GO:0050211) |
| 0.1 | 2.5 | GO:0001134 | transcription factor activity, transcription factor recruiting(GO:0001134) |
| 0.1 | 1.5 | GO:0004716 | receptor signaling protein tyrosine kinase activity(GO:0004716) |
| 0.1 | 0.3 | GO:0004416 | hydroxyacylglutathione hydrolase activity(GO:0004416) |
| 0.1 | 0.5 | GO:0018685 | alkane 1-monooxygenase activity(GO:0018685) |
| 0.1 | 1.5 | GO:0022851 | GABA-gated chloride ion channel activity(GO:0022851) |
| 0.1 | 0.5 | GO:0004692 | cGMP-dependent protein kinase activity(GO:0004692) |
| 0.1 | 0.9 | GO:0004897 | ciliary neurotrophic factor receptor activity(GO:0004897) |
| 0.1 | 0.4 | GO:0052655 | branched-chain-amino-acid transaminase activity(GO:0004084) L-leucine transaminase activity(GO:0052654) L-valine transaminase activity(GO:0052655) L-isoleucine transaminase activity(GO:0052656) |
| 0.1 | 0.7 | GO:0098988 | adenylate cyclase inhibiting G-protein coupled glutamate receptor activity(GO:0001640) G-protein coupled glutamate receptor activity(GO:0098988) |
| 0.1 | 0.7 | GO:0044547 | DNA topoisomerase binding(GO:0044547) |
| 0.1 | 0.4 | GO:0016823 | hydrolase activity, acting on acid carbon-carbon bonds(GO:0016822) hydrolase activity, acting on acid carbon-carbon bonds, in ketonic substances(GO:0016823) |
| 0.1 | 0.9 | GO:0016286 | small conductance calcium-activated potassium channel activity(GO:0016286) |
| 0.1 | 0.8 | GO:0003910 | DNA ligase (ATP) activity(GO:0003910) |
| 0.1 | 1.3 | GO:0016641 | oxidoreductase activity, acting on the CH-NH2 group of donors, oxygen as acceptor(GO:0016641) |
| 0.1 | 0.4 | GO:0016213 | linoleoyl-CoA desaturase activity(GO:0016213) |
| 0.1 | 0.3 | GO:0005462 | UDP-N-acetylglucosamine transmembrane transporter activity(GO:0005462) |
| 0.1 | 0.5 | GO:0008532 | N-acetyllactosaminide beta-1,3-N-acetylglucosaminyltransferase activity(GO:0008532) |
| 0.1 | 0.6 | GO:0008269 | JAK pathway signal transduction adaptor activity(GO:0008269) |
| 0.1 | 0.2 | GO:0047661 | L-serine ammonia-lyase activity(GO:0003941) racemase and epimerase activity, acting on amino acids and derivatives(GO:0016855) racemase activity, acting on amino acids and derivatives(GO:0036361) amino-acid racemase activity(GO:0047661) |
| 0.1 | 1.2 | GO:0030881 | beta-2-microglobulin binding(GO:0030881) |
| 0.1 | 1.4 | GO:0010314 | phosphatidylinositol-5-phosphate binding(GO:0010314) |
| 0.1 | 0.2 | GO:0016422 | rRNA (adenine-N6-)-methyltransferase activity(GO:0008988) mRNA (2'-O-methyladenosine-N6-)-methyltransferase activity(GO:0016422) |
| 0.1 | 0.3 | GO:0003938 | IMP dehydrogenase activity(GO:0003938) |
| 0.1 | 1.7 | GO:0030215 | semaphorin receptor binding(GO:0030215) |
| 0.1 | 4.8 | GO:0005154 | epidermal growth factor receptor binding(GO:0005154) |
| 0.1 | 3.1 | GO:0005159 | insulin-like growth factor receptor binding(GO:0005159) |
| 0.1 | 2.2 | GO:0005528 | macrolide binding(GO:0005527) FK506 binding(GO:0005528) |
| 0.1 | 1.0 | GO:0003708 | retinoic acid receptor activity(GO:0003708) |
| 0.1 | 2.1 | GO:0097109 | neuroligin family protein binding(GO:0097109) |
| 0.1 | 0.2 | GO:0070039 | rRNA (guanosine-2'-O-)-methyltransferase activity(GO:0070039) |
| 0.1 | 0.7 | GO:0070699 | type II activin receptor binding(GO:0070699) |
| 0.1 | 0.7 | GO:0005329 | dopamine transmembrane transporter activity(GO:0005329) |
| 0.1 | 0.2 | GO:0030618 | transforming growth factor beta receptor, pathway-specific cytoplasmic mediator activity(GO:0030618) |
| 0.1 | 1.1 | GO:0015245 | fatty acid transporter activity(GO:0015245) |
| 0.1 | 1.9 | GO:0004190 | aspartic-type endopeptidase activity(GO:0004190) |
| 0.1 | 0.2 | GO:0008260 | 3-oxoacid CoA-transferase activity(GO:0008260) |
| 0.1 | 0.7 | GO:0051378 | amine binding(GO:0043176) serotonin binding(GO:0051378) |
| 0.1 | 1.7 | GO:0001848 | complement binding(GO:0001848) |
| 0.1 | 0.9 | GO:0008526 | phosphatidylinositol transporter activity(GO:0008526) |
| 0.1 | 1.7 | GO:0004653 | polypeptide N-acetylgalactosaminyltransferase activity(GO:0004653) |
| 0.1 | 2.9 | GO:0043015 | gamma-tubulin binding(GO:0043015) |
| 0.1 | 0.1 | GO:0016534 | cyclin-dependent protein kinase 5 activator activity(GO:0016534) |
| 0.1 | 0.8 | GO:0086056 | voltage-gated calcium channel activity involved in AV node cell action potential(GO:0086056) |
| 0.1 | 3.3 | GO:0043425 | bHLH transcription factor binding(GO:0043425) |
| 0.0 | 0.2 | GO:0046921 | glycoprotein 6-alpha-L-fucosyltransferase activity(GO:0008424) alpha-(1->6)-fucosyltransferase activity(GO:0046921) |
| 0.0 | 0.7 | GO:0004075 | biotin carboxylase activity(GO:0004075) |
| 0.0 | 0.3 | GO:0030197 | extracellular matrix constituent, lubricant activity(GO:0030197) |
| 0.0 | 0.8 | GO:0008417 | fucosyltransferase activity(GO:0008417) |
| 0.0 | 2.6 | GO:0051721 | protein phosphatase 2A binding(GO:0051721) |
| 0.0 | 1.1 | GO:0005314 | high-affinity glutamate transmembrane transporter activity(GO:0005314) |
| 0.0 | 0.7 | GO:0000774 | adenyl-nucleotide exchange factor activity(GO:0000774) |
| 0.0 | 0.5 | GO:0086006 | voltage-gated sodium channel activity involved in cardiac muscle cell action potential(GO:0086006) |
| 0.0 | 1.4 | GO:0070182 | DNA polymerase binding(GO:0070182) |
| 0.0 | 0.5 | GO:0004969 | histamine receptor activity(GO:0004969) |
| 0.0 | 0.3 | GO:0060961 | phospholipase D inhibitor activity(GO:0060961) |
| 0.0 | 0.6 | GO:0045159 | myosin II binding(GO:0045159) |
| 0.0 | 1.3 | GO:0015114 | phosphate ion transmembrane transporter activity(GO:0015114) |
| 0.0 | 0.2 | GO:0070012 | oligopeptidase activity(GO:0070012) |
| 0.0 | 1.1 | GO:0030957 | Tat protein binding(GO:0030957) |
| 0.0 | 0.9 | GO:0070411 | I-SMAD binding(GO:0070411) |
| 0.0 | 1.9 | GO:0005521 | lamin binding(GO:0005521) |
| 0.0 | 0.2 | GO:0004937 | alpha1-adrenergic receptor activity(GO:0004937) |
| 0.0 | 0.8 | GO:0043522 | leucine zipper domain binding(GO:0043522) |
| 0.0 | 0.2 | GO:0004772 | sterol O-acyltransferase activity(GO:0004772) cholesterol O-acyltransferase activity(GO:0034736) |
| 0.0 | 1.2 | GO:0001530 | lipopolysaccharide binding(GO:0001530) |
| 0.0 | 0.4 | GO:0034511 | U3 snoRNA binding(GO:0034511) |
| 0.0 | 2.8 | GO:0042379 | chemokine receptor binding(GO:0042379) |
| 0.0 | 1.6 | GO:0070064 | proline-rich region binding(GO:0070064) |
| 0.0 | 1.5 | GO:0050840 | extracellular matrix binding(GO:0050840) |
| 0.0 | 1.3 | GO:0015002 | cytochrome-c oxidase activity(GO:0004129) heme-copper terminal oxidase activity(GO:0015002) oxidoreductase activity, acting on a heme group of donors, oxygen as acceptor(GO:0016676) |
| 0.0 | 0.8 | GO:0016500 | protein-hormone receptor activity(GO:0016500) |
| 0.0 | 0.4 | GO:0070878 | primary miRNA binding(GO:0070878) |
| 0.0 | 0.6 | GO:0005007 | fibroblast growth factor-activated receptor activity(GO:0005007) |
| 0.0 | 3.9 | GO:0005201 | extracellular matrix structural constituent(GO:0005201) |
| 0.0 | 0.7 | GO:0019871 | sodium channel inhibitor activity(GO:0019871) |
| 0.0 | 1.0 | GO:0047555 | 3',5'-cyclic-GMP phosphodiesterase activity(GO:0047555) |
| 0.0 | 0.3 | GO:0016454 | serine C-palmitoyltransferase activity(GO:0004758) C-palmitoyltransferase activity(GO:0016454) |
| 0.0 | 0.1 | GO:0004145 | diamine N-acetyltransferase activity(GO:0004145) |
| 0.0 | 1.0 | GO:0004143 | diacylglycerol kinase activity(GO:0004143) |
| 0.0 | 0.5 | GO:0032051 | clathrin light chain binding(GO:0032051) |
| 0.0 | 0.5 | GO:0017147 | Wnt-protein binding(GO:0017147) |
| 0.0 | 0.5 | GO:0017154 | semaphorin receptor activity(GO:0017154) |
| 0.0 | 0.1 | GO:0035033 | histone deacetylase regulator activity(GO:0035033) |
| 0.0 | 0.3 | GO:0034056 | estrogen response element binding(GO:0034056) |
| 0.0 | 0.5 | GO:0019841 | retinol binding(GO:0019841) |
| 0.0 | 0.7 | GO:0005024 | transforming growth factor beta-activated receptor activity(GO:0005024) |
| 0.0 | 0.0 | GO:0050682 | AF-2 domain binding(GO:0050682) |
| 0.0 | 5.3 | GO:0008201 | heparin binding(GO:0008201) |
| 0.0 | 0.3 | GO:0050833 | pyruvate transmembrane transporter activity(GO:0050833) |
| 0.0 | 0.1 | GO:0033858 | N-acetylgalactosamine kinase activity(GO:0033858) |
| 0.0 | 0.5 | GO:0051400 | BH domain binding(GO:0051400) |
| 0.0 | 0.5 | GO:0050998 | nitric-oxide synthase binding(GO:0050998) |
| 0.0 | 1.1 | GO:0032266 | phosphatidylinositol-3-phosphate binding(GO:0032266) |
| 0.0 | 11.7 | GO:0044822 | mRNA binding(GO:0003729) poly(A) RNA binding(GO:0044822) |
| 0.0 | 0.3 | GO:0008379 | thioredoxin peroxidase activity(GO:0008379) |
| 0.0 | 0.2 | GO:0008048 | calcium sensitive guanylate cyclase activator activity(GO:0008048) |
| 0.0 | 0.6 | GO:0008191 | metalloendopeptidase inhibitor activity(GO:0008191) |
| 0.0 | 0.8 | GO:0005248 | voltage-gated sodium channel activity(GO:0005248) voltage-gated ion channel activity involved in regulation of postsynaptic membrane potential(GO:1905030) |
| 0.0 | 0.2 | GO:0003923 | GPI-anchor transamidase activity(GO:0003923) |
| 0.0 | 1.0 | GO:0005251 | delayed rectifier potassium channel activity(GO:0005251) |
| 0.0 | 0.3 | GO:0022889 | L-serine transmembrane transporter activity(GO:0015194) serine transmembrane transporter activity(GO:0022889) |
| 0.0 | 3.0 | GO:0001618 | virus receptor activity(GO:0001618) |
| 0.0 | 0.6 | GO:0015269 | calcium-activated potassium channel activity(GO:0015269) |
| 0.0 | 0.8 | GO:0031683 | G-protein beta/gamma-subunit complex binding(GO:0031683) |
| 0.0 | 0.1 | GO:0031708 | endothelin B receptor binding(GO:0031708) |
| 0.0 | 0.8 | GO:0008239 | dipeptidyl-peptidase activity(GO:0008239) |
| 0.0 | 8.0 | GO:0004252 | serine-type endopeptidase activity(GO:0004252) |
| 0.0 | 0.7 | GO:0098641 | cadherin binding involved in cell-cell adhesion(GO:0098641) |
| 0.0 | 0.6 | GO:0022841 | potassium ion leak channel activity(GO:0022841) |
| 0.0 | 0.2 | GO:0008440 | inositol-1,4,5-trisphosphate 3-kinase activity(GO:0008440) |
| 0.0 | 3.1 | GO:0008307 | structural constituent of muscle(GO:0008307) |
| 0.0 | 1.0 | GO:0015248 | sterol transporter activity(GO:0015248) |
| 0.0 | 0.5 | GO:0008432 | JUN kinase binding(GO:0008432) |
| 0.0 | 0.5 | GO:0050431 | transforming growth factor beta binding(GO:0050431) |
| 0.0 | 0.5 | GO:0017128 | phospholipid scramblase activity(GO:0017128) |
| 0.0 | 0.3 | GO:0097371 | MDM2/MDM4 family protein binding(GO:0097371) |
| 0.0 | 0.7 | GO:0051428 | peptide hormone receptor binding(GO:0051428) |
| 0.0 | 0.1 | GO:0005166 | neurotrophin p75 receptor binding(GO:0005166) |
| 0.0 | 4.4 | GO:0005089 | Rho guanyl-nucleotide exchange factor activity(GO:0005089) |
| 0.0 | 0.9 | GO:0005355 | glucose transmembrane transporter activity(GO:0005355) |
| 0.0 | 0.3 | GO:0086080 | protein binding involved in heterotypic cell-cell adhesion(GO:0086080) |
| 0.0 | 0.8 | GO:0046875 | ephrin receptor binding(GO:0046875) |
| 0.0 | 3.9 | GO:0005200 | structural constituent of cytoskeleton(GO:0005200) |
| 0.0 | 0.5 | GO:0004115 | 3',5'-cyclic-AMP phosphodiesterase activity(GO:0004115) |
| 0.0 | 0.2 | GO:0005537 | mannose binding(GO:0005537) |
| 0.0 | 0.2 | GO:0035251 | UDP-glucosyltransferase activity(GO:0035251) |
| 0.0 | 0.1 | GO:0036312 | phosphatidylinositol 3-kinase regulatory subunit binding(GO:0036312) |
| 0.0 | 0.6 | GO:0032041 | histone deacetylase activity (H3-K14 specific)(GO:0031078) NAD-dependent histone deacetylase activity (H3-K14 specific)(GO:0032041) |
| 0.0 | 0.7 | GO:0001671 | ATPase activator activity(GO:0001671) |
| 0.0 | 0.4 | GO:0035198 | miRNA binding(GO:0035198) |
| 0.0 | 0.2 | GO:0001162 | RNA polymerase II intronic transcription regulatory region sequence-specific DNA binding(GO:0001162) |
| 0.0 | 0.2 | GO:0008020 | G-protein coupled photoreceptor activity(GO:0008020) |
| 0.0 | 0.8 | GO:0070888 | E-box binding(GO:0070888) |
| 0.0 | 2.1 | GO:0004867 | serine-type endopeptidase inhibitor activity(GO:0004867) |
| 0.0 | 0.3 | GO:0022820 | potassium:chloride symporter activity(GO:0015379) potassium ion symporter activity(GO:0022820) |
| 0.0 | 0.1 | GO:0016416 | carnitine O-palmitoyltransferase activity(GO:0004095) O-palmitoyltransferase activity(GO:0016416) |
| 0.0 | 0.5 | GO:0003746 | translation elongation factor activity(GO:0003746) |
| 0.0 | 0.1 | GO:0030613 | oxidoreductase activity, acting on phosphorus or arsenic in donors(GO:0030613) oxidoreductase activity, acting on phosphorus or arsenic in donors, disulfide as acceptor(GO:0030614) |
| 0.0 | 0.1 | GO:0051500 | D-aminoacyl-tRNA deacylase activity(GO:0051499) D-tyrosyl-tRNA(Tyr) deacylase activity(GO:0051500) |
| 0.0 | 0.5 | GO:0008395 | steroid hydroxylase activity(GO:0008395) |
| 0.0 | 0.3 | GO:0015095 | magnesium ion transmembrane transporter activity(GO:0015095) |
| 0.0 | 0.1 | GO:0070513 | death domain binding(GO:0070513) |
| 0.0 | 1.4 | GO:0005070 | SH3/SH2 adaptor activity(GO:0005070) |
| 0.0 | 0.1 | GO:0004045 | aminoacyl-tRNA hydrolase activity(GO:0004045) |
| 0.0 | 0.1 | GO:0004609 | phosphatidylserine decarboxylase activity(GO:0004609) |
| 0.0 | 0.1 | GO:0034452 | dynactin binding(GO:0034452) |
| 0.0 | 0.2 | GO:0004568 | chitinase activity(GO:0004568) oligosaccharide binding(GO:0070492) |
| 0.0 | 0.1 | GO:0004571 | mannosyl-oligosaccharide 1,2-alpha-mannosidase activity(GO:0004571) |
| 0.0 | 1.1 | GO:0051117 | ATPase binding(GO:0051117) |
Gene overrepresentation in curated gene sets: canonical pathways category:
| Log-likelihood per target | Total log-likelihood | Term | Description |
|---|---|---|---|
| 0.3 | 6.6 | PID VEGF VEGFR PATHWAY | VEGF and VEGFR signaling network |
| 0.2 | 5.4 | PID SYNDECAN 3 PATHWAY | Syndecan-3-mediated signaling events |
| 0.1 | 12.4 | NABA COLLAGENS | Genes encoding collagen proteins |
| 0.1 | 7.3 | PID NECTIN PATHWAY | Nectin adhesion pathway |
| 0.1 | 5.6 | PID HEDGEHOG 2PATHWAY | Signaling events mediated by the Hedgehog family |
| 0.1 | 38.9 | NABA ECM GLYCOPROTEINS | Genes encoding structural ECM glycoproteins |
| 0.1 | 6.7 | NABA PROTEOGLYCANS | Genes encoding proteoglycans |
| 0.1 | 0.8 | PID INTEGRIN4 PATHWAY | Alpha6 beta4 integrin-ligand interactions |
| 0.1 | 6.4 | SIG REGULATION OF THE ACTIN CYTOSKELETON BY RHO GTPASES | Genes related to regulation of the actin cytoskeleton |
| 0.1 | 2.6 | PID HIF1A PATHWAY | Hypoxic and oxygen homeostasis regulation of HIF-1-alpha |
| 0.1 | 2.8 | PID CONE PATHWAY | Visual signal transduction: Cones |
| 0.1 | 2.5 | PID ANTHRAX PATHWAY | Cellular roles of Anthrax toxin |
| 0.1 | 4.8 | ST WNT BETA CATENIN PATHWAY | Wnt/beta-catenin Pathway |
| 0.1 | 1.8 | PID INTEGRIN5 PATHWAY | Beta5 beta6 beta7 and beta8 integrin cell surface interactions |
| 0.1 | 5.9 | PID BMP PATHWAY | BMP receptor signaling |
| 0.1 | 4.9 | PID KIT PATHWAY | Signaling events mediated by Stem cell factor receptor (c-Kit) |
| 0.1 | 4.7 | PID RXR VDR PATHWAY | RXR and RAR heterodimerization with other nuclear receptor |
| 0.1 | 0.8 | ST PAC1 RECEPTOR PATHWAY | PAC1 Receptor Pathway |
| 0.1 | 3.5 | PID A6B1 A6B4 INTEGRIN PATHWAY | a6b1 and a6b4 Integrin signaling |
| 0.1 | 16.9 | NABA ECM AFFILIATED | Genes encoding proteins affiliated structurally or functionally to extracellular matrix proteins |
| 0.1 | 5.0 | PID TAP63 PATHWAY | Validated transcriptional targets of TAp63 isoforms |
| 0.0 | 2.2 | PID HIF2PATHWAY | HIF-2-alpha transcription factor network |
| 0.0 | 3.4 | PID TGFBR PATHWAY | TGF-beta receptor signaling |
| 0.0 | 0.6 | PID IL2 1PATHWAY | IL2-mediated signaling events |
| 0.0 | 2.1 | PID PS1 PATHWAY | Presenilin action in Notch and Wnt signaling |
| 0.0 | 1.7 | PID INTEGRIN2 PATHWAY | Beta2 integrin cell surface interactions |
| 0.0 | 0.3 | PID P38 ALPHA BETA PATHWAY | Regulation of p38-alpha and p38-beta |
| 0.0 | 1.2 | PID ARF 3PATHWAY | Arf1 pathway |
| 0.0 | 0.6 | ST G ALPHA I PATHWAY | G alpha i Pathway |
| 0.0 | 13.3 | NABA ECM REGULATORS | Genes encoding enzymes and their regulators involved in the remodeling of the extracellular matrix |
| 0.0 | 1.4 | PID HDAC CLASSIII PATHWAY | Signaling events mediated by HDAC Class III |
| 0.0 | 4.8 | PID RHOA REG PATHWAY | Regulation of RhoA activity |
| 0.0 | 1.5 | PID NCADHERIN PATHWAY | N-cadherin signaling events |
| 0.0 | 0.5 | PID ARF6 DOWNSTREAM PATHWAY | Arf6 downstream pathway |
| 0.0 | 1.8 | PID MAPK TRK PATHWAY | Trk receptor signaling mediated by the MAPK pathway |
| 0.0 | 1.8 | PID CDC42 REG PATHWAY | Regulation of CDC42 activity |
| 0.0 | 2.3 | PID AP1 PATHWAY | AP-1 transcription factor network |
| 0.0 | 0.5 | PID CIRCADIAN PATHWAY | Circadian rhythm pathway |
| 0.0 | 0.5 | PID LPA4 PATHWAY | LPA4-mediated signaling events |
| 0.0 | 1.2 | PID ERBB1 INTERNALIZATION PATHWAY | Internalization of ErbB1 |
| 0.0 | 0.8 | ST GAQ PATHWAY | G alpha q Pathway |
| 0.0 | 0.5 | PID HES HEY PATHWAY | Notch-mediated HES/HEY network |
| 0.0 | 1.6 | PID HEDGEHOG GLI PATHWAY | Hedgehog signaling events mediated by Gli proteins |
| 0.0 | 0.3 | PID FRA PATHWAY | Validated transcriptional targets of AP1 family members Fra1 and Fra2 |
| 0.0 | 1.0 | ST FAS SIGNALING PATHWAY | Fas Signaling Pathway |
| 0.0 | 0.6 | PID AJDISS 2PATHWAY | Posttranslational regulation of adherens junction stability and dissassembly |
| 0.0 | 0.3 | ST WNT CA2 CYCLIC GMP PATHWAY | Wnt/Ca2+/cyclic GMP signaling. |
| 0.0 | 0.3 | ST T CELL SIGNAL TRANSDUCTION | T Cell Signal Transduction |
| 0.0 | 0.5 | PID NETRIN PATHWAY | Netrin-mediated signaling events |
| 0.0 | 0.5 | PID ENDOTHELIN PATHWAY | Endothelins |
Gene overrepresentation in curated gene sets: REACTOME pathways category:
| Log-likelihood per target | Total log-likelihood | Term | Description |
|---|---|---|---|
| 0.4 | 5.2 | REACTOME PROSTANOID LIGAND RECEPTORS | Genes involved in Prostanoid ligand receptors |
| 0.3 | 6.6 | REACTOME VEGF LIGAND RECEPTOR INTERACTIONS | Genes involved in VEGF ligand-receptor interactions |
| 0.3 | 5.1 | REACTOME REVERSIBLE HYDRATION OF CARBON DIOXIDE | Genes involved in Reversible Hydration of Carbon Dioxide |
| 0.3 | 1.6 | REACTOME PECAM1 INTERACTIONS | Genes involved in PECAM1 interactions |
| 0.2 | 5.8 | REACTOME CS DS DEGRADATION | Genes involved in CS/DS degradation |
| 0.2 | 11.8 | REACTOME SMOOTH MUSCLE CONTRACTION | Genes involved in Smooth Muscle Contraction |
| 0.2 | 1.1 | REACTOME SEMA3A PLEXIN REPULSION SIGNALING BY INHIBITING INTEGRIN ADHESION | Genes involved in SEMA3A-Plexin repulsion signaling by inhibiting Integrin adhesion |
| 0.2 | 9.3 | REACTOME DARPP 32 EVENTS | Genes involved in DARPP-32 events |
| 0.2 | 2.7 | REACTOME SIGNALING BY NOTCH3 | Genes involved in Signaling by NOTCH3 |
| 0.2 | 6.6 | REACTOME HORMONE SENSITIVE LIPASE HSL MEDIATED TRIACYLGLYCEROL HYDROLYSIS | Genes involved in Hormone-sensitive lipase (HSL)-mediated triacylglycerol hydrolysis |
| 0.2 | 2.5 | REACTOME PLATELET ADHESION TO EXPOSED COLLAGEN | Genes involved in Platelet Adhesion to exposed collagen |
| 0.1 | 3.5 | REACTOME INITIAL TRIGGERING OF COMPLEMENT | Genes involved in Initial triggering of complement |
| 0.1 | 3.8 | REACTOME HDL MEDIATED LIPID TRANSPORT | Genes involved in HDL-mediated lipid transport |
| 0.1 | 4.4 | REACTOME CRMPS IN SEMA3A SIGNALING | Genes involved in CRMPs in Sema3A signaling |
| 0.1 | 5.7 | REACTOME SIGNALING BY BMP | Genes involved in Signaling by BMP |
| 0.1 | 1.9 | REACTOME REGULATION OF KIT SIGNALING | Genes involved in Regulation of KIT signaling |
| 0.1 | 6.4 | REACTOME TRANSPORT OF VITAMINS NUCLEOSIDES AND RELATED MOLECULES | Genes involved in Transport of vitamins, nucleosides, and related molecules |
| 0.1 | 0.4 | REACTOME DOPAMINE NEUROTRANSMITTER RELEASE CYCLE | Genes involved in Dopamine Neurotransmitter Release Cycle |
| 0.1 | 4.9 | REACTOME CGMP EFFECTS | Genes involved in cGMP effects |
| 0.1 | 2.6 | REACTOME APOPTOTIC CLEAVAGE OF CELL ADHESION PROTEINS | Genes involved in Apoptotic cleavage of cell adhesion proteins |
| 0.1 | 3.9 | REACTOME SIGNALING BY CONSTITUTIVELY ACTIVE EGFR | Genes involved in Signaling by constitutively active EGFR |
| 0.1 | 7.4 | REACTOME NETRIN1 SIGNALING | Genes involved in Netrin-1 signaling |
| 0.1 | 1.2 | REACTOME SIGNAL ATTENUATION | Genes involved in Signal attenuation |
| 0.1 | 8.6 | REACTOME COLLAGEN FORMATION | Genes involved in Collagen formation |
| 0.1 | 0.7 | REACTOME ENDOGENOUS STEROLS | Genes involved in Endogenous sterols |
| 0.1 | 2.2 | REACTOME INHIBITION OF VOLTAGE GATED CA2 CHANNELS VIA GBETA GAMMA SUBUNITS | Genes involved in Inhibition of voltage gated Ca2+ channels via Gbeta/gamma subunits |
| 0.1 | 6.7 | REACTOME MYOGENESIS | Genes involved in Myogenesis |
| 0.1 | 2.0 | REACTOME REGULATION OF INSULIN LIKE GROWTH FACTOR IGF ACTIVITY BY INSULIN LIKE GROWTH FACTOR BINDING PROTEINS IGFBPS | Genes involved in Regulation of Insulin-like Growth Factor (IGF) Activity by Insulin-like Growth Factor Binding Proteins (IGFBPs) |
| 0.1 | 2.9 | REACTOME STEROID HORMONES | Genes involved in Steroid hormones |
| 0.1 | 0.5 | REACTOME BASIGIN INTERACTIONS | Genes involved in Basigin interactions |
| 0.1 | 1.1 | REACTOME CHYLOMICRON MEDIATED LIPID TRANSPORT | Genes involved in Chylomicron-mediated lipid transport |
| 0.1 | 1.5 | REACTOME CHONDROITIN SULFATE BIOSYNTHESIS | Genes involved in Chondroitin sulfate biosynthesis |
| 0.1 | 1.5 | REACTOME SIGNALING BY HIPPO | Genes involved in Signaling by Hippo |
| 0.1 | 1.0 | REACTOME ADENYLATE CYCLASE ACTIVATING PATHWAY | Genes involved in Adenylate cyclase activating pathway |
| 0.0 | 2.6 | REACTOME AMINE COMPOUND SLC TRANSPORTERS | Genes involved in Amine compound SLC transporters |
| 0.0 | 0.1 | REACTOME DSCAM INTERACTIONS | Genes involved in DSCAM interactions |
| 0.0 | 0.7 | REACTOME SEROTONIN RECEPTORS | Genes involved in Serotonin receptors |
| 0.0 | 1.3 | REACTOME BMAL1 CLOCK NPAS2 ACTIVATES CIRCADIAN EXPRESSION | Genes involved in BMAL1:CLOCK/NPAS2 Activates Circadian Expression |
| 0.0 | 2.5 | REACTOME INHIBITION OF INSULIN SECRETION BY ADRENALINE NORADRENALINE | Genes involved in Inhibition of Insulin Secretion by Adrenaline/Noradrenaline |
| 0.0 | 1.5 | REACTOME CHONDROITIN SULFATE DERMATAN SULFATE METABOLISM | Genes involved in Chondroitin sulfate/dermatan sulfate metabolism |
| 0.0 | 1.6 | REACTOME AMINE LIGAND BINDING RECEPTORS | Genes involved in Amine ligand-binding receptors |
| 0.0 | 1.0 | REACTOME OXYGEN DEPENDENT PROLINE HYDROXYLATION OF HYPOXIA INDUCIBLE FACTOR ALPHA | Genes involved in Oxygen-dependent Proline Hydroxylation of Hypoxia-inducible Factor Alpha |
| 0.0 | 1.5 | REACTOME PEROXISOMAL LIPID METABOLISM | Genes involved in Peroxisomal lipid metabolism |
| 0.0 | 2.9 | REACTOME CROSS PRESENTATION OF SOLUBLE EXOGENOUS ANTIGENS ENDOSOMES | Genes involved in Cross-presentation of soluble exogenous antigens (endosomes) |
| 0.0 | 1.4 | REACTOME INSULIN RECEPTOR RECYCLING | Genes involved in Insulin receptor recycling |
| 0.0 | 0.7 | REACTOME ABACAVIR TRANSPORT AND METABOLISM | Genes involved in Abacavir transport and metabolism |
| 0.0 | 0.9 | REACTOME G BETA GAMMA SIGNALLING THROUGH PI3KGAMMA | Genes involved in G beta:gamma signalling through PI3Kgamma |
| 0.0 | 1.1 | REACTOME GAP JUNCTION DEGRADATION | Genes involved in Gap junction degradation |
| 0.0 | 1.0 | REACTOME GAP JUNCTION TRAFFICKING | Genes involved in Gap junction trafficking |
| 0.0 | 1.4 | REACTOME ACTIVATION OF GENES BY ATF4 | Genes involved in Activation of Genes by ATF4 |
| 0.0 | 1.1 | REACTOME AMINO ACID SYNTHESIS AND INTERCONVERSION TRANSAMINATION | Genes involved in Amino acid synthesis and interconversion (transamination) |
| 0.0 | 1.6 | REACTOME DEADENYLATION OF MRNA | Genes involved in Deadenylation of mRNA |
| 0.0 | 0.5 | REACTOME THE ACTIVATION OF ARYLSULFATASES | Genes involved in The activation of arylsulfatases |
| 0.0 | 0.9 | REACTOME CYTOSOLIC SULFONATION OF SMALL MOLECULES | Genes involved in Cytosolic sulfonation of small molecules |
| 0.0 | 1.1 | REACTOME GLUTAMATE NEUROTRANSMITTER RELEASE CYCLE | Genes involved in Glutamate Neurotransmitter Release Cycle |
| 0.0 | 1.8 | REACTOME INTERACTION BETWEEN L1 AND ANKYRINS | Genes involved in Interaction between L1 and Ankyrins |
| 0.0 | 0.4 | REACTOME EICOSANOID LIGAND BINDING RECEPTORS | Genes involved in Eicosanoid ligand-binding receptors |
| 0.0 | 1.4 | REACTOME AMYLOIDS | Genes involved in Amyloids |
| 0.0 | 2.4 | REACTOME GOLGI ASSOCIATED VESICLE BIOGENESIS | Genes involved in Golgi Associated Vesicle Biogenesis |
| 0.0 | 0.6 | REACTOME SIGNALING BY FGFR3 MUTANTS | Genes involved in Signaling by FGFR3 mutants |
| 0.0 | 0.8 | REACTOME DEGRADATION OF THE EXTRACELLULAR MATRIX | Genes involved in Degradation of the extracellular matrix |
| 0.0 | 0.6 | REACTOME TANDEM PORE DOMAIN POTASSIUM CHANNELS | Genes involved in Tandem pore domain potassium channels |
| 0.0 | 1.9 | REACTOME VOLTAGE GATED POTASSIUM CHANNELS | Genes involved in Voltage gated Potassium channels |
| 0.0 | 1.1 | REACTOME SYNTHESIS OF PA | Genes involved in Synthesis of PA |
| 0.0 | 1.4 | REACTOME TRAFFICKING OF AMPA RECEPTORS | Genes involved in Trafficking of AMPA receptors |
| 0.0 | 0.5 | REACTOME TGF BETA RECEPTOR SIGNALING IN EMT EPITHELIAL TO MESENCHYMAL TRANSITION | Genes involved in TGF-beta receptor signaling in EMT (epithelial to mesenchymal transition) |
| 0.0 | 0.5 | REACTOME GLUCAGON TYPE LIGAND RECEPTORS | Genes involved in Glucagon-type ligand receptors |
| 0.0 | 1.0 | REACTOME CYCLIN E ASSOCIATED EVENTS DURING G1 S TRANSITION | Genes involved in Cyclin E associated events during G1/S transition |
| 0.0 | 0.5 | REACTOME NEPHRIN INTERACTIONS | Genes involved in Nephrin interactions |
| 0.0 | 0.4 | REACTOME CTNNB1 PHOSPHORYLATION CASCADE | Genes involved in Beta-catenin phosphorylation cascade |
| 0.0 | 0.7 | REACTOME EGFR DOWNREGULATION | Genes involved in EGFR downregulation |
| 0.0 | 0.4 | REACTOME ALPHA LINOLENIC ACID ALA METABOLISM | Genes involved in alpha-linolenic acid (ALA) metabolism |
| 0.0 | 0.7 | REACTOME CITRIC ACID CYCLE TCA CYCLE | Genes involved in Citric acid cycle (TCA cycle) |
| 0.0 | 0.8 | REACTOME YAP1 AND WWTR1 TAZ STIMULATED GENE EXPRESSION | Genes involved in YAP1- and WWTR1 (TAZ)-stimulated gene expression |
| 0.0 | 0.6 | REACTOME IONOTROPIC ACTIVITY OF KAINATE RECEPTORS | Genes involved in Ionotropic activity of Kainate Receptors |
| 0.0 | 0.8 | REACTOME SYNTHESIS SECRETION AND INACTIVATION OF GLP1 | Genes involved in Synthesis, Secretion, and Inactivation of Glucagon-like Peptide-1 (GLP-1) |
| 0.0 | 1.7 | REACTOME O LINKED GLYCOSYLATION OF MUCINS | Genes involved in O-linked glycosylation of mucins |
| 0.0 | 2.4 | REACTOME PPARA ACTIVATES GENE EXPRESSION | Genes involved in PPARA Activates Gene Expression |
| 0.0 | 0.3 | REACTOME PURINE RIBONUCLEOSIDE MONOPHOSPHATE BIOSYNTHESIS | Genes involved in Purine ribonucleoside monophosphate biosynthesis |
| 0.0 | 2.4 | REACTOME NUCLEAR RECEPTOR TRANSCRIPTION PATHWAY | Genes involved in Nuclear Receptor transcription pathway |
| 0.0 | 0.8 | REACTOME SMAD2 SMAD3 SMAD4 HETEROTRIMER REGULATES TRANSCRIPTION | Genes involved in SMAD2/SMAD3:SMAD4 heterotrimer regulates transcription |
| 0.0 | 0.3 | REACTOME ETHANOL OXIDATION | Genes involved in Ethanol oxidation |
| 0.0 | 0.8 | REACTOME SIGNALING BY ROBO RECEPTOR | Genes involved in Signaling by Robo receptor |
| 0.0 | 2.2 | REACTOME RESPONSE TO ELEVATED PLATELET CYTOSOLIC CA2 | Genes involved in Response to elevated platelet cytosolic Ca2+ |
| 0.0 | 0.4 | REACTOME PROLACTIN RECEPTOR SIGNALING | Genes involved in Prolactin receptor signaling |
| 0.0 | 0.4 | REACTOME BRANCHED CHAIN AMINO ACID CATABOLISM | Genes involved in Branched-chain amino acid catabolism |
| 0.0 | 1.1 | REACTOME FORMATION OF THE TERNARY COMPLEX AND SUBSEQUENTLY THE 43S COMPLEX | Genes involved in Formation of the ternary complex, and subsequently, the 43S complex |
| 0.0 | 1.3 | REACTOME MHC CLASS II ANTIGEN PRESENTATION | Genes involved in MHC class II antigen presentation |
| 0.0 | 0.4 | REACTOME REGULATION OF WATER BALANCE BY RENAL AQUAPORINS | Genes involved in Regulation of Water Balance by Renal Aquaporins |
| 0.0 | 0.4 | REACTOME ZINC TRANSPORTERS | Genes involved in Zinc transporters |
| 0.0 | 2.2 | REACTOME FACTORS INVOLVED IN MEGAKARYOCYTE DEVELOPMENT AND PLATELET PRODUCTION | Genes involved in Factors involved in megakaryocyte development and platelet production |
| 0.0 | 0.5 | REACTOME ADHERENS JUNCTIONS INTERACTIONS | Genes involved in Adherens junctions interactions |
| 0.0 | 0.4 | REACTOME CELL EXTRACELLULAR MATRIX INTERACTIONS | Genes involved in Cell-extracellular matrix interactions |
| 0.0 | 0.2 | REACTOME REGULATION OF GENE EXPRESSION IN BETA CELLS | Genes involved in Regulation of gene expression in beta cells |
| 0.0 | 2.2 | REACTOME G ALPHA Q SIGNALLING EVENTS | Genes involved in G alpha (q) signalling events |
| 0.0 | 0.1 | REACTOME SYNTHESIS SECRETION AND DEACYLATION OF GHRELIN | Genes involved in Synthesis, Secretion, and Deacylation of Ghrelin |