Project
Illumina Body Map 2 (GSE30611)
Navigation
Downloads
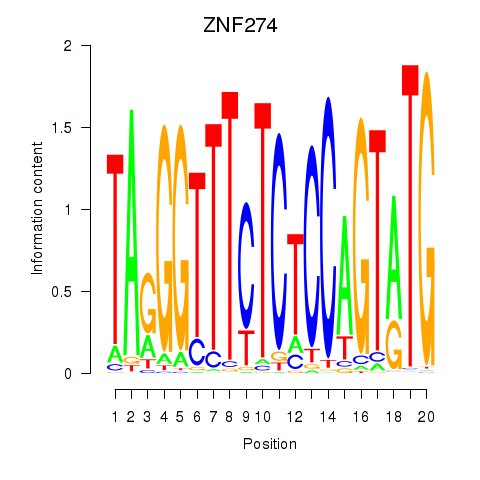
Results for ZNF274
Z-value: 0.57
Motif logo
Transcription factors associated with ZNF274
| Gene Symbol | Gene ID | Gene Info |
|---|---|---|
|
ZNF274
|
ENSG00000171606.18 | zinc finger protein 274 |
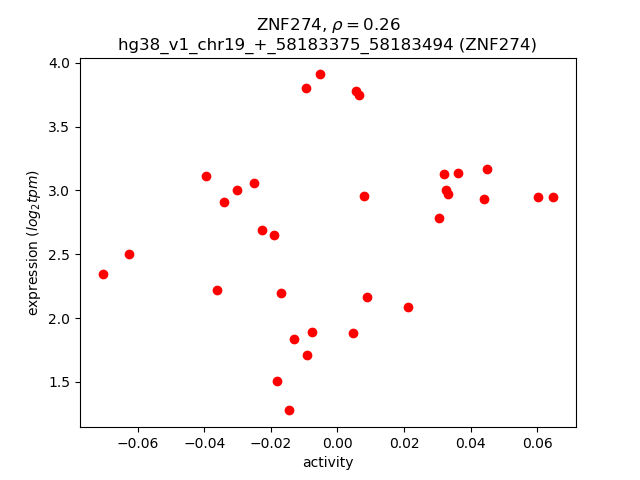
Activity-expression correlation:
| Gene | Promoter | Pearson corr. coef. | P-value | Plot |
|---|---|---|---|---|
| ZNF274 | hg38_v1_chr19_+_58183375_58183494 | 0.26 | 1.5e-01 | Click! |
Activity profile of ZNF274 motif
Sorted Z-values of ZNF274 motif
| Promoter | Log-likelihood | Transcript | Gene | Gene Info |
|---|---|---|---|---|
| chr7_+_142391884 | 1.66 |
ENST00000390363.2
|
TRBV9
|
T cell receptor beta variable 9 |
| chr14_+_21941122 | 1.63 |
ENST00000390441.2
|
TRAV9-2
|
T cell receptor alpha variable 9-2 |
| chr20_-_1657762 | 1.57 |
ENST00000303415.7
ENST00000381583.6 |
SIRPG
|
signal regulatory protein gamma |
| chr1_-_15944348 | 1.40 |
ENST00000444358.1
|
ZBTB17
|
zinc finger and BTB domain containing 17 |
| chr10_-_29522527 | 1.31 |
ENST00000632315.1
|
SVIL
|
supervillin |
| chr20_-_1657714 | 1.25 |
ENST00000216927.4
ENST00000344103.8 |
SIRPG
|
signal regulatory protein gamma |
| chr16_-_4752565 | 1.23 |
ENST00000588099.1
ENST00000588942.1 |
ENSG00000266994.1
ZNF500
|
novel transcript zinc finger protein 500 |
| chr22_+_23696400 | 1.01 |
ENST00000452208.1
|
RGL4
|
ral guanine nucleotide dissociation stimulator like 4 |
| chr2_-_88992903 | 0.98 |
ENST00000495489.1
|
IGKV1-8
|
immunoglobulin kappa variable 1-8 |
| chr6_+_31586124 | 0.97 |
ENST00000418507.6
ENST00000376096.5 ENST00000376099.5 ENST00000376110.7 |
LST1
|
leukocyte specific transcript 1 |
| chr15_+_88621290 | 0.95 |
ENST00000332810.4
ENST00000559528.1 |
AEN
|
apoptosis enhancing nuclease |
| chr16_+_31458821 | 0.82 |
ENST00000457010.6
ENST00000563544.5 |
ARMC5
|
armadillo repeat containing 5 |
| chr6_+_31586269 | 0.78 |
ENST00000438075.7
|
LST1
|
leukocyte specific transcript 1 |
| chr16_+_29807775 | 0.72 |
ENST00000568411.5
ENST00000563012.1 ENST00000562557.5 |
MAZ
|
MYC associated zinc finger protein |
| chr16_+_29808125 | 0.70 |
ENST00000568282.1
|
MAZ
|
MYC associated zinc finger protein |
| chr16_+_29808051 | 0.68 |
ENST00000568544.5
ENST00000569978.1 |
MAZ
|
MYC associated zinc finger protein |
| chr6_+_36197356 | 0.67 |
ENST00000446974.1
ENST00000454960.1 |
BRPF3
|
bromodomain and PHD finger containing 3 |
| chr16_+_29807536 | 0.67 |
ENST00000567444.5
|
MAZ
|
MYC associated zinc finger protein |
| chr10_+_69278492 | 0.64 |
ENST00000643399.2
|
HK1
|
hexokinase 1 |
| chr1_-_113871665 | 0.62 |
ENST00000528414.5
ENST00000460620.5 ENST00000359785.10 ENST00000420377.6 ENST00000525799.1 ENST00000538253.5 |
PTPN22
|
protein tyrosine phosphatase non-receptor type 22 |
| chr22_+_38957522 | 0.51 |
ENST00000618553.1
ENST00000249116.7 |
APOBEC3A
|
apolipoprotein B mRNA editing enzyme catalytic subunit 3A |
| chr3_+_128153422 | 0.44 |
ENST00000254730.11
ENST00000483457.1 |
EEFSEC
|
eukaryotic elongation factor, selenocysteine-tRNA specific |
| chr17_-_3557798 | 0.43 |
ENST00000301365.8
ENST00000572519.1 ENST00000576742.6 |
TRPV3
|
transient receptor potential cation channel subfamily V member 3 |
| chrX_-_142205260 | 0.39 |
ENST00000247452.4
|
MAGEC2
|
MAGE family member C2 |
| chr1_+_44739825 | 0.38 |
ENST00000372224.9
|
KIF2C
|
kinesin family member 2C |
| chr19_+_6135635 | 0.37 |
ENST00000588304.5
ENST00000588722.5 ENST00000588485.6 ENST00000591403.5 ENST00000586696.5 ENST00000681525.1 ENST00000589401.5 |
ACSBG2
|
acyl-CoA synthetase bubblegum family member 2 |
| chr19_-_55597753 | 0.36 |
ENST00000587678.1
|
FIZ1
|
FLT3 interacting zinc finger 1 |
| chr16_+_10866247 | 0.34 |
ENST00000636238.1
|
CIITA
|
class II major histocompatibility complex transactivator |
| chr18_+_9885964 | 0.33 |
ENST00000357775.6
ENST00000306084.6 |
TXNDC2
|
thioredoxin domain containing 2 |
| chr9_-_33473884 | 0.28 |
ENST00000297990.9
ENST00000353159.6 ENST00000379471.3 |
NOL6
|
nucleolar protein 6 |
| chr21_+_39451963 | 0.27 |
ENST00000333634.10
|
SH3BGR
|
SH3 domain binding glutamate rich protein |
| chr2_+_236569817 | 0.26 |
ENST00000272928.4
|
ACKR3
|
atypical chemokine receptor 3 |
| chr1_+_44739805 | 0.24 |
ENST00000452259.5
|
KIF2C
|
kinesin family member 2C |
| chr18_+_9885726 | 0.23 |
ENST00000611534.1
ENST00000536353.2 ENST00000584255.1 |
TXNDC2
|
thioredoxin domain containing 2 |
| chr21_+_39452077 | 0.23 |
ENST00000452550.5
|
SH3BGR
|
SH3 domain binding glutamate rich protein |
| chr17_+_75032581 | 0.21 |
ENST00000581589.5
|
KCTD2
|
potassium channel tetramerization domain containing 2 |
| chr11_+_59938432 | 0.21 |
ENST00000644529.1
ENST00000646685.1 |
OOSP1
|
oocyte secreted protein 1 |
| chr6_+_30720335 | 0.19 |
ENST00000327892.13
|
TUBB
|
tubulin beta class I |
| chr5_+_122129597 | 0.19 |
ENST00000514925.1
|
ENSG00000250803.6
|
novel zinc finger protein |
| chr17_-_39166138 | 0.18 |
ENST00000269586.12
|
ARL5C
|
ADP ribosylation factor like GTPase 5C |
| chr8_-_4994696 | 0.16 |
ENST00000400186.7
ENST00000602723.5 |
CSMD1
|
CUB and Sushi multiple domains 1 |
| chr18_+_9103959 | 0.15 |
ENST00000400033.1
|
NDUFV2
|
NADH:ubiquinone oxidoreductase core subunit V2 |
| chr16_+_10866199 | 0.15 |
ENST00000637439.1
|
CIITA
|
class II major histocompatibility complex transactivator |
| chr19_-_42877988 | 0.15 |
ENST00000597058.1
|
PSG1
|
pregnancy specific beta-1-glycoprotein 1 |
| chr9_+_93263948 | 0.14 |
ENST00000448251.5
|
WNK2
|
WNK lysine deficient protein kinase 2 |
| chr1_-_53889766 | 0.14 |
ENST00000371399.5
ENST00000072644.7 |
YIPF1
|
Yip1 domain family member 1 |
| chr19_-_19663664 | 0.13 |
ENST00000357324.11
|
ATP13A1
|
ATPase 13A1 |
| chr5_-_173616588 | 0.10 |
ENST00000285908.5
ENST00000311086.9 ENST00000480951.1 |
BOD1
|
biorientation of chromosomes in cell division 1 |
| chr3_+_50246888 | 0.10 |
ENST00000451956.1
|
GNAI2
|
G protein subunit alpha i2 |
| chr19_+_57614211 | 0.09 |
ENST00000600344.1
ENST00000396161.10 ENST00000600883.1 |
ZNF134
|
zinc finger protein 134 |
| chrX_+_16167481 | 0.08 |
ENST00000400004.6
|
MAGEB17
|
MAGE family member B17 |
| chrX_+_16167713 | 0.07 |
ENST00000400003.1
|
MAGEB17
|
MAGE family member B17 |
| chr11_+_19813704 | 0.05 |
ENST00000650578.1
|
NAV2
|
neuron navigator 2 |
| chr19_+_39704461 | 0.04 |
ENST00000360675.7
ENST00000392052.8 ENST00000601802.1 |
LGALS14
|
galectin 14 |
| chr12_+_55636892 | 0.04 |
ENST00000309675.3
|
OR10P1
|
olfactory receptor family 10 subfamily P member 1 |
| chr11_+_89926762 | 0.04 |
ENST00000526396.3
|
TRIM49D2
|
tripartite motif containing 49D2 |
| chr5_+_122129533 | 0.02 |
ENST00000296600.5
ENST00000504912.1 ENST00000505843.1 |
ZNF474
|
zinc finger protein 474 |
| chr10_-_13761669 | 0.01 |
ENST00000650137.1
|
FRMD4A
|
FERM domain containing 4A |
| chr3_-_139044892 | 0.01 |
ENST00000413199.1
|
PRR23C
|
proline rich 23C |
| chrX_-_70260199 | 0.00 |
ENST00000374519.4
|
P2RY4
|
pyrimidinergic receptor P2Y4 |
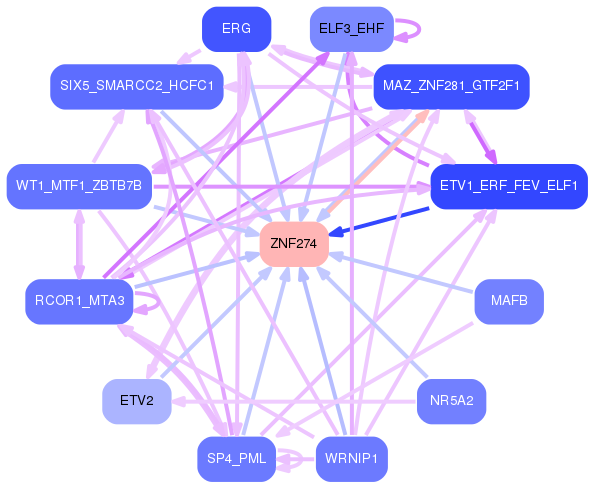
Network of associatons between targets according to the STRING database.

First level regulatory network of ZNF274
Gene Ontology Analysis
Gene overrepresentation in biological process category:
| Log-likelihood per target | Total log-likelihood | Term | Description |
|---|---|---|---|
| 0.1 | 0.6 | GO:1902523 | positive regulation of protein K63-linked ubiquitination(GO:1902523) |
| 0.1 | 0.5 | GO:0070383 | DNA cytosine deamination(GO:0070383) |
| 0.1 | 0.4 | GO:0042636 | negative regulation of hair cycle(GO:0042636) |
| 0.1 | 0.6 | GO:0072656 | maintenance of protein location in mitochondrion(GO:0072656) |
| 0.1 | 0.6 | GO:0030951 | establishment or maintenance of microtubule cytoskeleton polarity(GO:0030951) |
| 0.0 | 0.6 | GO:0006662 | glycerol ether metabolic process(GO:0006662) |
| 0.0 | 0.5 | GO:0045345 | positive regulation of MHC class I biosynthetic process(GO:0045345) |
| 0.0 | 1.4 | GO:0007398 | ectoderm development(GO:0007398) |
| 0.0 | 0.4 | GO:0006451 | selenocysteine incorporation(GO:0001514) translational readthrough(GO:0006451) |
| 0.0 | 2.8 | GO:0006369 | termination of RNA polymerase II transcription(GO:0006369) |
| 0.0 | 1.8 | GO:0032945 | negative regulation of mononuclear cell proliferation(GO:0032945) negative regulation of lymphocyte proliferation(GO:0050672) |
| 0.0 | 0.1 | GO:0071421 | manganese ion transmembrane transport(GO:0071421) |
Gene overrepresentation in cellular component category:
| Log-likelihood per target | Total log-likelihood | Term | Description |
|---|---|---|---|
| 0.1 | 1.3 | GO:0036449 | microtubule minus-end(GO:0036449) |
| 0.0 | 0.7 | GO:0070775 | H3 histone acetyltransferase complex(GO:0070775) MOZ/MORF histone acetyltransferase complex(GO:0070776) |
| 0.0 | 0.6 | GO:0001520 | outer dense fiber(GO:0001520) |
| 0.0 | 0.1 | GO:0045272 | plasma membrane respiratory chain complex I(GO:0045272) |
| 0.0 | 0.6 | GO:0035371 | microtubule plus-end(GO:0035371) |
| 0.0 | 0.6 | GO:0097228 | sperm principal piece(GO:0097228) |
Gene overrepresentation in molecular function category:
| Log-likelihood per target | Total log-likelihood | Term | Description |
|---|---|---|---|
| 0.1 | 0.5 | GO:0047844 | deoxycytidine deaminase activity(GO:0047844) |
| 0.1 | 0.6 | GO:0004396 | glucokinase activity(GO:0004340) hexokinase activity(GO:0004396) fructokinase activity(GO:0008865) mannokinase activity(GO:0019158) |
| 0.1 | 0.6 | GO:0019237 | centromeric DNA binding(GO:0019237) |
| 0.1 | 0.4 | GO:0035368 | selenocysteine insertion sequence binding(GO:0035368) |
| 0.1 | 0.6 | GO:0047134 | protein-disulfide reductase activity(GO:0047134) |
| 0.0 | 1.4 | GO:0001223 | transcription coactivator binding(GO:0001223) |
| 0.0 | 2.8 | GO:0000979 | RNA polymerase II core promoter sequence-specific DNA binding(GO:0000979) |
| 0.0 | 0.4 | GO:0031957 | very long-chain fatty acid-CoA ligase activity(GO:0031957) |
| 0.0 | 0.3 | GO:0016494 | C-X-C chemokine receptor activity(GO:0016494) C-X-C chemokine binding(GO:0019958) |
| 0.0 | 0.1 | GO:0005384 | manganese ion transmembrane transporter activity(GO:0005384) |
Gene overrepresentation in curated gene sets: canonical pathways category:
| Log-likelihood per target | Total log-likelihood | Term | Description |
|---|---|---|---|
| 0.0 | 1.4 | PID MYC PATHWAY | C-MYC pathway |
Gene overrepresentation in curated gene sets: REACTOME pathways category:
| Log-likelihood per target | Total log-likelihood | Term | Description |
|---|---|---|---|
| 0.1 | 2.8 | REACTOME SIGNAL REGULATORY PROTEIN SIRP FAMILY INTERACTIONS | Genes involved in Signal regulatory protein (SIRP) family interactions |
| 0.0 | 1.4 | REACTOME ACTIVATION OF CHAPERONE GENES BY XBP1S | Genes involved in Activation of Chaperone Genes by XBP1(S) |
| 0.0 | 0.6 | REACTOME KINESINS | Genes involved in Kinesins |