Project
Illumina Body Map 2 (GSE30611)
Navigation
Downloads
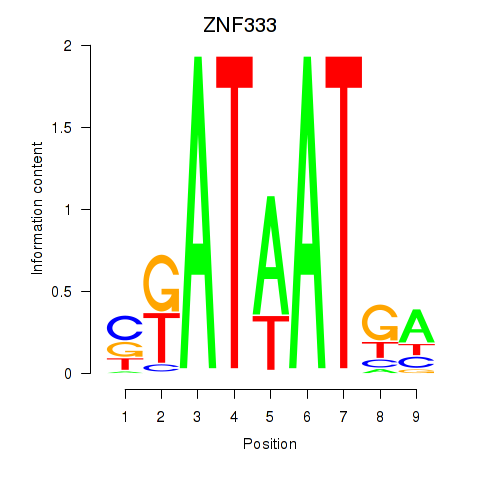
Results for ZNF333
Z-value: 0.91
Motif logo
Transcription factors associated with ZNF333
| Gene Symbol | Gene ID | Gene Info |
|---|---|---|
|
ZNF333
|
ENSG00000160961.12 | zinc finger protein 333 |
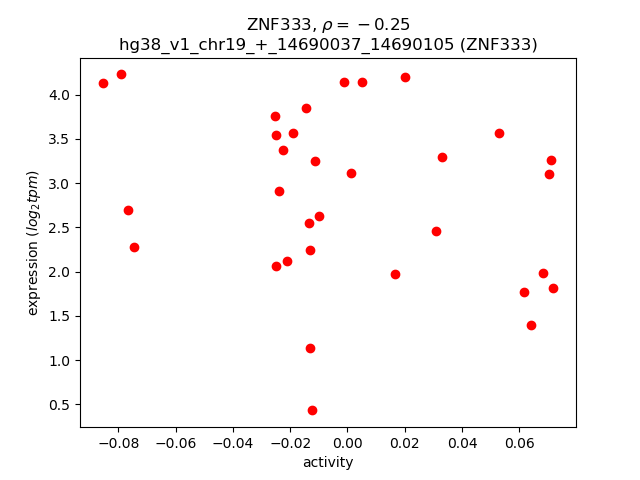
Activity-expression correlation:
| Gene | Promoter | Pearson corr. coef. | P-value | Plot |
|---|---|---|---|---|
| ZNF333 | hg38_v1_chr19_+_14690037_14690105 | -0.25 | 1.8e-01 | Click! |
Activity profile of ZNF333 motif
Sorted Z-values of ZNF333 motif
| Promoter | Log-likelihood | Transcript | Gene | Gene Info |
|---|---|---|---|---|
| chrX_-_21758021 | 6.27 |
ENST00000646008.1
|
SMPX
|
small muscle protein X-linked |
| chrX_-_21758097 | 6.14 |
ENST00000379494.4
|
SMPX
|
small muscle protein X-linked |
| chr10_+_49299159 | 3.80 |
ENST00000374144.8
|
C10orf71
|
chromosome 10 open reading frame 71 |
| chr4_-_176269213 | 2.87 |
ENST00000296525.7
|
ASB5
|
ankyrin repeat and SOCS box containing 5 |
| chr3_+_35679690 | 2.60 |
ENST00000413378.5
ENST00000417925.5 |
ARPP21
|
cAMP regulated phosphoprotein 21 |
| chr12_-_48999363 | 1.68 |
ENST00000421952.3
|
DDN
|
dendrin |
| chr14_+_20768393 | 1.41 |
ENST00000326783.4
|
EDDM3B
|
epididymal protein 3B |
| chr5_-_16508990 | 1.40 |
ENST00000399793.6
|
RETREG1
|
reticulophagy regulator 1 |
| chr5_-_16508812 | 1.39 |
ENST00000683414.1
|
RETREG1
|
reticulophagy regulator 1 |
| chr19_-_19515542 | 1.39 |
ENST00000585580.4
|
TSSK6
|
testis specific serine kinase 6 |
| chr11_-_26567087 | 1.38 |
ENST00000436318.6
ENST00000281268.12 |
MUC15
|
mucin 15, cell surface associated |
| chr5_+_173918186 | 1.35 |
ENST00000657000.1
|
CPEB4
|
cytoplasmic polyadenylation element binding protein 4 |
| chr5_-_16508858 | 1.30 |
ENST00000684456.1
|
RETREG1
|
reticulophagy regulator 1 |
| chr5_-_16508951 | 1.28 |
ENST00000682628.1
|
RETREG1
|
reticulophagy regulator 1 |
| chr5_-_16508788 | 1.27 |
ENST00000682142.1
|
RETREG1
|
reticulophagy regulator 1 |
| chr3_+_35679614 | 1.21 |
ENST00000474696.5
ENST00000412048.5 ENST00000396482.6 ENST00000432682.5 |
ARPP21
|
cAMP regulated phosphoprotein 21 |
| chr5_+_173918216 | 1.19 |
ENST00000519467.1
|
CPEB4
|
cytoplasmic polyadenylation element binding protein 4 |
| chr15_-_42491105 | 1.08 |
ENST00000565380.5
ENST00000564754.7 |
ZNF106
|
zinc finger protein 106 |
| chr9_-_94593810 | 1.06 |
ENST00000375337.4
|
FBP2
|
fructose-bisphosphatase 2 |
| chr14_+_67189393 | 1.06 |
ENST00000524532.5
ENST00000612183.4 ENST00000530728.5 |
FAM71D
|
family with sequence similarity 71 member D |
| chr6_+_35781005 | 1.06 |
ENST00000373861.6
|
CLPSL1
|
colipase like 1 |
| chrM_+_7586 | 1.03 |
ENST00000361739.1
|
MT-CO2
|
mitochondrially encoded cytochrome c oxidase II |
| chr3_+_159839847 | 1.02 |
ENST00000445224.6
|
SCHIP1
|
schwannomin interacting protein 1 |
| chr3_+_35679638 | 1.01 |
ENST00000432450.5
|
ARPP21
|
cAMP regulated phosphoprotein 21 |
| chr1_+_202416826 | 1.01 |
ENST00000466968.1
|
PPP1R12B
|
protein phosphatase 1 regulatory subunit 12B |
| chr10_-_67665642 | 1.00 |
ENST00000682945.1
ENST00000330298.6 ENST00000682758.1 |
CTNNA3
|
catenin alpha 3 |
| chr3_+_14675128 | 0.95 |
ENST00000435614.5
ENST00000253697.8 ENST00000412910.1 |
C3orf20
|
chromosome 3 open reading frame 20 |
| chr14_+_104579757 | 0.94 |
ENST00000331952.6
ENST00000557649.6 |
C14orf180
|
chromosome 14 open reading frame 180 |
| chr4_-_46909235 | 0.94 |
ENST00000505102.1
ENST00000355591.8 |
COX7B2
|
cytochrome c oxidase subunit 7B2 |
| chr2_+_190137760 | 0.93 |
ENST00000396974.2
|
C2orf88
|
chromosome 2 open reading frame 88 |
| chr1_-_51297990 | 0.91 |
ENST00000530004.5
|
TTC39A
|
tetratricopeptide repeat domain 39A |
| chr12_-_122395422 | 0.89 |
ENST00000540304.6
|
CLIP1
|
CAP-Gly domain containing linker protein 1 |
| chrY_+_18546691 | 0.87 |
ENST00000309834.8
ENST00000307393.3 ENST00000382856.2 |
HSFY1
|
heat shock transcription factor Y-linked 1 |
| chr1_+_213987929 | 0.86 |
ENST00000498508.6
ENST00000366958.9 |
PROX1
|
prospero homeobox 1 |
| chr2_-_32011001 | 0.85 |
ENST00000404530.6
|
MEMO1
|
mediator of cell motility 1 |
| chr9_+_131096476 | 0.85 |
ENST00000372309.7
ENST00000247291.8 ENST00000372302.5 ENST00000372300.5 ENST00000372298.1 |
AIF1L
|
allograft inflammatory factor 1 like |
| chr19_+_926001 | 0.84 |
ENST00000263620.8
|
ARID3A
|
AT-rich interaction domain 3A |
| chr5_+_173888335 | 0.80 |
ENST00000265085.10
|
CPEB4
|
cytoplasmic polyadenylation element binding protein 4 |
| chr11_+_18412292 | 0.80 |
ENST00000541669.6
ENST00000280704.8 |
LDHC
|
lactate dehydrogenase C |
| chr6_+_50818857 | 0.80 |
ENST00000393655.4
|
TFAP2B
|
transcription factor AP-2 beta |
| chr5_-_55692731 | 0.80 |
ENST00000502247.1
|
SLC38A9
|
solute carrier family 38 member 9 |
| chr3_+_38282294 | 0.77 |
ENST00000466887.5
ENST00000448498.6 |
SLC22A14
|
solute carrier family 22 member 14 |
| chrM_+_10464 | 0.77 |
ENST00000361335.1
|
MT-ND4L
|
mitochondrially encoded NADH:ubiquinone oxidoreductase core subunit 4L |
| chr3_-_37174578 | 0.76 |
ENST00000336686.9
|
LRRFIP2
|
LRR binding FLII interacting protein 2 |
| chr1_-_46665849 | 0.75 |
ENST00000532925.5
ENST00000542495.5 |
ATPAF1
|
ATP synthase mitochondrial F1 complex assembly factor 1 |
| chr1_-_114758615 | 0.74 |
ENST00000525878.5
|
CSDE1
|
cold shock domain containing E1 |
| chrM_+_10055 | 0.71 |
ENST00000361227.2
|
MT-ND3
|
mitochondrially encoded NADH:ubiquinone oxidoreductase core subunit 3 |
| chr8_-_42502496 | 0.70 |
ENST00000522707.1
|
SLC20A2
|
solute carrier family 20 member 2 |
| chr12_-_86838867 | 0.69 |
ENST00000621808.4
|
MGAT4C
|
MGAT4 family member C |
| chr1_-_23014024 | 0.69 |
ENST00000440767.2
ENST00000622840.1 |
TEX46
|
testis expressed 46 |
| chr8_-_30912998 | 0.67 |
ENST00000643185.2
|
TEX15
|
testis expressed 15, meiosis and synapsis associated |
| chr4_-_46909206 | 0.64 |
ENST00000396533.5
|
COX7B2
|
cytochrome c oxidase subunit 7B2 |
| chr2_-_177888728 | 0.62 |
ENST00000389683.7
|
PDE11A
|
phosphodiesterase 11A |
| chr4_+_116298876 | 0.62 |
ENST00000604093.2
|
MTRNR2L13
|
MT-RNR2 like 13 |
| chr9_+_32551670 | 0.62 |
ENST00000450093.3
|
SMIM27
|
small integral membrane protein 27 |
| chr5_-_55692620 | 0.61 |
ENST00000503817.5
ENST00000512595.5 |
SLC38A9
|
solute carrier family 38 member 9 |
| chrM_+_10759 | 0.59 |
ENST00000361381.2
|
MT-ND4
|
mitochondrially encoded NADH:ubiquinone oxidoreductase core subunit 4 |
| chr10_-_126521439 | 0.58 |
ENST00000284694.11
ENST00000432642.5 |
C10orf90
|
chromosome 10 open reading frame 90 |
| chr10_+_88586762 | 0.57 |
ENST00000371939.7
|
LIPJ
|
lipase family member J |
| chr17_-_62806632 | 0.57 |
ENST00000583803.1
ENST00000456609.6 |
MARCHF10
|
membrane associated ring-CH-type finger 10 |
| chr12_-_52601458 | 0.57 |
ENST00000537672.6
ENST00000293745.7 |
KRT72
|
keratin 72 |
| chr15_+_98890341 | 0.54 |
ENST00000558898.1
|
IGF1R
|
insulin like growth factor 1 receptor |
| chr1_-_35554930 | 0.53 |
ENST00000440579.5
ENST00000494948.1 |
KIAA0319L
|
KIAA0319 like |
| chr2_+_189674662 | 0.53 |
ENST00000684021.1
|
ANKAR
|
ankyrin and armadillo repeat containing |
| chrX_+_48007796 | 0.51 |
ENST00000376940.3
|
SPACA5
|
sperm acrosome associated 5 |
| chr20_+_45702030 | 0.51 |
ENST00000305479.3
|
WFDC13
|
WAP four-disulfide core domain 13 |
| chr7_+_30284574 | 0.50 |
ENST00000323037.5
|
ZNRF2
|
zinc and ring finger 2 |
| chr14_+_19876232 | 0.50 |
ENST00000298642.2
|
OR4K2
|
olfactory receptor family 4 subfamily K member 2 |
| chr7_+_80624961 | 0.50 |
ENST00000436384.5
|
CD36
|
CD36 molecule |
| chr8_-_133102643 | 0.48 |
ENST00000519341.5
|
SLA
|
Src like adaptor |
| chr20_+_13009246 | 0.47 |
ENST00000450297.1
|
SPTLC3
|
serine palmitoyltransferase long chain base subunit 3 |
| chr20_+_1118590 | 0.47 |
ENST00000246015.8
ENST00000335877.11 |
PSMF1
|
proteasome inhibitor subunit 1 |
| chr12_-_52601507 | 0.47 |
ENST00000354310.4
|
KRT72
|
keratin 72 |
| chr14_+_23240346 | 0.47 |
ENST00000430154.6
|
RNF212B
|
ring finger protein 212B |
| chr6_+_144285681 | 0.46 |
ENST00000433557.1
|
UTRN
|
utrophin |
| chr18_+_74148508 | 0.45 |
ENST00000580087.5
ENST00000169551.11 |
TIMM21
|
translocase of inner mitochondrial membrane 21 |
| chr7_+_90383672 | 0.44 |
ENST00000416322.5
|
CLDN12
|
claudin 12 |
| chr10_-_23344678 | 0.42 |
ENST00000649478.1
ENST00000636213.3 ENST00000673651.1 ENST00000323327.5 |
C10orf67
|
chromosome 10 open reading frame 67 |
| chr1_+_19312296 | 0.41 |
ENST00000375155.7
ENST00000375153.8 |
SLC66A1
|
solute carrier family 66 member 1 |
| chr1_-_10964201 | 0.40 |
ENST00000418570.6
|
C1orf127
|
chromosome 1 open reading frame 127 |
| chr1_+_218285283 | 0.40 |
ENST00000366932.4
|
RRP15
|
ribosomal RNA processing 15 homolog |
| chr1_+_54548217 | 0.39 |
ENST00000343744.7
ENST00000371316.3 |
ACOT11
|
acyl-CoA thioesterase 11 |
| chr22_-_23980469 | 0.39 |
ENST00000404092.5
|
ENSG00000285762.1
|
novel protein, AP000351.4-DDT readtrhough |
| chr2_+_29113989 | 0.39 |
ENST00000404424.5
|
CLIP4
|
CAP-Gly domain containing linker protein family member 4 |
| chr11_+_18132565 | 0.36 |
ENST00000621697.2
|
MRGPRX3
|
MAS related GPR family member X3 |
| chr12_+_59664677 | 0.35 |
ENST00000548610.5
|
SLC16A7
|
solute carrier family 16 member 7 |
| chr4_+_69931066 | 0.35 |
ENST00000246891.9
|
CSN1S1
|
casein alpha s1 |
| chr17_-_73227700 | 0.35 |
ENST00000579872.1
ENST00000580032.1 |
FAM104A
|
family with sequence similarity 104 member A |
| chr18_+_58341038 | 0.35 |
ENST00000679791.1
|
NEDD4L
|
NEDD4 like E3 ubiquitin protein ligase |
| chr1_-_114757971 | 0.34 |
ENST00000261443.9
ENST00000534699.5 ENST00000339438.10 ENST00000358528.9 ENST00000529046.5 ENST00000525970.5 ENST00000369530.5 ENST00000530886.5 ENST00000610726.4 |
CSDE1
|
cold shock domain containing E1 |
| chr4_+_70242583 | 0.34 |
ENST00000304954.3
|
CSN3
|
casein kappa |
| chr1_+_19312341 | 0.34 |
ENST00000400548.6
|
SLC66A1
|
solute carrier family 66 member 1 |
| chr5_+_169584029 | 0.33 |
ENST00000513795.1
|
SPDL1
|
spindle apparatus coiled-coil protein 1 |
| chr2_-_105396943 | 0.32 |
ENST00000409807.5
|
FHL2
|
four and a half LIM domains 2 |
| chr20_+_13008919 | 0.32 |
ENST00000399002.7
ENST00000434210.5 |
SPTLC3
|
serine palmitoyltransferase long chain base subunit 3 |
| chr1_+_59297057 | 0.31 |
ENST00000303721.12
|
FGGY
|
FGGY carbohydrate kinase domain containing |
| chr4_-_40630739 | 0.30 |
ENST00000511902.5
ENST00000505220.1 |
RBM47
|
RNA binding motif protein 47 |
| chr15_+_76336755 | 0.30 |
ENST00000290759.9
|
ISL2
|
ISL LIM homeobox 2 |
| chr13_-_71867192 | 0.30 |
ENST00000611519.4
ENST00000620444.4 ENST00000613252.5 |
DACH1
|
dachshund family transcription factor 1 |
| chr11_-_72112750 | 0.30 |
ENST00000545680.5
ENST00000543587.5 ENST00000538393.5 ENST00000535234.5 ENST00000227618.8 ENST00000535503.5 |
ANAPC15
|
anaphase promoting complex subunit 15 |
| chr3_+_173398438 | 0.29 |
ENST00000457714.5
|
NLGN1
|
neuroligin 1 |
| chr21_-_31344241 | 0.29 |
ENST00000455508.1
|
TIAM1
|
TIAM Rac1 associated GEF 1 |
| chr20_+_59940362 | 0.28 |
ENST00000360816.8
|
FAM217B
|
family with sequence similarity 217 member B |
| chr5_+_137889469 | 0.27 |
ENST00000290431.5
|
PKD2L2
|
polycystin 2 like 2, transient receptor potential cation channel |
| chr6_+_29301701 | 0.27 |
ENST00000641895.1
|
OR14J1
|
olfactory receptor family 14 subfamily J member 1 |
| chr14_+_23372809 | 0.27 |
ENST00000397242.2
ENST00000329715.2 |
IL25
|
interleukin 25 |
| chr6_+_50818701 | 0.26 |
ENST00000344788.7
|
TFAP2B
|
transcription factor AP-2 beta |
| chr12_-_6607334 | 0.26 |
ENST00000645645.1
ENST00000357008.7 ENST00000544484.6 ENST00000544040.7 |
CHD4
|
chromodomain helicase DNA binding protein 4 |
| chr12_+_109347903 | 0.26 |
ENST00000310903.9
|
MYO1H
|
myosin IH |
| chr17_-_3127551 | 0.25 |
ENST00000328890.3
|
OR1G1
|
olfactory receptor family 1 subfamily G member 1 |
| chr5_-_9630351 | 0.25 |
ENST00000382492.4
|
TAS2R1
|
taste 2 receptor member 1 |
| chr11_+_94567362 | 0.25 |
ENST00000299001.11
|
PIWIL4
|
piwi like RNA-mediated gene silencing 4 |
| chr4_-_26490453 | 0.24 |
ENST00000295589.4
|
CCKAR
|
cholecystokinin A receptor |
| chr3_-_42875871 | 0.24 |
ENST00000316161.6
ENST00000437102.1 |
CYP8B1
|
cytochrome P450 family 8 subfamily B member 1 |
| chr12_-_6607397 | 0.24 |
ENST00000645005.1
ENST00000646806.1 |
CHD4
|
chromodomain helicase DNA binding protein 4 |
| chr2_-_20352222 | 0.24 |
ENST00000442400.5
|
PUM2
|
pumilio RNA binding family member 2 |
| chr12_+_21372899 | 0.24 |
ENST00000240652.8
ENST00000542023.1 ENST00000537593.1 |
IAPP
|
islet amyloid polypeptide |
| chr2_-_2331336 | 0.23 |
ENST00000648933.1
ENST00000644820.1 |
MYT1L
|
myelin transcription factor 1 like |
| chrX_-_49264668 | 0.23 |
ENST00000455775.7
ENST00000652559.1 ENST00000376207.10 ENST00000557224.6 ENST00000684155.1 ENST00000376199.7 |
FOXP3
|
forkhead box P3 |
| chr5_-_134174765 | 0.23 |
ENST00000520417.1
|
SKP1
|
S-phase kinase associated protein 1 |
| chr17_-_3433841 | 0.23 |
ENST00000248384.1
|
OR1E2
|
olfactory receptor family 1 subfamily E member 2 |
| chr11_-_14971179 | 0.22 |
ENST00000486207.5
|
CALCA
|
calcitonin related polypeptide alpha |
| chr12_-_10807286 | 0.22 |
ENST00000240615.3
|
TAS2R8
|
taste 2 receptor member 8 |
| chr7_+_131285041 | 0.22 |
ENST00000429546.5
|
MKLN1
|
muskelin 1 |
| chr4_+_56216101 | 0.21 |
ENST00000504228.6
|
CRACD
|
capping protein inhibiting regulator of actin dynamics |
| chr21_-_28992947 | 0.21 |
ENST00000389194.7
ENST00000389195.7 ENST00000614971.4 |
LTN1
|
listerin E3 ubiquitin protein ligase 1 |
| chr3_-_114199407 | 0.21 |
ENST00000460779.5
|
DRD3
|
dopamine receptor D3 |
| chr8_+_106447918 | 0.20 |
ENST00000442977.6
|
OXR1
|
oxidation resistance 1 |
| chr17_-_40755328 | 0.20 |
ENST00000312150.5
|
KRT25
|
keratin 25 |
| chr7_+_1232865 | 0.20 |
ENST00000316333.9
|
UNCX
|
UNC homeobox |
| chr5_-_78985800 | 0.19 |
ENST00000521117.1
|
ARSB
|
arylsulfatase B |
| chr1_+_159439722 | 0.19 |
ENST00000641630.1
ENST00000423932.6 |
OR10J1
|
olfactory receptor family 10 subfamily J member 1 |
| chr11_-_72112669 | 0.19 |
ENST00000545944.5
ENST00000502597.2 |
ANAPC15
|
anaphase promoting complex subunit 15 |
| chr11_-_46846233 | 0.19 |
ENST00000529230.6
ENST00000312055.9 |
CKAP5
|
cytoskeleton associated protein 5 |
| chr7_+_100733576 | 0.18 |
ENST00000613979.5
ENST00000620596.4 |
ZAN
|
zonadhesin |
| chr3_-_112845950 | 0.18 |
ENST00000398214.5
|
CD200R1L
|
CD200 receptor 1 like |
| chr11_-_58508105 | 0.18 |
ENST00000360374.3
|
OR5B21
|
olfactory receptor family 5 subfamily B member 21 |
| chr10_+_52314272 | 0.17 |
ENST00000373970.4
|
DKK1
|
dickkopf WNT signaling pathway inhibitor 1 |
| chr5_-_78985249 | 0.17 |
ENST00000565165.2
|
ARSB
|
arylsulfatase B |
| chr9_-_130893838 | 0.15 |
ENST00000343079.1
|
QRFP
|
pyroglutamylated RFamide peptide |
| chr16_+_53099100 | 0.15 |
ENST00000565832.5
|
CHD9
|
chromodomain helicase DNA binding protein 9 |
| chr1_+_74235377 | 0.15 |
ENST00000326637.8
|
TNNI3K
|
TNNI3 interacting kinase |
| chr13_-_30306837 | 0.14 |
ENST00000414289.5
|
KATNAL1
|
katanin catalytic subunit A1 like 1 |
| chr3_-_69080350 | 0.14 |
ENST00000630585.1
ENST00000361055.9 ENST00000415609.6 ENST00000349511.8 |
UBA3
|
ubiquitin like modifier activating enzyme 3 |
| chr11_-_72793636 | 0.14 |
ENST00000538536.5
ENST00000543304.5 ENST00000540587.1 |
STARD10
|
StAR related lipid transfer domain containing 10 |
| chr22_-_28711931 | 0.14 |
ENST00000434810.5
ENST00000456369.5 |
CHEK2
|
checkpoint kinase 2 |
| chr6_+_157036315 | 0.14 |
ENST00000637904.1
|
ARID1B
|
AT-rich interaction domain 1B |
| chr1_+_248231417 | 0.13 |
ENST00000641868.1
|
OR2M4
|
olfactory receptor family 2 subfamily M member 4 |
| chr20_+_6007245 | 0.13 |
ENST00000378868.4
|
CRLS1
|
cardiolipin synthase 1 |
| chr11_+_59473315 | 0.13 |
ENST00000530162.2
|
OR4D10
|
olfactory receptor family 4 subfamily D member 10 |
| chr11_-_66546228 | 0.13 |
ENST00000526986.5
|
ZDHHC24
|
zinc finger DHHC-type containing 24 |
| chr3_+_130929998 | 0.13 |
ENST00000508297.2
|
ATP2C1
|
ATPase secretory pathway Ca2+ transporting 1 |
| chr6_+_89483255 | 0.13 |
ENST00000520458.5
|
ANKRD6
|
ankyrin repeat domain 6 |
| chr14_-_59576775 | 0.13 |
ENST00000281581.5
ENST00000537690.7 |
CCDC175
|
coiled-coil domain containing 175 |
| chr2_+_79185231 | 0.12 |
ENST00000466387.5
|
CTNNA2
|
catenin alpha 2 |
| chr2_-_127220293 | 0.12 |
ENST00000664447.2
ENST00000409327.2 |
CYP27C1
|
cytochrome P450 family 27 subfamily C member 1 |
| chr5_-_147782518 | 0.12 |
ENST00000507386.5
|
JAKMIP2
|
janus kinase and microtubule interacting protein 2 |
| chr20_-_59940289 | 0.12 |
ENST00000370996.5
|
PPP1R3D
|
protein phosphatase 1 regulatory subunit 3D |
| chr6_-_48111132 | 0.12 |
ENST00000398738.3
ENST00000679966.1 ENST00000339488.9 |
PTCHD4
|
patched domain containing 4 |
| chr16_+_83978545 | 0.11 |
ENST00000566836.1
|
NECAB2
|
N-terminal EF-hand calcium binding protein 2 |
| chr5_+_41904329 | 0.11 |
ENST00000381647.7
ENST00000612065.1 |
C5orf51
|
chromosome 5 open reading frame 51 |
| chr2_-_213151590 | 0.11 |
ENST00000374319.8
ENST00000457361.5 ENST00000451136.6 ENST00000434687.6 |
IKZF2
|
IKAROS family zinc finger 2 |
| chr10_+_116590956 | 0.10 |
ENST00000358834.9
ENST00000528052.5 |
PNLIPRP1
|
pancreatic lipase related protein 1 |
| chr13_+_113044714 | 0.10 |
ENST00000423251.1
|
MCF2L
|
MCF.2 cell line derived transforming sequence like |
| chr5_-_78985288 | 0.10 |
ENST00000264914.10
|
ARSB
|
arylsulfatase B |
| chr7_-_80512041 | 0.10 |
ENST00000398291.4
|
GNAT3
|
G protein subunit alpha transducin 3 |
| chr12_-_100262356 | 0.10 |
ENST00000548313.5
|
DEPDC4
|
DEP domain containing 4 |
| chr7_+_141764097 | 0.09 |
ENST00000247879.2
|
TAS2R3
|
taste 2 receptor member 3 |
| chr1_+_212301806 | 0.09 |
ENST00000537030.3
|
PPP2R5A
|
protein phosphatase 2 regulatory subunit B'alpha |
| chr6_+_75620639 | 0.09 |
ENST00000483859.6
|
SENP6
|
SUMO specific peptidase 6 |
| chr11_+_5449323 | 0.08 |
ENST00000641930.1
|
OR51I2
|
olfactory receptor family 51 subfamily I member 2 |
| chr10_+_116591010 | 0.08 |
ENST00000530319.5
ENST00000527980.5 ENST00000471549.5 ENST00000534537.5 |
PNLIPRP1
|
pancreatic lipase related protein 1 |
| chrX_-_70260199 | 0.08 |
ENST00000374519.4
|
P2RY4
|
pyrimidinergic receptor P2Y4 |
| chr7_+_55109723 | 0.08 |
ENST00000450046.1
|
EGFR
|
epidermal growth factor receptor |
| chr2_-_27212522 | 0.08 |
ENST00000428518.5
|
SLC5A6
|
solute carrier family 5 member 6 |
| chr3_+_98130721 | 0.07 |
ENST00000641874.1
|
OR5H1
|
olfactory receptor family 5 subfamily H member 1 |
| chr5_-_95682968 | 0.07 |
ENST00000274432.13
|
SPATA9
|
spermatogenesis associated 9 |
| chr5_-_78985951 | 0.06 |
ENST00000396151.7
|
ARSB
|
arylsulfatase B |
| chr18_+_13443720 | 0.06 |
ENST00000678309.1
|
LDLRAD4
|
low density lipoprotein receptor class A domain containing 4 |
| chr2_-_105396750 | 0.05 |
ENST00000447958.1
|
FHL2
|
four and a half LIM domains 2 |
| chr8_-_133102623 | 0.04 |
ENST00000524345.5
|
SLA
|
Src like adaptor |
| chr8_+_18391276 | 0.04 |
ENST00000286479.4
ENST00000520116.1 |
NAT2
|
N-acetyltransferase 2 |
| chr11_+_4593750 | 0.03 |
ENST00000450052.3
|
OR52I1
|
olfactory receptor family 52 subfamily I member 1 |
| chr17_-_59151794 | 0.03 |
ENST00000584089.1
|
SKA2
|
spindle and kinetochore associated complex subunit 2 |
| chr7_-_5967204 | 0.03 |
ENST00000337579.4
|
RSPH10B
|
radial spoke head 10 homolog B |
| chr4_+_109827963 | 0.03 |
ENST00000317735.7
|
RRH
|
retinal pigment epithelium-derived rhodopsin homolog |
| chr5_+_38403535 | 0.02 |
ENST00000336740.10
ENST00000397202.6 |
EGFLAM
|
EGF like, fibronectin type III and laminin G domains |
| chr3_+_107599309 | 0.02 |
ENST00000406780.5
|
BBX
|
BBX high mobility group box domain containing |
| chr12_-_57051173 | 0.02 |
ENST00000433964.5
|
MYO1A
|
myosin IA |
| chr5_+_137889437 | 0.02 |
ENST00000508638.5
ENST00000508883.6 ENST00000502810.5 |
PKD2L2
|
polycystin 2 like 2, transient receptor potential cation channel |
| chr7_+_144069811 | 0.00 |
ENST00000641663.1
|
OR2A25
|
olfactory receptor family 2 subfamily A member 25 |
| chr6_+_29306626 | 0.00 |
ENST00000377160.4
|
OR14J1
|
olfactory receptor family 14 subfamily J member 1 |
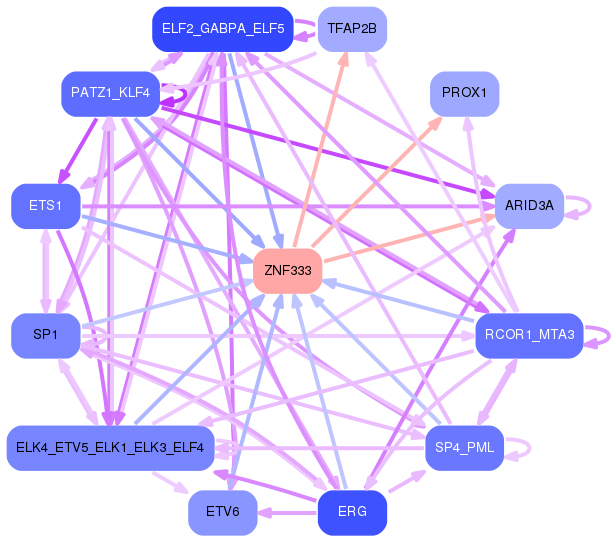
Network of associatons between targets according to the STRING database.

First level regulatory network of ZNF333
Gene Ontology Analysis
Gene overrepresentation in biological process category:
| Log-likelihood per target | Total log-likelihood | Term | Description |
|---|---|---|---|
| 0.8 | 6.6 | GO:0061709 | reticulophagy(GO:0061709) |
| 0.4 | 1.1 | GO:0097272 | ammonia homeostasis(GO:0097272) urea homeostasis(GO:0097274) |
| 0.3 | 0.9 | GO:0061114 | hepatocyte cell migration(GO:0002194) otic placode formation(GO:0043049) branching involved in pancreas morphogenesis(GO:0061114) acinar cell differentiation(GO:0090425) positive regulation of forebrain neuron differentiation(GO:2000979) |
| 0.3 | 1.1 | GO:0005986 | sucrose biosynthetic process(GO:0005986) |
| 0.2 | 0.8 | GO:0019249 | lactate biosynthetic process(GO:0019249) |
| 0.2 | 1.1 | GO:0070966 | nuclear-transcribed mRNA catabolic process, no-go decay(GO:0070966) |
| 0.2 | 3.3 | GO:2000766 | negative regulation of cytoplasmic translation(GO:2000766) |
| 0.1 | 0.9 | GO:0044861 | protein transport into plasma membrane raft(GO:0044861) |
| 0.1 | 0.5 | GO:0061580 | colon epithelial cell migration(GO:0061580) |
| 0.1 | 0.7 | GO:0033615 | mitochondrial proton-transporting ATP synthase complex assembly(GO:0033615) |
| 0.1 | 0.3 | GO:0021524 | visceral motor neuron differentiation(GO:0021524) |
| 0.1 | 1.0 | GO:0086073 | bundle of His cell-Purkinje myocyte adhesion involved in cell communication(GO:0086073) |
| 0.1 | 1.4 | GO:0035092 | sperm chromatin condensation(GO:0035092) |
| 0.1 | 0.3 | GO:1904268 | positive regulation of Schwann cell migration(GO:1900149) regulation of Schwann cell chemotaxis(GO:1904266) positive regulation of Schwann cell chemotaxis(GO:1904268) Schwann cell chemotaxis(GO:1990751) |
| 0.1 | 0.5 | GO:0051389 | inactivation of MAPKK activity(GO:0051389) |
| 0.1 | 0.2 | GO:0002465 | peripheral T cell tolerance induction(GO:0002458) peripheral tolerance induction(GO:0002465) |
| 0.1 | 0.3 | GO:0048789 | cytoskeletal matrix organization at active zone(GO:0048789) neurexin clustering involved in presynaptic membrane assembly(GO:0097115) retrograde trans-synaptic signaling by trans-synaptic protein complex(GO:0098942) trans-synaptic signaling by trans-synaptic complex(GO:0099545) |
| 0.1 | 0.2 | GO:0001978 | regulation of systemic arterial blood pressure by carotid sinus baroreceptor feedback(GO:0001978) baroreceptor response to increased systemic arterial blood pressure(GO:0001983) |
| 0.1 | 0.2 | GO:0090381 | regulation of heart induction(GO:0090381) regulation of heart induction by canonical Wnt signaling pathway(GO:0100012) regulation of midbrain dopaminergic neuron differentiation(GO:1904956) |
| 0.1 | 0.2 | GO:0050883 | musculoskeletal movement, spinal reflex action(GO:0050883) |
| 0.1 | 0.5 | GO:0072553 | terminal button organization(GO:0072553) |
| 0.0 | 0.1 | GO:1903925 | signal transduction involved in intra-S DNA damage checkpoint(GO:0072428) response to bisphenol A(GO:1903925) cellular response to bisphenol A(GO:1903926) |
| 0.0 | 0.4 | GO:0055011 | atrial cardiac muscle cell differentiation(GO:0055011) atrial cardiac muscle cell development(GO:0055014) |
| 0.0 | 0.8 | GO:0046520 | sphingoid biosynthetic process(GO:0046520) |
| 0.0 | 0.7 | GO:0044341 | sodium-dependent phosphate transport(GO:0044341) |
| 0.0 | 0.5 | GO:2000332 | response to linoleic acid(GO:0070543) blood microparticle formation(GO:0072564) regulation of blood microparticle formation(GO:2000332) positive regulation of blood microparticle formation(GO:2000334) |
| 0.0 | 0.3 | GO:0009624 | response to nematode(GO:0009624) |
| 0.0 | 1.0 | GO:0006123 | mitochondrial electron transport, cytochrome c to oxygen(GO:0006123) |
| 0.0 | 0.1 | GO:0007113 | endomitotic cell cycle(GO:0007113) |
| 0.0 | 0.5 | GO:0014894 | response to muscle inactivity involved in regulation of muscle adaptation(GO:0014877) response to denervation involved in regulation of muscle adaptation(GO:0014894) |
| 0.0 | 0.4 | GO:1901475 | pyruvate transport(GO:0006848) pyruvate transmembrane transport(GO:1901475) |
| 0.0 | 12.9 | GO:0006941 | striated muscle contraction(GO:0006941) |
| 0.0 | 0.5 | GO:0016998 | cell wall macromolecule catabolic process(GO:0016998) |
| 0.0 | 0.3 | GO:0060244 | negative regulation of cell proliferation involved in contact inhibition(GO:0060244) |
| 0.0 | 0.6 | GO:0046069 | cGMP catabolic process(GO:0046069) |
| 0.0 | 2.1 | GO:0006120 | mitochondrial electron transport, NADH to ubiquinone(GO:0006120) |
| 0.0 | 0.3 | GO:0016554 | cytidine to uridine editing(GO:0016554) |
| 0.0 | 0.2 | GO:0010265 | SCF complex assembly(GO:0010265) |
| 0.0 | 1.4 | GO:0032008 | positive regulation of TOR signaling(GO:0032008) |
| 0.0 | 0.1 | GO:1904021 | negative regulation of G-protein coupled receptor internalization(GO:1904021) |
| 0.0 | 0.4 | GO:0033617 | mitochondrial respiratory chain complex IV assembly(GO:0033617) |
| 0.0 | 0.2 | GO:0010739 | positive regulation of protein kinase A signaling(GO:0010739) calcitonin family receptor signaling pathway(GO:0097646) amylin receptor signaling pathway(GO:0097647) |
| 0.0 | 0.3 | GO:0070050 | neuron cellular homeostasis(GO:0070050) |
| 0.0 | 0.5 | GO:0090266 | regulation of mitotic cell cycle spindle assembly checkpoint(GO:0090266) regulation of mitotic spindle checkpoint(GO:1903504) |
| 0.0 | 0.2 | GO:1900246 | positive regulation of RIG-I signaling pathway(GO:1900246) |
| 0.0 | 1.1 | GO:0032094 | response to food(GO:0032094) |
| 0.0 | 0.1 | GO:0043006 | activation of phospholipase A2 activity by calcium-mediated signaling(GO:0043006) |
| 0.0 | 0.8 | GO:0015695 | organic cation transport(GO:0015695) |
| 0.0 | 0.1 | GO:0032468 | Golgi calcium ion homeostasis(GO:0032468) |
| 0.0 | 0.7 | GO:0010569 | regulation of double-strand break repair via homologous recombination(GO:0010569) |
| 0.0 | 0.2 | GO:0035726 | common myeloid progenitor cell proliferation(GO:0035726) |
| 0.0 | 0.1 | GO:0097026 | dendritic cell dendrite assembly(GO:0097026) |
| 0.0 | 0.1 | GO:0097068 | response to thyroxine(GO:0097068) response to L-phenylalanine derivative(GO:1904386) |
| 0.0 | 0.3 | GO:0034501 | protein localization to kinetochore(GO:0034501) |
| 0.0 | 3.9 | GO:0034605 | cellular response to heat(GO:0034605) |
| 0.0 | 0.2 | GO:0030951 | establishment or maintenance of microtubule cytoskeleton polarity(GO:0030951) |
| 0.0 | 0.1 | GO:0090234 | regulation of kinetochore assembly(GO:0090234) |
| 0.0 | 0.7 | GO:0001580 | detection of chemical stimulus involved in sensory perception of bitter taste(GO:0001580) |
| 0.0 | 0.1 | GO:0015878 | biotin transport(GO:0015878) pantothenate transmembrane transport(GO:0015887) |
| 0.0 | 0.2 | GO:1902083 | negative regulation of peptidyl-cysteine S-nitrosylation(GO:1902083) |
| 0.0 | 1.4 | GO:1902600 | hydrogen ion transmembrane transport(GO:1902600) |
| 0.0 | 0.2 | GO:0010529 | regulation of transposition(GO:0010528) negative regulation of transposition(GO:0010529) |
| 0.0 | 0.1 | GO:0051013 | microtubule severing(GO:0051013) |
| 0.0 | 0.4 | GO:0000470 | maturation of LSU-rRNA(GO:0000470) |
| 0.0 | 0.4 | GO:0016338 | calcium-independent cell-cell adhesion via plasma membrane cell-adhesion molecules(GO:0016338) |
| 0.0 | 1.0 | GO:0006937 | regulation of muscle contraction(GO:0006937) |
Gene overrepresentation in cellular component category:
| Log-likelihood per target | Total log-likelihood | Term | Description |
|---|---|---|---|
| 2.1 | 12.4 | GO:0005927 | muscle tendon junction(GO:0005927) |
| 0.1 | 1.4 | GO:0071986 | Ragulator complex(GO:0071986) |
| 0.1 | 2.6 | GO:0045277 | respiratory chain complex IV(GO:0045277) |
| 0.1 | 3.3 | GO:1990124 | messenger ribonucleoprotein complex(GO:1990124) |
| 0.1 | 6.6 | GO:0005801 | cis-Golgi network(GO:0005801) |
| 0.1 | 1.7 | GO:0032591 | dendritic spine membrane(GO:0032591) |
| 0.1 | 0.8 | GO:0017059 | serine C-palmitoyltransferase complex(GO:0017059) endoplasmic reticulum palmitoyltransferase complex(GO:0031211) |
| 0.1 | 0.9 | GO:0044352 | pinosome(GO:0044352) macropinosome(GO:0044354) |
| 0.1 | 0.5 | GO:0035867 | alphav-beta3 integrin-IGF-1-IGF1R complex(GO:0035867) |
| 0.1 | 1.1 | GO:0070937 | CRD-mediated mRNA stability complex(GO:0070937) |
| 0.0 | 0.2 | GO:0071547 | piP-body(GO:0071547) |
| 0.0 | 0.2 | GO:0031467 | Cul7-RING ubiquitin ligase complex(GO:0031467) |
| 0.0 | 1.0 | GO:0005916 | fascia adherens(GO:0005916) |
| 0.0 | 0.4 | GO:0005744 | mitochondrial inner membrane presequence translocase complex(GO:0005744) |
| 0.0 | 2.1 | GO:0030964 | mitochondrial respiratory chain complex I(GO:0005747) NADH dehydrogenase complex(GO:0030964) respiratory chain complex I(GO:0045271) |
| 0.0 | 0.1 | GO:0097489 | multivesicular body, internal vesicle lumen(GO:0097489) |
| 0.0 | 0.4 | GO:0000940 | condensed chromosome outer kinetochore(GO:0000940) |
| 0.0 | 0.5 | GO:0070938 | contractile ring(GO:0070938) |
| 0.0 | 0.3 | GO:0032433 | filopodium tip(GO:0032433) |
| 0.0 | 1.5 | GO:0031672 | A band(GO:0031672) |
| 0.0 | 0.5 | GO:0005680 | anaphase-promoting complex(GO:0005680) |
| 0.0 | 0.4 | GO:0005839 | proteasome core complex(GO:0005839) |
| 0.0 | 0.5 | GO:0016581 | NuRD complex(GO:0016581) CHD-type complex(GO:0090545) |
| 0.0 | 0.4 | GO:0030687 | preribosome, large subunit precursor(GO:0030687) |
| 0.0 | 0.9 | GO:0045095 | keratin filament(GO:0045095) |
Gene overrepresentation in molecular function category:
| Log-likelihood per target | Total log-likelihood | Term | Description |
|---|---|---|---|
| 0.3 | 1.1 | GO:0042132 | fructose 1,6-bisphosphate 1-phosphatase activity(GO:0042132) |
| 0.1 | 0.5 | GO:0005010 | insulin-like growth factor-activated receptor activity(GO:0005010) |
| 0.1 | 0.5 | GO:0003943 | N-acetylgalactosamine-4-sulfatase activity(GO:0003943) |
| 0.1 | 1.0 | GO:0086083 | cell adhesive protein binding involved in bundle of His cell-Purkinje myocyte communication(GO:0086083) |
| 0.1 | 0.8 | GO:0004758 | serine C-palmitoyltransferase activity(GO:0004758) C-palmitoyltransferase activity(GO:0016454) |
| 0.1 | 0.4 | GO:0005477 | pyruvate secondary active transmembrane transporter activity(GO:0005477) |
| 0.1 | 0.7 | GO:0008454 | alpha-1,3-mannosylglycoprotein 4-beta-N-acetylglucosaminyltransferase activity(GO:0008454) |
| 0.1 | 0.7 | GO:0015319 | sodium:inorganic phosphate symporter activity(GO:0015319) |
| 0.1 | 0.3 | GO:0019150 | D-ribulokinase activity(GO:0019150) |
| 0.1 | 2.6 | GO:0015002 | cytochrome-c oxidase activity(GO:0004129) heme-copper terminal oxidase activity(GO:0015002) oxidoreductase activity, acting on a heme group of donors, oxygen as acceptor(GO:0016676) |
| 0.1 | 0.8 | GO:0004459 | L-lactate dehydrogenase activity(GO:0004459) |
| 0.1 | 3.3 | GO:0000900 | translation repressor activity, nucleic acid binding(GO:0000900) |
| 0.1 | 0.9 | GO:0050692 | DBD domain binding(GO:0050692) |
| 0.1 | 0.2 | GO:0034584 | piRNA binding(GO:0034584) |
| 0.1 | 0.2 | GO:0031716 | calcitonin receptor binding(GO:0031716) |
| 0.0 | 0.1 | GO:0019781 | NEDD8 activating enzyme activity(GO:0019781) |
| 0.0 | 0.3 | GO:0043515 | kinetochore binding(GO:0043515) |
| 0.0 | 0.6 | GO:0004118 | cGMP-stimulated cyclic-nucleotide phosphodiesterase activity(GO:0004118) |
| 0.0 | 0.5 | GO:0070892 | lipoteichoic acid receptor activity(GO:0070892) |
| 0.0 | 2.1 | GO:0050136 | NADH dehydrogenase (ubiquinone) activity(GO:0008137) NADH dehydrogenase (quinone) activity(GO:0050136) |
| 0.0 | 0.8 | GO:0015101 | organic cation transmembrane transporter activity(GO:0015101) |
| 0.0 | 0.5 | GO:0003796 | lysozyme activity(GO:0003796) |
| 0.0 | 0.1 | GO:0031687 | A2A adenosine receptor binding(GO:0031687) |
| 0.0 | 0.6 | GO:0033038 | bitter taste receptor activity(GO:0033038) |
| 0.0 | 1.1 | GO:0051010 | microtubule plus-end binding(GO:0051010) |
| 0.0 | 0.8 | GO:0030275 | LRR domain binding(GO:0030275) |
| 0.0 | 1.4 | GO:0000983 | transcription factor activity, RNA polymerase II core promoter sequence-specific(GO:0000983) |
| 0.0 | 0.1 | GO:0005502 | 11-cis retinal binding(GO:0005502) |
| 0.0 | 0.8 | GO:0034237 | protein kinase A regulatory subunit binding(GO:0034237) |
| 0.0 | 0.2 | GO:0051525 | NFAT protein binding(GO:0051525) |
| 0.0 | 0.2 | GO:0031013 | troponin I binding(GO:0031013) |
| 0.0 | 0.1 | GO:0005006 | epidermal growth factor-activated receptor activity(GO:0005006) |
| 0.0 | 0.2 | GO:0001591 | dopamine neurotransmitter receptor activity, coupled via Gi/Go(GO:0001591) |
| 0.0 | 0.4 | GO:0047617 | acyl-CoA hydrolase activity(GO:0047617) |
| 0.0 | 0.3 | GO:0019870 | potassium channel inhibitor activity(GO:0019870) |
| 0.0 | 0.5 | GO:0070628 | proteasome binding(GO:0070628) |
| 0.0 | 0.5 | GO:0019789 | SUMO transferase activity(GO:0019789) |
| 0.0 | 0.0 | GO:0004060 | arylamine N-acetyltransferase activity(GO:0004060) |
| 0.0 | 4.8 | GO:0005516 | calmodulin binding(GO:0005516) |
| 0.0 | 0.3 | GO:0042043 | neurexin family protein binding(GO:0042043) |
| 0.0 | 0.5 | GO:0017166 | vinculin binding(GO:0017166) |
| 0.0 | 0.1 | GO:0008523 | sodium-dependent multivitamin transmembrane transporter activity(GO:0008523) |
| 0.0 | 0.1 | GO:0008568 | microtubule-severing ATPase activity(GO:0008568) |
| 0.0 | 0.2 | GO:0048019 | receptor antagonist activity(GO:0048019) |
Gene overrepresentation in curated gene sets: canonical pathways category:
| Log-likelihood per target | Total log-likelihood | Term | Description |
|---|---|---|---|
| 0.0 | 0.9 | PID LIS1 PATHWAY | Lissencephaly gene (LIS1) in neuronal migration and development |
Gene overrepresentation in curated gene sets: REACTOME pathways category:
| Log-likelihood per target | Total log-likelihood | Term | Description |
|---|---|---|---|
| 0.0 | 0.5 | REACTOME THE ACTIVATION OF ARYLSULFATASES | Genes involved in The activation of arylsulfatases |
| 0.0 | 0.7 | REACTOME N GLYCAN ANTENNAE ELONGATION | Genes involved in N-Glycan antennae elongation |
| 0.0 | 0.1 | REACTOME P53 INDEPENDENT G1 S DNA DAMAGE CHECKPOINT | Genes involved in p53-Independent G1/S DNA damage checkpoint |
| 0.0 | 0.2 | REACTOME SYNTHESIS OF BILE ACIDS AND BILE SALTS VIA 24 HYDROXYCHOLESTEROL | Genes involved in Synthesis of bile acids and bile salts via 24-hydroxycholesterol |
| 0.0 | 0.4 | REACTOME BILE SALT AND ORGANIC ANION SLC TRANSPORTERS | Genes involved in Bile salt and organic anion SLC transporters |
| 0.0 | 0.7 | REACTOME MEIOTIC RECOMBINATION | Genes involved in Meiotic Recombination |
| 0.0 | 1.1 | REACTOME GLUCONEOGENESIS | Genes involved in Gluconeogenesis |
| 0.0 | 0.6 | REACTOME CGMP EFFECTS | Genes involved in cGMP effects |
| 0.0 | 0.5 | REACTOME ANTIGEN PROCESSING CROSS PRESENTATION | Genes involved in Antigen processing-Cross presentation |
| 0.0 | 0.4 | REACTOME TERMINATION OF O GLYCAN BIOSYNTHESIS | Genes involved in Termination of O-glycan biosynthesis |
| 0.0 | 3.7 | REACTOME ANTIGEN PROCESSING UBIQUITINATION PROTEASOME DEGRADATION | Genes involved in Antigen processing: Ubiquitination & Proteasome degradation |