Project
Illumina Body Map 2 (GSE30611)
Navigation
Downloads
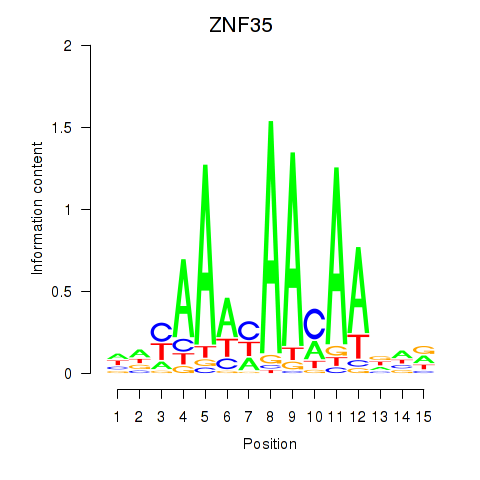
Results for ZNF35
Z-value: 0.42
Motif logo
Transcription factors associated with ZNF35
| Gene Symbol | Gene ID | Gene Info |
|---|---|---|
|
ZNF35
|
ENSG00000169981.11 | zinc finger protein 35 |
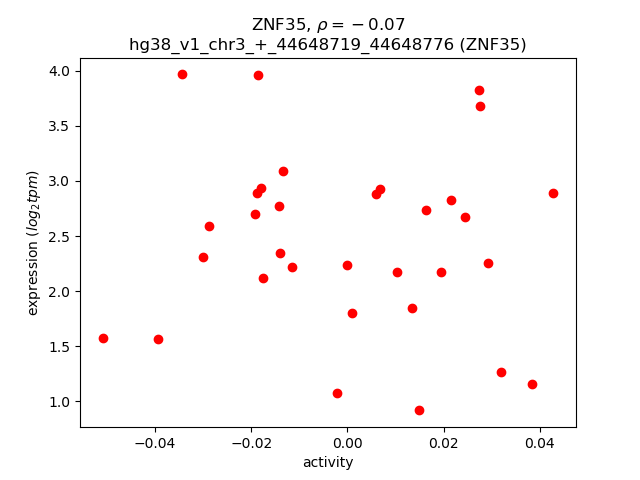
Activity-expression correlation:
| Gene | Promoter | Pearson corr. coef. | P-value | Plot |
|---|---|---|---|---|
| ZNF35 | hg38_v1_chr3_+_44648719_44648776 | -0.07 | 7.1e-01 | Click! |
Activity profile of ZNF35 motif
Sorted Z-values of ZNF35 motif
| Promoter | Log-likelihood | Transcript | Gene | Gene Info |
|---|---|---|---|---|
| chr2_+_126656128 | 0.60 |
ENST00000259254.9
ENST00000409836.3 ENST00000356887.12 |
GYPC
|
glycophorin C (Gerbich blood group) |
| chr10_+_61901678 | 0.56 |
ENST00000644638.1
ENST00000681100.1 ENST00000279873.12 |
ARID5B
|
AT-rich interaction domain 5B |
| chr3_-_49029378 | 0.54 |
ENST00000442157.2
ENST00000326739.9 ENST00000677010.1 ENST00000678724.1 ENST00000429182.6 |
IMPDH2
|
inosine monophosphate dehydrogenase 2 |
| chr16_-_4273014 | 0.51 |
ENST00000204517.11
|
TFAP4
|
transcription factor AP-4 |
| chr12_+_54497712 | 0.49 |
ENST00000293373.11
|
NCKAP1L
|
NCK associated protein 1 like |
| chr19_-_4535221 | 0.48 |
ENST00000381848.7
ENST00000586133.1 |
PLIN5
|
perilipin 5 |
| chr4_-_44651619 | 0.45 |
ENST00000415895.9
ENST00000332990.6 |
YIPF7
|
Yip1 domain family member 7 |
| chr8_-_94262308 | 0.44 |
ENST00000297596.3
ENST00000396194.6 |
GEM
|
GTP binding protein overexpressed in skeletal muscle |
| chr3_-_132684685 | 0.43 |
ENST00000512094.5
ENST00000632629.1 |
NPHP3
NPHP3-ACAD11
|
nephrocystin 3 NPHP3-ACAD11 readthrough (NMD candidate) |
| chr2_-_189580773 | 0.39 |
ENST00000261024.7
|
SLC40A1
|
solute carrier family 40 member 1 |
| chr2_-_216695540 | 0.39 |
ENST00000233813.5
|
IGFBP5
|
insulin like growth factor binding protein 5 |
| chr15_+_45634721 | 0.37 |
ENST00000561735.5
|
SQOR
|
sulfide quinone oxidoreductase |
| chr19_+_47608942 | 0.37 |
ENST00000594866.2
|
BICRA
|
BRD4 interacting chromatin remodeling complex associated protein |
| chr6_+_156776020 | 0.27 |
ENST00000346085.10
|
ARID1B
|
AT-rich interaction domain 1B |
| chr7_+_27242796 | 0.26 |
ENST00000496902.7
|
EVX1
|
even-skipped homeobox 1 |
| chr10_+_24042131 | 0.25 |
ENST00000636305.1
|
KIAA1217
|
KIAA1217 |
| chr3_-_149221811 | 0.24 |
ENST00000455472.3
ENST00000264613.11 |
CP
|
ceruloplasmin |
| chr3_+_69936629 | 0.23 |
ENST00000394348.2
ENST00000531774.1 |
MITF
|
melanocyte inducing transcription factor |
| chr16_-_77431553 | 0.23 |
ENST00000562345.1
|
ADAMTS18
|
ADAM metallopeptidase with thrombospondin type 1 motif 18 |
| chr1_+_61404076 | 0.22 |
ENST00000357977.5
|
NFIA
|
nuclear factor I A |
| chr4_+_67558719 | 0.22 |
ENST00000265404.7
ENST00000396225.1 |
STAP1
|
signal transducing adaptor family member 1 |
| chr11_+_111245725 | 0.22 |
ENST00000280325.7
|
C11orf53
|
chromosome 11 open reading frame 53 |
| chr8_-_144529048 | 0.22 |
ENST00000527462.1
ENST00000313465.5 ENST00000524821.6 |
C8orf82
|
chromosome 8 open reading frame 82 |
| chr14_+_19875142 | 0.21 |
ENST00000641885.1
|
OR4K2
|
olfactory receptor family 4 subfamily K member 2 |
| chr3_+_69936583 | 0.21 |
ENST00000314557.10
ENST00000394351.9 |
MITF
|
melanocyte inducing transcription factor |
| chr10_+_72893572 | 0.20 |
ENST00000622652.1
|
OIT3
|
oncoprotein induced transcript 3 |
| chr2_+_147845020 | 0.19 |
ENST00000241416.12
|
ACVR2A
|
activin A receptor type 2A |
| chr3_-_71583592 | 0.19 |
ENST00000650156.1
ENST00000649596.1 |
FOXP1
|
forkhead box P1 |
| chr7_+_27242700 | 0.19 |
ENST00000222761.7
|
EVX1
|
even-skipped homeobox 1 |
| chr5_+_76875177 | 0.19 |
ENST00000613039.1
|
S100Z
|
S100 calcium binding protein Z |
| chr16_+_8621679 | 0.18 |
ENST00000563958.5
ENST00000381920.8 ENST00000564554.1 |
METTL22
|
methyltransferase like 22 |
| chr7_+_123848070 | 0.18 |
ENST00000476325.5
|
HYAL4
|
hyaluronidase 4 |
| chr4_+_73436198 | 0.17 |
ENST00000395792.7
|
AFP
|
alpha fetoprotein |
| chr12_-_10939263 | 0.17 |
ENST00000537503.2
|
TAS2R14
|
taste 2 receptor member 14 |
| chr3_-_146605239 | 0.16 |
ENST00000492200.5
ENST00000482567.5 ENST00000443512.2 |
PLSCR5
|
phospholipid scramblase family member 5 |
| chr4_+_73436244 | 0.16 |
ENST00000226359.2
|
AFP
|
alpha fetoprotein |
| chr1_+_84164962 | 0.15 |
ENST00000614872.4
ENST00000394839.6 |
PRKACB
|
protein kinase cAMP-activated catalytic subunit beta |
| chr13_-_35855758 | 0.15 |
ENST00000615680.4
|
DCLK1
|
doublecortin like kinase 1 |
| chr5_-_39202991 | 0.15 |
ENST00000515010.5
|
FYB1
|
FYN binding protein 1 |
| chr3_-_71583713 | 0.14 |
ENST00000649528.3
ENST00000471386.3 ENST00000493089.7 |
FOXP1
|
forkhead box P1 |
| chr3_-_71493500 | 0.14 |
ENST00000648380.1
ENST00000650295.1 |
FOXP1
|
forkhead box P1 |
| chr16_+_14833713 | 0.14 |
ENST00000287667.12
ENST00000620755.4 ENST00000610363.4 |
NOMO1
|
NODAL modulator 1 |
| chrM_+_4467 | 0.14 |
ENST00000361453.3
|
MT-ND2
|
mitochondrially encoded NADH:ubiquinone oxidoreductase core subunit 2 |
| chr12_-_102478539 | 0.13 |
ENST00000424202.6
|
IGF1
|
insulin like growth factor 1 |
| chr13_-_35855627 | 0.13 |
ENST00000379893.5
|
DCLK1
|
doublecortin like kinase 1 |
| chr4_+_173370908 | 0.13 |
ENST00000296504.4
|
SAP30
|
Sin3A associated protein 30 |
| chr13_-_46897021 | 0.13 |
ENST00000542664.4
ENST00000543956.5 |
HTR2A
|
5-hydroxytryptamine receptor 2A |
| chr19_+_49591170 | 0.12 |
ENST00000418929.7
|
PRR12
|
proline rich 12 |
| chr17_-_65561640 | 0.12 |
ENST00000618960.4
ENST00000307078.10 |
AXIN2
|
axin 2 |
| chr7_+_80602150 | 0.12 |
ENST00000309881.11
|
CD36
|
CD36 molecule |
| chr6_-_132763424 | 0.12 |
ENST00000532012.1
ENST00000525270.5 ENST00000530536.5 ENST00000524919.5 |
VNN2
|
vanin 2 |
| chr17_-_445939 | 0.12 |
ENST00000329099.4
|
RFLNB
|
refilin B |
| chr19_-_14090695 | 0.11 |
ENST00000533683.7
|
SAMD1
|
sterile alpha motif domain containing 1 |
| chr3_+_141387616 | 0.11 |
ENST00000509883.5
|
ZBTB38
|
zinc finger and BTB domain containing 38 |
| chr17_+_43483949 | 0.10 |
ENST00000540306.5
ENST00000262415.8 |
DHX8
|
DEAH-box helicase 8 |
| chr10_-_50885619 | 0.10 |
ENST00000373997.8
|
A1CF
|
APOBEC1 complementation factor |
| chr9_-_16705062 | 0.10 |
ENST00000471301.3
|
BNC2
|
basonuclin 2 |
| chr5_+_140112870 | 0.09 |
ENST00000502351.1
|
PURA
|
purine rich element binding protein A |
| chr1_-_169703329 | 0.09 |
ENST00000497295.1
|
SELL
|
selectin L |
| chr12_+_55314343 | 0.08 |
ENST00000642104.1
|
OR6C1
|
olfactory receptor family 6 subfamily C member 1 |
| chr17_-_59151794 | 0.08 |
ENST00000584089.1
|
SKA2
|
spindle and kinetochore associated complex subunit 2 |
| chr20_+_58907981 | 0.08 |
ENST00000656419.1
|
GNAS
|
GNAS complex locus |
| chr12_-_22334683 | 0.07 |
ENST00000404299.3
ENST00000396037.9 |
ST8SIA1
|
ST8 alpha-N-acetyl-neuraminide alpha-2,8-sialyltransferase 1 |
| chr12_-_22334637 | 0.07 |
ENST00000381424.3
|
ST8SIA1
|
ST8 alpha-N-acetyl-neuraminide alpha-2,8-sialyltransferase 1 |
| chr11_+_57667747 | 0.07 |
ENST00000527985.5
|
ZDHHC5
|
zinc finger DHHC-type palmitoyltransferase 5 |
| chr3_+_184035104 | 0.07 |
ENST00000453435.1
|
HTR3D
|
5-hydroxytryptamine receptor 3D |
| chr19_+_926001 | 0.07 |
ENST00000263620.8
|
ARID3A
|
AT-rich interaction domain 3A |
| chr2_+_191678152 | 0.06 |
ENST00000409510.5
|
NABP1
|
nucleic acid binding protein 1 |
| chr2_-_80304274 | 0.06 |
ENST00000409148.1
ENST00000415098.1 ENST00000452811.1 |
LRRTM1
|
leucine rich repeat transmembrane neuronal 1 |
| chr4_+_74308487 | 0.06 |
ENST00000332112.8
|
EPGN
|
epithelial mitogen |
| chr1_+_84164891 | 0.06 |
ENST00000413538.5
ENST00000417530.5 |
PRKACB
|
protein kinase cAMP-activated catalytic subunit beta |
| chr6_+_96563117 | 0.05 |
ENST00000450218.6
|
FHL5
|
four and a half LIM domains 5 |
| chr17_+_7438267 | 0.05 |
ENST00000575235.5
|
FGF11
|
fibroblast growth factor 11 |
| chr4_+_94455245 | 0.05 |
ENST00000508216.5
ENST00000514743.5 |
PDLIM5
|
PDZ and LIM domain 5 |
| chr4_-_88823214 | 0.05 |
ENST00000513837.5
ENST00000503556.5 |
FAM13A
|
family with sequence similarity 13 member A |
| chr2_-_70182786 | 0.04 |
ENST00000419381.1
|
C2orf42
|
chromosome 2 open reading frame 42 |
| chr4_-_145938473 | 0.04 |
ENST00000513320.5
|
ZNF827
|
zinc finger protein 827 |
| chr3_+_141386862 | 0.04 |
ENST00000513258.5
|
ZBTB38
|
zinc finger and BTB domain containing 38 |
| chr10_-_50885656 | 0.03 |
ENST00000374001.6
ENST00000395489.6 ENST00000282641.6 ENST00000395495.5 ENST00000373995.7 ENST00000414883.1 |
A1CF
|
APOBEC1 complementation factor |
| chr20_-_10420737 | 0.03 |
ENST00000649912.1
|
ENSG00000285723.1
|
novel protein |
| chr4_+_74308492 | 0.03 |
ENST00000502358.5
ENST00000503098.5 ENST00000505212.5 ENST00000509145.5 ENST00000514968.5 |
EPGN
|
epithelial mitogen |
| chr7_-_78771058 | 0.03 |
ENST00000628781.1
|
MAGI2
|
membrane associated guanylate kinase, WW and PDZ domain containing 2 |
| chr4_-_145938422 | 0.03 |
ENST00000656985.1
ENST00000652097.1 ENST00000503462.3 ENST00000379448.9 ENST00000513840.2 |
ZNF827
|
zinc finger protein 827 |
| chr4_-_145938775 | 0.03 |
ENST00000508784.6
|
ZNF827
|
zinc finger protein 827 |
| chr12_-_46372763 | 0.03 |
ENST00000256689.10
|
SLC38A2
|
solute carrier family 38 member 2 |
| chr7_-_78771108 | 0.02 |
ENST00000626691.2
|
MAGI2
|
membrane associated guanylate kinase, WW and PDZ domain containing 2 |
| chr6_-_10410094 | 0.02 |
ENST00000475264.5
|
TFAP2A
|
transcription factor AP-2 alpha |
| chr1_-_151327365 | 0.01 |
ENST00000438243.2
ENST00000489223.2 ENST00000368873.6 ENST00000430800.5 ENST00000368872.5 |
PI4KB
|
phosphatidylinositol 4-kinase beta |
| chr2_+_66435558 | 0.01 |
ENST00000488550.5
|
MEIS1
|
Meis homeobox 1 |
| chr13_-_46020487 | 0.00 |
ENST00000464597.2
|
ZC3H13
|
zinc finger CCCH-type containing 13 |
| chr13_-_52848632 | 0.00 |
ENST00000377942.7
ENST00000338862.5 |
PCDH8
|
protocadherin 8 |
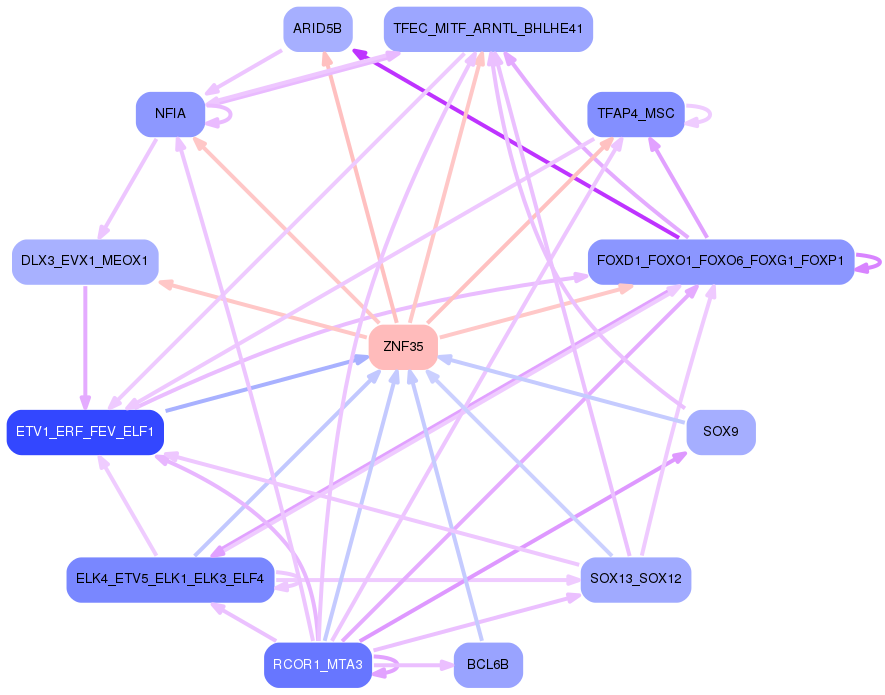
Network of associatons between targets according to the STRING database.

First level regulatory network of ZNF35
Gene Ontology Analysis
Gene overrepresentation in biological process category:
| Log-likelihood per target | Total log-likelihood | Term | Description |
|---|---|---|---|
| 0.2 | 0.5 | GO:0043376 | regulation of CD8-positive, alpha-beta T cell differentiation(GO:0043376) |
| 0.1 | 0.4 | GO:1903414 | spleen trabecula formation(GO:0060345) iron cation export(GO:1903414) ferrous iron export(GO:1903988) |
| 0.1 | 0.4 | GO:1904204 | regulation of skeletal muscle hypertrophy(GO:1904204) |
| 0.1 | 0.4 | GO:0021913 | regulation of transcription from RNA polymerase II promoter involved in ventral spinal cord interneuron specification(GO:0021913) |
| 0.1 | 0.4 | GO:1901842 | negative regulation of high voltage-gated calcium channel activity(GO:1901842) |
| 0.1 | 0.5 | GO:0035359 | negative regulation of peroxisome proliferator activated receptor signaling pathway(GO:0035359) |
| 0.1 | 0.5 | GO:0006177 | GMP biosynthetic process(GO:0006177) |
| 0.1 | 0.4 | GO:0048496 | maintenance of organ identity(GO:0048496) |
| 0.1 | 0.2 | GO:1902227 | negative regulation of macrophage colony-stimulating factor signaling pathway(GO:1902227) negative regulation of response to macrophage colony-stimulating factor(GO:1903970) negative regulation of cellular response to macrophage colony-stimulating factor stimulus(GO:1903973) |
| 0.1 | 0.4 | GO:0070221 | sulfide oxidation(GO:0019418) sulfide oxidation, using sulfide:quinone oxidoreductase(GO:0070221) |
| 0.0 | 0.1 | GO:0061182 | negative regulation of chondrocyte development(GO:0061182) |
| 0.0 | 0.3 | GO:0097026 | dendritic cell dendrite assembly(GO:0097026) |
| 0.0 | 0.2 | GO:0060011 | Sertoli cell proliferation(GO:0060011) |
| 0.0 | 0.1 | GO:1904075 | regulation of trophectodermal cell proliferation(GO:1904073) positive regulation of trophectodermal cell proliferation(GO:1904075) |
| 0.0 | 0.5 | GO:0032625 | interleukin-21 production(GO:0032625) interleukin-21 secretion(GO:0072619) |
| 0.0 | 0.1 | GO:0010513 | positive regulation of phosphatidylinositol biosynthetic process(GO:0010513) |
| 0.0 | 0.5 | GO:0043922 | negative regulation by host of viral transcription(GO:0043922) |
| 0.0 | 0.2 | GO:0097338 | response to clozapine(GO:0097338) |
| 0.0 | 0.3 | GO:0001542 | ovulation from ovarian follicle(GO:0001542) |
| 0.0 | 0.1 | GO:0016554 | cytidine to uridine editing(GO:0016554) |
Gene overrepresentation in cellular component category:
| Log-likelihood per target | Total log-likelihood | Term | Description |
|---|---|---|---|
| 0.1 | 0.4 | GO:0097543 | ciliary inversin compartment(GO:0097543) |
| 0.0 | 0.5 | GO:0042567 | insulin-like growth factor ternary complex(GO:0042567) |
| 0.0 | 0.1 | GO:0030895 | apolipoprotein B mRNA editing enzyme complex(GO:0030895) |
| 0.0 | 0.5 | GO:0031209 | SCAR complex(GO:0031209) |
| 0.0 | 0.2 | GO:0034673 | inhibin-betaglycan-ActRII complex(GO:0034673) |
Gene overrepresentation in molecular function category:
| Log-likelihood per target | Total log-likelihood | Term | Description |
|---|---|---|---|
| 0.1 | 0.4 | GO:0097689 | iron channel activity(GO:0097689) |
| 0.1 | 0.5 | GO:0003938 | IMP dehydrogenase activity(GO:0003938) |
| 0.1 | 0.4 | GO:0070224 | sulfide:quinone oxidoreductase activity(GO:0070224) |
| 0.1 | 0.5 | GO:0035473 | lipase binding(GO:0035473) |
| 0.0 | 0.1 | GO:0017159 | pantetheine hydrolase activity(GO:0017159) |
| 0.0 | 0.4 | GO:0031995 | insulin-like growth factor II binding(GO:0031995) |
| 0.0 | 0.2 | GO:0005157 | macrophage colony-stimulating factor receptor binding(GO:0005157) |
| 0.0 | 0.2 | GO:0004322 | ferroxidase activity(GO:0004322) oxidoreductase activity, oxidizing metal ions, oxygen as acceptor(GO:0016724) |
| 0.0 | 0.2 | GO:0034711 | inhibin binding(GO:0034711) BMP receptor activity(GO:0098821) |
| 0.0 | 0.1 | GO:0003828 | alpha-N-acetylneuraminate alpha-2,8-sialyltransferase activity(GO:0003828) |
| 0.0 | 0.1 | GO:0032422 | purine-rich negative regulatory element binding(GO:0032422) |
| 0.0 | 0.2 | GO:0004415 | hyalurononglucosaminidase activity(GO:0004415) |
| 0.0 | 0.1 | GO:0043208 | glycosphingolipid binding(GO:0043208) |
| 0.0 | 0.1 | GO:0051378 | amine binding(GO:0043176) serotonin binding(GO:0051378) |
Gene overrepresentation in curated gene sets: REACTOME pathways category:
| Log-likelihood per target | Total log-likelihood | Term | Description |
|---|---|---|---|
| 0.0 | 0.5 | REACTOME PURINE RIBONUCLEOSIDE MONOPHOSPHATE BIOSYNTHESIS | Genes involved in Purine ribonucleoside monophosphate biosynthesis |
| 0.0 | 0.4 | REACTOME REGULATION OF INSULIN LIKE GROWTH FACTOR IGF ACTIVITY BY INSULIN LIKE GROWTH FACTOR BINDING PROTEINS IGFBPS | Genes involved in Regulation of Insulin-like Growth Factor (IGF) Activity by Insulin-like Growth Factor Binding Proteins (IGFBPs) |
| 0.0 | 0.5 | REACTOME METAL ION SLC TRANSPORTERS | Genes involved in Metal ion SLC transporters |