| 0.6 |
1.9 |
GO:0044278 |
cell wall disruption in other organism(GO:0044278) |
| 0.5 |
1.6 |
GO:1902910 |
regulation of monophenol monooxygenase activity(GO:0032771) positive regulation of monophenol monooxygenase activity(GO:0032773) negative regulation of catagen(GO:0051796) regulation of hair cycle by canonical Wnt signaling pathway(GO:0060901) positive regulation of melanosome transport(GO:1902910) |
| 0.5 |
1.5 |
GO:1902948 |
regulation of choline O-acetyltransferase activity(GO:1902769) positive regulation of choline O-acetyltransferase activity(GO:1902771) negative regulation of tau-protein kinase activity(GO:1902948) positive regulation of early endosome to recycling endosome transport(GO:1902955) negative regulation of aspartic-type endopeptidase activity involved in amyloid precursor protein catabolic process(GO:1902960) negative regulation of neurofibrillary tangle assembly(GO:1902997) negative regulation of aspartic-type peptidase activity(GO:1905246) |
| 0.5 |
1.5 |
GO:0045897 |
positive regulation of transcription during mitosis(GO:0045897) |
| 0.5 |
1.5 |
GO:1904397 |
positive regulation of skeletal muscle acetylcholine-gated channel clustering(GO:1904395) negative regulation of neuromuscular junction development(GO:1904397) |
| 0.5 |
1.4 |
GO:0051598 |
meiotic recombination checkpoint(GO:0051598) |
| 0.4 |
1.2 |
GO:0001207 |
histone displacement(GO:0001207) positive regulation of transcription involved in meiotic cell cycle(GO:0051039) |
| 0.4 |
1.6 |
GO:1900111 |
positive regulation of histone H3-K9 dimethylation(GO:1900111) |
| 0.4 |
1.2 |
GO:0061713 |
neural crest cell migration involved in heart formation(GO:0003147) anterior neural tube closure(GO:0061713) |
| 0.4 |
1.1 |
GO:0060722 |
spongiotrophoblast cell proliferation(GO:0060720) regulation of spongiotrophoblast cell proliferation(GO:0060721) cell proliferation involved in embryonic placenta development(GO:0060722) regulation of cell proliferation involved in embryonic placenta development(GO:0060723) |
| 0.3 |
1.4 |
GO:0000711 |
meiotic DNA repair synthesis(GO:0000711) |
| 0.3 |
1.0 |
GO:0071264 |
regulation of eIF2 alpha phosphorylation by amino acid starvation(GO:0060733) regulation of translational initiation in response to starvation(GO:0071262) positive regulation of translational initiation in response to starvation(GO:0071264) |
| 0.3 |
0.9 |
GO:0031508 |
pericentric heterochromatin assembly(GO:0031508) |
| 0.3 |
0.3 |
GO:0061290 |
cell-cell signaling involved in kidney development(GO:0060995) Wnt signaling pathway involved in kidney development(GO:0061289) canonical Wnt signaling pathway involved in metanephric kidney development(GO:0061290) cell-cell signaling involved in metanephros development(GO:0072204) |
| 0.3 |
1.2 |
GO:0070650 |
endoplasmic reticulum polarization(GO:0061163) actin filament bundle retrograde transport(GO:0061573) actin filament bundle distribution(GO:0070650) |
| 0.3 |
0.9 |
GO:2000118 |
regulation of sodium-dependent phosphate transport(GO:2000118) |
| 0.3 |
1.7 |
GO:0071163 |
DNA replication preinitiation complex assembly(GO:0071163) |
| 0.3 |
1.9 |
GO:0015015 |
heparan sulfate proteoglycan biosynthetic process, enzymatic modification(GO:0015015) |
| 0.3 |
0.8 |
GO:1903925 |
signal transduction involved in intra-S DNA damage checkpoint(GO:0072428) response to bisphenol A(GO:1903925) cellular response to bisphenol A(GO:1903926) |
| 0.3 |
1.1 |
GO:0019285 |
glycine betaine biosynthetic process from choline(GO:0019285) glycine betaine metabolic process(GO:0031455) glycine betaine biosynthetic process(GO:0031456) |
| 0.3 |
2.1 |
GO:1902996 |
regulation of neuronal signal transduction(GO:1902847) regulation of neurofibrillary tangle assembly(GO:1902996) positive regulation of neurofibrillary tangle assembly(GO:1902998) |
| 0.3 |
0.8 |
GO:1903937 |
response to acrylamide(GO:1903937) |
| 0.3 |
1.1 |
GO:0051097 |
negative regulation of helicase activity(GO:0051097) |
| 0.2 |
1.0 |
GO:0048560 |
establishment of anatomical structure orientation(GO:0048560) |
| 0.2 |
2.0 |
GO:0007412 |
axon target recognition(GO:0007412) |
| 0.2 |
3.1 |
GO:0045329 |
carnitine biosynthetic process(GO:0045329) |
| 0.2 |
0.9 |
GO:0045401 |
positive regulation of interleukin-3 production(GO:0032752) interleukin-3 biosynthetic process(GO:0042223) regulation of interleukin-3 biosynthetic process(GO:0045399) positive regulation of interleukin-3 biosynthetic process(GO:0045401) |
| 0.2 |
0.7 |
GO:0036292 |
DNA rewinding(GO:0036292) |
| 0.2 |
0.7 |
GO:0006097 |
glyoxylate cycle(GO:0006097) |
| 0.2 |
1.1 |
GO:1904172 |
regulation of bleb assembly(GO:1904170) positive regulation of bleb assembly(GO:1904172) |
| 0.2 |
0.7 |
GO:0017186 |
peptidyl-pyroglutamic acid biosynthetic process, using glutaminyl-peptide cyclotransferase(GO:0017186) |
| 0.2 |
1.1 |
GO:0051758 |
homologous chromosome movement towards spindle pole involved in homologous chromosome segregation(GO:0051758) |
| 0.2 |
0.9 |
GO:2000298 |
regulation of Rho-dependent protein serine/threonine kinase activity(GO:2000298) |
| 0.2 |
0.7 |
GO:0019287 |
isopentenyl diphosphate biosynthetic process, mevalonate pathway(GO:0019287) |
| 0.2 |
3.7 |
GO:0060287 |
epithelial cilium movement involved in determination of left/right asymmetry(GO:0060287) |
| 0.2 |
2.1 |
GO:0097338 |
response to clozapine(GO:0097338) |
| 0.2 |
0.6 |
GO:0036353 |
histone H2A-K119 monoubiquitination(GO:0036353) |
| 0.2 |
0.6 |
GO:0070256 |
negative regulation of circadian sleep/wake cycle, non-REM sleep(GO:0042323) negative regulation of mucus secretion(GO:0070256) |
| 0.2 |
0.6 |
GO:0030974 |
thiamine pyrophosphate transport(GO:0030974) |
| 0.2 |
0.8 |
GO:1902463 |
protein localization to cell leading edge(GO:1902463) |
| 0.2 |
0.6 |
GO:0006173 |
dADP biosynthetic process(GO:0006173) |
| 0.2 |
0.6 |
GO:0030505 |
inorganic diphosphate transport(GO:0030505) |
| 0.2 |
0.8 |
GO:0061357 |
positive regulation of Wnt protein secretion(GO:0061357) |
| 0.2 |
0.4 |
GO:0045836 |
positive regulation of meiotic nuclear division(GO:0045836) |
| 0.2 |
0.2 |
GO:0034721 |
histone H3-K4 demethylation, trimethyl-H3-K4-specific(GO:0034721) |
| 0.2 |
0.2 |
GO:1903487 |
regulation of lactation(GO:1903487) |
| 0.2 |
0.6 |
GO:0099551 |
synaptic signaling via neuropeptide(GO:0099538) trans-synaptic signaling by neuropeptide(GO:0099540) trans-synaptic signaling by neuropeptide, modulating synaptic transmission(GO:0099551) |
| 0.2 |
0.6 |
GO:0002304 |
gamma-delta intraepithelial T cell differentiation(GO:0002304) CD8-positive, gamma-delta intraepithelial T cell differentiation(GO:0002305) |
| 0.2 |
0.6 |
GO:0006667 |
sphinganine metabolic process(GO:0006667) |
| 0.2 |
1.1 |
GO:2001034 |
positive regulation of double-strand break repair via nonhomologous end joining(GO:2001034) |
| 0.2 |
5.7 |
GO:0006590 |
thyroid hormone generation(GO:0006590) |
| 0.2 |
0.5 |
GO:0070904 |
L-ascorbic acid transport(GO:0015882) transepithelial L-ascorbic acid transport(GO:0070904) |
| 0.2 |
3.5 |
GO:0034501 |
protein localization to kinetochore(GO:0034501) |
| 0.2 |
1.4 |
GO:0060455 |
negative regulation of gastric acid secretion(GO:0060455) |
| 0.2 |
0.5 |
GO:1904268 |
positive regulation of Schwann cell migration(GO:1900149) regulation of Schwann cell chemotaxis(GO:1904266) positive regulation of Schwann cell chemotaxis(GO:1904268) Schwann cell chemotaxis(GO:1990751) |
| 0.2 |
2.4 |
GO:1902572 |
negative regulation of serine-type endopeptidase activity(GO:1900004) negative regulation of serine-type peptidase activity(GO:1902572) |
| 0.2 |
0.5 |
GO:0051877 |
pigment granule aggregation in cell center(GO:0051877) |
| 0.2 |
0.5 |
GO:1903989 |
regulation of antigen processing and presentation of peptide antigen via MHC class I(GO:0002589) negative regulation of antigen processing and presentation of peptide antigen via MHC class I(GO:0002590) positive regulation of iron ion transport(GO:0034758) positive regulation of iron ion transmembrane transport(GO:0034761) regulation of iron ion import(GO:1900390) regulation of ferrous iron import into cell(GO:1903989) positive regulation of ferrous iron import into cell(GO:1903991) regulation of ferrous iron binding(GO:1904432) positive regulation of ferrous iron binding(GO:1904434) regulation of transferrin receptor binding(GO:1904435) positive regulation of transferrin receptor binding(GO:1904437) regulation of ferrous iron import across plasma membrane(GO:1904438) positive regulation of ferrous iron import across plasma membrane(GO:1904440) |
| 0.2 |
1.1 |
GO:0021914 |
negative regulation of smoothened signaling pathway involved in ventral spinal cord patterning(GO:0021914) |
| 0.2 |
0.5 |
GO:0006579 |
amino-acid betaine catabolic process(GO:0006579) |
| 0.2 |
1.2 |
GO:0051684 |
maintenance of Golgi location(GO:0051684) |
| 0.2 |
1.9 |
GO:0030951 |
establishment or maintenance of microtubule cytoskeleton polarity(GO:0030951) |
| 0.2 |
2.3 |
GO:0007288 |
sperm axoneme assembly(GO:0007288) |
| 0.2 |
0.5 |
GO:0060032 |
notochord regression(GO:0060032) |
| 0.2 |
0.5 |
GO:0046707 |
IDP metabolic process(GO:0046707) IDP catabolic process(GO:0046709) |
| 0.1 |
0.6 |
GO:1904977 |
lymphatic endothelial cell migration(GO:1904977) |
| 0.1 |
0.4 |
GO:1904158 |
axonemal central apparatus assembly(GO:1904158) |
| 0.1 |
1.5 |
GO:0019276 |
UDP-N-acetylgalactosamine metabolic process(GO:0019276) |
| 0.1 |
0.1 |
GO:1904884 |
telomerase catalytic core complex assembly(GO:1904868) regulation of telomerase catalytic core complex assembly(GO:1904882) positive regulation of telomerase catalytic core complex assembly(GO:1904884) |
| 0.1 |
0.4 |
GO:0070634 |
transepithelial ammonium transport(GO:0070634) |
| 0.1 |
0.4 |
GO:0035928 |
rRNA import into mitochondrion(GO:0035928) |
| 0.1 |
0.6 |
GO:0044837 |
assembly of actomyosin apparatus involved in cytokinesis(GO:0000912) actomyosin contractile ring assembly(GO:0000915) actomyosin contractile ring organization(GO:0044837) |
| 0.1 |
2.4 |
GO:0048069 |
eye pigmentation(GO:0048069) |
| 0.1 |
0.6 |
GO:0018364 |
peptidyl-glutamine methylation(GO:0018364) |
| 0.1 |
0.4 |
GO:0042144 |
vacuole fusion, non-autophagic(GO:0042144) |
| 0.1 |
1.9 |
GO:0007135 |
meiosis II(GO:0007135) |
| 0.1 |
0.5 |
GO:0097012 |
cellular response to granulocyte macrophage colony-stimulating factor stimulus(GO:0097011) response to granulocyte macrophage colony-stimulating factor(GO:0097012) |
| 0.1 |
1.0 |
GO:0044210 |
'de novo' CTP biosynthetic process(GO:0044210) |
| 0.1 |
0.4 |
GO:0070662 |
erythropoietin-mediated signaling pathway(GO:0038162) mast cell proliferation(GO:0070662) |
| 0.1 |
0.4 |
GO:1902598 |
creatine transport(GO:0015881) creatine transmembrane transport(GO:1902598) |
| 0.1 |
0.4 |
GO:0019303 |
D-ribose catabolic process(GO:0019303) |
| 0.1 |
2.9 |
GO:0034587 |
piRNA metabolic process(GO:0034587) |
| 0.1 |
1.2 |
GO:0018103 |
protein C-linked glycosylation(GO:0018103) peptidyl-tryptophan modification(GO:0018211) protein C-linked glycosylation via tryptophan(GO:0018317) protein C-linked glycosylation via 2'-alpha-mannosyl-L-tryptophan(GO:0018406) |
| 0.1 |
0.4 |
GO:2000439 |
positive regulation of monocyte extravasation(GO:2000439) |
| 0.1 |
0.7 |
GO:1902019 |
regulation of cilium movement involved in cell motility(GO:0060295) regulation of cilium beat frequency involved in ciliary motility(GO:0060296) regulation of cilium-dependent cell motility(GO:1902019) |
| 0.1 |
0.4 |
GO:1903774 |
positive regulation of viral budding via host ESCRT complex(GO:1903774) |
| 0.1 |
1.4 |
GO:0070163 |
adiponectin secretion(GO:0070162) regulation of adiponectin secretion(GO:0070163) |
| 0.1 |
0.5 |
GO:0006556 |
S-adenosylmethionine biosynthetic process(GO:0006556) |
| 0.1 |
0.8 |
GO:0090234 |
regulation of kinetochore assembly(GO:0090234) |
| 0.1 |
0.6 |
GO:1905224 |
clathrin-coated pit assembly(GO:1905224) |
| 0.1 |
0.5 |
GO:0098971 |
anterograde dendritic transport of neurotransmitter receptor complex(GO:0098971) |
| 0.1 |
0.8 |
GO:1903588 |
negative regulation of blood vessel endothelial cell proliferation involved in sprouting angiogenesis(GO:1903588) |
| 0.1 |
0.5 |
GO:0003290 |
atrial septum secundum morphogenesis(GO:0003290) embryonic heart tube anterior/posterior pattern specification(GO:0035054) |
| 0.1 |
0.6 |
GO:1901254 |
modulation by host of viral RNA genome replication(GO:0044830) positive regulation of intracellular transport of viral material(GO:1901254) |
| 0.1 |
0.9 |
GO:1903751 |
regulation of intrinsic apoptotic signaling pathway in response to hydrogen peroxide(GO:1903750) negative regulation of intrinsic apoptotic signaling pathway in response to hydrogen peroxide(GO:1903751) |
| 0.1 |
0.5 |
GO:2000681 |
negative regulation of rubidium ion transport(GO:2000681) negative regulation of rubidium ion transmembrane transporter activity(GO:2000687) |
| 0.1 |
1.1 |
GO:0007506 |
gonadal mesoderm development(GO:0007506) |
| 0.1 |
1.3 |
GO:0018095 |
protein polyglutamylation(GO:0018095) |
| 0.1 |
0.4 |
GO:0061485 |
memory T cell proliferation(GO:0061485) |
| 0.1 |
0.7 |
GO:2000234 |
positive regulation of ribosome biogenesis(GO:0090070) positive regulation of rRNA processing(GO:2000234) |
| 0.1 |
0.4 |
GO:0060003 |
copper ion export(GO:0060003) |
| 0.1 |
0.4 |
GO:0036510 |
trimming of terminal mannose on C branch(GO:0036510) |
| 0.1 |
0.4 |
GO:0098928 |
presynaptic signal transduction(GO:0098928) presynapse to nucleus signaling pathway(GO:0099526) |
| 0.1 |
0.4 |
GO:0098507 |
polynucleotide 5' dephosphorylation(GO:0098507) |
| 0.1 |
0.9 |
GO:0044245 |
polysaccharide digestion(GO:0044245) |
| 0.1 |
0.5 |
GO:1902524 |
positive regulation of protein K48-linked ubiquitination(GO:1902524) |
| 0.1 |
1.4 |
GO:0016554 |
cytidine to uridine editing(GO:0016554) |
| 0.1 |
0.5 |
GO:0061347 |
chemoattraction of serotonergic neuron axon(GO:0036517) planar cell polarity pathway involved in outflow tract morphogenesis(GO:0061347) planar cell polarity pathway involved in ventricular septum morphogenesis(GO:0061348) planar cell polarity pathway involved in cardiac right atrium morphogenesis(GO:0061349) planar cell polarity pathway involved in cardiac muscle tissue morphogenesis(GO:0061350) planar cell polarity pathway involved in pericardium morphogenesis(GO:0061354) chemoattraction of axon(GO:0061642) negative regulation of cell proliferation in midbrain(GO:1904934) planar cell polarity pathway involved in midbrain dopaminergic neuron differentiation(GO:1904955) |
| 0.1 |
0.6 |
GO:0046167 |
glycerol-3-phosphate biosynthetic process(GO:0046167) |
| 0.1 |
0.4 |
GO:0070370 |
heat acclimation(GO:0010286) cellular heat acclimation(GO:0070370) |
| 0.1 |
0.1 |
GO:1901873 |
regulation of post-translational protein modification(GO:1901873) |
| 0.1 |
0.4 |
GO:1904844 |
response to L-glutamine(GO:1904844) cellular response to L-glutamine(GO:1904845) |
| 0.1 |
0.5 |
GO:0008627 |
intrinsic apoptotic signaling pathway in response to osmotic stress(GO:0008627) |
| 0.1 |
0.4 |
GO:0019417 |
sulfur oxidation(GO:0019417) |
| 0.1 |
2.3 |
GO:0061302 |
smooth muscle cell-matrix adhesion(GO:0061302) |
| 0.1 |
0.9 |
GO:0097500 |
receptor localization to nonmotile primary cilium(GO:0097500) |
| 0.1 |
0.2 |
GO:0042138 |
meiotic DNA double-strand break formation(GO:0042138) |
| 0.1 |
0.3 |
GO:2000584 |
regulation of platelet-derived growth factor receptor-alpha signaling pathway(GO:2000583) negative regulation of platelet-derived growth factor receptor-alpha signaling pathway(GO:2000584) |
| 0.1 |
0.8 |
GO:0010726 |
positive regulation of hydrogen peroxide metabolic process(GO:0010726) |
| 0.1 |
0.5 |
GO:1990834 |
response to odorant(GO:1990834) |
| 0.1 |
1.1 |
GO:0060244 |
negative regulation of cell proliferation involved in contact inhibition(GO:0060244) |
| 0.1 |
0.3 |
GO:0000354 |
cis assembly of pre-catalytic spliceosome(GO:0000354) |
| 0.1 |
0.3 |
GO:0035526 |
retrograde transport, plasma membrane to Golgi(GO:0035526) |
| 0.1 |
0.4 |
GO:0035720 |
intraciliary anterograde transport(GO:0035720) |
| 0.1 |
0.2 |
GO:0036518 |
chemorepulsion of dopaminergic neuron axon(GO:0036518) |
| 0.1 |
0.2 |
GO:1902595 |
regulation of DNA replication origin binding(GO:1902595) |
| 0.1 |
2.2 |
GO:0000712 |
resolution of meiotic recombination intermediates(GO:0000712) |
| 0.1 |
1.2 |
GO:0006235 |
dTTP biosynthetic process(GO:0006235) pyrimidine deoxyribonucleoside triphosphate biosynthetic process(GO:0009212) |
| 0.1 |
0.3 |
GO:0046601 |
positive regulation of centriole replication(GO:0046601) |
| 0.1 |
0.4 |
GO:1902953 |
positive regulation of ER to Golgi vesicle-mediated transport(GO:1902953) |
| 0.1 |
0.3 |
GO:2000525 |
regulation of T cell costimulation(GO:2000523) positive regulation of T cell costimulation(GO:2000525) |
| 0.1 |
0.3 |
GO:0008057 |
eye pigment granule organization(GO:0008057) |
| 0.1 |
0.3 |
GO:0002314 |
germinal center B cell differentiation(GO:0002314) |
| 0.1 |
0.4 |
GO:0001835 |
blastocyst hatching(GO:0001835) hatching(GO:0035188) organism emergence from protective structure(GO:0071684) |
| 0.1 |
0.4 |
GO:0039534 |
negative regulation of MDA-5 signaling pathway(GO:0039534) |
| 0.1 |
0.1 |
GO:0043006 |
activation of phospholipase A2 activity by calcium-mediated signaling(GO:0043006) |
| 0.1 |
0.7 |
GO:0060087 |
relaxation of vascular smooth muscle(GO:0060087) |
| 0.1 |
0.4 |
GO:0006663 |
platelet activating factor biosynthetic process(GO:0006663) |
| 0.1 |
0.3 |
GO:0051066 |
dihydrobiopterin metabolic process(GO:0051066) |
| 0.1 |
0.5 |
GO:0043375 |
negative regulation of cellular pH reduction(GO:0032848) CD8-positive, alpha-beta T cell lineage commitment(GO:0043375) negative regulation of retinal cell programmed cell death(GO:0046671) |
| 0.1 |
0.7 |
GO:1903899 |
positive regulation of PERK-mediated unfolded protein response(GO:1903899) |
| 0.1 |
0.5 |
GO:0034414 |
tRNA 3'-trailer cleavage, endonucleolytic(GO:0034414) tRNA 3'-trailer cleavage(GO:0042779) |
| 0.1 |
2.2 |
GO:0019800 |
peptide cross-linking via chondroitin 4-sulfate glycosaminoglycan(GO:0019800) |
| 0.1 |
0.3 |
GO:0033499 |
galactose catabolic process via UDP-galactose(GO:0033499) |
| 0.1 |
3.4 |
GO:1901687 |
glutathione derivative metabolic process(GO:1901685) glutathione derivative biosynthetic process(GO:1901687) |
| 0.1 |
0.1 |
GO:0009146 |
purine nucleoside triphosphate catabolic process(GO:0009146) |
| 0.1 |
0.8 |
GO:0072092 |
ureteric bud invasion(GO:0072092) |
| 0.1 |
0.5 |
GO:2000325 |
regulation of ligand-dependent nuclear receptor transcription coactivator activity(GO:2000325) positive regulation of ligand-dependent nuclear receptor transcription coactivator activity(GO:2000327) |
| 0.1 |
0.5 |
GO:1904566 |
response to 1-oleoyl-sn-glycerol 3-phosphate(GO:1904565) cellular response to 1-oleoyl-sn-glycerol 3-phosphate(GO:1904566) |
| 0.1 |
4.0 |
GO:0031055 |
chromatin remodeling at centromere(GO:0031055) CENP-A containing nucleosome assembly(GO:0034080) CENP-A containing chromatin organization(GO:0061641) |
| 0.1 |
0.5 |
GO:0033512 |
L-lysine catabolic process to acetyl-CoA via saccharopine(GO:0033512) |
| 0.1 |
2.2 |
GO:0021796 |
cerebral cortex regionalization(GO:0021796) |
| 0.1 |
0.7 |
GO:1903237 |
negative regulation of leukocyte tethering or rolling(GO:1903237) |
| 0.1 |
0.8 |
GO:0018243 |
protein O-linked glycosylation via threonine(GO:0018243) |
| 0.1 |
0.5 |
GO:0000415 |
negative regulation of histone H3-K36 methylation(GO:0000415) |
| 0.1 |
0.6 |
GO:0035093 |
spermatogenesis, exchange of chromosomal proteins(GO:0035093) |
| 0.1 |
0.3 |
GO:0036111 |
very long-chain fatty-acyl-CoA metabolic process(GO:0036111) |
| 0.1 |
0.3 |
GO:0051083 |
'de novo' cotranslational protein folding(GO:0051083) |
| 0.1 |
0.8 |
GO:0046604 |
positive regulation of mitotic centrosome separation(GO:0046604) |
| 0.1 |
0.4 |
GO:1904491 |
protein localization to ciliary transition zone(GO:1904491) |
| 0.1 |
1.0 |
GO:0010739 |
positive regulation of protein kinase A signaling(GO:0010739) |
| 0.1 |
0.6 |
GO:0006543 |
glutamine catabolic process(GO:0006543) |
| 0.1 |
0.2 |
GO:0035790 |
platelet-derived growth factor receptor-alpha signaling pathway(GO:0035790) |
| 0.1 |
0.3 |
GO:0002121 |
inter-male aggressive behavior(GO:0002121) |
| 0.1 |
0.6 |
GO:0032252 |
secretory granule localization(GO:0032252) |
| 0.1 |
0.3 |
GO:0002880 |
chronic inflammatory response to non-antigenic stimulus(GO:0002545) regulation of chronic inflammatory response to non-antigenic stimulus(GO:0002880) negative regulation of chronic inflammatory response to non-antigenic stimulus(GO:0002881) |
| 0.1 |
0.1 |
GO:2000232 |
regulation of rRNA processing(GO:2000232) |
| 0.1 |
0.3 |
GO:2000798 |
amniotic stem cell differentiation(GO:0097086) negative regulation of dense core granule biogenesis(GO:2000706) negative regulation of mesenchymal stem cell differentiation(GO:2000740) regulation of amniotic stem cell differentiation(GO:2000797) negative regulation of amniotic stem cell differentiation(GO:2000798) |
| 0.1 |
1.0 |
GO:2000664 |
positive regulation of interleukin-5 secretion(GO:2000664) |
| 0.1 |
0.3 |
GO:0051695 |
actin filament uncapping(GO:0051695) |
| 0.1 |
0.9 |
GO:0050882 |
voluntary musculoskeletal movement(GO:0050882) |
| 0.1 |
0.3 |
GO:0040040 |
thermosensory behavior(GO:0040040) |
| 0.1 |
0.3 |
GO:0072720 |
response to dithiothreitol(GO:0072720) |
| 0.1 |
0.3 |
GO:0019521 |
aldonic acid metabolic process(GO:0019520) D-gluconate metabolic process(GO:0019521) |
| 0.1 |
0.5 |
GO:0046340 |
diacylglycerol catabolic process(GO:0046340) |
| 0.1 |
0.3 |
GO:0006533 |
aspartate catabolic process(GO:0006533) |
| 0.1 |
0.5 |
GO:0010387 |
COP9 signalosome assembly(GO:0010387) |
| 0.1 |
0.3 |
GO:1903061 |
positive regulation of protein lipidation(GO:1903061) |
| 0.1 |
2.4 |
GO:0007342 |
fusion of sperm to egg plasma membrane(GO:0007342) |
| 0.1 |
0.3 |
GO:0043490 |
malate-aspartate shuttle(GO:0043490) |
| 0.1 |
1.3 |
GO:0000972 |
transcription-dependent tethering of RNA polymerase II gene DNA at nuclear periphery(GO:0000972) |
| 0.1 |
1.2 |
GO:0007028 |
cytoplasm organization(GO:0007028) |
| 0.1 |
0.2 |
GO:0070145 |
mitochondrial asparaginyl-tRNA aminoacylation(GO:0070145) |
| 0.1 |
1.6 |
GO:0090179 |
planar cell polarity pathway involved in neural tube closure(GO:0090179) |
| 0.1 |
0.5 |
GO:0034670 |
chemotaxis to arachidonic acid(GO:0034670) response to arachidonic acid(GO:1904550) |
| 0.1 |
0.3 |
GO:1903232 |
melanosome assembly(GO:1903232) |
| 0.1 |
1.0 |
GO:0033314 |
mitotic DNA replication checkpoint(GO:0033314) |
| 0.1 |
0.2 |
GO:0000412 |
histone peptidyl-prolyl isomerization(GO:0000412) |
| 0.1 |
0.2 |
GO:0048058 |
compound eye corneal lens development(GO:0048058) |
| 0.1 |
1.0 |
GO:0006662 |
glycerol ether metabolic process(GO:0006662) |
| 0.1 |
1.0 |
GO:0007258 |
JUN phosphorylation(GO:0007258) |
| 0.1 |
0.2 |
GO:2001037 |
tongue muscle cell differentiation(GO:0035981) positive regulation of skeletal muscle fiber differentiation(GO:1902811) regulation of tongue muscle cell differentiation(GO:2001035) positive regulation of tongue muscle cell differentiation(GO:2001037) |
| 0.1 |
0.2 |
GO:0044205 |
'de novo' UMP biosynthetic process(GO:0044205) |
| 0.1 |
1.1 |
GO:0051256 |
mitotic spindle midzone assembly(GO:0051256) |
| 0.1 |
0.8 |
GO:0008063 |
Toll signaling pathway(GO:0008063) |
| 0.1 |
0.5 |
GO:0021993 |
initiation of neural tube closure(GO:0021993) |
| 0.1 |
0.3 |
GO:0001545 |
primary ovarian follicle growth(GO:0001545) |
| 0.1 |
0.3 |
GO:0038194 |
thyroid-stimulating hormone signaling pathway(GO:0038194) |
| 0.1 |
0.7 |
GO:0042262 |
DNA protection(GO:0042262) |
| 0.1 |
0.2 |
GO:0006864 |
pyrimidine nucleotide transport(GO:0006864) mitochondrial pyrimidine nucleotide import(GO:1990519) |
| 0.1 |
0.8 |
GO:0070995 |
NADPH oxidation(GO:0070995) |
| 0.1 |
2.2 |
GO:0044458 |
motile cilium assembly(GO:0044458) |
| 0.1 |
1.4 |
GO:0006878 |
cellular copper ion homeostasis(GO:0006878) |
| 0.1 |
0.5 |
GO:0032487 |
regulation of Rap protein signal transduction(GO:0032487) |
| 0.1 |
0.4 |
GO:0042091 |
interleukin-10 biosynthetic process(GO:0042091) regulation of interleukin-10 biosynthetic process(GO:0045074) |
| 0.1 |
0.1 |
GO:0071373 |
cellular response to luteinizing hormone stimulus(GO:0071373) |
| 0.1 |
0.3 |
GO:0072233 |
thick ascending limb development(GO:0072023) metanephric thick ascending limb development(GO:0072233) |
| 0.1 |
0.3 |
GO:1904381 |
Golgi apparatus mannose trimming(GO:1904381) |
| 0.1 |
0.5 |
GO:0016139 |
glycoside catabolic process(GO:0016139) |
| 0.1 |
0.4 |
GO:0098746 |
fast, calcium ion-dependent exocytosis of neurotransmitter(GO:0098746) |
| 0.1 |
1.0 |
GO:0036158 |
outer dynein arm assembly(GO:0036158) |
| 0.1 |
0.9 |
GO:0098887 |
neurotransmitter receptor transport, endosome to postsynaptic membrane(GO:0098887) neurotransmitter receptor transport, endosome to plasma membrane(GO:0099639) |
| 0.1 |
0.5 |
GO:1904304 |
regulation of gastro-intestinal system smooth muscle contraction(GO:1904304) positive regulation of gastro-intestinal system smooth muscle contraction(GO:1904306) |
| 0.1 |
0.6 |
GO:0071386 |
cellular response to corticosterone stimulus(GO:0071386) |
| 0.1 |
0.6 |
GO:0071109 |
superior temporal gyrus development(GO:0071109) |
| 0.1 |
0.6 |
GO:0061343 |
cell adhesion involved in heart morphogenesis(GO:0061343) |
| 0.1 |
0.3 |
GO:0071422 |
succinate transport(GO:0015744) succinate transmembrane transport(GO:0071422) |
| 0.1 |
0.5 |
GO:1903288 |
positive regulation of potassium ion import(GO:1903288) |
| 0.1 |
1.2 |
GO:1903504 |
regulation of mitotic cell cycle spindle assembly checkpoint(GO:0090266) regulation of mitotic spindle checkpoint(GO:1903504) |
| 0.1 |
0.8 |
GO:2000582 |
regulation of ATP-dependent microtubule motor activity, plus-end-directed(GO:2000580) positive regulation of ATP-dependent microtubule motor activity, plus-end-directed(GO:2000582) |
| 0.1 |
0.2 |
GO:0060830 |
ciliary receptor clustering involved in smoothened signaling pathway(GO:0060830) |
| 0.1 |
0.2 |
GO:0035803 |
egg coat formation(GO:0035803) |
| 0.1 |
0.2 |
GO:0046452 |
dihydrofolate metabolic process(GO:0046452) |
| 0.1 |
0.6 |
GO:0046070 |
dGTP metabolic process(GO:0046070) |
| 0.1 |
1.7 |
GO:0046069 |
cGMP catabolic process(GO:0046069) |
| 0.1 |
0.9 |
GO:0042989 |
sequestering of actin monomers(GO:0042989) |
| 0.1 |
0.2 |
GO:0070236 |
negative regulation of activation-induced cell death of T cells(GO:0070236) |
| 0.1 |
0.7 |
GO:0051383 |
kinetochore organization(GO:0051383) |
| 0.1 |
0.9 |
GO:0035457 |
cellular response to interferon-alpha(GO:0035457) |
| 0.1 |
0.1 |
GO:0035668 |
TRAM-dependent toll-like receptor signaling pathway(GO:0035668) TRAM-dependent toll-like receptor 4 signaling pathway(GO:0035669) |
| 0.1 |
0.2 |
GO:0045578 |
negative regulation of B cell differentiation(GO:0045578) positive regulation of ovulation(GO:0060279) |
| 0.1 |
0.3 |
GO:1902774 |
late endosome to lysosome transport(GO:1902774) |
| 0.1 |
0.4 |
GO:0003051 |
angiotensin-mediated drinking behavior(GO:0003051) |
| 0.1 |
0.2 |
GO:0045175 |
basal protein localization(GO:0045175) |
| 0.1 |
0.2 |
GO:0033140 |
negative regulation of peptidyl-serine phosphorylation of STAT protein(GO:0033140) |
| 0.1 |
0.9 |
GO:0055059 |
asymmetric neuroblast division(GO:0055059) |
| 0.1 |
0.2 |
GO:0045041 |
B cell cytokine production(GO:0002368) protein import into mitochondrial intermembrane space(GO:0045041) |
| 0.1 |
0.3 |
GO:0007089 |
traversing start control point of mitotic cell cycle(GO:0007089) |
| 0.1 |
0.3 |
GO:0010513 |
positive regulation of phosphatidylinositol biosynthetic process(GO:0010513) |
| 0.1 |
0.5 |
GO:0070495 |
regulation of thrombin receptor signaling pathway(GO:0070494) negative regulation of thrombin receptor signaling pathway(GO:0070495) |
| 0.1 |
0.3 |
GO:1904100 |
regulation of protein O-linked glycosylation(GO:1904098) positive regulation of protein O-linked glycosylation(GO:1904100) |
| 0.1 |
0.8 |
GO:0048386 |
positive regulation of retinoic acid receptor signaling pathway(GO:0048386) |
| 0.1 |
0.3 |
GO:0033591 |
response to L-ascorbic acid(GO:0033591) |
| 0.1 |
0.3 |
GO:1903445 |
intermembrane transport(GO:0046909) protein transport from ciliary membrane to plasma membrane(GO:1903445) |
| 0.1 |
0.8 |
GO:0042985 |
negative regulation of amyloid precursor protein biosynthetic process(GO:0042985) |
| 0.1 |
0.5 |
GO:0019918 |
peptidyl-arginine methylation, to symmetrical-dimethyl arginine(GO:0019918) |
| 0.1 |
0.5 |
GO:0046726 |
positive regulation by virus of viral protein levels in host cell(GO:0046726) |
| 0.1 |
0.2 |
GO:0090177 |
establishment of planar polarity involved in neural tube closure(GO:0090177) |
| 0.1 |
0.3 |
GO:2000847 |
negative regulation of steroid hormone secretion(GO:2000832) negative regulation of corticosteroid hormone secretion(GO:2000847) negative regulation of glucocorticoid secretion(GO:2000850) |
| 0.1 |
0.3 |
GO:0019805 |
quinolinate biosynthetic process(GO:0019805) |
| 0.1 |
0.6 |
GO:0030242 |
pexophagy(GO:0030242) |
| 0.1 |
0.4 |
GO:1902969 |
mitotic DNA replication(GO:1902969) |
| 0.1 |
0.3 |
GO:0048388 |
endosomal lumen acidification(GO:0048388) |
| 0.1 |
0.5 |
GO:0046952 |
ketone body catabolic process(GO:0046952) |
| 0.1 |
0.6 |
GO:0031860 |
telomeric 3' overhang formation(GO:0031860) |
| 0.1 |
1.2 |
GO:0047484 |
regulation of response to osmotic stress(GO:0047484) |
| 0.1 |
0.1 |
GO:0060903 |
positive regulation of meiosis I(GO:0060903) |
| 0.1 |
0.8 |
GO:0060992 |
response to fungicide(GO:0060992) |
| 0.1 |
0.2 |
GO:0016267 |
O-glycan processing, core 1(GO:0016267) |
| 0.1 |
0.3 |
GO:0014886 |
transition between slow and fast fiber(GO:0014886) |
| 0.1 |
0.2 |
GO:0035281 |
pre-miRNA export from nucleus(GO:0035281) |
| 0.1 |
0.4 |
GO:0002322 |
B cell proliferation involved in immune response(GO:0002322) |
| 0.1 |
0.9 |
GO:0070257 |
positive regulation of mucus secretion(GO:0070257) |
| 0.1 |
0.8 |
GO:0014052 |
regulation of gamma-aminobutyric acid secretion(GO:0014052) |
| 0.1 |
0.4 |
GO:0070305 |
response to cGMP(GO:0070305) |
| 0.1 |
0.1 |
GO:1904338 |
regulation of dopaminergic neuron differentiation(GO:1904338) |
| 0.1 |
0.7 |
GO:0042428 |
serotonin metabolic process(GO:0042428) |
| 0.1 |
0.1 |
GO:0007100 |
mitotic centrosome separation(GO:0007100) |
| 0.1 |
0.6 |
GO:0035865 |
cellular response to potassium ion(GO:0035865) |
| 0.1 |
0.7 |
GO:0046600 |
negative regulation of centriole replication(GO:0046600) |
| 0.1 |
0.2 |
GO:0055118 |
negative regulation of cardiac muscle contraction(GO:0055118) |
| 0.1 |
0.4 |
GO:0071896 |
protein localization to adherens junction(GO:0071896) |
| 0.1 |
0.4 |
GO:0060800 |
regulation of cell differentiation involved in embryonic placenta development(GO:0060800) |
| 0.1 |
0.7 |
GO:0070863 |
positive regulation of protein exit from endoplasmic reticulum(GO:0070863) |
| 0.1 |
1.2 |
GO:1904776 |
regulation of protein localization to cell cortex(GO:1904776) positive regulation of protein localization to cell cortex(GO:1904778) |
| 0.1 |
0.2 |
GO:1903004 |
regulation of protein K63-linked deubiquitination(GO:1903004) positive regulation of protein K63-linked deubiquitination(GO:1903006) |
| 0.1 |
0.4 |
GO:0033594 |
response to hydroxyisoflavone(GO:0033594) |
| 0.1 |
0.9 |
GO:0016998 |
cell wall macromolecule catabolic process(GO:0016998) |
| 0.1 |
0.8 |
GO:0060020 |
Bergmann glial cell differentiation(GO:0060020) |
| 0.1 |
1.3 |
GO:0032785 |
negative regulation of DNA-templated transcription, elongation(GO:0032785) |
| 0.1 |
0.2 |
GO:0009631 |
cold acclimation(GO:0009631) |
| 0.1 |
0.2 |
GO:0031247 |
actin rod assembly(GO:0031247) |
| 0.1 |
0.9 |
GO:0046520 |
sphingoid biosynthetic process(GO:0046520) |
| 0.1 |
0.5 |
GO:0051791 |
medium-chain fatty acid metabolic process(GO:0051791) |
| 0.1 |
0.2 |
GO:0002636 |
positive regulation of germinal center formation(GO:0002636) |
| 0.1 |
0.5 |
GO:0048165 |
ovarian cumulus expansion(GO:0001550) fused antrum stage(GO:0048165) negative regulation of chondrocyte proliferation(GO:1902731) |
| 0.1 |
0.9 |
GO:2000001 |
regulation of DNA damage checkpoint(GO:2000001) |
| 0.1 |
0.2 |
GO:0034552 |
respiratory chain complex II assembly(GO:0034552) mitochondrial respiratory chain complex II assembly(GO:0034553) mitochondrial respiratory chain complex II biogenesis(GO:0097032) |
| 0.1 |
1.0 |
GO:0046784 |
viral mRNA export from host cell nucleus(GO:0046784) |
| 0.1 |
1.2 |
GO:0014029 |
neural crest formation(GO:0014029) |
| 0.1 |
0.2 |
GO:0036451 |
cap mRNA methylation(GO:0036451) |
| 0.1 |
0.1 |
GO:1904204 |
regulation of skeletal muscle hypertrophy(GO:1904204) |
| 0.1 |
0.4 |
GO:0000707 |
meiotic DNA recombinase assembly(GO:0000707) |
| 0.1 |
0.2 |
GO:0019401 |
hexitol metabolic process(GO:0006059) alditol biosynthetic process(GO:0019401) |
| 0.1 |
0.9 |
GO:0031573 |
intra-S DNA damage checkpoint(GO:0031573) |
| 0.1 |
1.3 |
GO:0016254 |
preassembly of GPI anchor in ER membrane(GO:0016254) |
| 0.1 |
0.2 |
GO:0034130 |
toll-like receptor 1 signaling pathway(GO:0034130) |
| 0.1 |
0.2 |
GO:0007000 |
nucleolus organization(GO:0007000) |
| 0.1 |
0.5 |
GO:0007129 |
synapsis(GO:0007129) |
| 0.1 |
1.1 |
GO:0042340 |
keratan sulfate catabolic process(GO:0042340) |
| 0.1 |
0.4 |
GO:1900377 |
negative regulation of melanin biosynthetic process(GO:0048022) negative regulation of secondary metabolite biosynthetic process(GO:1900377) |
| 0.1 |
0.2 |
GO:0010808 |
positive regulation of synaptic vesicle priming(GO:0010808) |
| 0.1 |
0.4 |
GO:0003350 |
pulmonary myocardium development(GO:0003350) |
| 0.1 |
0.3 |
GO:0015692 |
lead ion transport(GO:0015692) copper ion transmembrane transport(GO:0035434) |
| 0.1 |
0.8 |
GO:0090235 |
regulation of metaphase plate congression(GO:0090235) |
| 0.1 |
0.2 |
GO:0036060 |
filtration diaphragm assembly(GO:0036058) slit diaphragm assembly(GO:0036060) |
| 0.1 |
0.2 |
GO:1903225 |
negative regulation of endodermal cell differentiation(GO:1903225) |
| 0.1 |
0.2 |
GO:0032229 |
negative regulation of glutamate secretion(GO:0014050) negative regulation of synaptic transmission, GABAergic(GO:0032229) |
| 0.1 |
0.6 |
GO:0051095 |
regulation of helicase activity(GO:0051095) positive regulation of helicase activity(GO:0051096) |
| 0.1 |
0.4 |
GO:0099590 |
neurotransmitter receptor internalization(GO:0099590) |
| 0.1 |
2.0 |
GO:0007080 |
mitotic metaphase plate congression(GO:0007080) |
| 0.1 |
1.5 |
GO:0019511 |
peptidyl-proline hydroxylation(GO:0019511) |
| 0.1 |
0.2 |
GO:0001831 |
trophectodermal cellular morphogenesis(GO:0001831) |
| 0.1 |
0.5 |
GO:0051725 |
protein de-ADP-ribosylation(GO:0051725) |
| 0.1 |
0.4 |
GO:0006269 |
DNA replication, synthesis of RNA primer(GO:0006269) |
| 0.1 |
0.3 |
GO:1904021 |
negative regulation of G-protein coupled receptor internalization(GO:1904021) |
| 0.1 |
0.2 |
GO:0016062 |
adaptation of rhodopsin mediated signaling(GO:0016062) light adaption(GO:0036367) |
| 0.1 |
0.2 |
GO:0033168 |
conversion of ds siRNA to ss siRNA involved in RNA interference(GO:0033168) conversion of ds siRNA to ss siRNA(GO:0036404) |
| 0.1 |
0.5 |
GO:0098881 |
exocytic insertion of neurotransmitter receptor to plasma membrane(GO:0098881) exocytic insertion of neurotransmitter receptor to postsynaptic membrane(GO:0098967) |
| 0.1 |
0.3 |
GO:0000727 |
double-strand break repair via break-induced replication(GO:0000727) |
| 0.1 |
0.6 |
GO:1904798 |
positive regulation of core promoter binding(GO:1904798) |
| 0.1 |
0.3 |
GO:1903615 |
regulation of protein tyrosine phosphatase activity(GO:1903613) positive regulation of protein tyrosine phosphatase activity(GO:1903615) |
| 0.1 |
0.8 |
GO:0048387 |
negative regulation of retinoic acid receptor signaling pathway(GO:0048387) |
| 0.1 |
0.2 |
GO:1902445 |
regulation of mitochondrial membrane permeability involved in programmed necrotic cell death(GO:1902445) |
| 0.1 |
0.3 |
GO:0035604 |
fibroblast growth factor receptor signaling pathway involved in negative regulation of apoptotic process in bone marrow(GO:0035602) fibroblast growth factor receptor signaling pathway involved in hemopoiesis(GO:0035603) fibroblast growth factor receptor signaling pathway involved in positive regulation of cell proliferation in bone marrow(GO:0035604) |
| 0.1 |
0.3 |
GO:0046946 |
hydroxylysine metabolic process(GO:0046946) hydroxylysine biosynthetic process(GO:0046947) |
| 0.0 |
0.1 |
GO:0001808 |
negative regulation of type IV hypersensitivity(GO:0001808) |
| 0.0 |
0.3 |
GO:2000399 |
negative regulation of T cell differentiation in thymus(GO:0033085) negative regulation of thymocyte aggregation(GO:2000399) |
| 0.0 |
0.3 |
GO:0035494 |
SNARE complex disassembly(GO:0035494) |
| 0.0 |
1.6 |
GO:0043968 |
histone H2A acetylation(GO:0043968) |
| 0.0 |
0.2 |
GO:2000861 |
estrogen secretion(GO:0035937) estradiol secretion(GO:0035938) regulation of estrogen secretion(GO:2000861) positive regulation of estrogen secretion(GO:2000863) regulation of estradiol secretion(GO:2000864) positive regulation of estradiol secretion(GO:2000866) |
| 0.0 |
1.5 |
GO:0045332 |
phospholipid translocation(GO:0045332) |
| 0.0 |
0.7 |
GO:0015812 |
gamma-aminobutyric acid transport(GO:0015812) |
| 0.0 |
0.4 |
GO:0000395 |
mRNA 5'-splice site recognition(GO:0000395) |
| 0.0 |
0.5 |
GO:0035520 |
monoubiquitinated protein deubiquitination(GO:0035520) |
| 0.0 |
0.9 |
GO:0036500 |
ATF6-mediated unfolded protein response(GO:0036500) |
| 0.0 |
0.6 |
GO:1990126 |
retrograde transport, endosome to plasma membrane(GO:1990126) |
| 0.0 |
1.7 |
GO:0007016 |
cytoskeletal anchoring at plasma membrane(GO:0007016) |
| 0.0 |
0.3 |
GO:0035616 |
histone H2B conserved C-terminal lysine deubiquitination(GO:0035616) |
| 0.0 |
0.2 |
GO:1904779 |
regulation of protein localization to centrosome(GO:1904779) |
| 0.0 |
0.7 |
GO:1903800 |
positive regulation of production of miRNAs involved in gene silencing by miRNA(GO:1903800) |
| 0.0 |
1.0 |
GO:0021692 |
cerebellar Purkinje cell layer morphogenesis(GO:0021692) |
| 0.0 |
0.2 |
GO:0035610 |
protein side chain deglutamylation(GO:0035610) |
| 0.0 |
0.1 |
GO:0048213 |
Golgi vesicle prefusion complex stabilization(GO:0048213) |
| 0.0 |
0.1 |
GO:1901165 |
positive regulation of trophoblast cell migration(GO:1901165) |
| 0.0 |
0.5 |
GO:0060052 |
neurofilament cytoskeleton organization(GO:0060052) |
| 0.0 |
0.2 |
GO:0051001 |
negative regulation of nitric-oxide synthase activity(GO:0051001) |
| 0.0 |
0.8 |
GO:0034656 |
nucleobase-containing small molecule catabolic process(GO:0034656) |
| 0.0 |
0.3 |
GO:0046103 |
adenosine catabolic process(GO:0006154) inosine biosynthetic process(GO:0046103) |
| 0.0 |
0.4 |
GO:0006686 |
sphingomyelin biosynthetic process(GO:0006686) |
| 0.0 |
0.4 |
GO:1900121 |
negative regulation of receptor binding(GO:1900121) |
| 0.0 |
0.7 |
GO:1900028 |
negative regulation of ruffle assembly(GO:1900028) |
| 0.0 |
0.3 |
GO:1904674 |
positive regulation of somatic stem cell population maintenance(GO:1904674) |
| 0.0 |
0.4 |
GO:0090309 |
positive regulation of methylation-dependent chromatin silencing(GO:0090309) |
| 0.0 |
0.7 |
GO:0046602 |
regulation of mitotic centrosome separation(GO:0046602) |
| 0.0 |
0.1 |
GO:0015860 |
purine nucleoside transmembrane transport(GO:0015860) |
| 0.0 |
0.0 |
GO:1901979 |
regulation of inward rectifier potassium channel activity(GO:1901979) |
| 0.0 |
0.3 |
GO:0051389 |
inactivation of MAPKK activity(GO:0051389) |
| 0.0 |
0.1 |
GO:0021503 |
neural fold bending(GO:0021503) |
| 0.0 |
0.3 |
GO:0033326 |
cerebrospinal fluid secretion(GO:0033326) |
| 0.0 |
0.3 |
GO:0021678 |
third ventricle development(GO:0021678) |
| 0.0 |
0.4 |
GO:0021759 |
globus pallidus development(GO:0021759) |
| 0.0 |
0.1 |
GO:0046010 |
positive regulation of circadian sleep/wake cycle, non-REM sleep(GO:0046010) |
| 0.0 |
0.1 |
GO:0021986 |
epithalamus development(GO:0021538) habenula development(GO:0021986) |
| 0.0 |
0.1 |
GO:2000560 |
CD24 biosynthetic process(GO:0035724) activation of meiosis involved in egg activation(GO:0060466) negative regulation of monocyte extravasation(GO:2000438) regulation of CD24 biosynthetic process(GO:2000559) positive regulation of CD24 biosynthetic process(GO:2000560) |
| 0.0 |
0.2 |
GO:0019853 |
L-ascorbic acid biosynthetic process(GO:0019853) regulation of calcium-dependent ATPase activity(GO:1903610) negative regulation of calcium-dependent ATPase activity(GO:1903611) regulation of dUTP diphosphatase activity(GO:1903627) positive regulation of dUTP diphosphatase activity(GO:1903629) negative regulation of aminoacyl-tRNA ligase activity(GO:1903631) regulation of leucine-tRNA ligase activity(GO:1903633) negative regulation of leucine-tRNA ligase activity(GO:1903634) |
| 0.0 |
1.4 |
GO:0007131 |
reciprocal meiotic recombination(GO:0007131) reciprocal DNA recombination(GO:0035825) |
| 0.0 |
0.2 |
GO:0046599 |
regulation of centriole replication(GO:0046599) |
| 0.0 |
0.5 |
GO:0031642 |
negative regulation of myelination(GO:0031642) |
| 0.0 |
0.7 |
GO:0071578 |
zinc II ion transmembrane import(GO:0071578) |
| 0.0 |
0.6 |
GO:0061088 |
regulation of sequestering of zinc ion(GO:0061088) |
| 0.0 |
0.6 |
GO:0070193 |
synaptonemal complex assembly(GO:0007130) synaptonemal complex organization(GO:0070193) |
| 0.0 |
0.1 |
GO:2000395 |
regulation of ubiquitin-dependent endocytosis(GO:2000395) positive regulation of ubiquitin-dependent endocytosis(GO:2000397) |
| 0.0 |
0.4 |
GO:0045176 |
apical protein localization(GO:0045176) |
| 0.0 |
0.3 |
GO:1903935 |
response to sodium arsenite(GO:1903935) |
| 0.0 |
0.2 |
GO:0061026 |
cardiac muscle tissue regeneration(GO:0061026) |
| 0.0 |
0.1 |
GO:0016237 |
lysosomal microautophagy(GO:0016237) piecemeal microautophagy of nucleus(GO:0034727) modulation by virus of host autophagy(GO:0039519) suppression by virus of host autophagy(GO:0039521) |
| 0.0 |
0.4 |
GO:0038145 |
macrophage colony-stimulating factor signaling pathway(GO:0038145) |
| 0.0 |
0.1 |
GO:0006683 |
galactosylceramide catabolic process(GO:0006683) |
| 0.0 |
0.8 |
GO:2000096 |
positive regulation of Wnt signaling pathway, planar cell polarity pathway(GO:2000096) |
| 0.0 |
2.6 |
GO:0032435 |
negative regulation of proteasomal ubiquitin-dependent protein catabolic process(GO:0032435) |
| 0.0 |
1.8 |
GO:0090383 |
phagosome acidification(GO:0090383) |
| 0.0 |
0.7 |
GO:0060056 |
mammary gland involution(GO:0060056) |
| 0.0 |
0.1 |
GO:0015746 |
tricarboxylic acid transport(GO:0006842) citrate transport(GO:0015746) |
| 0.0 |
0.8 |
GO:0014870 |
response to muscle inactivity(GO:0014870) |
| 0.0 |
0.1 |
GO:0032474 |
otolith morphogenesis(GO:0032474) |
| 0.0 |
0.3 |
GO:1903826 |
arginine transmembrane transport(GO:1903826) |
| 0.0 |
0.2 |
GO:0032511 |
late endosome to vacuole transport via multivesicular body sorting pathway(GO:0032511) |
| 0.0 |
0.1 |
GO:0035513 |
oxidative RNA demethylation(GO:0035513) oxidative single-stranded RNA demethylation(GO:0035553) |
| 0.0 |
0.8 |
GO:0045116 |
protein neddylation(GO:0045116) |
| 0.0 |
2.0 |
GO:0048854 |
brain morphogenesis(GO:0048854) |
| 0.0 |
0.2 |
GO:0002175 |
protein localization to paranode region of axon(GO:0002175) |
| 0.0 |
0.7 |
GO:0031284 |
positive regulation of guanylate cyclase activity(GO:0031284) |
| 0.0 |
0.1 |
GO:0070682 |
proteasome regulatory particle assembly(GO:0070682) |
| 0.0 |
0.7 |
GO:0006776 |
vitamin A metabolic process(GO:0006776) |
| 0.0 |
0.3 |
GO:0006983 |
ER overload response(GO:0006983) |
| 0.0 |
0.6 |
GO:0003351 |
epithelial cilium movement(GO:0003351) |
| 0.0 |
0.2 |
GO:0071922 |
establishment of sister chromatid cohesion(GO:0034085) cohesin loading(GO:0071921) regulation of cohesin loading(GO:0071922) |
| 0.0 |
0.3 |
GO:0000414 |
regulation of histone H3-K36 methylation(GO:0000414) |
| 0.0 |
2.4 |
GO:0042073 |
intraciliary transport(GO:0042073) |
| 0.0 |
0.3 |
GO:0043589 |
skin morphogenesis(GO:0043589) |
| 0.0 |
0.4 |
GO:0015705 |
iodide transport(GO:0015705) |
| 0.0 |
0.1 |
GO:0071350 |
interleukin-15-mediated signaling pathway(GO:0035723) cellular response to interleukin-15(GO:0071350) |
| 0.0 |
0.1 |
GO:0051310 |
metaphase plate congression(GO:0051310) |
| 0.0 |
0.3 |
GO:0002318 |
myeloid progenitor cell differentiation(GO:0002318) |
| 0.0 |
0.1 |
GO:0002326 |
B cell lineage commitment(GO:0002326) |
| 0.0 |
0.4 |
GO:0002943 |
tRNA dihydrouridine synthesis(GO:0002943) |
| 0.0 |
0.2 |
GO:0019605 |
butyrate metabolic process(GO:0019605) |
| 0.0 |
0.2 |
GO:0002528 |
regulation of vascular permeability involved in acute inflammatory response(GO:0002528) |
| 0.0 |
0.1 |
GO:0032185 |
septin cytoskeleton organization(GO:0032185) |
| 0.0 |
0.1 |
GO:0031282 |
regulation of guanylate cyclase activity(GO:0031282) |
| 0.0 |
0.2 |
GO:0038098 |
sequestering of BMP from receptor via BMP binding(GO:0038098) |
| 0.0 |
0.2 |
GO:0097368 |
establishment of Sertoli cell barrier(GO:0097368) |
| 0.0 |
0.4 |
GO:0016264 |
gap junction assembly(GO:0016264) |
| 0.0 |
0.1 |
GO:0016487 |
sesquiterpenoid metabolic process(GO:0006714) sesquiterpenoid catabolic process(GO:0016107) farnesol metabolic process(GO:0016487) farnesol catabolic process(GO:0016488) regulation of testosterone biosynthetic process(GO:2000224) |
| 0.0 |
0.3 |
GO:0043314 |
negative regulation of neutrophil degranulation(GO:0043314) |
| 0.0 |
0.6 |
GO:0015889 |
cobalamin transport(GO:0015889) |
| 0.0 |
0.5 |
GO:0046827 |
positive regulation of protein export from nucleus(GO:0046827) |
| 0.0 |
0.1 |
GO:0061386 |
closure of optic fissure(GO:0061386) |
| 0.0 |
0.1 |
GO:0070564 |
generation of catalytic spliceosome for second transesterification step(GO:0000350) positive regulation of vitamin D receptor signaling pathway(GO:0070564) |
| 0.0 |
0.6 |
GO:1901750 |
leukotriene D4 metabolic process(GO:1901748) leukotriene D4 biosynthetic process(GO:1901750) |
| 0.0 |
0.6 |
GO:0043517 |
positive regulation of DNA damage response, signal transduction by p53 class mediator(GO:0043517) |
| 0.0 |
0.9 |
GO:0021591 |
ventricular system development(GO:0021591) |
| 0.0 |
0.7 |
GO:0046415 |
urate metabolic process(GO:0046415) |
| 0.0 |
0.1 |
GO:0072361 |
regulation of glycolytic process by regulation of transcription from RNA polymerase II promoter(GO:0072361) |
| 0.0 |
0.5 |
GO:0001973 |
adenosine receptor signaling pathway(GO:0001973) |
| 0.0 |
0.7 |
GO:0071985 |
multivesicular body sorting pathway(GO:0071985) |
| 0.0 |
0.8 |
GO:0022010 |
central nervous system myelination(GO:0022010) axon ensheathment in central nervous system(GO:0032291) |
| 0.0 |
0.1 |
GO:0033091 |
positive regulation of immature T cell proliferation(GO:0033091) |
| 0.0 |
0.5 |
GO:0031507 |
heterochromatin assembly(GO:0031507) |
| 0.0 |
0.1 |
GO:0032241 |
snRNA export from nucleus(GO:0006408) positive regulation of nucleobase-containing compound transport(GO:0032241) positive regulation of RNA export from nucleus(GO:0046833) |
| 0.0 |
0.4 |
GO:1902669 |
positive regulation of axon guidance(GO:1902669) |
| 0.0 |
0.2 |
GO:0046092 |
deoxycytidine metabolic process(GO:0046092) |
| 0.0 |
0.4 |
GO:0006268 |
DNA unwinding involved in DNA replication(GO:0006268) |
| 0.0 |
0.4 |
GO:0070294 |
renal sodium ion absorption(GO:0070294) |
| 0.0 |
2.4 |
GO:0030317 |
sperm motility(GO:0030317) |
| 0.0 |
0.5 |
GO:1902260 |
negative regulation of delayed rectifier potassium channel activity(GO:1902260) negative regulation of voltage-gated potassium channel activity(GO:1903817) |
| 0.0 |
0.2 |
GO:0007056 |
spindle assembly involved in female meiosis(GO:0007056) |
| 0.0 |
0.3 |
GO:0032534 |
regulation of microvillus assembly(GO:0032534) |
| 0.0 |
0.4 |
GO:0030422 |
production of siRNA involved in RNA interference(GO:0030422) |
| 0.0 |
0.2 |
GO:0046838 |
phosphorylated carbohydrate dephosphorylation(GO:0046838) inositol phosphate dephosphorylation(GO:0046855) inositol phosphate catabolic process(GO:0071545) |
| 0.0 |
4.6 |
GO:0007286 |
spermatid development(GO:0007286) |
| 0.0 |
0.1 |
GO:0000117 |
regulation of transcription involved in G2/M transition of mitotic cell cycle(GO:0000117) |
| 0.0 |
0.9 |
GO:0071801 |
regulation of podosome assembly(GO:0071801) |
| 0.0 |
0.1 |
GO:0021764 |
amygdala development(GO:0021764) |
| 0.0 |
1.5 |
GO:0071431 |
tRNA export from nucleus(GO:0006409) tRNA-containing ribonucleoprotein complex export from nucleus(GO:0071431) |
| 0.0 |
0.1 |
GO:0002503 |
peptide antigen assembly with MHC protein complex(GO:0002501) peptide antigen assembly with MHC class II protein complex(GO:0002503) |
| 0.0 |
0.2 |
GO:0030538 |
embryonic genitalia morphogenesis(GO:0030538) |
| 0.0 |
0.6 |
GO:0001829 |
trophectodermal cell differentiation(GO:0001829) |
| 0.0 |
0.1 |
GO:0015014 |
heparan sulfate proteoglycan biosynthetic process, polysaccharide chain biosynthetic process(GO:0015014) |
| 0.0 |
0.9 |
GO:0001573 |
ganglioside metabolic process(GO:0001573) |
| 0.0 |
0.4 |
GO:0044341 |
sodium-dependent phosphate transport(GO:0044341) |
| 0.0 |
0.1 |
GO:0001692 |
histamine metabolic process(GO:0001692) |
| 0.0 |
0.2 |
GO:0006657 |
CDP-choline pathway(GO:0006657) |
| 0.0 |
0.2 |
GO:0035750 |
protein localization to myelin sheath abaxonal region(GO:0035750) |
| 0.0 |
0.1 |
GO:0071460 |
cellular response to cell-matrix adhesion(GO:0071460) |
| 0.0 |
0.2 |
GO:1902459 |
positive regulation of stem cell population maintenance(GO:1902459) |
| 0.0 |
0.1 |
GO:1902683 |
regulation of receptor localization to synapse(GO:1902683) |
| 0.0 |
1.2 |
GO:2000300 |
regulation of synaptic vesicle exocytosis(GO:2000300) |
| 0.0 |
0.3 |
GO:0035879 |
plasma membrane lactate transport(GO:0035879) |
| 0.0 |
0.1 |
GO:0071475 |
cellular hyperosmotic salinity response(GO:0071475) |
| 0.0 |
14.1 |
GO:0007283 |
spermatogenesis(GO:0007283) |
| 0.0 |
0.2 |
GO:0002098 |
tRNA wobble uridine modification(GO:0002098) |
| 0.0 |
0.2 |
GO:2000270 |
negative regulation of fibroblast apoptotic process(GO:2000270) |
| 0.0 |
0.2 |
GO:1901906 |
diadenosine polyphosphate metabolic process(GO:0015959) diadenosine polyphosphate catabolic process(GO:0015961) diphosphoinositol polyphosphate metabolic process(GO:0071543) diadenosine pentaphosphate metabolic process(GO:1901906) diadenosine pentaphosphate catabolic process(GO:1901907) diadenosine hexaphosphate metabolic process(GO:1901908) diadenosine hexaphosphate catabolic process(GO:1901909) adenosine 5'-(hexahydrogen pentaphosphate) metabolic process(GO:1901910) adenosine 5'-(hexahydrogen pentaphosphate) catabolic process(GO:1901911) |
| 0.0 |
0.6 |
GO:0010824 |
regulation of centrosome duplication(GO:0010824) |
| 0.0 |
0.5 |
GO:0090050 |
positive regulation of cell migration involved in sprouting angiogenesis(GO:0090050) |
| 0.0 |
0.4 |
GO:0015781 |
pyrimidine nucleotide-sugar transport(GO:0015781) |
| 0.0 |
0.4 |
GO:2001015 |
negative regulation of skeletal muscle cell differentiation(GO:2001015) |
| 0.0 |
0.1 |
GO:1903674 |
regulation of cap-dependent translational initiation(GO:1903674) positive regulation of cap-dependent translational initiation(GO:1903676) |
| 0.0 |
0.3 |
GO:0018231 |
peptidyl-L-cysteine S-palmitoylation(GO:0018230) peptidyl-S-diacylglycerol-L-cysteine biosynthetic process from peptidyl-cysteine(GO:0018231) |
| 0.0 |
0.2 |
GO:2000773 |
negative regulation of cellular senescence(GO:2000773) |
| 0.0 |
0.7 |
GO:0030033 |
microvillus assembly(GO:0030033) |
| 0.0 |
0.2 |
GO:0072733 |
response to staurosporine(GO:0072733) cellular response to staurosporine(GO:0072734) |
| 0.0 |
1.5 |
GO:0071391 |
cellular response to estrogen stimulus(GO:0071391) |
| 0.0 |
0.1 |
GO:0061536 |
glycine secretion(GO:0061536) glycine secretion, neurotransmission(GO:0061537) |
| 0.0 |
0.7 |
GO:0006490 |
oligosaccharide-lipid intermediate biosynthetic process(GO:0006490) |
| 0.0 |
0.1 |
GO:0016259 |
selenocysteine metabolic process(GO:0016259) |
| 0.0 |
0.7 |
GO:0045880 |
positive regulation of smoothened signaling pathway(GO:0045880) |
| 0.0 |
0.6 |
GO:0071157 |
negative regulation of cell cycle arrest(GO:0071157) |
| 0.0 |
0.3 |
GO:0001514 |
selenocysteine incorporation(GO:0001514) translational readthrough(GO:0006451) |
| 0.0 |
0.4 |
GO:0070493 |
thrombin receptor signaling pathway(GO:0070493) |
| 0.0 |
0.1 |
GO:1903677 |
regulation of cap-independent translational initiation(GO:1903677) positive regulation of cap-independent translational initiation(GO:1903679) regulation of cytoplasmic translational initiation(GO:1904688) positive regulation of cytoplasmic translational initiation(GO:1904690) |
| 0.0 |
0.1 |
GO:0031937 |
positive regulation of chromatin silencing(GO:0031937) |
| 0.0 |
0.1 |
GO:0035617 |
stress granule disassembly(GO:0035617) |
| 0.0 |
0.2 |
GO:0071955 |
recycling endosome to Golgi transport(GO:0071955) |
| 0.0 |
0.2 |
GO:1903566 |
positive regulation of protein localization to cilium(GO:1903566) |
| 0.0 |
0.4 |
GO:0015074 |
DNA integration(GO:0015074) |
| 0.0 |
0.2 |
GO:0034058 |
endosomal vesicle fusion(GO:0034058) |
| 0.0 |
0.2 |
GO:0033629 |
negative regulation of cell adhesion mediated by integrin(GO:0033629) |
| 0.0 |
0.3 |
GO:0061591 |
calcium activated phospholipid scrambling(GO:0061588) calcium activated phosphatidylcholine scrambling(GO:0061590) calcium activated galactosylceramide scrambling(GO:0061591) |
| 0.0 |
0.1 |
GO:0019074 |
viral genome packaging(GO:0019072) viral RNA genome packaging(GO:0019074) |
| 0.0 |
0.3 |
GO:0003306 |
Wnt signaling pathway involved in heart development(GO:0003306) |
| 0.0 |
0.2 |
GO:0046541 |
saliva secretion(GO:0046541) |
| 0.0 |
1.1 |
GO:0046856 |
phosphatidylinositol dephosphorylation(GO:0046856) |
| 0.0 |
0.2 |
GO:0050965 |
detection of temperature stimulus involved in sensory perception(GO:0050961) detection of temperature stimulus involved in sensory perception of pain(GO:0050965) |
| 0.0 |
0.1 |
GO:1990539 |
fructose import(GO:0032445) cellular response to fructose stimulus(GO:0071332) carbohydrate import into cell(GO:0097319) carbohydrate import across plasma membrane(GO:0098704) fructose import across plasma membrane(GO:1990539) |
| 0.0 |
0.2 |
GO:0045218 |
zonula adherens maintenance(GO:0045218) |
| 0.0 |
0.1 |
GO:0051142 |
regulation of NK T cell proliferation(GO:0051140) positive regulation of NK T cell proliferation(GO:0051142) |
| 0.0 |
0.4 |
GO:0050966 |
detection of mechanical stimulus involved in sensory perception of pain(GO:0050966) |
| 0.0 |
0.2 |
GO:0032455 |
nerve growth factor processing(GO:0032455) |
| 0.0 |
0.2 |
GO:2000620 |
positive regulation of histone H4-K16 acetylation(GO:2000620) |
| 0.0 |
0.0 |
GO:0018171 |
peptidyl-cysteine oxidation(GO:0018171) |
| 0.0 |
0.9 |
GO:0016339 |
calcium-dependent cell-cell adhesion via plasma membrane cell adhesion molecules(GO:0016339) |
| 0.0 |
0.9 |
GO:0035036 |
sperm-egg recognition(GO:0035036) |
| 0.0 |
0.3 |
GO:1900364 |
negative regulation of mRNA polyadenylation(GO:1900364) |
| 0.0 |
0.1 |
GO:0010983 |
positive regulation of high-density lipoprotein particle clearance(GO:0010983) |
| 0.0 |
0.4 |
GO:0042355 |
fucose catabolic process(GO:0019317) L-fucose metabolic process(GO:0042354) L-fucose catabolic process(GO:0042355) |
| 0.0 |
0.2 |
GO:0002254 |
kinin cascade(GO:0002254) plasma kallikrein-kinin cascade(GO:0002353) |
| 0.0 |
0.2 |
GO:0031915 |
positive regulation of synaptic plasticity(GO:0031915) |
| 0.0 |
0.2 |
GO:0034141 |
positive regulation of toll-like receptor 3 signaling pathway(GO:0034141) |
| 0.0 |
0.5 |
GO:0071539 |
protein localization to centrosome(GO:0071539) |
| 0.0 |
0.1 |
GO:0044752 |
response to human chorionic gonadotropin(GO:0044752) cellular response to thyroxine stimulus(GO:0097069) cellular response to L-phenylalanine derivative(GO:1904387) |
| 0.0 |
0.2 |
GO:0015866 |
ADP transport(GO:0015866) |
| 0.0 |
0.1 |
GO:0061762 |
CAMKK-AMPK signaling cascade(GO:0061762) |
| 0.0 |
0.4 |
GO:0007095 |
mitotic G2 DNA damage checkpoint(GO:0007095) mitotic G2/M transition checkpoint(GO:0044818) |
| 0.0 |
0.8 |
GO:0048268 |
clathrin coat assembly(GO:0048268) |
| 0.0 |
0.3 |
GO:0007084 |
mitotic nuclear envelope reassembly(GO:0007084) |
| 0.0 |
0.2 |
GO:0032071 |
regulation of endodeoxyribonuclease activity(GO:0032071) |
| 0.0 |
0.2 |
GO:2000698 |
glomerular parietal epithelial cell differentiation(GO:0072139) positive regulation of epithelial cell differentiation involved in kidney development(GO:2000698) positive regulation of nephron tubule epithelial cell differentiation(GO:2000768) |
| 0.0 |
0.2 |
GO:0048280 |
vesicle fusion with Golgi apparatus(GO:0048280) |
| 0.0 |
0.4 |
GO:0006829 |
zinc II ion transport(GO:0006829) |
| 0.0 |
0.1 |
GO:0038123 |
toll-like receptor TLR1:TLR2 signaling pathway(GO:0038123) response to triacyl bacterial lipopeptide(GO:0071725) cellular response to triacyl bacterial lipopeptide(GO:0071727) |
| 0.0 |
0.1 |
GO:0052041 |
suppression by virus of host apoptotic process(GO:0019050) negative regulation by symbiont of host apoptotic process(GO:0033668) modulation by virus of host molecular function(GO:0039506) suppression by virus of host molecular function(GO:0039507) suppression by virus of host catalytic activity(GO:0039513) modulation by virus of host catalytic activity(GO:0039516) modulation by virus of host apoptotic process(GO:0039526) suppression by virus of host cysteine-type endopeptidase activity involved in apoptotic process(GO:0039650) negative regulation by symbiont of host programmed cell death(GO:0052041) negative regulation by symbiont of host catalytic activity(GO:0052053) negative regulation by symbiont of host molecular function(GO:0052056) modulation by symbiont of host catalytic activity(GO:0052148) modulation by symbiont of host apoptotic process(GO:0052150) negative regulation by organism of programmed cell death in other organism involved in symbiotic interaction(GO:0052490) |
| 0.0 |
1.3 |
GO:0006904 |
vesicle docking involved in exocytosis(GO:0006904) |
| 0.0 |
0.2 |
GO:0051292 |
nuclear pore organization(GO:0006999) nuclear pore complex assembly(GO:0051292) |
| 0.0 |
0.8 |
GO:0090162 |
establishment of epithelial cell polarity(GO:0090162) |
| 0.0 |
0.1 |
GO:0034036 |
purine ribonucleoside bisphosphate biosynthetic process(GO:0034036) 3'-phosphoadenosine 5'-phosphosulfate biosynthetic process(GO:0050428) |
| 0.0 |
0.4 |
GO:0097094 |
craniofacial suture morphogenesis(GO:0097094) |
| 0.0 |
0.1 |
GO:0090206 |
negative regulation of cholesterol biosynthetic process(GO:0045541) negative regulation of cholesterol metabolic process(GO:0090206) |
| 0.0 |
0.2 |
GO:1901679 |
nucleotide transmembrane transport(GO:1901679) |
| 0.0 |
0.2 |
GO:0010265 |
SCF complex assembly(GO:0010265) |
| 0.0 |
0.1 |
GO:0060484 |
lung-associated mesenchyme development(GO:0060484) |
| 0.0 |
0.5 |
GO:0002021 |
response to dietary excess(GO:0002021) |
| 0.0 |
0.2 |
GO:0043249 |
erythrocyte maturation(GO:0043249) |
| 0.0 |
0.2 |
GO:0051694 |
pointed-end actin filament capping(GO:0051694) |
| 0.0 |
0.3 |
GO:2001241 |
positive regulation of extrinsic apoptotic signaling pathway in absence of ligand(GO:2001241) |
| 0.0 |
0.1 |
GO:0045048 |
protein insertion into ER membrane(GO:0045048) |
| 0.0 |
0.1 |
GO:0042796 |
snRNA transcription from RNA polymerase III promoter(GO:0042796) |
| 0.0 |
0.1 |
GO:0034316 |
negative regulation of Arp2/3 complex-mediated actin nucleation(GO:0034316) |
| 0.0 |
1.0 |
GO:0032728 |
positive regulation of interferon-beta production(GO:0032728) |
| 0.0 |
0.2 |
GO:0003402 |
planar cell polarity pathway involved in axis elongation(GO:0003402) |
| 0.0 |
0.4 |
GO:0007213 |
G-protein coupled acetylcholine receptor signaling pathway(GO:0007213) |
| 0.0 |
0.5 |
GO:0006349 |
regulation of gene expression by genetic imprinting(GO:0006349) |
| 0.0 |
1.1 |
GO:0007223 |
Wnt signaling pathway, calcium modulating pathway(GO:0007223) |
| 0.0 |
0.1 |
GO:0051581 |
negative regulation of neurotransmitter uptake(GO:0051581) serotonin uptake(GO:0051610) regulation of serotonin uptake(GO:0051611) negative regulation of serotonin uptake(GO:0051612) |
| 0.0 |
0.1 |
GO:0080009 |
mRNA methylation(GO:0080009) |
| 0.0 |
0.1 |
GO:0090038 |
negative regulation of protein kinase C signaling(GO:0090038) |
| 0.0 |
0.5 |
GO:1902751 |
positive regulation of cell cycle G2/M phase transition(GO:1902751) |
| 0.0 |
0.1 |
GO:0000821 |
regulation of arginine metabolic process(GO:0000821) |
| 0.0 |
0.4 |
GO:0060670 |
branching involved in labyrinthine layer morphogenesis(GO:0060670) |
| 0.0 |
0.9 |
GO:0006298 |
mismatch repair(GO:0006298) |
| 0.0 |
0.1 |
GO:1902626 |
assembly of large subunit precursor of preribosome(GO:1902626) |
| 0.0 |
0.1 |
GO:2001247 |
positive regulation of phosphatidylcholine biosynthetic process(GO:2001247) |
| 0.0 |
0.1 |
GO:0001826 |
inner cell mass cell differentiation(GO:0001826) |
| 0.0 |
0.2 |
GO:0001672 |
regulation of chromatin assembly or disassembly(GO:0001672) |
| 0.0 |
0.1 |
GO:0021691 |
cerebellum maturation(GO:0021590) cerebellar Purkinje cell layer maturation(GO:0021691) cerebellar cortex maturation(GO:0021699) |
| 0.0 |
0.8 |
GO:0061003 |
positive regulation of dendritic spine morphogenesis(GO:0061003) |
| 0.0 |
0.1 |
GO:0051030 |
RNA import into nucleus(GO:0006404) snRNA transport(GO:0051030) snRNA import into nucleus(GO:0061015) |
| 0.0 |
0.2 |
GO:1902730 |
regulation of heparan sulfate proteoglycan biosynthetic process(GO:0010908) positive regulation of heparan sulfate proteoglycan biosynthetic process(GO:0010909) positive regulation of proteoglycan biosynthetic process(GO:1902730) |
| 0.0 |
0.1 |
GO:0003406 |
retinal pigment epithelium development(GO:0003406) |
| 0.0 |
0.1 |
GO:0044065 |
regulation of respiratory system process(GO:0044065) |
| 0.0 |
0.1 |
GO:0034699 |
response to luteinizing hormone(GO:0034699) |
| 0.0 |
0.2 |
GO:1903831 |
acetylcholine receptor signaling pathway(GO:0095500) postsynaptic signal transduction(GO:0098926) signal transduction involved in cellular response to ammonium ion(GO:1903831) response to acetylcholine(GO:1905144) cellular response to acetylcholine(GO:1905145) |
| 0.0 |
0.2 |
GO:2000253 |
positive regulation of feeding behavior(GO:2000253) |
| 0.0 |
0.0 |
GO:0000961 |
negative regulation of mitochondrial RNA catabolic process(GO:0000961) |
| 0.0 |
1.5 |
GO:0046902 |
regulation of mitochondrial membrane permeability(GO:0046902) |
| 0.0 |
0.1 |
GO:1903644 |
regulation of chaperone-mediated protein folding(GO:1903644) |
| 0.0 |
0.2 |
GO:2000628 |
regulation of miRNA metabolic process(GO:2000628) |
| 0.0 |
1.1 |
GO:0000289 |
nuclear-transcribed mRNA poly(A) tail shortening(GO:0000289) |
| 0.0 |
0.9 |
GO:0048791 |
calcium ion-regulated exocytosis of neurotransmitter(GO:0048791) |
| 0.0 |
0.1 |
GO:0006540 |
glutamate decarboxylation to succinate(GO:0006540) |
| 0.0 |
0.3 |
GO:0006600 |
creatine metabolic process(GO:0006600) |
| 0.0 |
0.1 |
GO:0007070 |
negative regulation of transcription during mitosis(GO:0007068) negative regulation of transcription from RNA polymerase II promoter during mitosis(GO:0007070) |
| 0.0 |
0.0 |
GO:0034165 |
positive regulation of toll-like receptor 9 signaling pathway(GO:0034165) |
| 0.0 |
0.7 |
GO:0007205 |
protein kinase C-activating G-protein coupled receptor signaling pathway(GO:0007205) |
| 0.0 |
0.3 |
GO:0007196 |
adenylate cyclase-inhibiting G-protein coupled glutamate receptor signaling pathway(GO:0007196) |
| 0.0 |
0.3 |
GO:0061014 |
positive regulation of mRNA catabolic process(GO:0061014) |
| 0.0 |
1.6 |
GO:0007062 |
sister chromatid cohesion(GO:0007062) |
| 0.0 |
0.4 |
GO:0006506 |
GPI anchor biosynthetic process(GO:0006506) |
| 0.0 |
0.5 |
GO:0032467 |
positive regulation of cytokinesis(GO:0032467) |
| 0.0 |
1.6 |
GO:0007224 |
smoothened signaling pathway(GO:0007224) |
| 0.0 |
0.3 |
GO:0000729 |
DNA double-strand break processing(GO:0000729) |
| 0.0 |
0.1 |
GO:0035641 |
locomotory exploration behavior(GO:0035641) |
| 0.0 |
0.6 |
GO:0000281 |
mitotic cytokinesis(GO:0000281) |
| 0.0 |
0.2 |
GO:1904261 |
regulation of basement membrane assembly involved in embryonic body morphogenesis(GO:1904259) positive regulation of basement membrane assembly involved in embryonic body morphogenesis(GO:1904261) basement membrane assembly involved in embryonic body morphogenesis(GO:2001197) |
| 0.0 |
0.2 |
GO:0032306 |
regulation of prostaglandin secretion(GO:0032306) positive regulation of prostaglandin secretion(GO:0032308) |
| 0.0 |
0.6 |
GO:0006370 |
7-methylguanosine mRNA capping(GO:0006370) |
| 0.0 |
0.1 |
GO:0043922 |
negative regulation by host of viral transcription(GO:0043922) |
| 0.0 |
0.0 |
GO:0002752 |
cell surface pattern recognition receptor signaling pathway(GO:0002752) |
| 0.0 |
0.1 |
GO:0035269 |
protein O-linked mannosylation(GO:0035269) |
| 0.0 |
0.2 |
GO:0007250 |
activation of NF-kappaB-inducing kinase activity(GO:0007250) |
| 0.0 |
0.3 |
GO:0010991 |
negative regulation of SMAD protein complex assembly(GO:0010991) |
| 0.0 |
0.3 |
GO:0060644 |
mammary gland epithelial cell differentiation(GO:0060644) |
| 0.0 |
0.2 |
GO:0043457 |
regulation of cellular respiration(GO:0043457) |
| 0.0 |
0.1 |
GO:0035640 |
exploration behavior(GO:0035640) |
| 0.0 |
0.2 |
GO:0046839 |
phospholipid dephosphorylation(GO:0046839) |
| 0.0 |
0.1 |
GO:0051228 |
mitotic spindle disassembly(GO:0051228) spindle disassembly(GO:0051230) |
| 0.0 |
0.0 |
GO:0071469 |
response to alkaline pH(GO:0010446) cellular response to alkaline pH(GO:0071469) |
| 0.0 |
0.1 |
GO:0019370 |
leukotriene biosynthetic process(GO:0019370) |
| 0.0 |
0.2 |
GO:0038129 |
directional guidance of interneurons involved in migration from the subpallium to the cortex(GO:0021840) chemorepulsion involved in interneuron migration from the subpallium to the cortex(GO:0021842) ERBB3 signaling pathway(GO:0038129) |
| 0.0 |
0.2 |
GO:0045722 |
positive regulation of gluconeogenesis(GO:0045722) |
| 0.0 |
0.1 |
GO:0090160 |
Golgi to lysosome transport(GO:0090160) |
| 0.0 |
0.0 |
GO:0034471 |
endonucleolytic cleavage to generate mature 5'-end of SSU-rRNA from (SSU-rRNA, 5.8S rRNA, LSU-rRNA)(GO:0000472) rRNA 5'-end processing(GO:0000967) ncRNA 5'-end processing(GO:0034471) |
| 0.0 |
0.2 |
GO:0070723 |
response to cholesterol(GO:0070723) |
| 0.0 |
0.1 |
GO:0099558 |
maintenance of synapse structure(GO:0099558) |
| 0.0 |
0.5 |
GO:0051894 |
positive regulation of focal adhesion assembly(GO:0051894) |
| 0.0 |
0.2 |
GO:0003341 |
cilium movement(GO:0003341) |
| 0.0 |
0.2 |
GO:0070262 |
peptidyl-serine dephosphorylation(GO:0070262) |
| 0.0 |
0.7 |
GO:0010765 |
positive regulation of sodium ion transport(GO:0010765) |
| 0.0 |
1.5 |
GO:0051965 |
positive regulation of synapse assembly(GO:0051965) |
| 0.0 |
0.2 |
GO:0046085 |
adenosine metabolic process(GO:0046085) |
| 0.0 |
0.1 |
GO:0061002 |
negative regulation of dendritic spine morphogenesis(GO:0061002) |
| 0.0 |
0.1 |
GO:0052651 |
monoacylglycerol metabolic process(GO:0046462) monoacylglycerol catabolic process(GO:0052651) |
| 0.0 |
0.2 |
GO:0034498 |
early endosome to Golgi transport(GO:0034498) |
| 0.0 |
0.5 |
GO:0000460 |
maturation of 5.8S rRNA(GO:0000460) |
| 0.0 |
0.0 |
GO:2000344 |
positive regulation of acrosome reaction(GO:2000344) |
| 0.0 |
0.8 |
GO:0006306 |
DNA alkylation(GO:0006305) DNA methylation(GO:0006306) |
| 0.0 |
0.1 |
GO:0018344 |
protein geranylgeranylation(GO:0018344) |
| 0.0 |
0.1 |
GO:0010457 |
centriole-centriole cohesion(GO:0010457) |
| 0.0 |
0.1 |
GO:0043569 |
negative regulation of insulin-like growth factor receptor signaling pathway(GO:0043569) |
| 0.0 |
0.1 |
GO:0090156 |
negative regulation of sphingolipid biosynthetic process(GO:0090155) cellular sphingolipid homeostasis(GO:0090156) negative regulation of ceramide biosynthetic process(GO:1900060) |
| 0.0 |
0.1 |
GO:0071361 |
cellular response to ethanol(GO:0071361) |
| 0.0 |
0.1 |
GO:1903608 |
protein localization to cytoplasmic stress granule(GO:1903608) |
| 0.0 |
1.6 |
GO:0097202 |
activation of cysteine-type endopeptidase activity(GO:0097202) |
| 0.0 |
0.1 |
GO:0031468 |
nuclear envelope reassembly(GO:0031468) |
| 0.0 |
0.2 |
GO:0006295 |
nucleotide-excision repair, DNA incision, 3'-to lesion(GO:0006295) |
| 0.0 |
0.5 |
GO:0010501 |
RNA secondary structure unwinding(GO:0010501) |
| 0.0 |
0.1 |
GO:0000012 |
single strand break repair(GO:0000012) |
| 0.0 |
0.3 |
GO:0006883 |
cellular sodium ion homeostasis(GO:0006883) |
| 0.0 |
0.2 |
GO:0060712 |
spongiotrophoblast layer development(GO:0060712) |
| 0.0 |
0.0 |
GO:0008628 |
hormone-mediated apoptotic signaling pathway(GO:0008628) |
| 0.0 |
0.2 |
GO:0018026 |
peptidyl-lysine monomethylation(GO:0018026) |
| 0.0 |
0.5 |
GO:0048477 |
oogenesis(GO:0048477) |
| 0.0 |
0.1 |
GO:0006610 |
ribosomal protein import into nucleus(GO:0006610) |
| 0.0 |
0.3 |
GO:0007628 |
adult walking behavior(GO:0007628) |
| 0.0 |
0.2 |
GO:0051984 |
positive regulation of chromosome segregation(GO:0051984) |
| 0.0 |
0.0 |
GO:1903748 |
negative regulation of establishment of protein localization to mitochondrion(GO:1903748) |
| 0.0 |
0.1 |
GO:0036438 |
maintenance of lens transparency(GO:0036438) |
| 0.0 |
0.1 |
GO:0006432 |
phenylalanyl-tRNA aminoacylation(GO:0006432) |
| 0.0 |
0.7 |
GO:0045197 |
establishment or maintenance of epithelial cell apical/basal polarity(GO:0045197) |
| 0.0 |
0.2 |
GO:0040015 |
negative regulation of multicellular organism growth(GO:0040015) |
| 0.0 |
0.9 |
GO:0006970 |
response to osmotic stress(GO:0006970) |
| 0.0 |
0.2 |
GO:0050779 |
RNA destabilization(GO:0050779) |
| 0.0 |
0.1 |
GO:1990504 |
dense core granule exocytosis(GO:1990504) |
| 0.0 |
0.0 |
GO:1903772 |
regulation of viral budding via host ESCRT complex(GO:1903772) |
| 0.0 |
0.0 |
GO:0035562 |
negative regulation of chromatin binding(GO:0035562) |
| 0.0 |
0.3 |
GO:0022400 |
regulation of rhodopsin mediated signaling pathway(GO:0022400) |
| 0.0 |
0.4 |
GO:0030206 |
chondroitin sulfate biosynthetic process(GO:0030206) |
| 0.0 |
0.0 |
GO:0033031 |
positive regulation of neutrophil apoptotic process(GO:0033031) |
| 0.0 |
0.1 |
GO:0017196 |
N-terminal peptidyl-methionine acetylation(GO:0017196) |
| 0.0 |
0.1 |
GO:0042074 |
cell migration involved in gastrulation(GO:0042074) |
| 0.0 |
0.4 |
GO:0045840 |
positive regulation of mitotic nuclear division(GO:0045840) |
| 0.0 |
0.1 |
GO:0071461 |
cellular response to redox state(GO:0071461) |
| 0.0 |
0.6 |
GO:0010107 |
potassium ion import(GO:0010107) |
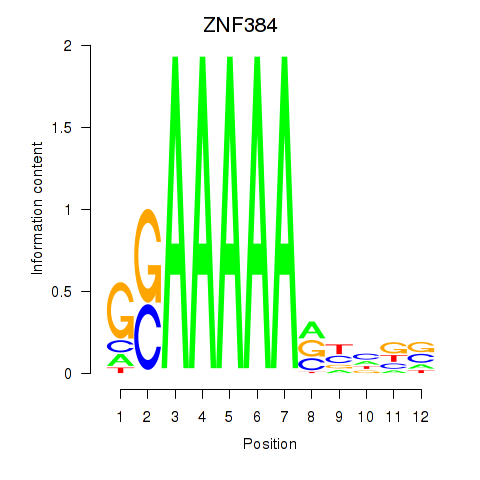
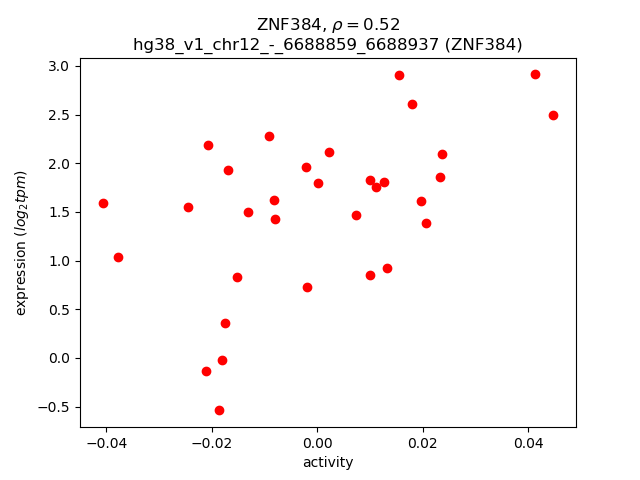
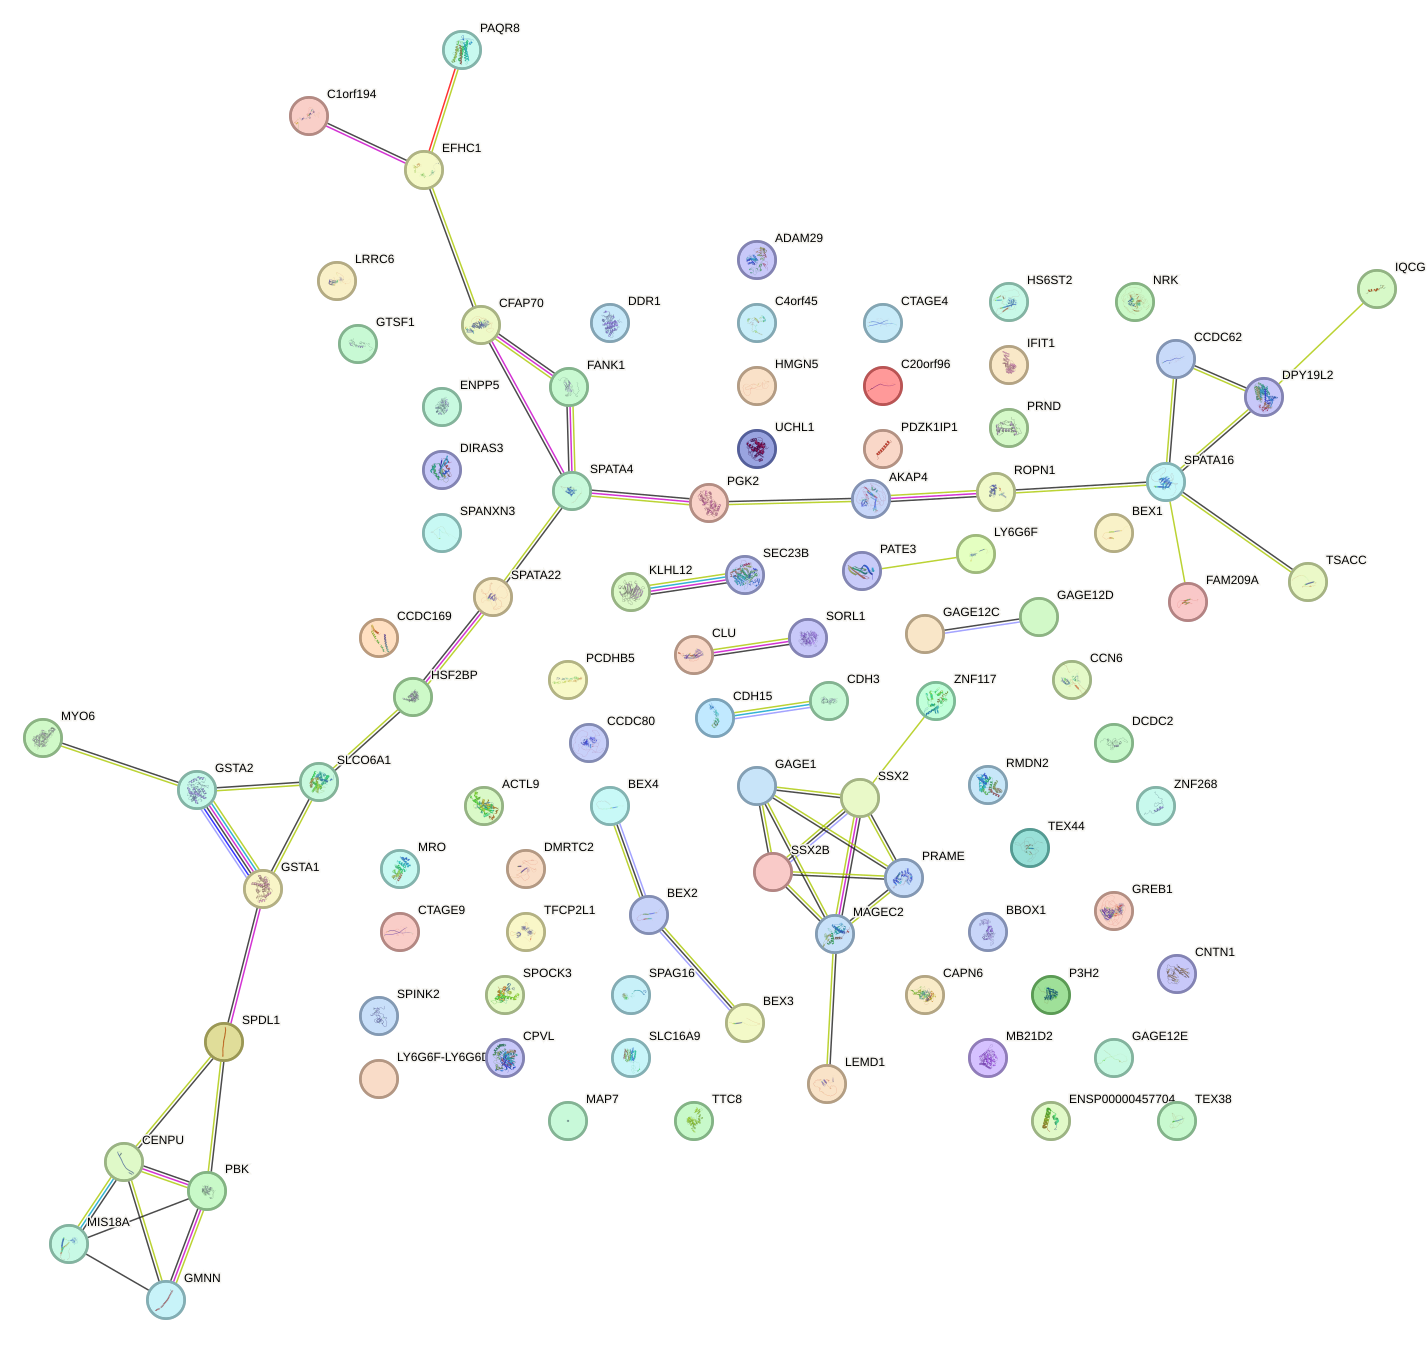
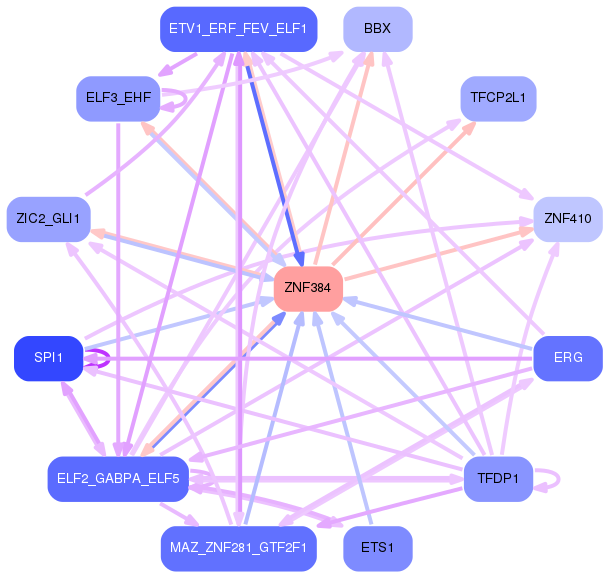