Project
avrg: Illumina Body Map 2 (GSE30611)
Navigation
Downloads
Results for BACH1_NFE2_NFE2L2
Z-value: 3.10
Motif logo
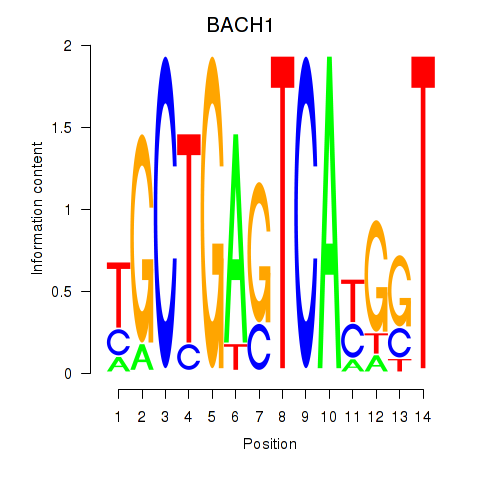
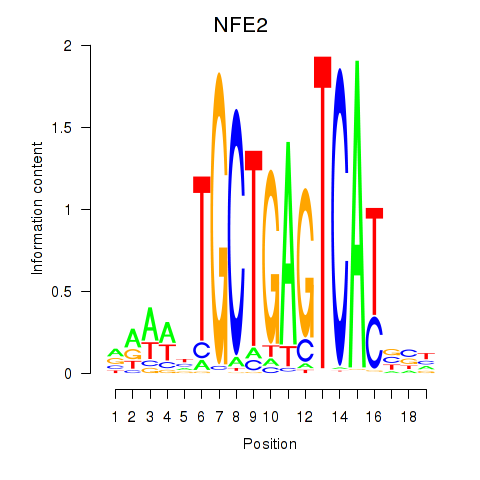
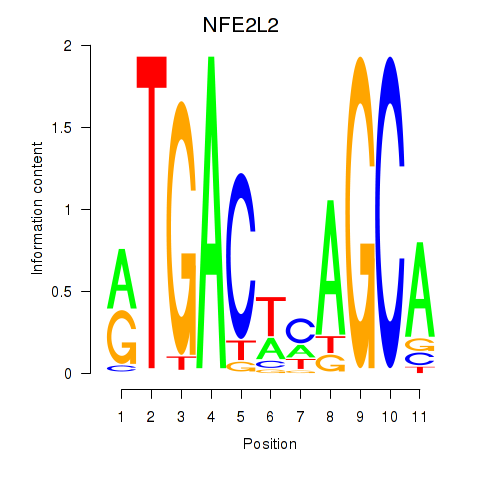
Transcription factors associated with BACH1_NFE2_NFE2L2
| Gene Symbol | Gene ID | Gene Info |
|---|---|---|
|
BACH1
|
ENSG00000156273.16 | BACH1 |
|
NFE2
|
ENSG00000123405.14 | NFE2 |
|
NFE2L2
|
ENSG00000116044.16 | NFE2L2 |
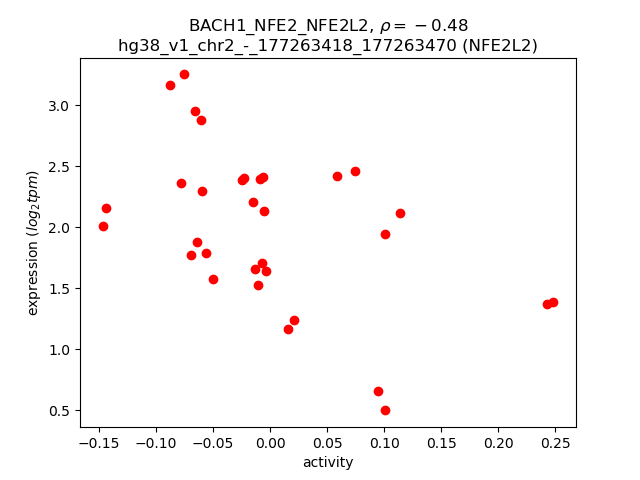
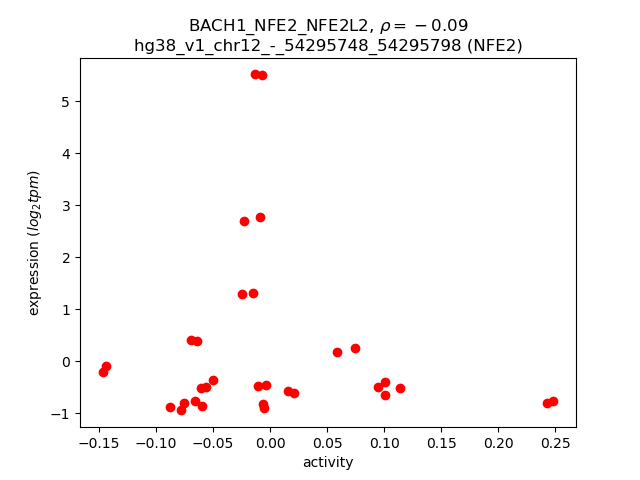
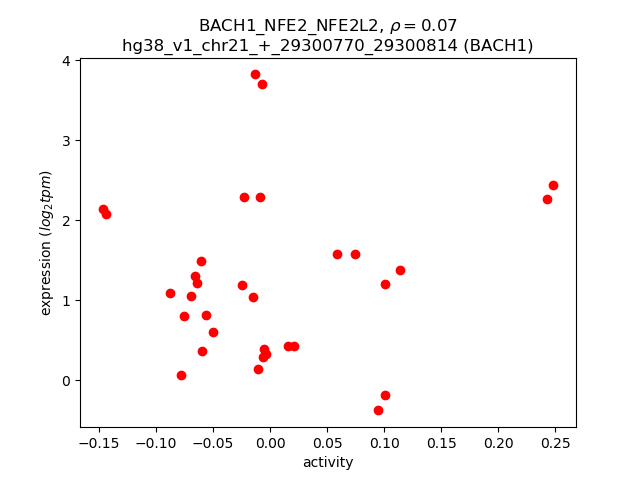
Activity-expression correlation:
| Gene | Promoter | Pearson corr. coef. | P-value | Plot |
|---|---|---|---|---|
| NFE2L2 | hg38_v1_chr2_-_177263418_177263470 | -0.48 | 5.2e-03 | Click! |
| NFE2 | hg38_v1_chr12_-_54295748_54295798 | -0.09 | 6.2e-01 | Click! |
| BACH1 | hg38_v1_chr21_+_29300770_29300814 | 0.07 | 7.0e-01 | Click! |
Activity profile of BACH1_NFE2_NFE2L2 motif
Sorted Z-values of BACH1_NFE2_NFE2L2 motif
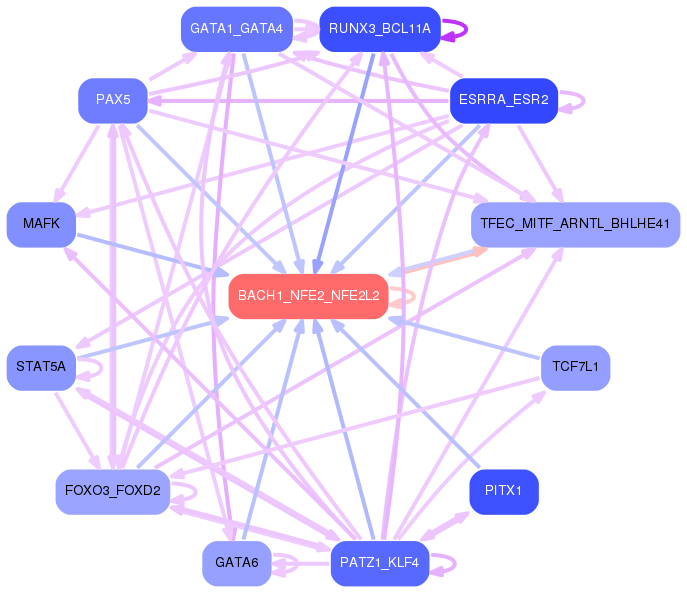
Network of associatons between targets according to the STRING database.

First level regulatory network of BACH1_NFE2_NFE2L2
| Promoter | Score | Transcript | Gene | Gene Info |
|---|---|---|---|---|
| chr16_+_30065777 | 12.32 |
ENST00000395240.7
ENST00000566846.5 |
ALDOA
|
aldolase, fructose-bisphosphate A |
| chr16_+_30065753 | 11.86 |
ENST00000642816.3
ENST00000643777.4 ENST00000569798.5 |
ALDOA
|
aldolase, fructose-bisphosphate A |
| chr5_+_179820876 | 9.55 |
ENST00000626660.1
|
SQSTM1
|
sequestosome 1 |
| chr10_-_75109172 | 7.95 |
ENST00000372700.7
ENST00000473072.2 ENST00000491677.6 ENST00000372702.7 |
DUSP13
|
dual specificity phosphatase 13 |
| chr9_-_114078293 | 7.56 |
ENST00000265132.8
|
AMBP
|
alpha-1-microglobulin/bikunin precursor |
| chr2_-_210315160 | 7.04 |
ENST00000352451.4
|
MYL1
|
myosin light chain 1 |
| chr3_-_48016400 | 6.72 |
ENST00000434267.5
ENST00000683076.1 ENST00000633710.1 |
MAP4
|
microtubule associated protein 4 |
| chr2_+_54115437 | 6.67 |
ENST00000303536.8
ENST00000394666.7 |
ACYP2
|
acylphosphatase 2 |
| chr1_-_51878799 | 6.28 |
ENST00000354831.11
ENST00000544028.5 |
NRDC
|
nardilysin convertase |
| chr12_+_55681711 | 6.12 |
ENST00000394252.4
|
METTL7B
|
methyltransferase like 7B |
| chr11_-_111923722 | 5.90 |
ENST00000527950.5
|
CRYAB
|
crystallin alpha B |
| chr12_+_55681647 | 5.84 |
ENST00000614691.1
|
METTL7B
|
methyltransferase like 7B |
| chr1_-_51878711 | 5.83 |
ENST00000352171.12
|
NRDC
|
nardilysin convertase |
| chr10_-_75109085 | 5.76 |
ENST00000607131.5
|
DUSP13
|
dual specificity phosphatase 13 |
| chr5_+_179820895 | 5.69 |
ENST00000504627.1
ENST00000389805.9 ENST00000510187.5 |
SQSTM1
|
sequestosome 1 |
| chr1_+_160190567 | 5.61 |
ENST00000368078.8
|
CASQ1
|
calsequestrin 1 |
| chr17_+_32444379 | 5.37 |
ENST00000578213.5
ENST00000649012.1 ENST00000457654.6 ENST00000579451.1 ENST00000261712.8 |
PSMD11
|
proteasome 26S subunit, non-ATPase 11 |
| chr10_-_75109106 | 5.18 |
ENST00000607487.5
|
DUSP13
|
dual specificity phosphatase 13 |
| chr17_+_4950147 | 5.02 |
ENST00000522301.5
|
ENO3
|
enolase 3 |
| chr19_+_50203607 | 5.01 |
ENST00000642316.2
ENST00000425460.6 ENST00000440075.6 ENST00000376970.6 ENST00000599920.5 |
MYH14
|
myosin heavy chain 14 |
| chr10_+_133087883 | 4.93 |
ENST00000392607.8
|
ADGRA1
|
adhesion G protein-coupled receptor A1 |
| chr2_-_219253145 | 4.83 |
ENST00000456818.5
ENST00000447205.1 |
TUBA4A
|
tubulin alpha 4a |
| chr11_-_47185840 | 4.43 |
ENST00000539589.5
ENST00000528462.5 |
PACSIN3
|
protein kinase C and casein kinase substrate in neurons 3 |
| chr3_+_42685535 | 4.41 |
ENST00000287777.5
|
KLHL40
|
kelch like family member 40 |
| chr2_+_17878637 | 4.31 |
ENST00000304101.9
|
KCNS3
|
potassium voltage-gated channel modifier subfamily S member 3 |
| chr12_+_10213624 | 4.18 |
ENST00000545290.1
|
GABARAPL1
|
GABA type A receptor associated protein like 1 |
| chr22_+_21015027 | 4.14 |
ENST00000413302.6
ENST00000401443.5 |
P2RX6
|
purinergic receptor P2X 6 |
| chr12_+_10213417 | 4.07 |
ENST00000546017.5
ENST00000535576.5 ENST00000539170.5 |
GABARAPL1
|
GABA type A receptor associated protein like 1 |
| chr2_-_219308963 | 4.01 |
ENST00000423636.6
ENST00000442029.5 ENST00000412847.5 |
PTPRN
|
protein tyrosine phosphatase receptor type N |
| chr3_+_135067530 | 3.95 |
ENST00000493838.1
|
EPHB1
|
EPH receptor B1 |
| chr3_+_184320446 | 3.72 |
ENST00000427607.5
ENST00000457456.5 |
EIF4G1
|
eukaryotic translation initiation factor 4 gamma 1 |
| chr19_-_10502685 | 3.68 |
ENST00000591039.1
ENST00000591419.2 |
KEAP1
|
kelch like ECH associated protein 1 |
| chr12_+_10212483 | 3.68 |
ENST00000545859.5
|
GABARAPL1
|
GABA type A receptor associated protein like 1 |
| chr6_+_54083423 | 3.66 |
ENST00000460844.6
ENST00000370876.6 |
MLIP
|
muscular LMNA interacting protein |
| chr3_-_46566276 | 3.66 |
ENST00000395905.8
|
LRRC2
|
leucine rich repeat containing 2 |
| chr19_-_49155130 | 3.61 |
ENST00000595625.1
|
HRC
|
histidine rich calcium binding protein |
| chr12_+_10212836 | 3.47 |
ENST00000421801.6
ENST00000544284.5 |
GABARAPL1
|
GABA type A receptor associated protein like 1 |
| chr19_-_10502745 | 3.47 |
ENST00000393623.6
|
KEAP1
|
kelch like ECH associated protein 1 |
| chr19_-_49155384 | 3.37 |
ENST00000252825.9
|
HRC
|
histidine rich calcium binding protein |
| chr14_+_58244821 | 3.34 |
ENST00000216455.9
ENST00000412908.6 ENST00000557508.5 |
PSMA3
|
proteasome 20S subunit alpha 3 |
| chr11_+_10456186 | 3.32 |
ENST00000528723.5
|
AMPD3
|
adenosine monophosphate deaminase 3 |
| chr10_+_132066003 | 3.20 |
ENST00000657318.1
ENST00000666210.1 |
JAKMIP3
|
Janus kinase and microtubule interacting protein 3 |
| chr12_-_9999176 | 3.19 |
ENST00000298527.10
ENST00000348658.4 |
CLEC1B
|
C-type lectin domain family 1 member B |
| chr6_-_56954573 | 3.19 |
ENST00000449297.6
|
DST
|
dystonin |
| chr5_-_142685654 | 3.16 |
ENST00000378046.5
ENST00000619447.4 |
FGF1
|
fibroblast growth factor 1 |
| chr2_+_54115396 | 3.16 |
ENST00000406041.5
|
ACYP2
|
acylphosphatase 2 |
| chr6_+_63521738 | 3.15 |
ENST00000648894.1
ENST00000639568.2 |
PTP4A1
|
protein tyrosine phosphatase 4A1 |
| chr12_+_6535278 | 3.15 |
ENST00000396858.5
|
GAPDH
|
glyceraldehyde-3-phosphate dehydrogenase |
| chr19_-_10503186 | 3.09 |
ENST00000592055.2
ENST00000171111.10 |
KEAP1
|
kelch like ECH associated protein 1 |
| chr1_+_207034366 | 3.07 |
ENST00000545806.5
ENST00000618513.4 |
PFKFB2
|
6-phosphofructo-2-kinase/fructose-2,6-biphosphatase 2 |
| chr10_+_68106109 | 3.00 |
ENST00000540630.5
ENST00000354393.6 |
MYPN
|
myopalladin |
| chr10_+_132065937 | 2.97 |
ENST00000658847.1
ENST00000666974.1 |
JAKMIP3
|
Janus kinase and microtubule interacting protein 3 |
| chr10_+_113553039 | 2.87 |
ENST00000351270.4
|
HABP2
|
hyaluronan binding protein 2 |
| chr17_-_35063648 | 2.84 |
ENST00000394597.7
|
RFFL
|
ring finger and FYVE like domain containing E3 ubiquitin protein ligase |
| chr12_+_78964035 | 2.80 |
ENST00000547046.5
|
SYT1
|
synaptotagmin 1 |
| chr1_-_45521854 | 2.75 |
ENST00000372079.1
ENST00000319248.13 |
PRDX1
|
peroxiredoxin 1 |
| chr10_-_91633057 | 2.74 |
ENST00000238994.6
|
PPP1R3C
|
protein phosphatase 1 regulatory subunit 3C |
| chr9_-_83707601 | 2.70 |
ENST00000529923.1
|
UBQLN1
|
ubiquilin 1 |
| chr1_-_114695613 | 2.68 |
ENST00000369538.4
|
AMPD1
|
adenosine monophosphate deaminase 1 |
| chr12_-_122400005 | 2.67 |
ENST00000535290.5
|
CLIP1
|
CAP-Gly domain containing linker protein 1 |
| chr1_-_114695533 | 2.67 |
ENST00000520113.7
|
AMPD1
|
adenosine monophosphate deaminase 1 |
| chr10_+_84139491 | 2.67 |
ENST00000372134.6
|
GHITM
|
growth hormone inducible transmembrane protein |
| chr9_-_83707889 | 2.64 |
ENST00000257468.11
ENST00000376395.9 |
UBQLN1
|
ubiquilin 1 |
| chr5_+_150640678 | 2.61 |
ENST00000519664.1
|
SYNPO
|
synaptopodin |
| chr1_-_45521931 | 2.60 |
ENST00000447184.6
ENST00000262746.5 |
PRDX1
|
peroxiredoxin 1 |
| chr18_-_57586668 | 2.45 |
ENST00000592699.6
ENST00000382873.8 ENST00000262093.11 ENST00000652755.1 |
FECH
|
ferrochelatase |
| chr4_-_993430 | 2.42 |
ENST00000361661.6
ENST00000622731.4 |
SLC26A1
|
solute carrier family 26 member 1 |
| chr3_+_69866236 | 2.41 |
ENST00000451708.5
|
MITF
|
melanocyte inducing transcription factor |
| chr3_+_184320283 | 2.39 |
ENST00000428387.5
ENST00000434061.6 |
EIF4G1
|
eukaryotic translation initiation factor 4 gamma 1 |
| chr9_-_137028271 | 2.37 |
ENST00000265662.9
ENST00000371605.7 |
ABCA2
|
ATP binding cassette subfamily A member 2 |
| chr5_-_138575359 | 2.36 |
ENST00000297185.9
ENST00000678300.1 ENST00000677425.1 ENST00000677064.1 ENST00000507115.6 |
HSPA9
|
heat shock protein family A (Hsp70) member 9 |
| chr16_+_74296789 | 2.33 |
ENST00000219313.9
ENST00000567958.5 ENST00000568615.2 |
PSMD7
|
proteasome 26S subunit, non-ATPase 7 |
| chr6_-_139291987 | 2.30 |
ENST00000358430.8
|
TXLNB
|
taxilin beta |
| chr1_-_93909329 | 2.28 |
ENST00000370238.8
ENST00000615724.1 |
GCLM
|
glutamate-cysteine ligase modifier subunit |
| chr18_+_11857440 | 2.24 |
ENST00000602628.1
|
GNAL
|
G protein subunit alpha L |
| chr3_+_184319677 | 2.20 |
ENST00000441154.5
|
EIF4G1
|
eukaryotic translation initiation factor 4 gamma 1 |
| chr3_+_184299198 | 2.20 |
ENST00000417952.5
ENST00000310118.9 |
PSMD2
|
proteasome 26S subunit, non-ATPase 2 |
| chr2_+_29130653 | 2.10 |
ENST00000438819.1
|
CLIP4
|
CAP-Gly domain containing linker protein family member 4 |
| chr22_+_18906303 | 2.08 |
ENST00000331444.12
ENST00000608842.1 |
DGCR6
|
DiGeorge syndrome critical region gene 6 |
| chr6_-_56954747 | 2.07 |
ENST00000680361.1
|
DST
|
dystonin |
| chr7_-_42932148 | 2.07 |
ENST00000223321.9
ENST00000445517.1 ENST00000677581.1 |
PSMA2
ENSG00000256646.8
|
proteasome 20S subunit alpha 2 novel PSMA2 and C7orf25 readthrough |
| chr12_-_57632668 | 2.05 |
ENST00000552350.5
ENST00000548888.5 |
B4GALNT1
|
beta-1,4-N-acetyl-galactosaminyltransferase 1 |
| chr19_+_34359480 | 2.04 |
ENST00000587521.7
ENST00000587384.6 |
GPI
|
glucose-6-phosphate isomerase |
| chr2_-_219254558 | 2.02 |
ENST00000392088.6
|
TUBA4A
|
tubulin alpha 4a |
| chr14_+_35292308 | 2.00 |
ENST00000628955.1
ENST00000627895.2 ENST00000622405.4 |
PSMA6
|
proteasome 20S subunit alpha 6 |
| chr4_+_155854758 | 2.00 |
ENST00000506072.5
ENST00000507590.5 |
TDO2
|
tryptophan 2,3-dioxygenase |
| chr12_-_124917340 | 1.99 |
ENST00000542416.1
|
UBC
|
ubiquitin C |
| chr10_-_125816596 | 1.97 |
ENST00000368786.5
|
UROS
|
uroporphyrinogen III synthase |
| chr20_+_10218948 | 1.95 |
ENST00000430336.1
|
SNAP25
|
synaptosome associated protein 25 |
| chr18_-_77127935 | 1.89 |
ENST00000581878.5
|
MBP
|
myelin basic protein |
| chr10_-_125816510 | 1.80 |
ENST00000650587.1
|
UROS
|
uroporphyrinogen III synthase |
| chr19_-_38899800 | 1.79 |
ENST00000414941.5
ENST00000358931.9 ENST00000392081.6 |
SIRT2
|
sirtuin 2 |
| chr9_-_26946983 | 1.78 |
ENST00000523212.1
|
PLAA
|
phospholipase A2 activating protein |
| chr14_+_35292374 | 1.77 |
ENST00000261479.9
ENST00000553809.5 |
PSMA6
|
proteasome 20S subunit alpha 6 |
| chr8_-_143939543 | 1.75 |
ENST00000345136.8
|
PLEC
|
plectin |
| chr20_-_653189 | 1.74 |
ENST00000381962.4
|
SRXN1
|
sulfiredoxin 1 |
| chr3_+_184186023 | 1.73 |
ENST00000429586.6
ENST00000292808.5 |
ABCF3
|
ATP binding cassette subfamily F member 3 |
| chr9_-_137028223 | 1.73 |
ENST00000341511.11
|
ABCA2
|
ATP binding cassette subfamily A member 2 |
| chr22_-_19478931 | 1.72 |
ENST00000494054.1
|
UFD1
|
ubiquitin recognition factor in ER associated degradation 1 |
| chr14_+_35292429 | 1.67 |
ENST00000555764.5
ENST00000556506.1 |
PSMA6
|
proteasome 20S subunit alpha 6 |
| chr6_-_154356735 | 1.63 |
ENST00000367220.8
ENST00000265198.8 ENST00000520261.1 |
IPCEF1
|
interaction protein for cytohesin exchange factors 1 |
| chr12_-_57632641 | 1.60 |
ENST00000418555.6
|
B4GALNT1
|
beta-1,4-N-acetyl-galactosaminyltransferase 1 |
| chr19_-_38899710 | 1.60 |
ENST00000447739.1
ENST00000407552.5 |
SIRT2
|
sirtuin 2 |
| chr14_-_23155302 | 1.60 |
ENST00000529705.6
|
SLC7A8
|
solute carrier family 7 member 8 |
| chr9_-_26947222 | 1.57 |
ENST00000520884.5
ENST00000397292.8 |
PLAA
|
phospholipase A2 activating protein |
| chr20_+_62302896 | 1.56 |
ENST00000620230.4
ENST00000253003.7 |
ADRM1
|
adhesion regulating molecule 1 |
| chr4_-_100190782 | 1.56 |
ENST00000513992.1
|
DDIT4L
|
DNA damage inducible transcript 4 like |
| chr3_+_69866217 | 1.55 |
ENST00000314589.10
|
MITF
|
melanocyte inducing transcription factor |
| chr3_-_150022799 | 1.52 |
ENST00000649949.1
ENST00000494827.5 |
PFN2
|
profilin 2 |
| chr11_+_62707668 | 1.50 |
ENST00000294117.6
|
GNG3
|
G protein subunit gamma 3 |
| chr11_-_14520429 | 1.50 |
ENST00000533068.5
|
PSMA1
|
proteasome 20S subunit alpha 1 |
| chr12_-_124915303 | 1.50 |
ENST00000538617.5
ENST00000536769.1 |
UBC
|
ubiquitin C |
| chr18_-_56638427 | 1.49 |
ENST00000586262.5
ENST00000217515.11 |
TXNL1
|
thioredoxin like 1 |
| chr17_+_21288029 | 1.49 |
ENST00000526076.6
ENST00000361818.9 ENST00000316920.10 |
MAP2K3
|
mitogen-activated protein kinase kinase 3 |
| chr6_-_105137147 | 1.47 |
ENST00000314641.10
|
BVES
|
blood vessel epicardial substance |
| chr2_+_71453722 | 1.46 |
ENST00000409582.7
ENST00000409762.5 ENST00000413539.6 ENST00000429174.6 |
DYSF
|
dysferlin |
| chr19_-_15934853 | 1.43 |
ENST00000620614.4
ENST00000248041.12 |
CYP4F11
|
cytochrome P450 family 4 subfamily F member 11 |
| chr15_-_101334157 | 1.42 |
ENST00000632686.1
|
PCSK6
|
proprotein convertase subtilisin/kexin type 6 |
| chr21_+_31659666 | 1.42 |
ENST00000389995.4
ENST00000270142.11 |
SOD1
|
superoxide dismutase 1 |
| chr5_+_161848112 | 1.42 |
ENST00000393943.10
|
GABRA1
|
gamma-aminobutyric acid type A receptor subunit alpha1 |
| chr19_-_38899529 | 1.41 |
ENST00000249396.12
ENST00000437828.5 |
SIRT2
|
sirtuin 2 |
| chr1_-_109426410 | 1.38 |
ENST00000271308.9
|
PSMA5
|
proteasome 20S subunit alpha 5 |
| chr8_+_122863385 | 1.38 |
ENST00000534247.1
|
ZHX2
|
zinc fingers and homeoboxes 2 |
| chr11_+_27055215 | 1.36 |
ENST00000525090.1
|
BBOX1
|
gamma-butyrobetaine hydroxylase 1 |
| chr22_-_45212354 | 1.36 |
ENST00000492273.1
|
KIAA0930
|
KIAA0930 |
| chr21_-_15065815 | 1.36 |
ENST00000638122.1
|
NRIP1
|
nuclear receptor interacting protein 1 |
| chr16_+_8642375 | 1.35 |
ENST00000562973.1
|
METTL22
|
methyltransferase like 22 |
| chr8_-_42502496 | 1.34 |
ENST00000522707.1
|
SLC20A2
|
solute carrier family 20 member 2 |
| chr1_+_75786214 | 1.33 |
ENST00000370826.3
|
RABGGTB
|
Rab geranylgeranyltransferase subunit beta |
| chr4_-_44448796 | 1.32 |
ENST00000360029.4
|
KCTD8
|
potassium channel tetramerization domain containing 8 |
| chr1_+_75786246 | 1.32 |
ENST00000319942.8
|
RABGGTB
|
Rab geranylgeranyltransferase subunit beta |
| chr1_-_31239880 | 1.32 |
ENST00000373736.7
|
NKAIN1
|
sodium/potassium transporting ATPase interacting 1 |
| chr19_-_15934521 | 1.31 |
ENST00000402119.9
|
CYP4F11
|
cytochrome P450 family 4 subfamily F member 11 |
| chr17_-_7614824 | 1.31 |
ENST00000571597.1
ENST00000250113.12 |
FXR2
|
FMR1 autosomal homolog 2 |
| chr14_-_81221231 | 1.31 |
ENST00000434192.2
|
GTF2A1
|
general transcription factor IIA subunit 1 |
| chr9_+_34992849 | 1.30 |
ENST00000443266.2
|
DNAJB5
|
DnaJ heat shock protein family (Hsp40) member B5 |
| chr3_-_120647018 | 1.29 |
ENST00000475447.2
|
HGD
|
homogentisate 1,2-dioxygenase |
| chr6_-_83431038 | 1.28 |
ENST00000369705.4
|
ME1
|
malic enzyme 1 |
| chr14_-_23034878 | 1.27 |
ENST00000493471.2
ENST00000460922.2 ENST00000361611.11 |
PSMB5
|
proteasome 20S subunit beta 5 |
| chr22_+_20021123 | 1.25 |
ENST00000401833.5
ENST00000434168.5 |
TANGO2
|
transport and golgi organization 2 homolog |
| chr2_+_201122477 | 1.24 |
ENST00000425030.1
|
CFLAR
|
CASP8 and FADD like apoptosis regulator |
| chr4_-_100190458 | 1.24 |
ENST00000273990.6
|
DDIT4L
|
DNA damage inducible transcript 4 like |
| chr9_-_111483657 | 1.23 |
ENST00000602447.5
|
ECPAS
|
Ecm29 proteasome adaptor and scaffold |
| chr16_-_1378989 | 1.21 |
ENST00000513783.1
|
UNKL
|
unk like zinc finger |
| chr1_-_114757958 | 1.20 |
ENST00000525132.1
|
CSDE1
|
cold shock domain containing E1 |
| chr4_-_83012846 | 1.17 |
ENST00000510557.5
|
LIN54
|
lin-54 DREAM MuvB core complex component |
| chr3_+_100334780 | 1.16 |
ENST00000497785.1
|
NIT2
|
nitrilase family member 2 |
| chr9_-_35072561 | 1.16 |
ENST00000678650.1
|
VCP
|
valosin containing protein |
| chr20_-_44210697 | 1.14 |
ENST00000255174.3
|
OSER1
|
oxidative stress responsive serine rich 1 |
| chr6_+_116100813 | 1.12 |
ENST00000419791.3
ENST00000319550.9 |
NT5DC1
|
5'-nucleotidase domain containing 1 |
| chr1_-_17045219 | 1.11 |
ENST00000491274.5
|
SDHB
|
succinate dehydrogenase complex iron sulfur subunit B |
| chr3_-_170586056 | 1.09 |
ENST00000231706.6
|
SLC7A14
|
solute carrier family 7 member 14 |
| chr19_+_34359724 | 1.09 |
ENST00000592277.5
|
GPI
|
glucose-6-phosphate isomerase |
| chr6_-_31777319 | 1.05 |
ENST00000375688.5
|
VWA7
|
von Willebrand factor A domain containing 7 |
| chr17_-_81637049 | 1.05 |
ENST00000374747.9
ENST00000331134.11 |
NPLOC4
|
NPL4 homolog, ubiquitin recognition factor |
| chr16_+_30407572 | 1.03 |
ENST00000319296.10
ENST00000566625.2 |
ZNF771
|
zinc finger protein 771 |
| chr16_+_83953232 | 1.02 |
ENST00000565123.5
ENST00000393306.6 |
OSGIN1
|
oxidative stress induced growth inhibitor 1 |
| chr9_-_70414657 | 1.02 |
ENST00000377126.4
|
KLF9
|
Kruppel like factor 9 |
| chr3_+_46163465 | 1.01 |
ENST00000357422.2
|
CCR3
|
C-C motif chemokine receptor 3 |
| chr19_+_18588789 | 1.01 |
ENST00000450195.6
ENST00000358607.11 |
REX1BD
|
required for excision 1-B domain containing |
| chr8_-_30727777 | 1.01 |
ENST00000537535.5
ENST00000541648.5 ENST00000546342.5 ENST00000221130.11 |
GSR
|
glutathione-disulfide reductase |
| chr3_-_71725365 | 0.98 |
ENST00000425534.8
|
EIF4E3
|
eukaryotic translation initiation factor 4E family member 3 |
| chr9_+_72577939 | 0.98 |
ENST00000645773.1
|
TMC1
|
transmembrane channel like 1 |
| chr11_+_119087979 | 0.98 |
ENST00000535253.5
ENST00000392841.1 ENST00000648374.1 |
HMBS
|
hydroxymethylbilane synthase |
| chr19_-_50719761 | 0.97 |
ENST00000293441.6
|
SHANK1
|
SH3 and multiple ankyrin repeat domains 1 |
| chr16_+_22297375 | 0.97 |
ENST00000615879.4
ENST00000299853.10 ENST00000564209.5 ENST00000565358.5 ENST00000418581.6 ENST00000564883.5 ENST00000359210.8 ENST00000563024.5 |
POLR3E
|
RNA polymerase III subunit E |
| chr7_-_19773569 | 0.96 |
ENST00000422233.5
ENST00000433641.5 ENST00000405844.6 |
TMEM196
|
transmembrane protein 196 |
| chr3_+_120596313 | 0.96 |
ENST00000485064.1
ENST00000184266.3 ENST00000492739.1 |
NDUFB4
|
NADH:ubiquinone oxidoreductase subunit B4 |
| chr17_+_2594148 | 0.96 |
ENST00000675331.1
|
PAFAH1B1
|
platelet activating factor acetylhydrolase 1b regulatory subunit 1 |
| chr10_-_75235917 | 0.96 |
ENST00000469299.1
ENST00000372538.8 |
COMTD1
|
catechol-O-methyltransferase domain containing 1 |
| chr2_+_231056845 | 0.96 |
ENST00000677230.1
ENST00000677259.1 ENST00000677180.1 ENST00000409643.6 ENST00000619128.5 ENST00000678679.1 ENST00000676740.1 ENST00000308696.11 ENST00000440838.5 ENST00000373635.9 |
PSMD1
|
proteasome 26S subunit, non-ATPase 1 |
| chr11_-_14520323 | 0.96 |
ENST00000530457.5
ENST00000532256.1 ENST00000396394.7 |
PSMA1
|
proteasome 20S subunit alpha 1 |
| chr12_-_70788914 | 0.95 |
ENST00000342084.8
|
PTPRR
|
protein tyrosine phosphatase receptor type R |
| chr4_+_87007175 | 0.95 |
ENST00000511722.5
|
AFF1
|
AF4/FMR2 family member 1 |
| chr8_-_143950876 | 0.95 |
ENST00000322810.8
|
PLEC
|
plectin |
| chrX_+_56563569 | 0.95 |
ENST00000338222.7
|
UBQLN2
|
ubiquilin 2 |
| chr18_+_158513 | 0.93 |
ENST00000400266.7
ENST00000580410.5 ENST00000261601.8 ENST00000383589.6 |
USP14
|
ubiquitin specific peptidase 14 |
| chr17_+_2593925 | 0.93 |
ENST00000674717.1
ENST00000676353.1 ENST00000675202.1 ENST00000674608.1 ENST00000676098.1 |
PAFAH1B1
|
platelet activating factor acetylhydrolase 1b regulatory subunit 1 |
| chr9_-_127874964 | 0.93 |
ENST00000373156.5
|
AK1
|
adenylate kinase 1 |
| chr10_-_73414027 | 0.92 |
ENST00000372921.10
ENST00000372919.8 |
ANXA7
|
annexin A7 |
| chr11_+_62881686 | 0.92 |
ENST00000536981.6
ENST00000539891.6 |
SLC3A2
|
solute carrier family 3 member 2 |
| chr16_+_87392327 | 0.89 |
ENST00000565788.1
ENST00000268607.10 |
MAP1LC3B
|
microtubule associated protein 1 light chain 3 beta |
| chr19_+_38374758 | 0.89 |
ENST00000585598.1
ENST00000602911.5 ENST00000592561.5 |
PSMD8
|
proteasome 26S subunit, non-ATPase 8 |
| chr1_-_206771182 | 0.89 |
ENST00000471071.1
|
IL10
|
interleukin 10 |
| chr2_+_1413456 | 0.88 |
ENST00000539820.5
ENST00000382269.7 ENST00000345913.8 ENST00000329066.9 ENST00000382201.7 |
TPO
|
thyroid peroxidase |
| chr1_+_213989691 | 0.86 |
ENST00000607425.1
|
PROX1
|
prospero homeobox 1 |
| chrX_-_20141810 | 0.86 |
ENST00000379593.1
ENST00000379607.10 |
EIF1AX
|
eukaryotic translation initiation factor 1A X-linked |
| chr4_-_993376 | 0.86 |
ENST00000398520.6
ENST00000398516.3 |
SLC26A1
|
solute carrier family 26 member 1 |
| chr11_+_60931744 | 0.85 |
ENST00000536409.1
|
TMEM132A
|
transmembrane protein 132A |
| chr10_+_104254915 | 0.85 |
ENST00000445155.5
|
GSTO1
|
glutathione S-transferase omega 1 |
| chr7_+_142389143 | 0.85 |
ENST00000390362.1
|
TRBV5-3
|
T cell receptor beta variable 5-3 (non-functional) |
| chrX_+_22136552 | 0.84 |
ENST00000682888.1
ENST00000684356.1 |
PHEX
|
phosphate regulating endopeptidase homolog X-linked |
| chr18_-_37485747 | 0.83 |
ENST00000589229.5
ENST00000587819.5 |
CELF4
|
CUGBP Elav-like family member 4 |
| chr14_+_20223710 | 0.82 |
ENST00000315519.3
|
OR11H6
|
olfactory receptor family 11 subfamily H member 6 |
| chr12_+_49346885 | 0.82 |
ENST00000549441.7
|
DNAJC22
|
DnaJ heat shock protein family (Hsp40) member C22 |
| chr16_+_2482983 | 0.82 |
ENST00000562105.2
|
TBC1D24
|
TBC1 domain family member 24 |
| chr6_-_166168700 | 0.81 |
ENST00000366871.7
|
TBXT
|
T-box transcription factor T |
| chr7_+_131110119 | 0.80 |
ENST00000416992.6
|
MKLN1
|
muskelin 1 |
| chr19_+_38374557 | 0.80 |
ENST00000215071.9
|
PSMD8
|
proteasome 26S subunit, non-ATPase 8 |
| chr6_-_166168645 | 0.80 |
ENST00000461348.2
|
TBXT
|
T-box transcription factor T |
Gene Ontology Analysis
Gene overrepresentation in biological process category:
| Log-likelihood per target | Total log-likelihood | Term | Description |
|---|---|---|---|
| 2.3 | 7.0 | GO:1901899 | positive regulation of relaxation of cardiac muscle(GO:1901899) |
| 1.6 | 4.8 | GO:0061433 | cellular response to caloric restriction(GO:0061433) negative regulation of oligodendrocyte progenitor proliferation(GO:0070446) |
| 1.3 | 4.0 | GO:1904692 | positive regulation of type B pancreatic cell proliferation(GO:1904692) |
| 1.3 | 3.9 | GO:0099557 | trans-synaptic signaling by trans-synaptic complex, modulating synaptic transmission(GO:0099557) |
| 1.2 | 24.2 | GO:0030388 | fructose 1,6-bisphosphate metabolic process(GO:0030388) |
| 1.0 | 6.7 | GO:0051012 | microtubule sliding(GO:0051012) |
| 0.9 | 3.8 | GO:0071418 | cellular response to amine stimulus(GO:0071418) |
| 0.8 | 2.5 | GO:0070541 | response to platinum ion(GO:0070541) |
| 0.8 | 8.7 | GO:0032264 | IMP salvage(GO:0032264) |
| 0.8 | 3.1 | GO:0035606 | peptidyl-cysteine S-trans-nitrosylation(GO:0035606) |
| 0.8 | 15.2 | GO:0061635 | regulation of protein complex stability(GO:0061635) |
| 0.7 | 4.4 | GO:0098528 | skeletal muscle fiber differentiation(GO:0098528) |
| 0.7 | 1.4 | GO:0032902 | nerve growth factor production(GO:0032902) |
| 0.7 | 16.2 | GO:0006995 | cellular response to nitrogen starvation(GO:0006995) cellular response to nitrogen levels(GO:0043562) |
| 0.7 | 2.7 | GO:0042361 | menaquinone catabolic process(GO:0042361) vitamin K catabolic process(GO:0042377) |
| 0.7 | 10.2 | GO:0010499 | proteasomal ubiquitin-independent protein catabolic process(GO:0010499) |
| 0.7 | 5.3 | GO:0034140 | negative regulation of toll-like receptor 3 signaling pathway(GO:0034140) aggrephagy(GO:0035973) |
| 0.7 | 2.0 | GO:0019442 | tryptophan catabolic process to acetyl-CoA(GO:0019442) |
| 0.6 | 1.9 | GO:0090176 | microtubule cytoskeleton organization involved in establishment of planar polarity(GO:0090176) |
| 0.6 | 3.1 | GO:0019242 | methylglyoxal biosynthetic process(GO:0019242) |
| 0.6 | 4.1 | GO:0032377 | regulation of intracellular lipid transport(GO:0032377) regulation of intracellular sterol transport(GO:0032380) regulation of intracellular cholesterol transport(GO:0032383) |
| 0.6 | 7.6 | GO:0033015 | porphyrin-containing compound catabolic process(GO:0006787) tetrapyrrole catabolic process(GO:0033015) heme catabolic process(GO:0042167) pigment catabolic process(GO:0046149) |
| 0.6 | 16.5 | GO:0051044 | positive regulation of membrane protein ectodomain proteolysis(GO:0051044) |
| 0.6 | 2.8 | GO:0097069 | cellular response to thyroxine stimulus(GO:0097069) cellular response to L-phenylalanine derivative(GO:1904387) |
| 0.6 | 2.2 | GO:1990926 | short-term synaptic potentiation(GO:1990926) |
| 0.6 | 8.3 | GO:0002191 | cap-dependent translational initiation(GO:0002191) |
| 0.5 | 1.6 | GO:0014810 | positive regulation of skeletal muscle contraction by regulation of release of sequestered calcium ion(GO:0014810) |
| 0.5 | 9.4 | GO:0043248 | proteasome assembly(GO:0043248) |
| 0.5 | 1.5 | GO:0060931 | sinoatrial node cell development(GO:0060931) |
| 0.5 | 2.8 | GO:2001271 | negative regulation of cysteine-type endopeptidase activity involved in execution phase of apoptosis(GO:2001271) |
| 0.5 | 2.4 | GO:1902037 | negative regulation of hematopoietic stem cell differentiation(GO:1902037) |
| 0.5 | 6.1 | GO:0014809 | regulation of skeletal muscle contraction by regulation of release of sequestered calcium ion(GO:0014809) |
| 0.5 | 2.8 | GO:0098746 | fast, calcium ion-dependent exocytosis of neurotransmitter(GO:0098746) |
| 0.5 | 1.4 | GO:0001543 | ovarian follicle rupture(GO:0001543) |
| 0.4 | 2.7 | GO:0044861 | protein transport into plasma membrane raft(GO:0044861) |
| 0.4 | 3.1 | GO:0033133 | positive regulation of glucokinase activity(GO:0033133) positive regulation of hexokinase activity(GO:1903301) |
| 0.4 | 2.3 | GO:0098886 | modification of dendritic spine(GO:0098886) |
| 0.4 | 1.2 | GO:1903004 | flavin adenine dinucleotide metabolic process(GO:0072387) regulation of protein K63-linked deubiquitination(GO:1903004) positive regulation of protein K63-linked deubiquitination(GO:1903006) |
| 0.3 | 3.7 | GO:0030259 | lipid glycosylation(GO:0030259) |
| 0.3 | 6.7 | GO:0008090 | retrograde axonal transport(GO:0008090) |
| 0.3 | 3.3 | GO:0050428 | purine ribonucleoside bisphosphate biosynthetic process(GO:0034036) 3'-phosphoadenosine 5'-phosphosulfate biosynthetic process(GO:0050428) |
| 0.3 | 1.0 | GO:0018160 | peptidyl-pyrromethane cofactor linkage(GO:0018160) |
| 0.3 | 9.2 | GO:0010992 | ubiquitin homeostasis(GO:0010992) |
| 0.3 | 1.3 | GO:0006117 | acetaldehyde metabolic process(GO:0006117) |
| 0.3 | 1.9 | GO:1904209 | regulation of chemokine (C-C motif) ligand 2 secretion(GO:1904207) positive regulation of chemokine (C-C motif) ligand 2 secretion(GO:1904209) |
| 0.3 | 0.9 | GO:0090410 | malonate catabolic process(GO:0090410) |
| 0.3 | 0.9 | GO:0060302 | negative regulation of interleukin-18 production(GO:0032701) negative regulation of cytokine activity(GO:0060302) negative regulation of chemokine (C-C motif) ligand 5 production(GO:0071650) |
| 0.3 | 0.9 | GO:0043049 | hepatocyte cell migration(GO:0002194) otic placode formation(GO:0043049) branching involved in pancreas morphogenesis(GO:0061114) acinar cell differentiation(GO:0090425) positive regulation of forebrain neuron differentiation(GO:2000979) |
| 0.3 | 0.9 | GO:0097536 | thymus epithelium morphogenesis(GO:0097536) |
| 0.3 | 1.9 | GO:0070966 | nuclear-transcribed mRNA catabolic process, no-go decay(GO:0070966) |
| 0.3 | 5.9 | GO:0007021 | tubulin complex assembly(GO:0007021) |
| 0.2 | 3.2 | GO:0060681 | branch elongation involved in ureteric bud branching(GO:0060681) |
| 0.2 | 2.7 | GO:0018344 | protein geranylgeranylation(GO:0018344) |
| 0.2 | 0.9 | GO:1900186 | negative regulation of clathrin-mediated endocytosis(GO:1900186) |
| 0.2 | 26.7 | GO:0002479 | antigen processing and presentation of exogenous peptide antigen via MHC class I, TAP-dependent(GO:0002479) |
| 0.2 | 1.2 | GO:1903070 | negative regulation of ER-associated ubiquitin-dependent protein catabolic process(GO:1903070) |
| 0.2 | 1.1 | GO:0035513 | oxidative RNA demethylation(GO:0035513) oxidative single-stranded RNA demethylation(GO:0035553) |
| 0.2 | 0.7 | GO:0001978 | regulation of systemic arterial blood pressure by carotid sinus baroreceptor feedback(GO:0001978) baroreceptor response to increased systemic arterial blood pressure(GO:0001983) positive regulation of the force of heart contraction by chemical signal(GO:0003099) |
| 0.2 | 0.6 | GO:0015734 | taurine transport(GO:0015734) |
| 0.2 | 0.6 | GO:1904106 | protein localization to microvillus(GO:1904106) |
| 0.2 | 3.4 | GO:0039536 | negative regulation of RIG-I signaling pathway(GO:0039536) |
| 0.2 | 0.4 | GO:1902995 | regulation of phospholipid efflux(GO:1902994) positive regulation of phospholipid efflux(GO:1902995) |
| 0.2 | 1.3 | GO:1902031 | regulation of NADP metabolic process(GO:1902031) |
| 0.2 | 6.2 | GO:0042744 | hydrogen peroxide catabolic process(GO:0042744) |
| 0.2 | 3.0 | GO:0048739 | cardiac muscle fiber development(GO:0048739) |
| 0.1 | 0.4 | GO:0034395 | regulation of transcription from RNA polymerase II promoter in response to iron(GO:0034395) spleen trabecula formation(GO:0060345) iron cation export(GO:1903414) ferrous iron export(GO:1903988) |
| 0.1 | 0.8 | GO:1904383 | response to sodium phosphate(GO:1904383) |
| 0.1 | 1.0 | GO:0050893 | sensory processing(GO:0050893) |
| 0.1 | 1.0 | GO:1903385 | regulation of homophilic cell adhesion(GO:1903385) |
| 0.1 | 1.5 | GO:0035897 | proteolysis in other organism(GO:0035897) |
| 0.1 | 0.9 | GO:0060356 | leucine import(GO:0060356) |
| 0.1 | 1.3 | GO:0006572 | tyrosine catabolic process(GO:0006572) |
| 0.1 | 0.5 | GO:0050883 | musculoskeletal movement, spinal reflex action(GO:0050883) |
| 0.1 | 1.0 | GO:0051414 | response to cortisol(GO:0051414) |
| 0.1 | 0.8 | GO:1903904 | negative regulation of establishment of T cell polarity(GO:1903904) negative regulation of Rho guanyl-nucleotide exchange factor activity(GO:2001107) |
| 0.1 | 1.2 | GO:0060005 | vestibular reflex(GO:0060005) |
| 0.1 | 0.4 | GO:0046725 | negative regulation by virus of viral protein levels in host cell(GO:0046725) negative regulation of metanephric nephron tubule epithelial cell differentiation(GO:0072308) |
| 0.1 | 5.0 | GO:0035590 | purinergic nucleotide receptor signaling pathway(GO:0035590) |
| 0.1 | 5.0 | GO:0070584 | mitochondrion morphogenesis(GO:0070584) |
| 0.1 | 1.2 | GO:0006528 | asparagine metabolic process(GO:0006528) |
| 0.1 | 1.5 | GO:0001778 | plasma membrane repair(GO:0001778) |
| 0.1 | 5.0 | GO:0006735 | NADH regeneration(GO:0006735) canonical glycolysis(GO:0061621) glucose catabolic process to pyruvate(GO:0061718) |
| 0.1 | 0.6 | GO:1900226 | negative regulation of NLRP3 inflammasome complex assembly(GO:1900226) |
| 0.1 | 0.3 | GO:0006714 | sesquiterpenoid metabolic process(GO:0006714) sesquiterpenoid catabolic process(GO:0016107) farnesol metabolic process(GO:0016487) farnesol catabolic process(GO:0016488) |
| 0.1 | 1.4 | GO:0045329 | carnitine biosynthetic process(GO:0045329) |
| 0.1 | 1.5 | GO:1900028 | negative regulation of ruffle assembly(GO:1900028) |
| 0.1 | 19.4 | GO:0035335 | peptidyl-tyrosine dephosphorylation(GO:0035335) |
| 0.1 | 1.2 | GO:1903944 | regulation of hepatocyte apoptotic process(GO:1903943) negative regulation of hepatocyte apoptotic process(GO:1903944) |
| 0.1 | 7.0 | GO:0030049 | muscle filament sliding(GO:0030049) actin-myosin filament sliding(GO:0033275) |
| 0.1 | 0.7 | GO:0070494 | regulation of thrombin receptor signaling pathway(GO:0070494) negative regulation of thrombin receptor signaling pathway(GO:0070495) |
| 0.1 | 0.3 | GO:1901388 | regulation of transforming growth factor beta activation(GO:1901388) negative regulation of transforming growth factor beta activation(GO:1901389) |
| 0.1 | 0.3 | GO:0071348 | cellular response to interleukin-11(GO:0071348) |
| 0.1 | 0.4 | GO:0060611 | mammary gland fat development(GO:0060611) regulation of macrophage colony-stimulating factor signaling pathway(GO:1902226) positive regulation of macrophage colony-stimulating factor signaling pathway(GO:1902228) regulation of response to macrophage colony-stimulating factor(GO:1903969) positive regulation of response to macrophage colony-stimulating factor(GO:1903971) regulation of cellular response to macrophage colony-stimulating factor stimulus(GO:1903972) positive regulation of cellular response to macrophage colony-stimulating factor stimulus(GO:1903974) microglial cell migration(GO:1904124) regulation of microglial cell migration(GO:1904139) positive regulation of microglial cell migration(GO:1904141) |
| 0.1 | 0.9 | GO:0000160 | phosphorelay signal transduction system(GO:0000160) |
| 0.1 | 0.5 | GO:0000117 | regulation of transcription involved in G2/M transition of mitotic cell cycle(GO:0000117) |
| 0.1 | 0.7 | GO:0006642 | triglyceride mobilization(GO:0006642) |
| 0.1 | 0.8 | GO:0006777 | Mo-molybdopterin cofactor biosynthetic process(GO:0006777) Mo-molybdopterin cofactor metabolic process(GO:0019720) |
| 0.1 | 1.3 | GO:0044341 | sodium-dependent phosphate transport(GO:0044341) |
| 0.1 | 0.7 | GO:0021633 | optic nerve structural organization(GO:0021633) |
| 0.1 | 1.0 | GO:0001887 | selenium compound metabolic process(GO:0001887) |
| 0.1 | 4.0 | GO:2000144 | positive regulation of DNA-templated transcription, initiation(GO:2000144) |
| 0.1 | 0.4 | GO:1905167 | positive regulation of lysosomal protein catabolic process(GO:1905167) |
| 0.1 | 0.3 | GO:0061394 | positive regulation of transcription from RNA polymerase II promoter in response to oxidative stress(GO:0036091) regulation of transcription from RNA polymerase II promoter in response to arsenic-containing substance(GO:0061394) |
| 0.1 | 0.4 | GO:0010847 | regulation of chromatin assembly(GO:0010847) |
| 0.1 | 0.5 | GO:2000035 | regulation of stem cell division(GO:2000035) |
| 0.1 | 0.5 | GO:0021937 | cerebellar Purkinje cell-granule cell precursor cell signaling involved in regulation of granule cell precursor cell proliferation(GO:0021937) |
| 0.1 | 3.2 | GO:0030220 | platelet formation(GO:0030220) |
| 0.1 | 0.5 | GO:0048165 | ovarian cumulus expansion(GO:0001550) fused antrum stage(GO:0048165) negative regulation of chondrocyte proliferation(GO:1902731) |
| 0.1 | 2.2 | GO:0007191 | adenylate cyclase-activating dopamine receptor signaling pathway(GO:0007191) |
| 0.1 | 0.8 | GO:1902866 | regulation of retina development in camera-type eye(GO:1902866) |
| 0.1 | 0.8 | GO:0016559 | peroxisome fission(GO:0016559) |
| 0.1 | 0.5 | GO:0061511 | centriole elongation(GO:0061511) |
| 0.1 | 0.6 | GO:2001288 | positive regulation of caveolin-mediated endocytosis(GO:2001288) |
| 0.1 | 0.2 | GO:0030718 | inner cell mass cell fate commitment(GO:0001827) germ-line stem cell population maintenance(GO:0030718) |
| 0.1 | 0.4 | GO:0045425 | positive regulation of granulocyte macrophage colony-stimulating factor biosynthetic process(GO:0045425) |
| 0.1 | 0.9 | GO:0070389 | chaperone cofactor-dependent protein refolding(GO:0070389) |
| 0.0 | 1.4 | GO:0071420 | cellular response to histamine(GO:0071420) |
| 0.0 | 1.5 | GO:0034389 | lipid particle organization(GO:0034389) |
| 0.0 | 1.1 | GO:0006105 | succinate metabolic process(GO:0006105) |
| 0.0 | 0.6 | GO:0046322 | negative regulation of fatty acid oxidation(GO:0046322) |
| 0.0 | 0.2 | GO:0048388 | endosomal lumen acidification(GO:0048388) |
| 0.0 | 0.3 | GO:0032484 | Ral protein signal transduction(GO:0032484) regulation of Ral protein signal transduction(GO:0032485) |
| 0.0 | 0.5 | GO:0036155 | acylglycerol acyl-chain remodeling(GO:0036155) |
| 0.0 | 1.7 | GO:0015695 | organic cation transport(GO:0015695) |
| 0.0 | 0.3 | GO:0038165 | oncostatin-M-mediated signaling pathway(GO:0038165) |
| 0.0 | 0.2 | GO:0001555 | oocyte growth(GO:0001555) |
| 0.0 | 0.7 | GO:0090435 | protein localization to nuclear envelope(GO:0090435) |
| 0.0 | 0.3 | GO:0002036 | regulation of L-glutamate transport(GO:0002036) |
| 0.0 | 0.3 | GO:2000210 | positive regulation of anoikis(GO:2000210) |
| 0.0 | 0.1 | GO:0070564 | positive regulation of vitamin D receptor signaling pathway(GO:0070564) |
| 0.0 | 0.3 | GO:0001915 | negative regulation of T cell mediated cytotoxicity(GO:0001915) |
| 0.0 | 0.3 | GO:0071109 | superior temporal gyrus development(GO:0071109) |
| 0.0 | 0.7 | GO:0034975 | protein folding in endoplasmic reticulum(GO:0034975) |
| 0.0 | 0.4 | GO:0016127 | cholesterol catabolic process(GO:0006707) sterol catabolic process(GO:0016127) |
| 0.0 | 0.2 | GO:0000720 | pyrimidine dimer repair by nucleotide-excision repair(GO:0000720) |
| 0.0 | 2.7 | GO:0005978 | glycogen biosynthetic process(GO:0005978) glucan biosynthetic process(GO:0009250) |
| 0.0 | 0.1 | GO:0014886 | transition between slow and fast fiber(GO:0014886) |
| 0.0 | 0.9 | GO:0006884 | cell volume homeostasis(GO:0006884) |
| 0.0 | 0.1 | GO:0008588 | release of cytoplasmic sequestered NF-kappaB(GO:0008588) |
| 0.0 | 0.8 | GO:0008053 | mitochondrial fusion(GO:0008053) |
| 0.0 | 0.5 | GO:0045821 | positive regulation of glycolytic process(GO:0045821) positive regulation of cofactor metabolic process(GO:0051194) positive regulation of coenzyme metabolic process(GO:0051197) |
| 0.0 | 0.3 | GO:0035457 | cellular response to interferon-alpha(GO:0035457) |
| 0.0 | 0.3 | GO:0051106 | positive regulation of DNA ligation(GO:0051106) |
| 0.0 | 0.9 | GO:0031581 | hemidesmosome assembly(GO:0031581) |
| 0.0 | 0.5 | GO:0001660 | fever generation(GO:0001660) |
| 0.0 | 0.4 | GO:0006122 | mitochondrial electron transport, ubiquinol to cytochrome c(GO:0006122) |
| 0.0 | 13.0 | GO:0032259 | methylation(GO:0032259) |
| 0.0 | 0.3 | GO:0018095 | protein polyglutamylation(GO:0018095) |
| 0.0 | 0.2 | GO:2000580 | regulation of ATP-dependent microtubule motor activity, plus-end-directed(GO:2000580) positive regulation of ATP-dependent microtubule motor activity, plus-end-directed(GO:2000582) |
| 0.0 | 4.9 | GO:0002576 | platelet degranulation(GO:0002576) |
| 0.0 | 0.5 | GO:0048266 | behavioral response to pain(GO:0048266) |
| 0.0 | 0.9 | GO:0000301 | retrograde transport, vesicle recycling within Golgi(GO:0000301) |
| 0.0 | 1.0 | GO:0007158 | neuron cell-cell adhesion(GO:0007158) |
| 0.0 | 0.4 | GO:0042226 | interleukin-6 biosynthetic process(GO:0042226) |
| 0.0 | 0.7 | GO:0009083 | branched-chain amino acid metabolic process(GO:0009081) branched-chain amino acid catabolic process(GO:0009083) |
| 0.0 | 1.1 | GO:0043486 | histone exchange(GO:0043486) |
| 0.0 | 0.5 | GO:0009235 | cobalamin metabolic process(GO:0009235) |
| 0.0 | 1.0 | GO:0006383 | transcription from RNA polymerase III promoter(GO:0006383) |
| 0.0 | 0.7 | GO:0043252 | sodium-independent organic anion transport(GO:0043252) |
| 0.0 | 5.5 | GO:0050911 | detection of chemical stimulus involved in sensory perception of smell(GO:0050911) |
| 0.0 | 0.2 | GO:0008343 | adult feeding behavior(GO:0008343) |
| 0.0 | 0.7 | GO:0010738 | regulation of protein kinase A signaling(GO:0010738) |
| 0.0 | 0.4 | GO:1904262 | negative regulation of TORC1 signaling(GO:1904262) |
| 0.0 | 5.2 | GO:0071804 | cellular potassium ion transport(GO:0071804) potassium ion transmembrane transport(GO:0071805) |
| 0.0 | 1.0 | GO:0006120 | mitochondrial electron transport, NADH to ubiquinone(GO:0006120) |
| 0.0 | 0.5 | GO:0032007 | negative regulation of TOR signaling(GO:0032007) |
| 0.0 | 1.5 | GO:0042795 | snRNA transcription(GO:0009301) snRNA transcription from RNA polymerase II promoter(GO:0042795) |
| 0.0 | 0.1 | GO:0015722 | canalicular bile acid transport(GO:0015722) |
| 0.0 | 0.6 | GO:0008089 | anterograde axonal transport(GO:0008089) |
| 0.0 | 0.2 | GO:1902083 | negative regulation of peptidyl-cysteine S-nitrosylation(GO:1902083) |
| 0.0 | 0.3 | GO:0097264 | self proteolysis(GO:0097264) |
| 0.0 | 0.7 | GO:0007257 | activation of JUN kinase activity(GO:0007257) |
| 0.0 | 0.6 | GO:1901385 | regulation of voltage-gated calcium channel activity(GO:1901385) |
| 0.0 | 0.6 | GO:0051491 | positive regulation of filopodium assembly(GO:0051491) |
| 0.0 | 0.7 | GO:0030815 | negative regulation of cAMP metabolic process(GO:0030815) |
Gene overrepresentation in cellular component category:
| Log-likelihood per target | Total log-likelihood | Term | Description |
|---|---|---|---|
| 2.5 | 15.2 | GO:0044753 | amphisome(GO:0044753) |
| 1.1 | 3.2 | GO:0034515 | proteasome storage granule(GO:0034515) |
| 1.0 | 14.6 | GO:0019773 | proteasome core complex, alpha-subunit complex(GO:0019773) |
| 0.9 | 2.8 | GO:0002947 | tumor necrosis factor receptor superfamily complex(GO:0002947) |
| 0.9 | 5.6 | GO:0014802 | terminal cisterna(GO:0014802) |
| 0.8 | 10.0 | GO:0008541 | proteasome regulatory particle, lid subcomplex(GO:0008541) |
| 0.8 | 2.3 | GO:0097444 | spine apparatus(GO:0097444) |
| 0.7 | 5.0 | GO:0097513 | myosin II filament(GO:0097513) |
| 0.7 | 3.4 | GO:0036501 | UFD1-NPL4 complex(GO:0036501) |
| 0.6 | 5.3 | GO:0031673 | H zone(GO:0031673) |
| 0.6 | 2.8 | GO:0017109 | glutamate-cysteine ligase complex(GO:0017109) |
| 0.5 | 7.0 | GO:0033018 | sarcoplasmic reticulum lumen(GO:0033018) |
| 0.4 | 2.7 | GO:0005968 | Rab-protein geranylgeranyltransferase complex(GO:0005968) |
| 0.4 | 4.8 | GO:0072687 | meiotic spindle(GO:0072687) |
| 0.4 | 5.0 | GO:0000015 | phosphopyruvate hydratase complex(GO:0000015) |
| 0.4 | 30.1 | GO:0031430 | M band(GO:0031430) |
| 0.4 | 4.5 | GO:0043190 | ATP-binding cassette (ABC) transporter complex(GO:0043190) |
| 0.3 | 3.1 | GO:0097452 | GAIT complex(GO:0097452) |
| 0.3 | 8.3 | GO:0016281 | eukaryotic translation initiation factor 4F complex(GO:0016281) |
| 0.3 | 16.4 | GO:0000421 | autophagosome membrane(GO:0000421) |
| 0.3 | 2.2 | GO:0070032 | synaptobrevin 2-SNAP-25-syntaxin-1a-complexin I complex(GO:0070032) |
| 0.3 | 1.3 | GO:0035525 | NF-kappaB p50/p65 complex(GO:0035525) |
| 0.3 | 2.8 | GO:0060201 | clathrin-sculpted acetylcholine transport vesicle(GO:0060200) clathrin-sculpted acetylcholine transport vesicle membrane(GO:0060201) |
| 0.3 | 5.3 | GO:0005838 | proteasome regulatory particle(GO:0005838) |
| 0.3 | 1.2 | GO:1990730 | VCP-NSFL1C complex(GO:1990730) |
| 0.2 | 7.0 | GO:0005859 | muscle myosin complex(GO:0005859) |
| 0.2 | 1.1 | GO:0045273 | mitochondrial respiratory chain complex II, succinate dehydrogenase complex (ubiquinone)(GO:0005749) succinate dehydrogenase complex (ubiquinone)(GO:0045257) respiratory chain complex II(GO:0045273) succinate dehydrogenase complex(GO:0045281) fumarate reductase complex(GO:0045283) |
| 0.2 | 4.4 | GO:0031672 | A band(GO:0031672) |
| 0.2 | 1.9 | GO:0033269 | internode region of axon(GO:0033269) |
| 0.1 | 10.0 | GO:0000502 | proteasome complex(GO:0000502) |
| 0.1 | 0.8 | GO:0005873 | plus-end kinesin complex(GO:0005873) |
| 0.1 | 1.9 | GO:0070937 | CRD-mediated mRNA stability complex(GO:0070937) |
| 0.1 | 5.1 | GO:0044322 | endoplasmic reticulum quality control compartment(GO:0044322) |
| 0.1 | 1.5 | GO:0005672 | transcription factor TFIIA complex(GO:0005672) |
| 0.1 | 0.9 | GO:0042584 | chromaffin granule membrane(GO:0042584) |
| 0.1 | 2.7 | GO:0030056 | hemidesmosome(GO:0030056) |
| 0.1 | 0.3 | GO:1990617 | CHOP-ATF4 complex(GO:1990617) |
| 0.1 | 10.7 | GO:0031463 | Cul3-RING ubiquitin ligase complex(GO:0031463) |
| 0.1 | 1.9 | GO:0000235 | astral microtubule(GO:0000235) aster(GO:0005818) |
| 0.1 | 0.3 | GO:1990913 | sperm head plasma membrane(GO:1990913) ooplasm(GO:1990917) |
| 0.1 | 1.9 | GO:0008385 | IkappaB kinase complex(GO:0008385) |
| 0.1 | 1.3 | GO:0044352 | pinosome(GO:0044352) macropinosome(GO:0044354) |
| 0.1 | 0.7 | GO:0005947 | mitochondrial alpha-ketoglutarate dehydrogenase complex(GO:0005947) |
| 0.1 | 0.3 | GO:0031074 | nucleocytoplasmic shuttling complex(GO:0031074) |
| 0.1 | 0.8 | GO:0060171 | stereocilium membrane(GO:0060171) |
| 0.1 | 1.4 | GO:0031045 | dense core granule(GO:0031045) |
| 0.1 | 1.1 | GO:0000812 | Swr1 complex(GO:0000812) |
| 0.1 | 1.0 | GO:0033010 | paranodal junction(GO:0033010) |
| 0.1 | 0.4 | GO:1990682 | CSF1-CSF1R complex(GO:1990682) |
| 0.1 | 1.7 | GO:0005639 | integral component of nuclear inner membrane(GO:0005639) intrinsic component of nuclear inner membrane(GO:0031229) |
| 0.1 | 1.1 | GO:0031089 | platelet dense granule lumen(GO:0031089) |
| 0.1 | 1.2 | GO:0032426 | stereocilium tip(GO:0032426) |
| 0.1 | 3.6 | GO:0030173 | integral component of Golgi membrane(GO:0030173) |
| 0.0 | 1.2 | GO:0031265 | CD95 death-inducing signaling complex(GO:0031265) |
| 0.0 | 6.4 | GO:0072686 | mitotic spindle(GO:0072686) |
| 0.0 | 0.7 | GO:0044233 | ER-mitochondrion membrane contact site(GO:0044233) |
| 0.0 | 1.0 | GO:0017146 | NMDA selective glutamate receptor complex(GO:0017146) |
| 0.0 | 1.0 | GO:0005845 | mRNA cap binding complex(GO:0005845) |
| 0.0 | 11.5 | GO:0043209 | myelin sheath(GO:0043209) |
| 0.0 | 0.4 | GO:0005750 | mitochondrial respiratory chain complex III(GO:0005750) respiratory chain complex III(GO:0045275) |
| 0.0 | 6.4 | GO:0043679 | axon terminus(GO:0043679) |
| 0.0 | 1.0 | GO:0005666 | DNA-directed RNA polymerase III complex(GO:0005666) |
| 0.0 | 0.5 | GO:1990712 | HFE-transferrin receptor complex(GO:1990712) |
| 0.0 | 1.4 | GO:1902711 | GABA-A receptor complex(GO:1902711) |
| 0.0 | 2.3 | GO:0005834 | heterotrimeric G-protein complex(GO:0005834) |
| 0.0 | 5.1 | GO:0008076 | voltage-gated potassium channel complex(GO:0008076) |
| 0.0 | 0.1 | GO:0036398 | TCR signalosome(GO:0036398) |
| 0.0 | 0.5 | GO:0016013 | syntrophin complex(GO:0016013) |
| 0.0 | 1.9 | GO:0005844 | polysome(GO:0005844) |
| 0.0 | 1.2 | GO:0009925 | basal plasma membrane(GO:0009925) |
| 0.0 | 0.9 | GO:0005697 | telomerase holoenzyme complex(GO:0005697) |
| 0.0 | 2.1 | GO:0030315 | T-tubule(GO:0030315) |
| 0.0 | 0.2 | GO:0000110 | nucleotide-excision repair factor 1 complex(GO:0000110) |
| 0.0 | 4.6 | GO:0031901 | early endosome membrane(GO:0031901) |
| 0.0 | 3.7 | GO:0016605 | PML body(GO:0016605) |
| 0.0 | 6.1 | GO:0016323 | basolateral plasma membrane(GO:0016323) |
| 0.0 | 1.0 | GO:0030964 | mitochondrial respiratory chain complex I(GO:0005747) NADH dehydrogenase complex(GO:0030964) respiratory chain complex I(GO:0045271) |
| 0.0 | 0.2 | GO:0044666 | MLL3/4 complex(GO:0044666) |
| 0.0 | 0.9 | GO:0005776 | autophagosome(GO:0005776) |
| 0.0 | 1.1 | GO:0005901 | caveola(GO:0005901) |
| 0.0 | 1.3 | GO:0042734 | presynaptic membrane(GO:0042734) |
| 0.0 | 0.6 | GO:0001917 | photoreceptor inner segment(GO:0001917) |
| 0.0 | 0.5 | GO:0034451 | centriolar satellite(GO:0034451) |
| 0.0 | 0.9 | GO:0008023 | transcription elongation factor complex(GO:0008023) |
| 0.0 | 0.6 | GO:0005891 | voltage-gated calcium channel complex(GO:0005891) |
Gene overrepresentation in molecular function category:
| Log-likelihood per target | Total log-likelihood | Term | Description |
|---|---|---|---|
| 1.9 | 24.2 | GO:0004332 | fructose-bisphosphate aldolase activity(GO:0004332) |
| 1.8 | 10.6 | GO:0003998 | acylphosphatase activity(GO:0003998) |
| 1.6 | 4.8 | GO:0046970 | NAD-dependent histone deacetylase activity (H4-K16 specific)(GO:0046970) |
| 1.1 | 3.4 | GO:0016005 | phospholipase A2 activator activity(GO:0016005) |
| 1.1 | 12.1 | GO:0048408 | epidermal growth factor binding(GO:0048408) |
| 1.1 | 7.6 | GO:0019862 | IgA binding(GO:0019862) |
| 1.0 | 3.1 | GO:0035605 | peptidyl-cysteine S-nitrosylase activity(GO:0035605) |
| 0.9 | 3.8 | GO:0004852 | uroporphyrinogen-III synthase activity(GO:0004852) |
| 0.9 | 3.6 | GO:0003947 | (N-acetylneuraminyl)-galactosylglucosylceramide N-acetylgalactosaminyltransferase activity(GO:0003947) |
| 0.9 | 8.7 | GO:0003876 | AMP deaminase activity(GO:0003876) adenosine-phosphate deaminase activity(GO:0047623) |
| 0.6 | 3.1 | GO:0004347 | glucose-6-phosphate isomerase activity(GO:0004347) |
| 0.6 | 5.4 | GO:0008379 | thioredoxin peroxidase activity(GO:0008379) |
| 0.6 | 15.4 | GO:0030957 | Tat protein binding(GO:0030957) |
| 0.6 | 2.8 | GO:0004357 | glutamate-cysteine ligase activity(GO:0004357) |
| 0.5 | 15.8 | GO:0004298 | threonine-type endopeptidase activity(GO:0004298) threonine-type peptidase activity(GO:0070003) |
| 0.4 | 2.7 | GO:0004663 | Rab geranylgeranyltransferase activity(GO:0004663) |
| 0.4 | 1.3 | GO:0004411 | homogentisate 1,2-dioxygenase activity(GO:0004411) |
| 0.4 | 1.3 | GO:0031531 | thyrotropin-releasing hormone receptor binding(GO:0031531) |
| 0.4 | 5.0 | GO:0004634 | phosphopyruvate hydratase activity(GO:0004634) |
| 0.4 | 1.2 | GO:0008193 | tRNA guanylyltransferase activity(GO:0008193) |
| 0.4 | 17.1 | GO:0070530 | K63-linked polyubiquitin binding(GO:0070530) |
| 0.3 | 3.5 | GO:0036435 | K48-linked polyubiquitin binding(GO:0036435) |
| 0.3 | 4.1 | GO:0035381 | extracellular ATP-gated cation channel activity(GO:0004931) ATP-gated ion channel activity(GO:0035381) |
| 0.3 | 3.1 | GO:0003873 | 6-phosphofructo-2-kinase activity(GO:0003873) |
| 0.3 | 1.4 | GO:0008336 | gamma-butyrobetaine dioxygenase activity(GO:0008336) |
| 0.3 | 2.0 | GO:0004833 | tryptophan 2,3-dioxygenase activity(GO:0004833) |
| 0.3 | 3.9 | GO:0008046 | axon guidance receptor activity(GO:0008046) |
| 0.3 | 1.0 | GO:0004418 | hydroxymethylbilane synthase activity(GO:0004418) |
| 0.3 | 0.9 | GO:0090409 | malonyl-CoA synthetase activity(GO:0090409) |
| 0.3 | 2.8 | GO:0030348 | syntaxin-3 binding(GO:0030348) |
| 0.3 | 1.1 | GO:0008177 | succinate dehydrogenase (ubiquinone) activity(GO:0008177) 3 iron, 4 sulfur cluster binding(GO:0051538) |
| 0.3 | 1.6 | GO:0050610 | glutathione dehydrogenase (ascorbate) activity(GO:0045174) methylarsonate reductase activity(GO:0050610) |
| 0.3 | 8.3 | GO:0008190 | eukaryotic initiation factor 4E binding(GO:0008190) |
| 0.3 | 0.8 | GO:0031626 | beta-endorphin binding(GO:0031626) |
| 0.3 | 1.0 | GO:0015038 | glutathione disulfide oxidoreductase activity(GO:0015038) |
| 0.2 | 1.1 | GO:0035515 | oxidative RNA demethylase activity(GO:0035515) |
| 0.2 | 19.4 | GO:0008138 | protein tyrosine/serine/threonine phosphatase activity(GO:0008138) |
| 0.2 | 1.7 | GO:0036402 | proteasome-activating ATPase activity(GO:0036402) |
| 0.2 | 0.6 | GO:0005369 | taurine transmembrane transporter activity(GO:0005368) taurine:sodium symporter activity(GO:0005369) |
| 0.2 | 3.3 | GO:0019531 | oxalate transmembrane transporter activity(GO:0019531) |
| 0.2 | 2.1 | GO:0071532 | ankyrin repeat binding(GO:0071532) |
| 0.2 | 1.3 | GO:0004473 | malate dehydrogenase (decarboxylating) (NAD+) activity(GO:0004471) malate dehydrogenase (decarboxylating) (NADP+) activity(GO:0004473) |
| 0.2 | 0.9 | GO:0000155 | phosphorelay sensor kinase activity(GO:0000155) |
| 0.2 | 5.0 | GO:0030898 | actin-dependent ATPase activity(GO:0030898) |
| 0.2 | 0.5 | GO:0005135 | interleukin-3 receptor binding(GO:0005135) |
| 0.2 | 0.9 | GO:0004447 | iodide peroxidase activity(GO:0004447) |
| 0.2 | 0.9 | GO:0050220 | prostaglandin-E synthase activity(GO:0050220) |
| 0.2 | 1.6 | GO:0061133 | endopeptidase activator activity(GO:0061133) |
| 0.2 | 7.9 | GO:0051010 | microtubule plus-end binding(GO:0051010) |
| 0.2 | 0.7 | GO:0004937 | alpha1-adrenergic receptor activity(GO:0004937) |
| 0.2 | 5.1 | GO:0005212 | structural constituent of eye lens(GO:0005212) |
| 0.2 | 0.6 | GO:0098626 | methylselenol reductase activity(GO:0098625) methylseleninic acid reductase activity(GO:0098626) |
| 0.2 | 1.4 | GO:1904315 | neurotransmitter receptor activity involved in regulation of postsynaptic membrane potential(GO:0099529) transmitter-gated ion channel activity involved in regulation of postsynaptic membrane potential(GO:1904315) |
| 0.2 | 2.9 | GO:0019855 | calcium channel inhibitor activity(GO:0019855) |
| 0.1 | 0.4 | GO:0097689 | iron channel activity(GO:0097689) |
| 0.1 | 1.3 | GO:0015319 | sodium:inorganic phosphate symporter activity(GO:0015319) |
| 0.1 | 1.4 | GO:0030346 | protein phosphatase 2B binding(GO:0030346) |
| 0.1 | 5.0 | GO:0005251 | delayed rectifier potassium channel activity(GO:0005251) |
| 0.1 | 0.4 | GO:0090556 | apolipoprotein A-I receptor activity(GO:0034188) phosphatidylserine-translocating ATPase activity(GO:0090556) |
| 0.1 | 0.5 | GO:0004382 | guanosine-diphosphatase activity(GO:0004382) |
| 0.1 | 0.4 | GO:0030226 | alpha-2 macroglobulin receptor activity(GO:0016964) apolipoprotein receptor activity(GO:0030226) |
| 0.1 | 1.6 | GO:0019534 | toxin transporter activity(GO:0019534) |
| 0.1 | 5.3 | GO:0031593 | polyubiquitin binding(GO:0031593) |
| 0.1 | 0.3 | GO:0045550 | geranylgeranyl reductase activity(GO:0045550) |
| 0.1 | 0.6 | GO:0004466 | long-chain-acyl-CoA dehydrogenase activity(GO:0004466) |
| 0.1 | 0.8 | GO:0045029 | UDP-activated nucleotide receptor activity(GO:0045029) |
| 0.1 | 1.9 | GO:0019911 | structural constituent of myelin sheath(GO:0019911) |
| 0.1 | 0.3 | GO:0004917 | interleukin-7 receptor activity(GO:0004917) |
| 0.1 | 1.2 | GO:0022833 | mechanically-gated ion channel activity(GO:0008381) mechanically gated channel activity(GO:0022833) |
| 0.1 | 0.3 | GO:0002135 | CTP binding(GO:0002135) |
| 0.1 | 1.9 | GO:0034452 | dynactin binding(GO:0034452) |
| 0.1 | 2.5 | GO:0051537 | 2 iron, 2 sulfur cluster binding(GO:0051537) |
| 0.1 | 0.8 | GO:0042835 | BRE binding(GO:0042835) |
| 0.1 | 3.2 | GO:0005104 | fibroblast growth factor receptor binding(GO:0005104) |
| 0.1 | 10.2 | GO:0008307 | structural constituent of muscle(GO:0008307) |
| 0.1 | 1.4 | GO:0048406 | nerve growth factor binding(GO:0048406) |
| 0.1 | 3.0 | GO:0051371 | muscle alpha-actinin binding(GO:0051371) |
| 0.1 | 1.5 | GO:0031702 | type 1 angiotensin receptor binding(GO:0031702) |
| 0.1 | 4.9 | GO:0030507 | spectrin binding(GO:0030507) |
| 0.1 | 0.9 | GO:0050692 | DBD domain binding(GO:0050692) |
| 0.1 | 9.8 | GO:0051117 | ATPase binding(GO:0051117) |
| 0.1 | 0.2 | GO:0031780 | corticotropin hormone receptor binding(GO:0031780) type 5 melanocortin receptor binding(GO:0031783) |
| 0.1 | 3.2 | GO:0016709 | oxidoreductase activity, acting on paired donors, with incorporation or reduction of molecular oxygen, NAD(P)H as one donor, and incorporation of one atom of oxygen(GO:0016709) |
| 0.1 | 1.0 | GO:0019957 | C-C chemokine binding(GO:0019957) |
| 0.1 | 0.5 | GO:0004144 | diacylglycerol O-acyltransferase activity(GO:0004144) |
| 0.1 | 0.7 | GO:0051378 | amine binding(GO:0043176) serotonin binding(GO:0051378) |
| 0.1 | 1.5 | GO:0017025 | TBP-class protein binding(GO:0017025) |
| 0.1 | 0.2 | GO:0072320 | volume-sensitive chloride channel activity(GO:0072320) |
| 0.1 | 0.4 | GO:0005157 | macrophage colony-stimulating factor receptor binding(GO:0005157) |
| 0.1 | 0.2 | GO:0008422 | beta-glucosidase activity(GO:0008422) |
| 0.1 | 1.1 | GO:0008253 | 5'-nucleotidase activity(GO:0008253) |
| 0.1 | 0.4 | GO:0008121 | ubiquinol-cytochrome-c reductase activity(GO:0008121) oxidoreductase activity, acting on diphenols and related substances as donors(GO:0016679) oxidoreductase activity, acting on diphenols and related substances as donors, cytochrome as acceptor(GO:0016681) |
| 0.0 | 0.6 | GO:0004465 | lipoprotein lipase activity(GO:0004465) |
| 0.0 | 1.0 | GO:0005432 | calcium:sodium antiporter activity(GO:0005432) |
| 0.0 | 0.9 | GO:0004017 | adenylate kinase activity(GO:0004017) |
| 0.0 | 1.4 | GO:0046965 | retinoid X receptor binding(GO:0046965) |
| 0.0 | 2.2 | GO:0017075 | syntaxin-1 binding(GO:0017075) |
| 0.0 | 14.5 | GO:0008168 | methyltransferase activity(GO:0008168) |
| 0.0 | 0.8 | GO:0017162 | aryl hydrocarbon receptor binding(GO:0017162) |
| 0.0 | 0.4 | GO:0001042 | RNA polymerase I core binding(GO:0001042) |
| 0.0 | 2.2 | GO:0031683 | G-protein beta/gamma-subunit complex binding(GO:0031683) |
| 0.0 | 4.0 | GO:0070888 | E-box binding(GO:0070888) |
| 0.0 | 0.7 | GO:0015245 | fatty acid transporter activity(GO:0015245) |
| 0.0 | 1.0 | GO:0001056 | RNA polymerase III activity(GO:0001056) |
| 0.0 | 0.7 | GO:0034185 | apolipoprotein binding(GO:0034185) |
| 0.0 | 0.5 | GO:0001591 | dopamine neurotransmitter receptor activity, coupled via Gi/Go(GO:0001591) |
| 0.0 | 1.2 | GO:0097200 | cysteine-type endopeptidase activity involved in execution phase of apoptosis(GO:0097200) |
| 0.0 | 0.4 | GO:0043533 | inositol 1,3,4,5 tetrakisphosphate binding(GO:0043533) |
| 0.0 | 0.5 | GO:0005025 | transforming growth factor beta receptor activity, type I(GO:0005025) |
| 0.0 | 0.3 | GO:0008454 | alpha-1,3-mannosylglycoprotein 4-beta-N-acetylglucosaminyltransferase activity(GO:0008454) |
| 0.0 | 0.6 | GO:0019870 | potassium channel inhibitor activity(GO:0019870) |
| 0.0 | 0.3 | GO:0070740 | tubulin-glutamic acid ligase activity(GO:0070740) |
| 0.0 | 0.3 | GO:0003910 | DNA ligase (ATP) activity(GO:0003910) |
| 0.0 | 0.3 | GO:0004565 | beta-galactosidase activity(GO:0004565) |
| 0.0 | 1.1 | GO:0004708 | MAP kinase kinase activity(GO:0004708) |
| 0.0 | 2.9 | GO:0002039 | p53 binding(GO:0002039) |
| 0.0 | 0.2 | GO:0001091 | RNA polymerase II basal transcription factor binding(GO:0001091) TFIID-class transcription factor binding(GO:0001094) |
| 0.0 | 0.8 | GO:0097109 | neuroligin family protein binding(GO:0097109) |
| 0.0 | 0.5 | GO:0001206 | transcriptional repressor activity, RNA polymerase II distal enhancer sequence-specific binding(GO:0001206) |
| 0.0 | 2.7 | GO:0004722 | protein serine/threonine phosphatase activity(GO:0004722) |
| 0.0 | 0.1 | GO:0015432 | bile acid-exporting ATPase activity(GO:0015432) |
| 0.0 | 0.9 | GO:0005242 | inward rectifier potassium channel activity(GO:0005242) |
| 0.0 | 0.4 | GO:0005149 | interleukin-1 receptor binding(GO:0005149) |
| 0.0 | 3.7 | GO:0051082 | unfolded protein binding(GO:0051082) |
| 0.0 | 3.3 | GO:0042626 | ATPase activity, coupled to transmembrane movement of substances(GO:0042626) |
| 0.0 | 1.0 | GO:0019198 | transmembrane receptor protein tyrosine phosphatase activity(GO:0005001) transmembrane receptor protein phosphatase activity(GO:0019198) |
| 0.0 | 1.6 | GO:0016667 | oxidoreductase activity, acting on a sulfur group of donors(GO:0016667) |
| 0.0 | 1.5 | GO:0030552 | cAMP binding(GO:0030552) |
| 0.0 | 1.8 | GO:0003743 | translation initiation factor activity(GO:0003743) |
| 0.0 | 0.7 | GO:0034237 | protein kinase A regulatory subunit binding(GO:0034237) |
| 0.0 | 0.5 | GO:0015125 | bile acid transmembrane transporter activity(GO:0015125) |
| 0.0 | 0.3 | GO:0035612 | AP-2 adaptor complex binding(GO:0035612) |
| 0.0 | 0.4 | GO:0008430 | selenium binding(GO:0008430) |
| 0.0 | 2.3 | GO:0019905 | syntaxin binding(GO:0019905) |
| 0.0 | 1.0 | GO:0005544 | calcium-dependent phospholipid binding(GO:0005544) |
| 0.0 | 7.9 | GO:0008017 | microtubule binding(GO:0008017) |
| 0.0 | 0.6 | GO:0008331 | high voltage-gated calcium channel activity(GO:0008331) |
| 0.0 | 13.2 | GO:0004842 | ubiquitin-protein transferase activity(GO:0004842) |
| 0.0 | 0.8 | GO:0051539 | 4 iron, 4 sulfur cluster binding(GO:0051539) |
| 0.0 | 1.0 | GO:0050136 | NADH dehydrogenase (ubiquinone) activity(GO:0008137) NADH dehydrogenase (quinone) activity(GO:0050136) |
| 0.0 | 0.6 | GO:0008143 | poly(A) binding(GO:0008143) |
| 0.0 | 1.6 | GO:0004843 | thiol-dependent ubiquitin-specific protease activity(GO:0004843) |
| 0.0 | 5.5 | GO:0004984 | olfactory receptor activity(GO:0004984) |
| 0.0 | 2.5 | GO:0005200 | structural constituent of cytoskeleton(GO:0005200) |
| 0.0 | 0.4 | GO:0005545 | 1-phosphatidylinositol binding(GO:0005545) |
| 0.0 | 0.3 | GO:0043522 | leucine zipper domain binding(GO:0043522) |
| 0.0 | 1.1 | GO:0043130 | ubiquitin binding(GO:0043130) |
| 0.0 | 0.1 | GO:0004105 | choline-phosphate cytidylyltransferase activity(GO:0004105) |
| 0.0 | 0.7 | GO:0001106 | RNA polymerase II transcription corepressor activity(GO:0001106) |
| 0.0 | 0.3 | GO:0003887 | DNA-directed DNA polymerase activity(GO:0003887) |
| 0.0 | 0.4 | GO:0000983 | transcription factor activity, RNA polymerase II core promoter sequence-specific(GO:0000983) |
| 0.0 | 0.1 | GO:0043996 | histone acetyltransferase activity (H4-K5 specific)(GO:0043995) histone acetyltransferase activity (H4-K8 specific)(GO:0043996) histone acetyltransferase activity (H4-K16 specific)(GO:0046972) |
| 0.0 | 0.7 | GO:0005546 | phosphatidylinositol-4,5-bisphosphate binding(GO:0005546) |
Gene overrepresentation in curated gene sets: canonical pathways category:
| Log-likelihood per target | Total log-likelihood | Term | Description |
|---|---|---|---|
| 0.2 | 18.5 | PID IL1 PATHWAY | IL1-mediated signaling events |
| 0.2 | 26.6 | PID HIF1 TFPATHWAY | HIF-1-alpha transcription factor network |
| 0.1 | 5.8 | PID PRL SIGNALING EVENTS PATHWAY | Signaling events mediated by PRL |
| 0.1 | 5.3 | PID HDAC CLASSIII PATHWAY | Signaling events mediated by HDAC Class III |
| 0.1 | 2.2 | PID LPA4 PATHWAY | LPA4-mediated signaling events |
| 0.1 | 4.6 | PID LIS1 PATHWAY | Lissencephaly gene (LIS1) in neuronal migration and development |
| 0.1 | 3.3 | PID EPHRINB REV PATHWAY | Ephrin B reverse signaling |
| 0.1 | 1.6 | PID DELTA NP63 PATHWAY | Validated transcriptional targets of deltaNp63 isoforms |
| 0.1 | 1.5 | PID P38 GAMMA DELTA PATHWAY | Signaling mediated by p38-gamma and p38-delta |
| 0.1 | 8.9 | PID MYC ACTIV PATHWAY | Validated targets of C-MYC transcriptional activation |
| 0.1 | 2.7 | SIG CD40PATHWAYMAP | Genes related to CD40 signaling |
| 0.1 | 3.3 | PID AURORA B PATHWAY | Aurora B signaling |
| 0.1 | 4.6 | ST T CELL SIGNAL TRANSDUCTION | T Cell Signal Transduction |
| 0.0 | 4.3 | PID KIT PATHWAY | Signaling events mediated by Stem cell factor receptor (c-Kit) |
| 0.0 | 1.2 | SA FAS SIGNALING | The TNF-type receptor Fas induces apoptosis on ligand binding. |
| 0.0 | 1.1 | SA PTEN PATHWAY | PTEN is a tumor suppressor that dephosphorylates the lipid messenger phosphatidylinositol triphosphate. |
| 0.0 | 5.3 | PID CXCR4 PATHWAY | CXCR4-mediated signaling events |
| 0.0 | 1.4 | PID RETINOIC ACID PATHWAY | Retinoic acid receptors-mediated signaling |
| 0.0 | 1.5 | SIG REGULATION OF THE ACTIN CYTOSKELETON BY RHO GTPASES | Genes related to regulation of the actin cytoskeleton |
| 0.0 | 2.2 | PID FGF PATHWAY | FGF signaling pathway |
| 0.0 | 0.9 | PID IL3 PATHWAY | IL3-mediated signaling events |
| 0.0 | 1.2 | PID TNF PATHWAY | TNF receptor signaling pathway |
| 0.0 | 1.3 | PID TRKR PATHWAY | Neurotrophic factor-mediated Trk receptor signaling |
| 0.0 | 5.2 | NABA ECM REGULATORS | Genes encoding enzymes and their regulators involved in the remodeling of the extracellular matrix |
| 0.0 | 1.0 | PID VEGFR1 2 PATHWAY | Signaling events mediated by VEGFR1 and VEGFR2 |
| 0.0 | 0.3 | PID LYSOPHOSPHOLIPID PATHWAY | LPA receptor mediated events |
| 0.0 | 0.3 | PID FRA PATHWAY | Validated transcriptional targets of AP1 family members Fra1 and Fra2 |
Gene overrepresentation in curated gene sets: REACTOME pathways category:
| Log-likelihood per target | Total log-likelihood | Term | Description |
|---|---|---|---|
| 0.9 | 15.2 | REACTOME P75NTR RECRUITS SIGNALLING COMPLEXES | Genes involved in p75NTR recruits signalling complexes |
| 0.5 | 38.5 | REACTOME GLYCOLYSIS | Genes involved in Glycolysis |
| 0.5 | 32.7 | REACTOME CDK MEDIATED PHOSPHORYLATION AND REMOVAL OF CDC6 | Genes involved in CDK-mediated phosphorylation and removal of Cdc6 |
| 0.4 | 8.3 | REACTOME MTORC1 MEDIATED SIGNALLING | Genes involved in mTORC1-mediated signalling |
| 0.3 | 8.7 | REACTOME PURINE SALVAGE | Genes involved in Purine salvage |
| 0.3 | 1.3 | REACTOME P75NTR SIGNALS VIA NFKB | Genes involved in p75NTR signals via NF-kB |
| 0.2 | 7.2 | REACTOME METABOLISM OF PORPHYRINS | Genes involved in Metabolism of porphyrins |
| 0.2 | 5.2 | REACTOME ABCA TRANSPORTERS IN LIPID HOMEOSTASIS | Genes involved in ABCA transporters in lipid homeostasis |
| 0.2 | 5.4 | REACTOME DOPAMINE NEUROTRANSMITTER RELEASE CYCLE | Genes involved in Dopamine Neurotransmitter Release Cycle |
| 0.2 | 1.9 | REACTOME IRAK1 RECRUITS IKK COMPLEX | Genes involved in IRAK1 recruits IKK complex |
| 0.2 | 3.2 | REACTOME SIGNALING BY FGFR3 MUTANTS | Genes involved in Signaling by FGFR3 mutants |
| 0.2 | 5.8 | REACTOME FORMATION OF TUBULIN FOLDING INTERMEDIATES BY CCT TRIC | Genes involved in Formation of tubulin folding intermediates by CCT/TriC |
| 0.1 | 2.0 | REACTOME TRYPTOPHAN CATABOLISM | Genes involved in Tryptophan catabolism |
| 0.1 | 2.2 | REACTOME ADENYLATE CYCLASE ACTIVATING PATHWAY | Genes involved in Adenylate cyclase activating pathway |
| 0.1 | 5.1 | REACTOME SEMA4D INDUCED CELL MIGRATION AND GROWTH CONE COLLAPSE | Genes involved in Sema4D induced cell migration and growth-cone collapse |
| 0.1 | 7.5 | REACTOME STRIATED MUSCLE CONTRACTION | Genes involved in Striated Muscle Contraction |
| 0.1 | 3.0 | REACTOME CASPASE MEDIATED CLEAVAGE OF CYTOSKELETAL PROTEINS | Genes involved in Caspase-mediated cleavage of cytoskeletal proteins |
| 0.1 | 6.0 | REACTOME VOLTAGE GATED POTASSIUM CHANNELS | Genes involved in Voltage gated Potassium channels |
| 0.1 | 0.7 | REACTOME SEMA4D IN SEMAPHORIN SIGNALING | Genes involved in Sema4D in semaphorin signaling |
| 0.1 | 2.8 | REACTOME SULFUR AMINO ACID METABOLISM | Genes involved in Sulfur amino acid metabolism |
| 0.1 | 1.5 | REACTOME ACTIVATED TAK1 MEDIATES P38 MAPK ACTIVATION | Genes involved in activated TAK1 mediates p38 MAPK activation |
| 0.0 | 0.7 | REACTOME SYNTHESIS OF BILE ACIDS AND BILE SALTS VIA 24 HYDROXYCHOLESTEROL | Genes involved in Synthesis of bile acids and bile salts via 24-hydroxycholesterol |
| 0.0 | 0.7 | REACTOME SEROTONIN RECEPTORS | Genes involved in Serotonin receptors |
| 0.0 | 0.7 | REACTOME CALNEXIN CALRETICULIN CYCLE | Genes involved in Calnexin/calreticulin cycle |
| 0.0 | 3.1 | REACTOME AMINO ACID TRANSPORT ACROSS THE PLASMA MEMBRANE | Genes involved in Amino acid transport across the plasma membrane |
| 0.0 | 1.2 | REACTOME EXTRINSIC PATHWAY FOR APOPTOSIS | Genes involved in Extrinsic Pathway for Apoptosis |
| 0.0 | 2.4 | REACTOME MITOCHONDRIAL PROTEIN IMPORT | Genes involved in Mitochondrial Protein Import |
| 0.0 | 0.3 | REACTOME IL 7 SIGNALING | Genes involved in Interleukin-7 signaling |
| 0.0 | 1.1 | REACTOME CITRIC ACID CYCLE TCA CYCLE | Genes involved in Citric acid cycle (TCA cycle) |
| 0.0 | 0.5 | REACTOME SYNTHESIS OF BILE ACIDS AND BILE SALTS VIA 7ALPHA HYDROXYCHOLESTEROL | Genes involved in Synthesis of bile acids and bile salts via 7alpha-hydroxycholesterol |
| 0.0 | 1.0 | REACTOME RNA POL III CHAIN ELONGATION | Genes involved in RNA Polymerase III Chain Elongation |
| 0.0 | 0.8 | REACTOME P2Y RECEPTORS | Genes involved in P2Y receptors |
| 0.0 | 0.9 | REACTOME AMINE DERIVED HORMONES | Genes involved in Amine-derived hormones |
| 0.0 | 0.6 | REACTOME MITOCHONDRIAL FATTY ACID BETA OXIDATION | Genes involved in Mitochondrial Fatty Acid Beta-Oxidation |
| 0.0 | 1.4 | REACTOME SIGNALING BY NODAL | Genes involved in Signaling by NODAL |
| 0.0 | 9.3 | REACTOME ANTIGEN PROCESSING UBIQUITINATION PROTEASOME DEGRADATION | Genes involved in Antigen processing: Ubiquitination & Proteasome degradation |
| 0.0 | 1.4 | REACTOME GABA A RECEPTOR ACTIVATION | Genes involved in GABA A receptor activation |
| 0.0 | 1.2 | REACTOME G0 AND EARLY G1 | Genes involved in G0 and Early G1 |
| 0.0 | 0.7 | REACTOME TRANSPORT OF ORGANIC ANIONS | Genes involved in Transport of organic anions |
| 0.0 | 1.9 | REACTOME CYTOCHROME P450 ARRANGED BY SUBSTRATE TYPE | Genes involved in Cytochrome P450 - arranged by substrate type |
| 0.0 | 1.5 | REACTOME RNA POL II TRANSCRIPTION PRE INITIATION AND PROMOTER OPENING | Genes involved in RNA Polymerase II Transcription Pre-Initiation And Promoter Opening |
| 0.0 | 3.9 | REACTOME MITOTIC PROMETAPHASE | Genes involved in Mitotic Prometaphase |
| 0.0 | 0.3 | REACTOME ACTIVATION OF NF KAPPAB IN B CELLS | Genes involved in Activation of NF-kappaB in B Cells |
| 0.0 | 1.2 | REACTOME SIGNALING BY FGFR1 FUSION MUTANTS | Genes involved in Signaling by FGFR1 fusion mutants |
| 0.0 | 2.4 | REACTOME METABOLISM OF VITAMINS AND COFACTORS | Genes involved in Metabolism of vitamins and cofactors |
| 0.0 | 0.7 | REACTOME BRANCHED CHAIN AMINO ACID CATABOLISM | Genes involved in Branched-chain amino acid catabolism |
| 0.0 | 0.8 | REACTOME AMINE LIGAND BINDING RECEPTORS | Genes involved in Amine ligand-binding receptors |
| 0.0 | 0.3 | REACTOME ACTIVATION OF CHAPERONE GENES BY ATF6 ALPHA | Genes involved in Activation of Chaperone Genes by ATF6-alpha |
| 0.0 | 2.4 | REACTOME TRANSPORT OF INORGANIC CATIONS ANIONS AND AMINO ACIDS OLIGOPEPTIDES | Genes involved in Transport of inorganic cations/anions and amino acids/oligopeptides |
| 0.0 | 1.4 | REACTOME RESPIRATORY ELECTRON TRANSPORT | Genes involved in Respiratory electron transport |
| 0.0 | 0.4 | REACTOME DOWNREGULATION OF TGF BETA RECEPTOR SIGNALING | Genes involved in Downregulation of TGF-beta receptor signaling |
| 0.0 | 0.4 | REACTOME CD28 DEPENDENT VAV1 PATHWAY | Genes involved in CD28 dependent Vav1 pathway |
| 0.0 | 0.2 | REACTOME FORMATION OF TRANSCRIPTION COUPLED NER TC NER REPAIR COMPLEX | Genes involved in Formation of transcription-coupled NER (TC-NER) repair complex |
| 0.0 | 0.8 | REACTOME SIGNALING BY ROBO RECEPTOR | Genes involved in Signaling by Robo receptor |
| 0.0 | 0.5 | REACTOME METAL ION SLC TRANSPORTERS | Genes involved in Metal ion SLC transporters |
| 0.0 | 0.3 | REACTOME SEMA3A PAK DEPENDENT AXON REPULSION | Genes involved in Sema3A PAK dependent Axon repulsion |