Project
avrg: Illumina Body Map 2 (GSE30611)
Navigation
Downloads
Results for ID4_TCF4_SNAI2
Z-value: 5.29
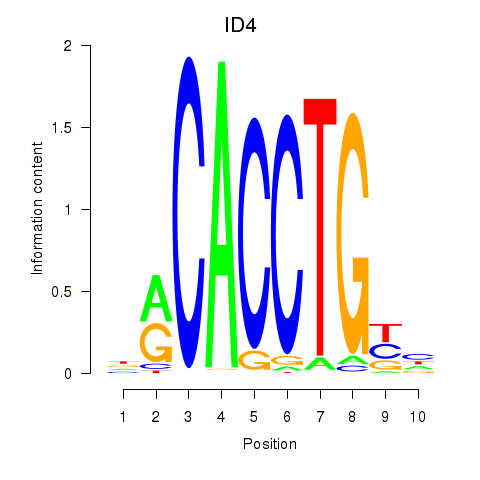
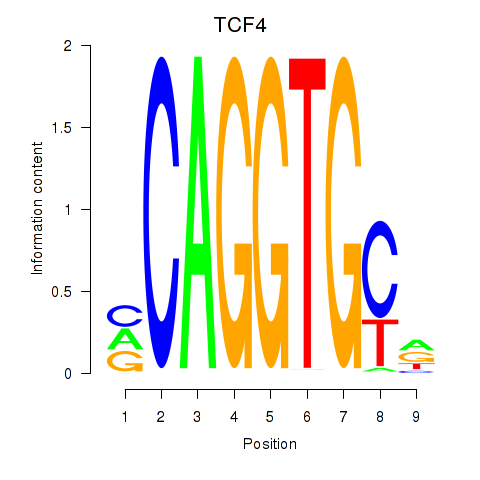
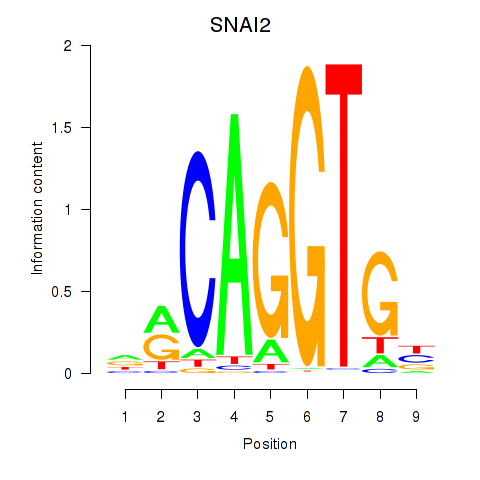
Motif logo
Transcription factors associated with ID4_TCF4_SNAI2
| Gene Symbol | Gene ID | Gene Info |
|---|---|---|
|
ID4
|
ENSG00000172201.12 | ID4 |
|
TCF4
|
ENSG00000196628.20 | TCF4 |
|
SNAI2
|
ENSG00000019549.13 | SNAI2 |
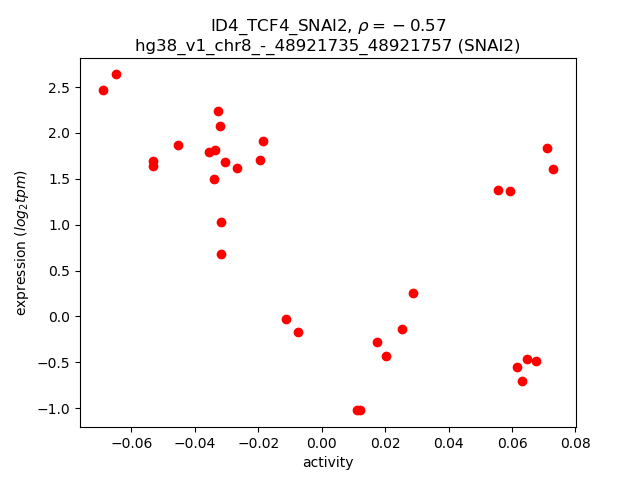
Activity-expression correlation:
| Gene | Promoter | Pearson corr. coef. | P-value | Plot |
|---|---|---|---|---|
| TCF4 | hg38_v1_chr18_-_55588184_55588260 | -0.63 | 1.3e-04 | Click! |
| SNAI2 | hg38_v1_chr8_-_48921735_48921757 | -0.57 | 6.8e-04 | Click! |
| ID4 | hg38_v1_chr6_+_19837362_19837381 | -0.29 | 1.1e-01 | Click! |
Activity profile of ID4_TCF4_SNAI2 motif
Sorted Z-values of ID4_TCF4_SNAI2 motif
Network of associatons between targets according to the STRING database.

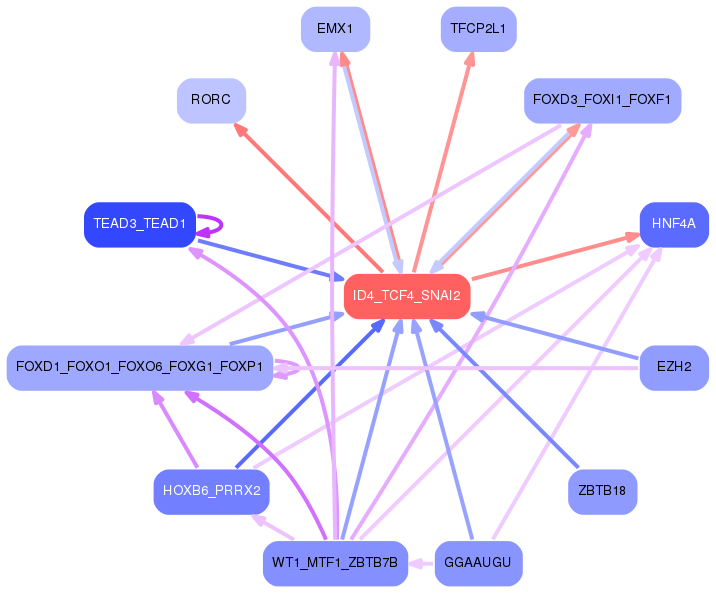
First level regulatory network of ID4_TCF4_SNAI2
Gene Ontology Analysis
Gene overrepresentation in biological process category:
| Log-likelihood per target | Total log-likelihood | Term | Description |
|---|---|---|---|
| 3.2 | 12.7 | GO:0010133 | proline catabolic process to glutamate(GO:0010133) |
| 3.0 | 9.0 | GO:1900135 | positive regulation of renin secretion into blood stream(GO:1900135) |
| 2.9 | 11.6 | GO:0060262 | regulation of N-terminal protein palmitoylation(GO:0060254) negative regulation of N-terminal protein palmitoylation(GO:0060262) negative regulation of protein lipidation(GO:1903060) |
| 2.8 | 11.0 | GO:2000910 | negative regulation of cholesterol import(GO:0060621) negative regulation of sterol import(GO:2000910) |
| 2.7 | 8.1 | GO:1903442 | response to methylamine(GO:0036255) response to lipoic acid(GO:1903442) |
| 2.6 | 10.5 | GO:0097089 | methyl-branched fatty acid metabolic process(GO:0097089) |
| 2.4 | 11.8 | GO:0015855 | pyrimidine nucleobase transport(GO:0015855) purine nucleobase transmembrane transport(GO:1904823) |
| 2.3 | 16.4 | GO:0032971 | regulation of muscle filament sliding(GO:0032971) |
| 2.3 | 9.0 | GO:0005986 | sucrose biosynthetic process(GO:0005986) |
| 2.2 | 8.8 | GO:0009822 | alkaloid catabolic process(GO:0009822) |
| 2.1 | 6.4 | GO:0006601 | creatine biosynthetic process(GO:0006601) |
| 2.0 | 2.0 | GO:2000374 | regulation of oxygen metabolic process(GO:2000374) |
| 2.0 | 6.0 | GO:0090675 | intermicrovillar adhesion(GO:0090675) |
| 2.0 | 5.9 | GO:0002415 | immunoglobulin transcytosis in epithelial cells mediated by polymeric immunoglobulin receptor(GO:0002415) |
| 1.9 | 7.4 | GO:0010902 | positive regulation of very-low-density lipoprotein particle remodeling(GO:0010902) |
| 1.8 | 5.5 | GO:1903210 | cellular response to nitrite(GO:0071250) response to nitrite(GO:0080033) glomerular visceral epithelial cell apoptotic process(GO:1903210) regulation of glomerular visceral epithelial cell apoptotic process(GO:1904633) positive regulation of glomerular visceral epithelial cell apoptotic process(GO:1904635) response to resveratrol(GO:1904638) cellular response to resveratrol(GO:1904639) positive regulation of progesterone biosynthetic process(GO:2000184) |
| 1.8 | 7.3 | GO:0070650 | endoplasmic reticulum polarization(GO:0061163) actin filament bundle retrograde transport(GO:0061573) actin filament bundle distribution(GO:0070650) |
| 1.8 | 7.3 | GO:0034444 | regulation of plasma lipoprotein particle oxidation(GO:0034444) negative regulation of plasma lipoprotein particle oxidation(GO:0034445) |
| 1.8 | 10.7 | GO:0008615 | pyridoxine metabolic process(GO:0008614) pyridoxine biosynthetic process(GO:0008615) vitamin B6 biosynthetic process(GO:0042819) |
| 1.8 | 7.1 | GO:1903631 | regulation of calcium-dependent ATPase activity(GO:1903610) negative regulation of calcium-dependent ATPase activity(GO:1903611) regulation of dUTP diphosphatase activity(GO:1903627) positive regulation of dUTP diphosphatase activity(GO:1903629) negative regulation of aminoacyl-tRNA ligase activity(GO:1903631) regulation of leucine-tRNA ligase activity(GO:1903633) negative regulation of leucine-tRNA ligase activity(GO:1903634) |
| 1.8 | 1.8 | GO:0006500 | N-terminal protein palmitoylation(GO:0006500) |
| 1.7 | 8.6 | GO:0018352 | protein-pyridoxal-5-phosphate linkage(GO:0018352) |
| 1.6 | 6.4 | GO:0006556 | S-adenosylmethionine biosynthetic process(GO:0006556) |
| 1.5 | 6.1 | GO:0010982 | regulation of high-density lipoprotein particle clearance(GO:0010982) positive regulation of high-density lipoprotein particle clearance(GO:0010983) |
| 1.5 | 4.4 | GO:1990641 | response to iron ion starvation(GO:1990641) |
| 1.4 | 18.3 | GO:0045329 | carnitine biosynthetic process(GO:0045329) |
| 1.4 | 8.4 | GO:0006850 | mitochondrial pyruvate transport(GO:0006850) mitochondrial pyruvate transmembrane transport(GO:1902361) |
| 1.4 | 8.3 | GO:2001271 | negative regulation of cysteine-type endopeptidase activity involved in execution phase of apoptosis(GO:2001271) |
| 1.4 | 8.2 | GO:0032900 | negative regulation of neurotrophin production(GO:0032900) |
| 1.3 | 7.7 | GO:0044752 | response to human chorionic gonadotropin(GO:0044752) |
| 1.3 | 6.4 | GO:0003068 | age-dependent response to oxidative stress(GO:0001306) age-dependent response to reactive oxygen species(GO:0001315) regulation of systemic arterial blood pressure by acetylcholine(GO:0003068) vasodilation by acetylcholine involved in regulation of systemic arterial blood pressure(GO:0003069) regulation of systemic arterial blood pressure by neurotransmitter(GO:0003070) age-dependent general metabolic decline(GO:0007571) |
| 1.3 | 7.6 | GO:1901523 | leukotriene catabolic process(GO:0036100) leukotriene B4 catabolic process(GO:0036101) leukotriene B4 metabolic process(GO:0036102) icosanoid catabolic process(GO:1901523) fatty acid derivative catabolic process(GO:1901569) |
| 1.3 | 3.8 | GO:0006711 | estrogen catabolic process(GO:0006711) |
| 1.3 | 11.3 | GO:0001561 | fatty acid alpha-oxidation(GO:0001561) |
| 1.3 | 16.4 | GO:0015705 | iodide transport(GO:0015705) |
| 1.3 | 5.0 | GO:0002933 | lipid hydroxylation(GO:0002933) |
| 1.3 | 3.8 | GO:0042938 | dipeptide transport(GO:0042938) |
| 1.2 | 3.7 | GO:0051066 | dihydrobiopterin metabolic process(GO:0051066) |
| 1.2 | 3.7 | GO:0034769 | basement membrane disassembly(GO:0034769) |
| 1.2 | 4.9 | GO:0016098 | monoterpenoid metabolic process(GO:0016098) |
| 1.2 | 7.2 | GO:1900220 | semaphorin-plexin signaling pathway involved in bone trabecula morphogenesis(GO:1900220) |
| 1.2 | 15.6 | GO:0051388 | positive regulation of neurotrophin TRK receptor signaling pathway(GO:0051388) |
| 1.2 | 8.4 | GO:0032439 | endosome localization(GO:0032439) |
| 1.2 | 1.2 | GO:0060327 | cytoplasmic actin-based contraction involved in cell motility(GO:0060327) |
| 1.1 | 13.5 | GO:0070560 | protein secretion by platelet(GO:0070560) |
| 1.1 | 10.0 | GO:0031444 | slow-twitch skeletal muscle fiber contraction(GO:0031444) |
| 1.1 | 4.4 | GO:0071422 | succinate transport(GO:0015744) succinate transmembrane transport(GO:0071422) |
| 1.1 | 4.4 | GO:0046356 | acetyl-CoA catabolic process(GO:0046356) |
| 1.1 | 6.5 | GO:0006127 | glycerophosphate shuttle(GO:0006127) |
| 1.1 | 17.0 | GO:0031580 | membrane raft polarization(GO:0001766) membrane raft distribution(GO:0031580) |
| 1.0 | 5.2 | GO:0002528 | regulation of vascular permeability involved in acute inflammatory response(GO:0002528) |
| 1.0 | 3.1 | GO:0001978 | regulation of systemic arterial blood pressure by carotid sinus baroreceptor feedback(GO:0001978) baroreceptor response to increased systemic arterial blood pressure(GO:0001983) |
| 1.0 | 2.0 | GO:0032902 | nerve growth factor production(GO:0032902) |
| 1.0 | 4.1 | GO:0038060 | nitric oxide-cGMP-mediated signaling pathway(GO:0038060) |
| 1.0 | 6.1 | GO:0051552 | flavone metabolic process(GO:0051552) |
| 1.0 | 12.0 | GO:0016554 | cytidine to uridine editing(GO:0016554) |
| 1.0 | 3.0 | GO:0071206 | establishment of protein localization to juxtaparanode region of axon(GO:0071206) |
| 1.0 | 2.9 | GO:0016340 | calcium-dependent cell-matrix adhesion(GO:0016340) |
| 1.0 | 4.8 | GO:0033563 | dorsal/ventral axon guidance(GO:0033563) |
| 1.0 | 10.6 | GO:0006552 | leucine catabolic process(GO:0006552) |
| 0.9 | 2.8 | GO:0009236 | cobalamin biosynthetic process(GO:0009236) |
| 0.9 | 15.1 | GO:0070777 | D-aspartate transport(GO:0070777) D-aspartate import(GO:0070779) |
| 0.9 | 5.6 | GO:0001757 | somite specification(GO:0001757) |
| 0.9 | 3.7 | GO:0042939 | glutathione transport(GO:0034635) tripeptide transport(GO:0042939) |
| 0.9 | 1.8 | GO:2000296 | negative regulation of hydrogen peroxide catabolic process(GO:2000296) |
| 0.9 | 2.7 | GO:0006579 | amino-acid betaine catabolic process(GO:0006579) |
| 0.9 | 5.4 | GO:0046952 | ketone body catabolic process(GO:0046952) |
| 0.9 | 7.2 | GO:0072660 | maintenance of protein location in membrane(GO:0072658) maintenance of protein location in plasma membrane(GO:0072660) positive regulation of membrane depolarization during cardiac muscle cell action potential(GO:1900827) |
| 0.9 | 10.5 | GO:0070315 | G1 to G0 transition involved in cell differentiation(GO:0070315) |
| 0.9 | 6.1 | GO:0019556 | histidine catabolic process to glutamate and formamide(GO:0019556) histidine catabolic process to glutamate and formate(GO:0019557) formamide metabolic process(GO:0043606) |
| 0.9 | 2.6 | GO:0015993 | molecular hydrogen transport(GO:0015993) |
| 0.9 | 11.9 | GO:0016191 | synaptic vesicle uncoating(GO:0016191) |
| 0.9 | 13.6 | GO:2000664 | positive regulation of interleukin-5 secretion(GO:2000664) |
| 0.8 | 2.5 | GO:0007525 | somatic muscle development(GO:0007525) |
| 0.8 | 2.5 | GO:0006106 | fumarate metabolic process(GO:0006106) |
| 0.8 | 3.3 | GO:1904045 | cellular response to aldosterone(GO:1904045) |
| 0.8 | 4.1 | GO:0032571 | response to vitamin K(GO:0032571) |
| 0.8 | 2.5 | GO:0036111 | very long-chain fatty-acyl-CoA metabolic process(GO:0036111) |
| 0.8 | 2.5 | GO:0015881 | creatine transport(GO:0015881) creatine transmembrane transport(GO:1902598) |
| 0.8 | 4.1 | GO:0008078 | mesodermal cell migration(GO:0008078) |
| 0.8 | 3.2 | GO:1901624 | negative regulation of lymphocyte chemotaxis(GO:1901624) |
| 0.8 | 6.4 | GO:0036112 | medium-chain fatty-acyl-CoA metabolic process(GO:0036112) |
| 0.8 | 20.9 | GO:0006590 | thyroid hormone generation(GO:0006590) |
| 0.8 | 0.8 | GO:0010157 | response to chlorate(GO:0010157) |
| 0.8 | 3.9 | GO:0007206 | phospholipase C-activating G-protein coupled glutamate receptor signaling pathway(GO:0007206) |
| 0.8 | 14.9 | GO:1902222 | L-phenylalanine metabolic process(GO:0006558) L-phenylalanine catabolic process(GO:0006559) erythrose 4-phosphate/phosphoenolpyruvate family amino acid metabolic process(GO:1902221) erythrose 4-phosphate/phosphoenolpyruvate family amino acid catabolic process(GO:1902222) |
| 0.8 | 3.1 | GO:0098971 | anterograde dendritic transport of neurotransmitter receptor complex(GO:0098971) |
| 0.8 | 3.9 | GO:0019626 | short-chain fatty acid catabolic process(GO:0019626) |
| 0.8 | 4.6 | GO:0061091 | regulation of phospholipid translocation(GO:0061091) positive regulation of phospholipid translocation(GO:0061092) |
| 0.8 | 3.1 | GO:0045014 | carbon catabolite repression of transcription(GO:0045013) negative regulation of transcription by glucose(GO:0045014) |
| 0.8 | 2.3 | GO:0035928 | rRNA import into mitochondrion(GO:0035928) |
| 0.8 | 4.6 | GO:1904209 | regulation of chemokine (C-C motif) ligand 2 secretion(GO:1904207) positive regulation of chemokine (C-C motif) ligand 2 secretion(GO:1904209) |
| 0.8 | 21.4 | GO:0051823 | regulation of synapse structural plasticity(GO:0051823) |
| 0.8 | 3.0 | GO:0040040 | thermosensory behavior(GO:0040040) |
| 0.7 | 2.2 | GO:0019243 | methylglyoxal catabolic process to D-lactate via S-lactoyl-glutathione(GO:0019243) methylglyoxal catabolic process(GO:0051596) methylglyoxal catabolic process to lactate(GO:0061727) |
| 0.7 | 2.2 | GO:0072248 | metanephric glomerular epithelium development(GO:0072244) metanephric glomerular visceral epithelial cell differentiation(GO:0072248) metanephric glomerular visceral epithelial cell development(GO:0072249) metanephric glomerular epithelial cell differentiation(GO:0072312) metanephric glomerular epithelial cell development(GO:0072313) |
| 0.7 | 3.0 | GO:0031548 | regulation of brain-derived neurotrophic factor receptor signaling pathway(GO:0031548) |
| 0.7 | 1.5 | GO:0090611 | ubiquitin-independent protein catabolic process via the multivesicular body sorting pathway(GO:0090611) |
| 0.7 | 2.2 | GO:0052331 | hemolysis by symbiont of host erythrocytes(GO:0019836) hemolysis in other organism(GO:0044179) hemolysis in other organism involved in symbiotic interaction(GO:0052331) |
| 0.7 | 13.9 | GO:0016540 | protein autoprocessing(GO:0016540) |
| 0.7 | 2.9 | GO:0051919 | positive regulation of fibrinolysis(GO:0051919) |
| 0.7 | 2.9 | GO:1903059 | regulation of protein lipidation(GO:1903059) |
| 0.7 | 1.5 | GO:0033076 | isoquinoline alkaloid metabolic process(GO:0033076) |
| 0.7 | 0.7 | GO:0060995 | cell-cell signaling involved in kidney development(GO:0060995) Wnt signaling pathway involved in kidney development(GO:0061289) canonical Wnt signaling pathway involved in metanephric kidney development(GO:0061290) cell-cell signaling involved in metanephros development(GO:0072204) |
| 0.7 | 2.2 | GO:0019287 | isopentenyl diphosphate biosynthetic process, mevalonate pathway(GO:0019287) |
| 0.7 | 2.1 | GO:0019464 | glycine catabolic process(GO:0006546) glycine decarboxylation via glycine cleavage system(GO:0019464) |
| 0.7 | 11.3 | GO:0071316 | cellular response to nicotine(GO:0071316) |
| 0.7 | 12.7 | GO:1990573 | potassium ion import across plasma membrane(GO:1990573) |
| 0.7 | 3.5 | GO:0042851 | L-alanine metabolic process(GO:0042851) L-alanine catabolic process(GO:0042853) |
| 0.7 | 2.8 | GO:1902896 | terminal web assembly(GO:1902896) |
| 0.7 | 4.8 | GO:0032377 | regulation of intracellular lipid transport(GO:0032377) regulation of intracellular sterol transport(GO:0032380) regulation of intracellular cholesterol transport(GO:0032383) |
| 0.7 | 7.5 | GO:0046951 | ketone body biosynthetic process(GO:0046951) |
| 0.7 | 2.7 | GO:0060061 | Spemann organizer formation(GO:0060061) |
| 0.7 | 8.2 | GO:0046959 | habituation(GO:0046959) |
| 0.7 | 3.4 | GO:0051612 | negative regulation of neurotransmitter uptake(GO:0051581) regulation of serotonin uptake(GO:0051611) negative regulation of serotonin uptake(GO:0051612) |
| 0.7 | 5.4 | GO:0061709 | reticulophagy(GO:0061709) |
| 0.7 | 2.7 | GO:0045212 | negative regulation of synaptic transmission, cholinergic(GO:0032223) neurotransmitter receptor biosynthetic process(GO:0045212) |
| 0.7 | 2.0 | GO:0070314 | G1 to G0 transition(GO:0070314) |
| 0.7 | 4.0 | GO:0071955 | recycling endosome to Golgi transport(GO:0071955) |
| 0.7 | 2.0 | GO:0006147 | guanine catabolic process(GO:0006147) |
| 0.7 | 2.0 | GO:0036047 | protein demalonylation(GO:0036046) peptidyl-lysine demalonylation(GO:0036047) protein desuccinylation(GO:0036048) peptidyl-lysine desuccinylation(GO:0036049) protein deglutarylation(GO:0061698) peptidyl-lysine deglutarylation(GO:0061699) |
| 0.7 | 3.9 | GO:0052696 | flavonoid glucuronidation(GO:0052696) xenobiotic glucuronidation(GO:0052697) |
| 0.7 | 4.6 | GO:0015015 | heparan sulfate proteoglycan biosynthetic process, enzymatic modification(GO:0015015) |
| 0.7 | 2.6 | GO:1903371 | regulation of endoplasmic reticulum tubular network organization(GO:1903371) |
| 0.6 | 2.6 | GO:0060596 | mammary placode formation(GO:0060596) |
| 0.6 | 3.2 | GO:0038163 | thrombopoietin-mediated signaling pathway(GO:0038163) |
| 0.6 | 1.9 | GO:1901053 | sarcosine metabolic process(GO:1901052) sarcosine catabolic process(GO:1901053) |
| 0.6 | 1.9 | GO:1904640 | response to methionine(GO:1904640) |
| 0.6 | 3.2 | GO:0032425 | positive regulation of mismatch repair(GO:0032425) |
| 0.6 | 8.2 | GO:0030240 | skeletal muscle thin filament assembly(GO:0030240) |
| 0.6 | 2.5 | GO:0098957 | anterograde axonal transport of mitochondrion(GO:0098957) |
| 0.6 | 3.7 | GO:0010751 | negative regulation of nitric oxide mediated signal transduction(GO:0010751) |
| 0.6 | 5.0 | GO:0032185 | septin cytoskeleton organization(GO:0032185) |
| 0.6 | 5.5 | GO:0042738 | exogenous drug catabolic process(GO:0042738) |
| 0.6 | 9.8 | GO:0006591 | ornithine metabolic process(GO:0006591) |
| 0.6 | 1.8 | GO:0035565 | regulation of pronephros size(GO:0035565) |
| 0.6 | 1.2 | GO:0010749 | regulation of nitric oxide mediated signal transduction(GO:0010749) |
| 0.6 | 0.6 | GO:0035993 | deltoid tuberosity development(GO:0035993) |
| 0.6 | 3.0 | GO:0070837 | dehydroascorbic acid transport(GO:0070837) |
| 0.6 | 1.2 | GO:0014878 | response to electrical stimulus involved in regulation of muscle adaptation(GO:0014878) |
| 0.6 | 13.0 | GO:0046838 | phosphorylated carbohydrate dephosphorylation(GO:0046838) inositol phosphate dephosphorylation(GO:0046855) |
| 0.6 | 17.6 | GO:0010666 | positive regulation of striated muscle cell apoptotic process(GO:0010663) positive regulation of cardiac muscle cell apoptotic process(GO:0010666) |
| 0.6 | 1.1 | GO:0045994 | positive regulation of translational initiation by iron(GO:0045994) |
| 0.6 | 1.7 | GO:0035995 | detection of muscle stretch(GO:0035995) |
| 0.6 | 3.4 | GO:0033615 | mitochondrial proton-transporting ATP synthase complex assembly(GO:0033615) |
| 0.6 | 0.6 | GO:0048743 | positive regulation of skeletal muscle fiber development(GO:0048743) |
| 0.6 | 1.7 | GO:0098928 | presynaptic signal transduction(GO:0098928) presynapse to nucleus signaling pathway(GO:0099526) |
| 0.5 | 2.7 | GO:0003025 | regulation of systemic arterial blood pressure by baroreceptor feedback(GO:0003025) |
| 0.5 | 4.4 | GO:0060373 | regulation of ventricular cardiac muscle cell membrane depolarization(GO:0060373) |
| 0.5 | 2.2 | GO:0035498 | carnosine metabolic process(GO:0035498) |
| 0.5 | 0.5 | GO:0032899 | regulation of neurotrophin production(GO:0032899) |
| 0.5 | 6.5 | GO:0032286 | central nervous system myelin maintenance(GO:0032286) |
| 0.5 | 1.6 | GO:0001994 | norepinephrine-epinephrine vasoconstriction involved in regulation of systemic arterial blood pressure(GO:0001994) |
| 0.5 | 2.7 | GO:0006258 | UDP-glucose catabolic process(GO:0006258) |
| 0.5 | 9.0 | GO:0035745 | T-helper 2 cell cytokine production(GO:0035745) |
| 0.5 | 14.8 | GO:0036315 | cellular response to sterol(GO:0036315) |
| 0.5 | 3.2 | GO:0033489 | cholesterol biosynthetic process via desmosterol(GO:0033489) cholesterol biosynthetic process via lathosterol(GO:0033490) |
| 0.5 | 4.7 | GO:0009450 | gamma-aminobutyric acid catabolic process(GO:0009450) |
| 0.5 | 1.6 | GO:0051695 | actin filament uncapping(GO:0051695) |
| 0.5 | 1.0 | GO:0006447 | regulation of translational initiation by iron(GO:0006447) |
| 0.5 | 12.5 | GO:0055003 | cardiac myofibril assembly(GO:0055003) |
| 0.5 | 4.7 | GO:0031914 | negative regulation of synaptic plasticity(GO:0031914) |
| 0.5 | 3.1 | GO:1904217 | regulation of CDP-diacylglycerol-serine O-phosphatidyltransferase activity(GO:1904217) positive regulation of CDP-diacylglycerol-serine O-phosphatidyltransferase activity(GO:1904219) positive regulation of serine C-palmitoyltransferase activity(GO:1904222) |
| 0.5 | 1.5 | GO:1903461 | Okazaki fragment processing involved in mitotic DNA replication(GO:1903461) |
| 0.5 | 3.1 | GO:0046618 | drug export(GO:0046618) |
| 0.5 | 5.1 | GO:0045218 | zonula adherens maintenance(GO:0045218) |
| 0.5 | 2.5 | GO:0002384 | hepatic immune response(GO:0002384) |
| 0.5 | 2.5 | GO:0006729 | tetrahydrobiopterin biosynthetic process(GO:0006729) tetrahydrobiopterin metabolic process(GO:0046146) |
| 0.5 | 3.0 | GO:0097327 | response to antineoplastic agent(GO:0097327) |
| 0.5 | 1.5 | GO:0007500 | mesodermal cell fate determination(GO:0007500) |
| 0.5 | 3.0 | GO:0006116 | NADH oxidation(GO:0006116) |
| 0.5 | 1.5 | GO:0033861 | negative regulation of NAD(P)H oxidase activity(GO:0033861) |
| 0.5 | 3.4 | GO:0071896 | protein localization to adherens junction(GO:0071896) |
| 0.5 | 1.5 | GO:0097187 | dentinogenesis(GO:0097187) |
| 0.5 | 1.0 | GO:0009804 | coumarin metabolic process(GO:0009804) |
| 0.5 | 1.5 | GO:0016185 | synaptic vesicle budding from presynaptic endocytic zone membrane(GO:0016185) |
| 0.5 | 8.3 | GO:1900029 | positive regulation of ruffle assembly(GO:1900029) |
| 0.5 | 1.5 | GO:2001027 | negative regulation of endothelial cell chemotaxis(GO:2001027) |
| 0.5 | 1.9 | GO:1902809 | regulation of skeletal muscle fiber differentiation(GO:1902809) |
| 0.5 | 4.3 | GO:0061002 | negative regulation of dendritic spine morphogenesis(GO:0061002) |
| 0.5 | 1.4 | GO:0097195 | pilomotor reflex(GO:0097195) |
| 0.5 | 2.4 | GO:0015772 | disaccharide transport(GO:0015766) sucrose transport(GO:0015770) oligosaccharide transport(GO:0015772) |
| 0.5 | 3.8 | GO:0010248 | establishment or maintenance of transmembrane electrochemical gradient(GO:0010248) |
| 0.5 | 1.9 | GO:0044537 | regulation of circulating fibrinogen levels(GO:0044537) |
| 0.5 | 1.4 | GO:0019858 | cytosine metabolic process(GO:0019858) |
| 0.5 | 1.9 | GO:0098707 | ferrous iron import into cell(GO:0097460) ferrous iron import across plasma membrane(GO:0098707) |
| 0.5 | 1.4 | GO:0061713 | neural crest cell migration involved in heart formation(GO:0003147) cell migration involved in heart formation(GO:0060974) anterior neural tube closure(GO:0061713) |
| 0.5 | 1.9 | GO:0009258 | 10-formyltetrahydrofolate catabolic process(GO:0009258) |
| 0.5 | 1.8 | GO:0060168 | positive regulation of adenosine receptor signaling pathway(GO:0060168) |
| 0.5 | 7.7 | GO:0070445 | oligodendrocyte progenitor proliferation(GO:0070444) regulation of oligodendrocyte progenitor proliferation(GO:0070445) |
| 0.5 | 1.8 | GO:1990523 | bone regeneration(GO:1990523) |
| 0.5 | 1.4 | GO:1903015 | regulation of exo-alpha-sialidase activity(GO:1903015) |
| 0.5 | 1.8 | GO:0019285 | glycine betaine biosynthetic process from choline(GO:0019285) glycine betaine metabolic process(GO:0031455) glycine betaine biosynthetic process(GO:0031456) |
| 0.4 | 4.9 | GO:1901660 | calcium ion export(GO:1901660) |
| 0.4 | 7.2 | GO:0070070 | proton-transporting V-type ATPase complex assembly(GO:0070070) vacuolar proton-transporting V-type ATPase complex assembly(GO:0070072) |
| 0.4 | 10.3 | GO:0015868 | purine ribonucleotide transport(GO:0015868) |
| 0.4 | 1.3 | GO:1902595 | regulation of DNA replication origin binding(GO:1902595) |
| 0.4 | 1.3 | GO:0070541 | response to platinum ion(GO:0070541) |
| 0.4 | 3.9 | GO:1902255 | positive regulation of intrinsic apoptotic signaling pathway by p53 class mediator(GO:1902255) |
| 0.4 | 12.6 | GO:0071420 | cellular response to histamine(GO:0071420) |
| 0.4 | 1.3 | GO:0006931 | substrate-dependent cell migration, cell attachment to substrate(GO:0006931) |
| 0.4 | 1.3 | GO:0048213 | Golgi vesicle prefusion complex stabilization(GO:0048213) |
| 0.4 | 1.3 | GO:1990697 | protein depalmitoleylation(GO:1990697) |
| 0.4 | 2.2 | GO:0035750 | protein localization to myelin sheath abaxonal region(GO:0035750) |
| 0.4 | 2.2 | GO:0035900 | response to isolation stress(GO:0035900) |
| 0.4 | 2.6 | GO:1902202 | regulation of hepatocyte growth factor receptor signaling pathway(GO:1902202) |
| 0.4 | 1.7 | GO:0009305 | protein biotinylation(GO:0009305) response to biotin(GO:0070781) histone biotinylation(GO:0071110) |
| 0.4 | 2.6 | GO:0098746 | fast, calcium ion-dependent exocytosis of neurotransmitter(GO:0098746) |
| 0.4 | 0.8 | GO:2000722 | regulation of cardiac vascular smooth muscle cell differentiation(GO:2000722) positive regulation of cardiac vascular smooth muscle cell differentiation(GO:2000724) |
| 0.4 | 1.7 | GO:0016062 | adaptation of rhodopsin mediated signaling(GO:0016062) light adaption(GO:0036367) |
| 0.4 | 0.4 | GO:0036115 | fatty-acyl-CoA catabolic process(GO:0036115) |
| 0.4 | 3.4 | GO:0072139 | glomerular parietal epithelial cell differentiation(GO:0072139) positive regulation of epithelial cell differentiation involved in kidney development(GO:2000698) positive regulation of nephron tubule epithelial cell differentiation(GO:2000768) |
| 0.4 | 1.3 | GO:0046338 | phosphatidylethanolamine catabolic process(GO:0046338) |
| 0.4 | 7.1 | GO:0042355 | fucose catabolic process(GO:0019317) L-fucose metabolic process(GO:0042354) L-fucose catabolic process(GO:0042355) |
| 0.4 | 2.1 | GO:1901846 | positive regulation of cell communication by electrical coupling involved in cardiac conduction(GO:1901846) |
| 0.4 | 3.3 | GO:0019236 | response to pheromone(GO:0019236) |
| 0.4 | 6.2 | GO:0086018 | SA node cell action potential(GO:0086015) SA node cell to atrial cardiac muscle cell signalling(GO:0086018) |
| 0.4 | 7.4 | GO:2000291 | regulation of myoblast proliferation(GO:2000291) |
| 0.4 | 9.5 | GO:0045199 | maintenance of apical/basal cell polarity(GO:0035090) maintenance of epithelial cell apical/basal polarity(GO:0045199) |
| 0.4 | 3.3 | GO:0045163 | clustering of voltage-gated potassium channels(GO:0045163) |
| 0.4 | 2.5 | GO:0007468 | regulation of rhodopsin gene expression(GO:0007468) |
| 0.4 | 4.9 | GO:2001288 | positive regulation of caveolin-mediated endocytosis(GO:2001288) |
| 0.4 | 0.8 | GO:0010735 | positive regulation of transcription via serum response element binding(GO:0010735) |
| 0.4 | 1.2 | GO:0032824 | negative regulation of natural killer cell differentiation(GO:0032824) negative regulation of natural killer cell differentiation involved in immune response(GO:0032827) |
| 0.4 | 1.6 | GO:0050993 | dimethylallyl diphosphate biosynthetic process(GO:0050992) dimethylallyl diphosphate metabolic process(GO:0050993) |
| 0.4 | 5.2 | GO:0060681 | branch elongation involved in ureteric bud branching(GO:0060681) |
| 0.4 | 1.6 | GO:0097032 | respiratory chain complex II assembly(GO:0034552) mitochondrial respiratory chain complex II assembly(GO:0034553) mitochondrial respiratory chain complex II biogenesis(GO:0097032) |
| 0.4 | 7.9 | GO:0061302 | smooth muscle cell-matrix adhesion(GO:0061302) |
| 0.4 | 2.0 | GO:2000538 | regulation of cGMP-mediated signaling(GO:0010752) regulation of B cell chemotaxis(GO:2000537) positive regulation of B cell chemotaxis(GO:2000538) |
| 0.4 | 2.3 | GO:1901159 | glucuronate catabolic process(GO:0006064) glucuronate catabolic process to xylulose 5-phosphate(GO:0019640) xylulose 5-phosphate metabolic process(GO:0051167) xylulose 5-phosphate biosynthetic process(GO:1901159) |
| 0.4 | 1.2 | GO:0043321 | regulation of natural killer cell degranulation(GO:0043321) positive regulation of natural killer cell degranulation(GO:0043323) |
| 0.4 | 0.4 | GO:0042137 | sequestering of neurotransmitter(GO:0042137) |
| 0.4 | 5.4 | GO:0048711 | positive regulation of astrocyte differentiation(GO:0048711) |
| 0.4 | 1.9 | GO:0097105 | presynaptic membrane assembly(GO:0097105) |
| 0.4 | 1.9 | GO:0043474 | eye pigment biosynthetic process(GO:0006726) eye pigment metabolic process(GO:0042441) pigment metabolic process involved in developmental pigmentation(GO:0043324) pigment metabolic process involved in pigmentation(GO:0043474) |
| 0.4 | 13.8 | GO:0031115 | negative regulation of microtubule polymerization(GO:0031115) |
| 0.4 | 1.1 | GO:1902224 | ketone body metabolic process(GO:1902224) |
| 0.4 | 6.1 | GO:0021842 | directional guidance of interneurons involved in migration from the subpallium to the cortex(GO:0021840) chemorepulsion involved in interneuron migration from the subpallium to the cortex(GO:0021842) |
| 0.4 | 1.9 | GO:0097056 | selenocysteinyl-tRNA(Sec) biosynthetic process(GO:0097056) |
| 0.4 | 1.9 | GO:0033031 | positive regulation of neutrophil apoptotic process(GO:0033031) |
| 0.4 | 1.5 | GO:0072134 | nephrogenic mesenchyme morphogenesis(GO:0072134) allantois development(GO:1905069) |
| 0.4 | 2.6 | GO:1900242 | regulation of synaptic vesicle endocytosis(GO:1900242) |
| 0.4 | 3.3 | GO:0015840 | urea transport(GO:0015840) |
| 0.4 | 1.9 | GO:0030573 | bile acid catabolic process(GO:0030573) |
| 0.4 | 1.5 | GO:0010900 | negative regulation of phosphatidylcholine catabolic process(GO:0010900) |
| 0.4 | 4.4 | GO:1990822 | basic amino acid transmembrane transport(GO:1990822) |
| 0.4 | 5.1 | GO:0035331 | negative regulation of hippo signaling(GO:0035331) |
| 0.4 | 1.1 | GO:0050976 | detection of mechanical stimulus involved in sensory perception of touch(GO:0050976) cellular response to alkaline pH(GO:0071469) |
| 0.4 | 1.1 | GO:0019303 | D-ribose catabolic process(GO:0019303) |
| 0.4 | 1.1 | GO:0090071 | negative regulation of ribosome biogenesis(GO:0090071) |
| 0.4 | 3.2 | GO:0051725 | protein de-ADP-ribosylation(GO:0051725) |
| 0.4 | 2.1 | GO:0055009 | atrial cardiac muscle tissue development(GO:0003228) atrial cardiac muscle tissue morphogenesis(GO:0055009) |
| 0.4 | 2.1 | GO:0006565 | L-serine catabolic process(GO:0006565) cysteine catabolic process(GO:0009093) L-cysteine catabolic process(GO:0019448) L-cysteine metabolic process(GO:0046439) |
| 0.4 | 2.1 | GO:0061732 | mitochondrial acetyl-CoA biosynthetic process from pyruvate(GO:0061732) |
| 0.4 | 1.8 | GO:2000980 | regulation of auditory receptor cell differentiation(GO:0045607) regulation of mechanoreceptor differentiation(GO:0045631) regulation of inner ear receptor cell differentiation(GO:2000980) |
| 0.4 | 1.4 | GO:0006169 | adenosine salvage(GO:0006169) dATP biosynthetic process(GO:0006175) |
| 0.4 | 0.4 | GO:0016115 | terpenoid catabolic process(GO:0016115) |
| 0.4 | 2.5 | GO:0048630 | skeletal muscle tissue growth(GO:0048630) |
| 0.3 | 3.8 | GO:0042167 | porphyrin-containing compound catabolic process(GO:0006787) tetrapyrrole catabolic process(GO:0033015) heme catabolic process(GO:0042167) pigment catabolic process(GO:0046149) |
| 0.3 | 0.7 | GO:0070244 | negative regulation of thymocyte apoptotic process(GO:0070244) |
| 0.3 | 3.8 | GO:0033211 | adiponectin-activated signaling pathway(GO:0033211) |
| 0.3 | 6.2 | GO:0071681 | response to indole-3-methanol(GO:0071680) cellular response to indole-3-methanol(GO:0071681) |
| 0.3 | 1.7 | GO:0072709 | cellular response to sorbitol(GO:0072709) |
| 0.3 | 1.4 | GO:0098902 | regulation of membrane depolarization during action potential(GO:0098902) |
| 0.3 | 2.7 | GO:1900383 | regulation of synaptic plasticity by receptor localization to synapse(GO:1900383) |
| 0.3 | 0.7 | GO:2001245 | regulation of phosphatidylcholine biosynthetic process(GO:2001245) |
| 0.3 | 1.0 | GO:0034653 | diterpenoid catabolic process(GO:0016103) retinoic acid catabolic process(GO:0034653) |
| 0.3 | 16.0 | GO:0043252 | sodium-independent organic anion transport(GO:0043252) |
| 0.3 | 3.1 | GO:0070164 | negative regulation of adiponectin secretion(GO:0070164) |
| 0.3 | 3.0 | GO:0043152 | induction of bacterial agglutination(GO:0043152) |
| 0.3 | 2.3 | GO:0015798 | myo-inositol transport(GO:0015798) |
| 0.3 | 1.7 | GO:0030821 | negative regulation of cyclic nucleotide catabolic process(GO:0030806) negative regulation of cAMP catabolic process(GO:0030821) |
| 0.3 | 2.0 | GO:0070627 | ferrous iron import(GO:0070627) |
| 0.3 | 6.3 | GO:0098719 | sodium ion import across plasma membrane(GO:0098719) sodium ion import into cell(GO:1990118) |
| 0.3 | 1.7 | GO:0051758 | homologous chromosome movement towards spindle pole involved in homologous chromosome segregation(GO:0051758) |
| 0.3 | 2.0 | GO:0090160 | Golgi to lysosome transport(GO:0090160) |
| 0.3 | 11.6 | GO:0043162 | ubiquitin-dependent protein catabolic process via the multivesicular body sorting pathway(GO:0043162) |
| 0.3 | 2.3 | GO:0006543 | glutamine catabolic process(GO:0006543) |
| 0.3 | 1.3 | GO:0044861 | protein transport into plasma membrane raft(GO:0044861) |
| 0.3 | 1.0 | GO:0043000 | Golgi to plasma membrane CFTR protein transport(GO:0043000) |
| 0.3 | 8.5 | GO:0006853 | carnitine shuttle(GO:0006853) |
| 0.3 | 1.0 | GO:0061687 | detoxification of inorganic compound(GO:0061687) |
| 0.3 | 0.3 | GO:0072054 | renal inner medulla development(GO:0072053) renal outer medulla development(GO:0072054) |
| 0.3 | 3.2 | GO:0051599 | response to hydrostatic pressure(GO:0051599) |
| 0.3 | 1.3 | GO:0048388 | endosomal lumen acidification(GO:0048388) |
| 0.3 | 17.7 | GO:0010107 | potassium ion import(GO:0010107) |
| 0.3 | 1.9 | GO:0038016 | insulin receptor internalization(GO:0038016) |
| 0.3 | 5.1 | GO:0032836 | glomerular basement membrane development(GO:0032836) |
| 0.3 | 0.3 | GO:0098917 | retrograde trans-synaptic signaling(GO:0098917) |
| 0.3 | 1.9 | GO:0045915 | positive regulation of catecholamine metabolic process(GO:0045915) positive regulation of dopamine metabolic process(GO:0045964) |
| 0.3 | 1.3 | GO:0002881 | negative regulation of chronic inflammatory response to non-antigenic stimulus(GO:0002881) |
| 0.3 | 6.0 | GO:0046519 | sphingoid metabolic process(GO:0046519) |
| 0.3 | 1.3 | GO:0019520 | aldonic acid metabolic process(GO:0019520) D-gluconate metabolic process(GO:0019521) |
| 0.3 | 0.9 | GO:0042361 | menaquinone catabolic process(GO:0042361) vitamin K catabolic process(GO:0042377) |
| 0.3 | 8.2 | GO:0008228 | opsonization(GO:0008228) |
| 0.3 | 1.2 | GO:0072023 | thick ascending limb development(GO:0072023) metanephric thick ascending limb development(GO:0072233) |
| 0.3 | 3.1 | GO:0070995 | NADPH oxidation(GO:0070995) |
| 0.3 | 0.6 | GO:0036146 | cellular response to mycotoxin(GO:0036146) |
| 0.3 | 3.7 | GO:1904352 | positive regulation of protein catabolic process in the vacuole(GO:1904352) |
| 0.3 | 1.9 | GO:0009256 | 10-formyltetrahydrofolate metabolic process(GO:0009256) |
| 0.3 | 2.5 | GO:0030242 | pexophagy(GO:0030242) |
| 0.3 | 3.1 | GO:0021633 | optic nerve structural organization(GO:0021633) |
| 0.3 | 6.5 | GO:0035020 | regulation of Rac protein signal transduction(GO:0035020) |
| 0.3 | 0.9 | GO:0003050 | regulation of systemic arterial blood pressure by atrial natriuretic peptide(GO:0003050) |
| 0.3 | 1.2 | GO:0043335 | protein unfolding(GO:0043335) |
| 0.3 | 1.2 | GO:2001013 | epithelial cell proliferation involved in renal tubule morphogenesis(GO:2001013) |
| 0.3 | 1.5 | GO:0043456 | regulation of pentose-phosphate shunt(GO:0043456) |
| 0.3 | 1.5 | GO:1903385 | regulation of homophilic cell adhesion(GO:1903385) |
| 0.3 | 0.9 | GO:1903452 | regulation of G1 to G0 transition(GO:1903450) positive regulation of G1 to G0 transition(GO:1903452) |
| 0.3 | 1.2 | GO:1901079 | positive regulation of relaxation of muscle(GO:1901079) |
| 0.3 | 1.2 | GO:0044240 | multicellular organism lipid catabolic process(GO:0044240) |
| 0.3 | 0.3 | GO:0070272 | proton-transporting ATP synthase complex assembly(GO:0043461) proton-transporting ATP synthase complex biogenesis(GO:0070272) |
| 0.3 | 6.3 | GO:0015812 | gamma-aminobutyric acid transport(GO:0015812) |
| 0.3 | 11.7 | GO:0016338 | calcium-independent cell-cell adhesion via plasma membrane cell-adhesion molecules(GO:0016338) |
| 0.3 | 0.9 | GO:1903937 | response to acrylamide(GO:1903937) |
| 0.3 | 8.6 | GO:0015988 | energy coupled proton transmembrane transport, against electrochemical gradient(GO:0015988) |
| 0.3 | 0.9 | GO:0099540 | synaptic signaling via neuropeptide(GO:0099538) trans-synaptic signaling by neuropeptide(GO:0099540) trans-synaptic signaling by neuropeptide, modulating synaptic transmission(GO:0099551) |
| 0.3 | 0.9 | GO:0016116 | tetraterpenoid metabolic process(GO:0016108) carotenoid metabolic process(GO:0016116) carotene catabolic process(GO:0016121) xanthophyll metabolic process(GO:0016122) terpene catabolic process(GO:0046247) |
| 0.3 | 5.3 | GO:1901750 | leukotriene D4 metabolic process(GO:1901748) leukotriene D4 biosynthetic process(GO:1901750) |
| 0.3 | 1.2 | GO:0090258 | negative regulation of mitochondrial fission(GO:0090258) |
| 0.3 | 0.3 | GO:0090118 | receptor-mediated endocytosis of low-density lipoprotein particle involved in cholesterol transport(GO:0090118) |
| 0.3 | 0.9 | GO:0001808 | negative regulation of type IV hypersensitivity(GO:0001808) |
| 0.3 | 0.6 | GO:0051792 | medium-chain fatty acid biosynthetic process(GO:0051792) |
| 0.3 | 4.9 | GO:0044341 | sodium-dependent phosphate transport(GO:0044341) |
| 0.3 | 0.8 | GO:1901876 | regulation of calcium ion binding(GO:1901876) negative regulation of calcium ion binding(GO:1901877) |
| 0.3 | 4.2 | GO:0051661 | maintenance of centrosome location(GO:0051661) |
| 0.3 | 7.0 | GO:0010642 | negative regulation of platelet-derived growth factor receptor signaling pathway(GO:0010642) |
| 0.3 | 0.8 | GO:0070676 | intralumenal vesicle formation(GO:0070676) |
| 0.3 | 1.1 | GO:0046462 | monoacylglycerol metabolic process(GO:0046462) monoacylglycerol catabolic process(GO:0052651) |
| 0.3 | 2.5 | GO:0001712 | ectoderm formation(GO:0001705) ectodermal cell fate commitment(GO:0001712) |
| 0.3 | 0.8 | GO:1900365 | positive regulation of mRNA polyadenylation(GO:1900365) |
| 0.3 | 4.1 | GO:0030046 | parallel actin filament bundle assembly(GO:0030046) |
| 0.3 | 2.2 | GO:0033353 | S-adenosylmethionine cycle(GO:0033353) |
| 0.3 | 1.3 | GO:0070327 | thyroid hormone transport(GO:0070327) |
| 0.3 | 1.1 | GO:1902513 | regulation of organelle transport along microtubule(GO:1902513) |
| 0.3 | 2.1 | GO:0030309 | poly-N-acetyllactosamine metabolic process(GO:0030309) |
| 0.3 | 0.8 | GO:0031133 | regulation of axon diameter(GO:0031133) |
| 0.3 | 3.7 | GO:0061088 | regulation of sequestering of zinc ion(GO:0061088) |
| 0.3 | 5.6 | GO:0060088 | auditory receptor cell stereocilium organization(GO:0060088) |
| 0.3 | 4.4 | GO:0070886 | positive regulation of calcineurin-NFAT signaling cascade(GO:0070886) |
| 0.3 | 0.5 | GO:0098904 | regulation of AV node cell action potential(GO:0098904) |
| 0.3 | 2.1 | GO:1903382 | neuron intrinsic apoptotic signaling pathway in response to endoplasmic reticulum stress(GO:0036483) regulation of endoplasmic reticulum stress-induced neuron intrinsic apoptotic signaling pathway(GO:1903381) negative regulation of endoplasmic reticulum stress-induced neuron intrinsic apoptotic signaling pathway(GO:1903382) |
| 0.3 | 5.0 | GO:0018026 | peptidyl-lysine monomethylation(GO:0018026) |
| 0.3 | 2.3 | GO:0045919 | positive regulation of cytolysis(GO:0045919) |
| 0.3 | 0.8 | GO:0019442 | tryptophan catabolic process to acetyl-CoA(GO:0019442) |
| 0.3 | 3.6 | GO:1902669 | positive regulation of axon guidance(GO:1902669) |
| 0.3 | 0.8 | GO:0060738 | epithelial-mesenchymal signaling involved in prostate gland development(GO:0060738) |
| 0.3 | 0.5 | GO:0097114 | NMDA glutamate receptor clustering(GO:0097114) |
| 0.3 | 1.8 | GO:0060154 | cellular process regulating host cell cycle in response to virus(GO:0060154) |
| 0.3 | 0.8 | GO:0044725 | chromatin reprogramming in the zygote(GO:0044725) |
| 0.3 | 1.5 | GO:0051005 | negative regulation of lipoprotein lipase activity(GO:0051005) |
| 0.3 | 1.3 | GO:1904059 | regulation of locomotor rhythm(GO:1904059) |
| 0.3 | 0.8 | GO:0006683 | galactosylceramide catabolic process(GO:0006683) |
| 0.3 | 0.8 | GO:2001311 | lysobisphosphatidic acid metabolic process(GO:2001311) |
| 0.3 | 5.5 | GO:1903830 | magnesium ion transmembrane transport(GO:1903830) |
| 0.3 | 2.5 | GO:2001199 | negative regulation of dendritic cell differentiation(GO:2001199) |
| 0.3 | 0.5 | GO:0070885 | negative regulation of calcineurin-NFAT signaling cascade(GO:0070885) |
| 0.3 | 2.3 | GO:0070257 | positive regulation of mucus secretion(GO:0070257) |
| 0.3 | 0.8 | GO:0045645 | regulation of eosinophil differentiation(GO:0045643) positive regulation of eosinophil differentiation(GO:0045645) |
| 0.2 | 12.0 | GO:0045022 | early endosome to late endosome transport(GO:0045022) |
| 0.2 | 1.7 | GO:0010968 | regulation of microtubule nucleation(GO:0010968) |
| 0.2 | 0.7 | GO:0010730 | negative regulation of hydrogen peroxide biosynthetic process(GO:0010730) |
| 0.2 | 2.4 | GO:0006621 | protein retention in ER lumen(GO:0006621) |
| 0.2 | 0.7 | GO:0071449 | cellular response to lipid hydroperoxide(GO:0071449) |
| 0.2 | 0.2 | GO:0046005 | positive regulation of circadian sleep/wake cycle, REM sleep(GO:0046005) |
| 0.2 | 2.7 | GO:0001977 | renal system process involved in regulation of blood volume(GO:0001977) |
| 0.2 | 7.3 | GO:0006744 | ubiquinone metabolic process(GO:0006743) ubiquinone biosynthetic process(GO:0006744) quinone biosynthetic process(GO:1901663) |
| 0.2 | 9.2 | GO:1903861 | positive regulation of dendrite extension(GO:1903861) |
| 0.2 | 1.0 | GO:0071931 | positive regulation of transcription involved in G1/S transition of mitotic cell cycle(GO:0071931) |
| 0.2 | 2.6 | GO:0019373 | epoxygenase P450 pathway(GO:0019373) |
| 0.2 | 10.0 | GO:0001580 | detection of chemical stimulus involved in sensory perception of bitter taste(GO:0001580) |
| 0.2 | 1.0 | GO:0071418 | cellular response to amine stimulus(GO:0071418) |
| 0.2 | 4.5 | GO:0090361 | platelet-derived growth factor production(GO:0090360) regulation of platelet-derived growth factor production(GO:0090361) |
| 0.2 | 1.2 | GO:0016559 | peroxisome fission(GO:0016559) |
| 0.2 | 0.9 | GO:0006617 | SRP-dependent cotranslational protein targeting to membrane, signal sequence recognition(GO:0006617) |
| 0.2 | 5.1 | GO:0021796 | cerebral cortex regionalization(GO:0021796) |
| 0.2 | 1.2 | GO:0006167 | AMP biosynthetic process(GO:0006167) |
| 0.2 | 0.2 | GO:0030950 | establishment or maintenance of actin cytoskeleton polarity(GO:0030950) |
| 0.2 | 1.4 | GO:0010980 | regulation of vitamin D 24-hydroxylase activity(GO:0010979) positive regulation of vitamin D 24-hydroxylase activity(GO:0010980) |
| 0.2 | 1.6 | GO:0099566 | regulation of postsynaptic cytosolic calcium ion concentration(GO:0099566) |
| 0.2 | 3.6 | GO:0097264 | self proteolysis(GO:0097264) |
| 0.2 | 0.7 | GO:1904692 | positive regulation of type B pancreatic cell proliferation(GO:1904692) |
| 0.2 | 0.2 | GO:0043686 | co-translational protein modification(GO:0043686) |
| 0.2 | 1.1 | GO:1904383 | response to sodium phosphate(GO:1904383) |
| 0.2 | 2.0 | GO:0090383 | phagosome acidification(GO:0090383) |
| 0.2 | 4.0 | GO:0060539 | diaphragm development(GO:0060539) |
| 0.2 | 11.1 | GO:0008089 | anterograde axonal transport(GO:0008089) |
| 0.2 | 1.1 | GO:0099558 | maintenance of synapse structure(GO:0099558) |
| 0.2 | 0.2 | GO:0044335 | canonical Wnt signaling pathway involved in neural crest cell differentiation(GO:0044335) |
| 0.2 | 1.3 | GO:0090324 | negative regulation of oxidative phosphorylation(GO:0090324) |
| 0.2 | 6.1 | GO:0016024 | CDP-diacylglycerol biosynthetic process(GO:0016024) |
| 0.2 | 2.8 | GO:0030050 | vesicle transport along actin filament(GO:0030050) |
| 0.2 | 14.1 | GO:0006120 | mitochondrial electron transport, NADH to ubiquinone(GO:0006120) |
| 0.2 | 1.1 | GO:0021759 | globus pallidus development(GO:0021759) |
| 0.2 | 2.2 | GO:0032782 | bile acid secretion(GO:0032782) |
| 0.2 | 1.5 | GO:0033564 | anterior/posterior axon guidance(GO:0033564) |
| 0.2 | 1.5 | GO:2000048 | negative regulation of cell-cell adhesion mediated by cadherin(GO:2000048) |
| 0.2 | 0.6 | GO:0006597 | spermine biosynthetic process(GO:0006597) |
| 0.2 | 4.1 | GO:0051775 | response to redox state(GO:0051775) |
| 0.2 | 0.2 | GO:0010915 | regulation of very-low-density lipoprotein particle clearance(GO:0010915) negative regulation of very-low-density lipoprotein particle clearance(GO:0010916) |
| 0.2 | 0.6 | GO:0032877 | positive regulation of DNA endoreduplication(GO:0032877) |
| 0.2 | 3.4 | GO:0007028 | cytoplasm organization(GO:0007028) |
| 0.2 | 2.8 | GO:0006689 | ganglioside catabolic process(GO:0006689) |
| 0.2 | 1.5 | GO:0032485 | Ral protein signal transduction(GO:0032484) regulation of Ral protein signal transduction(GO:0032485) |
| 0.2 | 2.5 | GO:0007256 | activation of JNKK activity(GO:0007256) |
| 0.2 | 8.4 | GO:0009435 | NAD biosynthetic process(GO:0009435) |
| 0.2 | 3.8 | GO:0048172 | regulation of short-term neuronal synaptic plasticity(GO:0048172) |
| 0.2 | 0.6 | GO:0070634 | transepithelial ammonium transport(GO:0070634) |
| 0.2 | 0.6 | GO:0072501 | cellular phosphate ion homeostasis(GO:0030643) cellular divalent inorganic anion homeostasis(GO:0072501) cellular trivalent inorganic anion homeostasis(GO:0072502) |
| 0.2 | 1.5 | GO:0042436 | tryptophan catabolic process(GO:0006569) tryptophan catabolic process to kynurenine(GO:0019441) indole-containing compound catabolic process(GO:0042436) indolalkylamine catabolic process(GO:0046218) |
| 0.2 | 12.7 | GO:1903959 | regulation of anion transmembrane transport(GO:1903959) |
| 0.2 | 1.0 | GO:1990504 | dense core granule exocytosis(GO:1990504) |
| 0.2 | 11.8 | GO:0048791 | calcium ion-regulated exocytosis of neurotransmitter(GO:0048791) |
| 0.2 | 1.9 | GO:0046726 | positive regulation by virus of viral protein levels in host cell(GO:0046726) |
| 0.2 | 1.2 | GO:0061624 | fructose catabolic process(GO:0006001) fructose catabolic process to hydroxyacetone phosphate and glyceraldehyde-3-phosphate(GO:0061624) |
| 0.2 | 0.8 | GO:2000110 | negative regulation of macrophage apoptotic process(GO:2000110) |
| 0.2 | 5.6 | GO:0061029 | eyelid development in camera-type eye(GO:0061029) |
| 0.2 | 6.2 | GO:0006646 | phosphatidylethanolamine biosynthetic process(GO:0006646) |
| 0.2 | 0.8 | GO:0098703 | calcium ion import across plasma membrane(GO:0098703) calcium ion import into cell(GO:1990035) |
| 0.2 | 0.6 | GO:0016267 | O-glycan processing, core 1(GO:0016267) |
| 0.2 | 2.7 | GO:0021860 | pyramidal neuron development(GO:0021860) |
| 0.2 | 4.5 | GO:0097034 | mitochondrial respiratory chain complex IV biogenesis(GO:0097034) |
| 0.2 | 2.9 | GO:0035095 | behavioral response to nicotine(GO:0035095) |
| 0.2 | 7.5 | GO:0007214 | gamma-aminobutyric acid signaling pathway(GO:0007214) |
| 0.2 | 1.2 | GO:0060179 | male mating behavior(GO:0060179) |
| 0.2 | 0.2 | GO:0060623 | regulation of chromosome condensation(GO:0060623) |
| 0.2 | 1.0 | GO:0006103 | 2-oxoglutarate metabolic process(GO:0006103) |
| 0.2 | 0.6 | GO:0019085 | early viral transcription(GO:0019085) |
| 0.2 | 3.6 | GO:0089711 | L-glutamate transmembrane transport(GO:0089711) |
| 0.2 | 0.8 | GO:0060462 | lung lobe development(GO:0060462) lung lobe morphogenesis(GO:0060463) |
| 0.2 | 0.6 | GO:1902988 | neurofibrillary tangle assembly(GO:1902988) |
| 0.2 | 8.2 | GO:0006099 | tricarboxylic acid cycle(GO:0006099) |
| 0.2 | 6.0 | GO:1902475 | L-alpha-amino acid transmembrane transport(GO:1902475) |
| 0.2 | 1.6 | GO:1902414 | protein localization to cell junction(GO:1902414) |
| 0.2 | 0.8 | GO:0035544 | negative regulation of SNARE complex assembly(GO:0035544) |
| 0.2 | 1.6 | GO:0015712 | hexose phosphate transport(GO:0015712) glucose-6-phosphate transport(GO:0015760) |
| 0.2 | 1.2 | GO:0016139 | glycoside catabolic process(GO:0016139) |
| 0.2 | 3.2 | GO:0035269 | protein O-linked mannosylation(GO:0035269) |
| 0.2 | 2.8 | GO:1901387 | positive regulation of voltage-gated calcium channel activity(GO:1901387) |
| 0.2 | 1.6 | GO:0000066 | mitochondrial ornithine transport(GO:0000066) |
| 0.2 | 1.2 | GO:2000984 | regulation of ATP citrate synthase activity(GO:2000983) negative regulation of ATP citrate synthase activity(GO:2000984) |
| 0.2 | 0.4 | GO:2000053 | regulation of Wnt signaling pathway involved in dorsal/ventral axis specification(GO:2000053) |
| 0.2 | 1.6 | GO:0060314 | regulation of ryanodine-sensitive calcium-release channel activity(GO:0060314) |
| 0.2 | 4.3 | GO:0051531 | NFAT protein import into nucleus(GO:0051531) |
| 0.2 | 1.6 | GO:0044375 | regulation of peroxisome size(GO:0044375) |
| 0.2 | 4.7 | GO:0008053 | mitochondrial fusion(GO:0008053) |
| 0.2 | 1.0 | GO:0006616 | SRP-dependent cotranslational protein targeting to membrane, translocation(GO:0006616) |
| 0.2 | 0.6 | GO:0021979 | hypothalamus cell differentiation(GO:0021979) |
| 0.2 | 1.7 | GO:0016322 | neuron remodeling(GO:0016322) |
| 0.2 | 6.8 | GO:0006829 | zinc II ion transport(GO:0006829) |
| 0.2 | 1.0 | GO:0002159 | desmosome assembly(GO:0002159) |
| 0.2 | 2.7 | GO:0042754 | negative regulation of circadian rhythm(GO:0042754) |
| 0.2 | 5.4 | GO:0030277 | maintenance of gastrointestinal epithelium(GO:0030277) |
| 0.2 | 0.6 | GO:0021529 | spinal cord oligodendrocyte cell differentiation(GO:0021529) spinal cord oligodendrocyte cell fate specification(GO:0021530) |
| 0.2 | 2.1 | GO:0008535 | respiratory chain complex IV assembly(GO:0008535) |
| 0.2 | 1.7 | GO:0071394 | cellular response to testosterone stimulus(GO:0071394) |
| 0.2 | 0.8 | GO:0061358 | adenylate cyclase-inhibiting opioid receptor signaling pathway(GO:0031635) negative regulation of Wnt protein secretion(GO:0061358) |
| 0.2 | 1.1 | GO:0008088 | axo-dendritic transport(GO:0008088) |
| 0.2 | 0.6 | GO:0048561 | establishment of organ orientation(GO:0048561) |
| 0.2 | 2.1 | GO:0046174 | polyol catabolic process(GO:0046174) |
| 0.2 | 3.4 | GO:0051988 | regulation of attachment of spindle microtubules to kinetochore(GO:0051988) |
| 0.2 | 0.6 | GO:0070145 | mitochondrial asparaginyl-tRNA aminoacylation(GO:0070145) |
| 0.2 | 0.2 | GO:0048560 | establishment of anatomical structure orientation(GO:0048560) |
| 0.2 | 1.3 | GO:0060385 | axonogenesis involved in innervation(GO:0060385) |
| 0.2 | 4.2 | GO:1904152 | regulation of retrograde protein transport, ER to cytosol(GO:1904152) |
| 0.2 | 0.6 | GO:0035897 | proteolysis in other organism(GO:0035897) |
| 0.2 | 0.4 | GO:0006107 | oxaloacetate metabolic process(GO:0006107) |
| 0.2 | 5.3 | GO:1902803 | regulation of synaptic vesicle transport(GO:1902803) regulation of synaptic vesicle exocytosis(GO:2000300) |
| 0.2 | 0.6 | GO:0036353 | histone H2A-K119 monoubiquitination(GO:0036353) |
| 0.2 | 0.7 | GO:2000393 | negative regulation of lamellipodium morphogenesis(GO:2000393) |
| 0.2 | 0.5 | GO:1901162 | primary amino compound biosynthetic process(GO:1901162) |
| 0.2 | 10.2 | GO:0006904 | vesicle docking involved in exocytosis(GO:0006904) |
| 0.2 | 0.9 | GO:0010701 | positive regulation of norepinephrine secretion(GO:0010701) |
| 0.2 | 1.1 | GO:1902952 | positive regulation of dendritic spine maintenance(GO:1902952) |
| 0.2 | 2.5 | GO:0019367 | fatty acid elongation, saturated fatty acid(GO:0019367) fatty acid elongation, unsaturated fatty acid(GO:0019368) fatty acid elongation, monounsaturated fatty acid(GO:0034625) fatty acid elongation, polyunsaturated fatty acid(GO:0034626) |
| 0.2 | 1.3 | GO:0006651 | diacylglycerol biosynthetic process(GO:0006651) |
| 0.2 | 7.2 | GO:0003298 | physiological muscle hypertrophy(GO:0003298) physiological cardiac muscle hypertrophy(GO:0003301) cell growth involved in cardiac muscle cell development(GO:0061049) |
| 0.2 | 2.0 | GO:0086024 | adrenergic receptor signaling pathway involved in positive regulation of heart rate(GO:0086024) |
| 0.2 | 0.5 | GO:0042309 | homoiothermy(GO:0042309) |
| 0.2 | 0.7 | GO:1903070 | negative regulation of ER-associated ubiquitin-dependent protein catabolic process(GO:1903070) |
| 0.2 | 1.1 | GO:0071874 | cellular response to norepinephrine stimulus(GO:0071874) |
| 0.2 | 1.4 | GO:0015879 | carnitine transport(GO:0015879) |
| 0.2 | 3.6 | GO:0033539 | fatty acid beta-oxidation using acyl-CoA dehydrogenase(GO:0033539) |
| 0.2 | 0.4 | GO:0000964 | mitochondrial RNA 5'-end processing(GO:0000964) |
| 0.2 | 0.4 | GO:0051464 | positive regulation of cortisol secretion(GO:0051464) |
| 0.2 | 1.8 | GO:0002084 | protein depalmitoylation(GO:0002084) |
| 0.2 | 0.5 | GO:1901143 | insulin catabolic process(GO:1901143) |
| 0.2 | 2.8 | GO:0006122 | mitochondrial electron transport, ubiquinol to cytochrome c(GO:0006122) |
| 0.2 | 1.4 | GO:0034447 | very-low-density lipoprotein particle clearance(GO:0034447) |
| 0.2 | 1.6 | GO:0035609 | C-terminal protein deglutamylation(GO:0035609) |
| 0.2 | 0.5 | GO:0098828 | positive regulation of inhibitory postsynaptic potential(GO:0097151) modulation of inhibitory postsynaptic potential(GO:0098828) |
| 0.2 | 0.7 | GO:0009107 | lipoate metabolic process(GO:0009106) lipoate biosynthetic process(GO:0009107) |
| 0.2 | 0.7 | GO:1904529 | regulation of actin filament binding(GO:1904529) regulation of actin binding(GO:1904616) |
| 0.2 | 1.0 | GO:0097119 | postsynaptic density protein 95 clustering(GO:0097119) |
| 0.2 | 4.8 | GO:0070262 | peptidyl-serine dephosphorylation(GO:0070262) |
| 0.2 | 1.0 | GO:0010387 | COP9 signalosome assembly(GO:0010387) |
| 0.2 | 0.9 | GO:0097070 | ductus arteriosus closure(GO:0097070) |
| 0.2 | 1.7 | GO:1902412 | regulation of mitotic cytokinesis(GO:1902412) |
| 0.2 | 0.3 | GO:0090370 | negative regulation of cholesterol efflux(GO:0090370) |
| 0.2 | 1.2 | GO:0051697 | protein delipidation(GO:0051697) |
| 0.2 | 4.4 | GO:0050962 | detection of light stimulus involved in visual perception(GO:0050908) detection of light stimulus involved in sensory perception(GO:0050962) |
| 0.2 | 7.4 | GO:0042026 | protein refolding(GO:0042026) |
| 0.2 | 1.7 | GO:0050746 | regulation of lipoprotein metabolic process(GO:0050746) |
| 0.2 | 1.2 | GO:0038044 | transforming growth factor-beta secretion(GO:0038044) |
| 0.2 | 0.3 | GO:0051563 | astrocyte activation involved in immune response(GO:0002265) smooth endoplasmic reticulum calcium ion homeostasis(GO:0051563) |
| 0.2 | 0.5 | GO:0048627 | myoblast development(GO:0048627) |
| 0.2 | 2.8 | GO:0034498 | early endosome to Golgi transport(GO:0034498) |
| 0.2 | 0.2 | GO:0072513 | positive regulation of secondary heart field cardioblast proliferation(GO:0072513) |
| 0.2 | 0.8 | GO:2000312 | regulation of kainate selective glutamate receptor activity(GO:2000312) |
| 0.2 | 1.2 | GO:0010481 | epidermal cell division(GO:0010481) regulation of epidermal cell division(GO:0010482) |
| 0.2 | 10.8 | GO:0070830 | bicellular tight junction assembly(GO:0070830) |
| 0.2 | 0.5 | GO:0070858 | negative regulation of bile acid biosynthetic process(GO:0070858) negative regulation of bile acid metabolic process(GO:1904252) |
| 0.2 | 0.3 | GO:0071921 | establishment of sister chromatid cohesion(GO:0034085) cohesin loading(GO:0071921) regulation of cohesin loading(GO:0071922) |
| 0.2 | 1.0 | GO:0008218 | bioluminescence(GO:0008218) |
| 0.2 | 4.2 | GO:0070584 | mitochondrion morphogenesis(GO:0070584) |
| 0.2 | 0.3 | GO:0042414 | epinephrine metabolic process(GO:0042414) epinephrine biosynthetic process(GO:0042418) |
| 0.2 | 0.6 | GO:0035853 | chromosome passenger complex localization to spindle midzone(GO:0035853) |
| 0.2 | 0.2 | GO:1903244 | positive regulation of cardiac muscle adaptation(GO:0010615) positive regulation of cardiac muscle hypertrophy in response to stress(GO:1903244) |
| 0.2 | 1.4 | GO:0048312 | intracellular distribution of mitochondria(GO:0048312) |
| 0.2 | 3.0 | GO:0060644 | mammary gland epithelial cell differentiation(GO:0060644) |
| 0.2 | 1.8 | GO:0071941 | nitrogen cycle metabolic process(GO:0071941) |
| 0.2 | 4.0 | GO:0048488 | synaptic vesicle endocytosis(GO:0048488) |
| 0.2 | 1.1 | GO:0097680 | double-strand break repair via classical nonhomologous end joining(GO:0097680) |
| 0.2 | 6.7 | GO:0048268 | clathrin coat assembly(GO:0048268) |
| 0.2 | 4.1 | GO:0097031 | NADH dehydrogenase complex assembly(GO:0010257) mitochondrial respiratory chain complex I assembly(GO:0032981) mitochondrial respiratory chain complex I biogenesis(GO:0097031) |
| 0.2 | 4.7 | GO:0051923 | sulfation(GO:0051923) |
| 0.2 | 0.6 | GO:1903551 | regulation of extracellular exosome assembly(GO:1903551) |
| 0.2 | 1.6 | GO:0071847 | TNFSF11-mediated signaling pathway(GO:0071847) |
| 0.2 | 0.5 | GO:0015734 | taurine transport(GO:0015734) |
| 0.2 | 15.9 | GO:0090277 | positive regulation of peptide hormone secretion(GO:0090277) |
| 0.2 | 0.8 | GO:0034414 | tRNA 3'-trailer cleavage, endonucleolytic(GO:0034414) tRNA 3'-trailer cleavage(GO:0042779) |
| 0.2 | 2.2 | GO:0061635 | regulation of protein complex stability(GO:0061635) |
| 0.2 | 1.8 | GO:0050812 | regulation of acetyl-CoA biosynthetic process from pyruvate(GO:0010510) regulation of acyl-CoA biosynthetic process(GO:0050812) |
| 0.2 | 1.2 | GO:0060452 | positive regulation of cardiac muscle contraction(GO:0060452) |
| 0.2 | 1.5 | GO:0009312 | oligosaccharide biosynthetic process(GO:0009312) |
| 0.2 | 1.4 | GO:0006883 | cellular sodium ion homeostasis(GO:0006883) |
| 0.2 | 0.9 | GO:0032445 | fructose import(GO:0032445) carbohydrate import into cell(GO:0097319) carbohydrate import across plasma membrane(GO:0098704) fructose import across plasma membrane(GO:1990539) |
| 0.2 | 3.0 | GO:0071985 | multivesicular body sorting pathway(GO:0071985) |
| 0.2 | 2.3 | GO:0007021 | tubulin complex assembly(GO:0007021) |
| 0.1 | 1.8 | GO:1905232 | cellular response to L-glutamate(GO:1905232) |
| 0.1 | 0.1 | GO:2000426 | regulation of interleukin-4-mediated signaling pathway(GO:1902214) negative regulation of apoptotic cell clearance(GO:2000426) |
| 0.1 | 0.3 | GO:0036309 | protein localization to M-band(GO:0036309) |
| 0.1 | 0.4 | GO:0033341 | regulation of collagen binding(GO:0033341) |
| 0.1 | 6.1 | GO:0043403 | skeletal muscle tissue regeneration(GO:0043403) |
| 0.1 | 1.9 | GO:0048298 | positive regulation of isotype switching to IgA isotypes(GO:0048298) |
| 0.1 | 0.4 | GO:0002949 | tRNA threonylcarbamoyladenosine modification(GO:0002949) |
| 0.1 | 1.8 | GO:0045838 | positive regulation of membrane potential(GO:0045838) |
| 0.1 | 1.0 | GO:1903237 | negative regulation of leukocyte tethering or rolling(GO:1903237) negative regulation of leukocyte adhesion to vascular endothelial cell(GO:1904995) |
| 0.1 | 1.3 | GO:0048003 | antigen processing and presentation of lipid antigen via MHC class Ib(GO:0048003) antigen processing and presentation, exogenous lipid antigen via MHC class Ib(GO:0048007) |
| 0.1 | 3.1 | GO:0048012 | hepatocyte growth factor receptor signaling pathway(GO:0048012) |
| 0.1 | 0.4 | GO:0002426 | immunoglobulin production in mucosal tissue(GO:0002426) |
| 0.1 | 2.2 | GO:0006776 | vitamin A metabolic process(GO:0006776) |
| 0.1 | 0.4 | GO:0006481 | C-terminal protein methylation(GO:0006481) |
| 0.1 | 0.6 | GO:0045208 | MAPK phosphatase export from nucleus(GO:0045208) MAPK phosphatase export from nucleus, leptomycin B sensitive(GO:0045209) |
| 0.1 | 1.5 | GO:0008038 | neuron recognition(GO:0008038) |
| 0.1 | 0.6 | GO:2001106 | regulation of Rho guanyl-nucleotide exchange factor activity(GO:2001106) |
| 0.1 | 1.0 | GO:0017004 | cytochrome complex assembly(GO:0017004) |
| 0.1 | 2.3 | GO:0040032 | post-embryonic body morphogenesis(GO:0040032) |
| 0.1 | 0.3 | GO:0060152 | peroxisome localization(GO:0060151) microtubule-based peroxisome localization(GO:0060152) |
| 0.1 | 0.4 | GO:0030505 | inorganic diphosphate transport(GO:0030505) |
| 0.1 | 0.3 | GO:1901301 | regulation of cargo loading into COPII-coated vesicle(GO:1901301) |
| 0.1 | 0.4 | GO:0060011 | Sertoli cell proliferation(GO:0060011) |
| 0.1 | 0.4 | GO:0071529 | cementum mineralization(GO:0071529) |
| 0.1 | 1.3 | GO:0042271 | susceptibility to natural killer cell mediated cytotoxicity(GO:0042271) |
| 0.1 | 0.7 | GO:0008588 | release of cytoplasmic sequestered NF-kappaB(GO:0008588) |
| 0.1 | 3.8 | GO:0060292 | long term synaptic depression(GO:0060292) |
| 0.1 | 0.1 | GO:0046586 | regulation of calcium-dependent cell-cell adhesion(GO:0046586) |
| 0.1 | 0.6 | GO:0046121 | deoxyribonucleoside catabolic process(GO:0046121) |
| 0.1 | 1.0 | GO:0097428 | protein maturation by iron-sulfur cluster transfer(GO:0097428) |
| 0.1 | 1.0 | GO:0010459 | negative regulation of heart rate(GO:0010459) |
| 0.1 | 0.6 | GO:0070124 | mitochondrial translational initiation(GO:0070124) |
| 0.1 | 16.3 | GO:0070125 | mitochondrial translational elongation(GO:0070125) |
| 0.1 | 0.1 | GO:0002082 | regulation of oxidative phosphorylation(GO:0002082) |
| 0.1 | 1.5 | GO:0032291 | central nervous system myelination(GO:0022010) axon ensheathment in central nervous system(GO:0032291) |
| 0.1 | 0.7 | GO:2000015 | regulation of determination of dorsal identity(GO:2000015) |
| 0.1 | 0.1 | GO:1904885 | beta-catenin destruction complex assembly(GO:1904885) |
| 0.1 | 0.7 | GO:0006083 | acetate metabolic process(GO:0006083) |
| 0.1 | 3.5 | GO:0019369 | arachidonic acid metabolic process(GO:0019369) |
| 0.1 | 0.4 | GO:2000559 | CD24 biosynthetic process(GO:0035724) activation of meiosis involved in egg activation(GO:0060466) negative regulation of monocyte extravasation(GO:2000438) regulation of CD24 biosynthetic process(GO:2000559) positive regulation of CD24 biosynthetic process(GO:2000560) |
| 0.1 | 0.4 | GO:0006751 | glutathione catabolic process(GO:0006751) |
| 0.1 | 5.1 | GO:0006692 | prostanoid metabolic process(GO:0006692) prostaglandin metabolic process(GO:0006693) |
| 0.1 | 0.1 | GO:2000275 | regulation of oxidative phosphorylation uncoupler activity(GO:2000275) |
| 0.1 | 1.1 | GO:0043248 | proteasome assembly(GO:0043248) |
| 0.1 | 0.5 | GO:0046909 | intermembrane transport(GO:0046909) protein transport from ciliary membrane to plasma membrane(GO:1903445) |
| 0.1 | 0.4 | GO:1904293 | negative regulation of ERAD pathway(GO:1904293) |
| 0.1 | 0.8 | GO:0019509 | L-methionine biosynthetic process from methylthioadenosine(GO:0019509) |
| 0.1 | 1.1 | GO:0031998 | regulation of fatty acid beta-oxidation(GO:0031998) |
| 0.1 | 0.7 | GO:0006227 | dUDP biosynthetic process(GO:0006227) dTDP biosynthetic process(GO:0006233) pyrimidine nucleoside diphosphate biosynthetic process(GO:0009139) pyrimidine deoxyribonucleoside diphosphate metabolic process(GO:0009196) pyrimidine deoxyribonucleoside diphosphate biosynthetic process(GO:0009197) dTDP metabolic process(GO:0046072) dUDP metabolic process(GO:0046077) |
| 0.1 | 1.1 | GO:0010763 | positive regulation of fibroblast migration(GO:0010763) |
| 0.1 | 0.5 | GO:0007343 | egg activation(GO:0007343) |
| 0.1 | 1.3 | GO:0019227 | neuronal action potential propagation(GO:0019227) action potential propagation(GO:0098870) |
| 0.1 | 1.6 | GO:0000038 | very long-chain fatty acid metabolic process(GO:0000038) |
| 0.1 | 1.3 | GO:0071569 | protein ufmylation(GO:0071569) |
| 0.1 | 0.7 | GO:0006987 | activation of signaling protein activity involved in unfolded protein response(GO:0006987) |
| 0.1 | 2.0 | GO:0015884 | folic acid transport(GO:0015884) |
| 0.1 | 0.3 | GO:1990416 | cellular response to brain-derived neurotrophic factor stimulus(GO:1990416) |
| 0.1 | 3.6 | GO:0007096 | regulation of exit from mitosis(GO:0007096) |
| 0.1 | 0.9 | GO:0036438 | maintenance of lens transparency(GO:0036438) |
| 0.1 | 0.5 | GO:0002143 | tRNA wobble position uridine thiolation(GO:0002143) |
| 0.1 | 1.3 | GO:0060272 | embryonic skeletal joint morphogenesis(GO:0060272) |
| 0.1 | 1.0 | GO:2000651 | positive regulation of sodium ion transmembrane transporter activity(GO:2000651) |
| 0.1 | 0.3 | GO:0030854 | positive regulation of granulocyte differentiation(GO:0030854) |
| 0.1 | 0.6 | GO:0044314 | protein K27-linked ubiquitination(GO:0044314) |
| 0.1 | 1.7 | GO:1904322 | response to forskolin(GO:1904321) cellular response to forskolin(GO:1904322) |
| 0.1 | 0.3 | GO:0098583 | mastication(GO:0071626) learned vocalization behavior(GO:0098583) |
| 0.1 | 1.6 | GO:0046548 | retinal rod cell development(GO:0046548) |
| 0.1 | 0.4 | GO:0009644 | response to high light intensity(GO:0009644) |
| 0.1 | 0.3 | GO:0036269 | swimming behavior(GO:0036269) |
| 0.1 | 1.0 | GO:0070102 | interleukin-6-mediated signaling pathway(GO:0070102) |
| 0.1 | 0.4 | GO:0006391 | transcription initiation from mitochondrial promoter(GO:0006391) |
| 0.1 | 0.7 | GO:0050912 | detection of chemical stimulus involved in sensory perception of taste(GO:0050912) |
| 0.1 | 1.1 | GO:0034214 | protein hexamerization(GO:0034214) |
| 0.1 | 0.6 | GO:0097475 | motor neuron migration(GO:0097475) |
| 0.1 | 0.5 | GO:0042268 | regulation of cytolysis(GO:0042268) |
| 0.1 | 0.4 | GO:0036414 | protein citrullination(GO:0018101) histone citrullination(GO:0036414) |
| 0.1 | 0.8 | GO:0007413 | axonal fasciculation(GO:0007413) |
| 0.1 | 0.5 | GO:0071313 | cellular response to caffeine(GO:0071313) |
| 0.1 | 0.5 | GO:2000638 | regulation of SREBP signaling pathway(GO:2000638) negative regulation of SREBP signaling pathway(GO:2000639) |
| 0.1 | 0.4 | GO:0060762 | regulation of branching involved in mammary gland duct morphogenesis(GO:0060762) |
| 0.1 | 0.5 | GO:0033058 | directional locomotion(GO:0033058) |
| 0.1 | 0.4 | GO:0043652 | engulfment of apoptotic cell(GO:0043652) |
| 0.1 | 0.7 | GO:0042780 | tRNA 3'-end processing(GO:0042780) |
| 0.1 | 4.8 | GO:0006635 | fatty acid beta-oxidation(GO:0006635) |
| 0.1 | 0.2 | GO:1904528 | regulation of microtubule plus-end binding(GO:1903031) positive regulation of microtubule plus-end binding(GO:1903033) positive regulation of microtubule binding(GO:1904528) |
| 0.1 | 3.8 | GO:0035338 | long-chain fatty-acyl-CoA biosynthetic process(GO:0035338) |
| 0.1 | 0.9 | GO:0060677 | ureteric bud elongation(GO:0060677) |
| 0.1 | 0.2 | GO:0002536 | respiratory burst involved in inflammatory response(GO:0002536) regulation of respiratory burst involved in inflammatory response(GO:0060264) negative regulation of respiratory burst involved in inflammatory response(GO:0060266) |
| 0.1 | 1.4 | GO:0006013 | mannose metabolic process(GO:0006013) |
| 0.1 | 2.3 | GO:0030322 | stabilization of membrane potential(GO:0030322) |
| 0.1 | 2.6 | GO:0006895 | Golgi to endosome transport(GO:0006895) |
| 0.1 | 0.7 | GO:0043570 | maintenance of DNA repeat elements(GO:0043570) |
| 0.1 | 1.4 | GO:2001241 | positive regulation of extrinsic apoptotic signaling pathway in absence of ligand(GO:2001241) |
| 0.1 | 2.1 | GO:0006957 | complement activation, alternative pathway(GO:0006957) |
| 0.1 | 0.7 | GO:0060040 | retinal bipolar neuron differentiation(GO:0060040) |
| 0.1 | 0.2 | GO:1904017 | cellular response to Thyroglobulin triiodothyronine(GO:1904017) |
| 0.1 | 0.3 | GO:0031247 | actin rod assembly(GO:0031247) |
| 0.1 | 0.9 | GO:0018230 | peptidyl-L-cysteine S-palmitoylation(GO:0018230) peptidyl-S-diacylglycerol-L-cysteine biosynthetic process from peptidyl-cysteine(GO:0018231) |
| 0.1 | 1.3 | GO:0016188 | synaptic vesicle maturation(GO:0016188) |
| 0.1 | 4.3 | GO:0035235 | ionotropic glutamate receptor signaling pathway(GO:0035235) |
| 0.1 | 0.6 | GO:0046684 | response to pyrethroid(GO:0046684) |
| 0.1 | 1.0 | GO:0016560 | protein import into peroxisome matrix, docking(GO:0016560) |
| 0.1 | 0.7 | GO:0061590 | calcium activated phospholipid scrambling(GO:0061588) calcium activated phosphatidylcholine scrambling(GO:0061590) calcium activated galactosylceramide scrambling(GO:0061591) |
| 0.1 | 0.6 | GO:1902004 | positive regulation of beta-amyloid formation(GO:1902004) |
| 0.1 | 0.4 | GO:0019323 | pentose catabolic process(GO:0019323) |
| 0.1 | 0.4 | GO:0021780 | oligodendrocyte cell fate specification(GO:0021778) oligodendrocyte cell fate commitment(GO:0021779) glial cell fate specification(GO:0021780) |
| 0.1 | 1.2 | GO:0090481 | pyrimidine nucleotide-sugar transmembrane transport(GO:0090481) |
| 0.1 | 0.3 | GO:0021794 | thalamus development(GO:0021794) |
| 0.1 | 0.8 | GO:0048311 | mitochondrion distribution(GO:0048311) |
| 0.1 | 0.4 | GO:0009181 | purine nucleoside diphosphate catabolic process(GO:0009137) purine ribonucleoside diphosphate catabolic process(GO:0009181) |
| 0.1 | 0.6 | GO:0019242 | methylglyoxal biosynthetic process(GO:0019242) |
| 0.1 | 1.3 | GO:0019375 | galactosylceramide biosynthetic process(GO:0006682) galactolipid biosynthetic process(GO:0019375) |
| 0.1 | 4.8 | GO:0032012 | regulation of ARF protein signal transduction(GO:0032012) |
| 0.1 | 5.3 | GO:0030212 | hyaluronan metabolic process(GO:0030212) |
| 0.1 | 3.2 | GO:0022904 | respiratory electron transport chain(GO:0022904) |
| 0.1 | 0.3 | GO:1904526 | regulation of microtubule binding(GO:1904526) |
| 0.1 | 0.3 | GO:0006438 | valyl-tRNA aminoacylation(GO:0006438) |
| 0.1 | 0.1 | GO:0090134 | mesendoderm migration(GO:0090133) cell migration involved in mesendoderm migration(GO:0090134) |
| 0.1 | 0.1 | GO:1990791 | dorsal root ganglion development(GO:1990791) |
| 0.1 | 0.3 | GO:0006173 | dADP biosynthetic process(GO:0006173) |
| 0.1 | 0.2 | GO:0009138 | pyrimidine nucleoside diphosphate metabolic process(GO:0009138) |
| 0.1 | 0.6 | GO:0006574 | valine catabolic process(GO:0006574) |
| 0.1 | 0.3 | GO:0071344 | diphosphate metabolic process(GO:0071344) |
| 0.1 | 0.3 | GO:0071374 | cellular response to parathyroid hormone stimulus(GO:0071374) |
| 0.1 | 0.3 | GO:0014810 | positive regulation of skeletal muscle contraction by regulation of release of sequestered calcium ion(GO:0014810) |
| 0.1 | 1.3 | GO:0007621 | negative regulation of female receptivity(GO:0007621) |
| 0.1 | 1.8 | GO:2000507 | positive regulation of energy homeostasis(GO:2000507) |
| 0.1 | 2.6 | GO:0031290 | retinal ganglion cell axon guidance(GO:0031290) |
| 0.1 | 0.4 | GO:0052572 | response to immune response of other organism involved in symbiotic interaction(GO:0052564) response to host immune response(GO:0052572) |
| 0.1 | 0.5 | GO:0022900 | electron transport chain(GO:0022900) |
| 0.1 | 1.9 | GO:0006703 | estrogen biosynthetic process(GO:0006703) |
| 0.1 | 0.9 | GO:0007196 | adenylate cyclase-inhibiting G-protein coupled glutamate receptor signaling pathway(GO:0007196) |
| 0.1 | 0.1 | GO:0019852 | L-ascorbic acid metabolic process(GO:0019852) |
| 0.1 | 0.1 | GO:0006408 | snRNA export from nucleus(GO:0006408) |
| 0.1 | 1.1 | GO:0015886 | heme transport(GO:0015886) |
| 0.1 | 2.2 | GO:0016048 | detection of temperature stimulus(GO:0016048) |
| 0.1 | 0.3 | GO:2000847 | negative regulation of cortisol secretion(GO:0051463) negative regulation of growth hormone secretion(GO:0060125) negative regulation of steroid hormone secretion(GO:2000832) negative regulation of corticosteroid hormone secretion(GO:2000847) negative regulation of glucocorticoid secretion(GO:2000850) |
| 0.1 | 1.8 | GO:2000821 | regulation of grooming behavior(GO:2000821) |
| 0.1 | 3.9 | GO:0007205 | protein kinase C-activating G-protein coupled receptor signaling pathway(GO:0007205) |
| 0.1 | 0.6 | GO:0006686 | sphingomyelin biosynthetic process(GO:0006686) |
| 0.1 | 0.1 | GO:0060164 | regulation of timing of neuron differentiation(GO:0060164) |
| 0.1 | 9.0 | GO:0000381 | regulation of alternative mRNA splicing, via spliceosome(GO:0000381) |
| 0.1 | 0.9 | GO:0046415 | urate metabolic process(GO:0046415) |
| 0.1 | 1.9 | GO:0090140 | regulation of mitochondrial fission(GO:0090140) |
| 0.1 | 0.9 | GO:0097503 | sialylation(GO:0097503) |
| 0.1 | 0.3 | GO:0016240 | autophagosome docking(GO:0016240) |
| 0.1 | 0.9 | GO:1990834 | response to odorant(GO:1990834) |
| 0.1 | 2.9 | GO:0061001 | regulation of dendritic spine morphogenesis(GO:0061001) |
| 0.1 | 0.7 | GO:0006041 | glucosamine metabolic process(GO:0006041) |
| 0.1 | 0.4 | GO:1905244 | regulation of modification of synaptic structure(GO:1905244) |
| 0.1 | 0.2 | GO:0071393 | cellular response to progesterone stimulus(GO:0071393) |
| 0.1 | 0.3 | GO:1903679 | regulation of cap-independent translational initiation(GO:1903677) positive regulation of cap-independent translational initiation(GO:1903679) regulation of cytoplasmic translational initiation(GO:1904688) positive regulation of cytoplasmic translational initiation(GO:1904690) |
| 0.1 | 0.2 | GO:0006659 | phosphatidylserine biosynthetic process(GO:0006659) |
| 0.1 | 0.2 | GO:0035927 | RNA import into mitochondrion(GO:0035927) |
| 0.1 | 0.4 | GO:0070681 | glutaminyl-tRNAGln biosynthesis via transamidation(GO:0070681) |
| 0.1 | 0.5 | GO:0034344 | type III interferon production(GO:0034343) regulation of type III interferon production(GO:0034344) |
| 0.1 | 0.4 | GO:0038018 | Wnt receptor catabolic process(GO:0038018) |
| 0.1 | 1.3 | GO:0006555 | methionine metabolic process(GO:0006555) |
| 0.1 | 1.1 | GO:0006685 | sphingomyelin catabolic process(GO:0006685) |
| 0.1 | 1.1 | GO:0045197 | establishment or maintenance of epithelial cell apical/basal polarity(GO:0045197) |
| 0.1 | 1.4 | GO:0010623 | programmed cell death involved in cell development(GO:0010623) |
| 0.1 | 1.2 | GO:0043116 | negative regulation of vascular permeability(GO:0043116) |
| 0.1 | 0.4 | GO:0019074 | viral genome packaging(GO:0019072) viral RNA genome packaging(GO:0019074) |
| 0.1 | 1.8 | GO:0021854 | hypothalamus development(GO:0021854) |
| 0.1 | 0.3 | GO:0061182 | negative regulation of chondrocyte development(GO:0061182) |
| 0.1 | 0.5 | GO:0035627 | ceramide transport(GO:0035627) |
| 0.1 | 0.4 | GO:0050705 | negative regulation of interleukin-1 alpha production(GO:0032690) regulation of interleukin-1 alpha secretion(GO:0050705) negative regulation of interleukin-1 alpha secretion(GO:0050712) |
| 0.1 | 5.9 | GO:1902476 | chloride transmembrane transport(GO:1902476) |
| 0.1 | 1.4 | GO:0035414 | negative regulation of catenin import into nucleus(GO:0035414) |
| 0.1 | 7.4 | GO:0018279 | protein N-linked glycosylation via asparagine(GO:0018279) |
| 0.1 | 0.3 | GO:0051295 | establishment of meiotic spindle localization(GO:0051295) |
| 0.1 | 0.3 | GO:0035948 | positive regulation of gluconeogenesis by positive regulation of transcription from RNA polymerase II promoter(GO:0035948) regulation of cellular ketone metabolic process by positive regulation of transcription from RNA polymerase II promoter(GO:0072366) |
| 0.1 | 0.4 | GO:1904381 | Golgi apparatus mannose trimming(GO:1904381) |
| 0.1 | 1.2 | GO:0007158 | neuron cell-cell adhesion(GO:0007158) |
| 0.1 | 0.3 | GO:0051877 | pigment granule aggregation in cell center(GO:0051877) |
| 0.1 | 0.2 | GO:0071623 | negative regulation of granulocyte chemotaxis(GO:0071623) negative regulation of neutrophil chemotaxis(GO:0090024) negative regulation of neutrophil migration(GO:1902623) |
| 0.1 | 3.1 | GO:0046627 | negative regulation of insulin receptor signaling pathway(GO:0046627) |
| 0.1 | 1.3 | GO:0043090 | amino acid import(GO:0043090) |
| 0.1 | 0.1 | GO:0046010 | positive regulation of circadian sleep/wake cycle, non-REM sleep(GO:0046010) |
| 0.1 | 0.7 | GO:0014831 | intestine smooth muscle contraction(GO:0014827) gastro-intestinal system smooth muscle contraction(GO:0014831) |
| 0.1 | 2.1 | GO:0016254 | preassembly of GPI anchor in ER membrane(GO:0016254) |
| 0.1 | 0.4 | GO:0010757 | negative regulation of plasminogen activation(GO:0010757) |
| 0.1 | 0.3 | GO:0042495 | detection of triacyl bacterial lipopeptide(GO:0042495) detection of bacterial lipopeptide(GO:0070340) |
| 0.1 | 0.5 | GO:0060369 | positive regulation of natural killer cell cytokine production(GO:0002729) positive regulation of Fc receptor mediated stimulatory signaling pathway(GO:0060369) |
| 0.1 | 2.3 | GO:0014047 | glutamate secretion(GO:0014047) |
| 0.1 | 1.2 | GO:0006600 | creatine metabolic process(GO:0006600) |
| 0.1 | 1.2 | GO:0048710 | regulation of astrocyte differentiation(GO:0048710) |
| 0.1 | 0.2 | GO:0046110 | xanthine metabolic process(GO:0046110) |
| 0.1 | 0.5 | GO:0048239 | negative regulation of DNA recombination at telomere(GO:0048239) regulation of DNA recombination at telomere(GO:0072695) |
| 0.1 | 0.6 | GO:0046033 | AMP metabolic process(GO:0046033) |
| 0.1 | 0.4 | GO:1903818 | positive regulation of voltage-gated potassium channel activity(GO:1903818) |
| 0.1 | 1.4 | GO:0018298 | protein-chromophore linkage(GO:0018298) |
| 0.1 | 1.1 | GO:0032927 | positive regulation of activin receptor signaling pathway(GO:0032927) |
| 0.1 | 0.7 | GO:2000425 | regulation of apoptotic cell clearance(GO:2000425) positive regulation of apoptotic cell clearance(GO:2000427) |
| 0.1 | 0.4 | GO:0009133 | nucleoside diphosphate biosynthetic process(GO:0009133) |
| 0.1 | 0.3 | GO:0046041 | ITP metabolic process(GO:0046041) |
| 0.1 | 0.6 | GO:0035521 | monoubiquitinated histone deubiquitination(GO:0035521) monoubiquitinated histone H2A deubiquitination(GO:0035522) |
| 0.1 | 0.2 | GO:0032849 | positive regulation of cellular pH reduction(GO:0032849) |
| 0.1 | 0.6 | GO:0035616 | histone H2B conserved C-terminal lysine deubiquitination(GO:0035616) |
| 0.1 | 0.3 | GO:0033319 | UDP-D-xylose metabolic process(GO:0033319) UDP-D-xylose biosynthetic process(GO:0033320) |
| 0.1 | 0.3 | GO:0018160 | peptidyl-pyrromethane cofactor linkage(GO:0018160) |
| 0.1 | 0.3 | GO:0072272 | proximal/distal pattern formation involved in metanephric nephron development(GO:0072272) |
| 0.1 | 1.5 | GO:0000380 | alternative mRNA splicing, via spliceosome(GO:0000380) |
| 0.1 | 2.6 | GO:0090162 | establishment of epithelial cell polarity(GO:0090162) |
| 0.1 | 0.2 | GO:0003284 | septum primum development(GO:0003284) atrial septum primum morphogenesis(GO:0003289) |
| 0.1 | 0.1 | GO:1904798 | positive regulation of core promoter binding(GO:1904798) |
| 0.1 | 0.8 | GO:0021999 | neural plate anterior/posterior regionalization(GO:0021999) |
| 0.1 | 2.3 | GO:0010719 | negative regulation of epithelial to mesenchymal transition(GO:0010719) |
| 0.1 | 0.3 | GO:0008057 | eye pigment granule organization(GO:0008057) |
| 0.1 | 1.7 | GO:0060297 | regulation of sarcomere organization(GO:0060297) |
| 0.1 | 1.5 | GO:0033141 | positive regulation of peptidyl-serine phosphorylation of STAT protein(GO:0033141) |
| 0.1 | 0.2 | GO:0060371 | regulation of atrial cardiac muscle cell membrane depolarization(GO:0060371) bundle of His cell to Purkinje myocyte signaling(GO:0086028) bundle of His cell action potential(GO:0086043) |
| 0.1 | 0.7 | GO:0070475 | rRNA base methylation(GO:0070475) |
| 0.1 | 0.6 | GO:0038003 | opioid receptor signaling pathway(GO:0038003) |
| 0.1 | 0.6 | GO:0006990 | positive regulation of transcription from RNA polymerase II promoter involved in unfolded protein response(GO:0006990) |
| 0.1 | 0.3 | GO:0023016 | signal transduction by trans-phosphorylation(GO:0023016) |
| 0.1 | 0.2 | GO:0015860 | purine nucleoside transmembrane transport(GO:0015860) |
| 0.1 | 1.6 | GO:0006415 | translational termination(GO:0006415) |
| 0.1 | 3.2 | GO:0045773 | positive regulation of axon extension(GO:0045773) |
| 0.1 | 1.1 | GO:0009128 | purine nucleoside monophosphate catabolic process(GO:0009128) |
| 0.1 | 0.2 | GO:0060309 | elastin catabolic process(GO:0060309) |
| 0.1 | 1.5 | GO:0032515 | negative regulation of phosphoprotein phosphatase activity(GO:0032515) |
| 0.1 | 0.4 | GO:0060050 | positive regulation of protein glycosylation(GO:0060050) |
| 0.1 | 2.1 | GO:0048168 | regulation of neuronal synaptic plasticity(GO:0048168) |
| 0.1 | 0.6 | GO:0038172 | interleukin-33-mediated signaling pathway(GO:0038172) |
| 0.1 | 0.5 | GO:2000491 | positive regulation of hepatic stellate cell activation(GO:2000491) |
| 0.1 | 0.2 | GO:0021978 | telencephalon regionalization(GO:0021978) |
| 0.1 | 1.2 | GO:0007016 | cytoskeletal anchoring at plasma membrane(GO:0007016) |
| 0.1 | 0.2 | GO:0002304 | gamma-delta intraepithelial T cell differentiation(GO:0002304) CD8-positive, gamma-delta intraepithelial T cell differentiation(GO:0002305) |
| 0.1 | 0.2 | GO:0072183 | negative regulation by virus of viral protein levels in host cell(GO:0046725) negative regulation of nephron tubule epithelial cell differentiation(GO:0072183) negative regulation of metanephric nephron tubule epithelial cell differentiation(GO:0072308) negative regulation of epithelial cell differentiation involved in kidney development(GO:2000697) |
| 0.1 | 0.2 | GO:1904398 | positive regulation of neuromuscular junction development(GO:1904398) |
| 0.1 | 0.3 | GO:0016256 | N-glycan processing to lysosome(GO:0016256) |
| 0.1 | 0.7 | GO:0006622 | protein targeting to lysosome(GO:0006622) |
| 0.1 | 0.9 | GO:0034975 | protein folding in endoplasmic reticulum(GO:0034975) |
| 0.1 | 7.1 | GO:0010923 | negative regulation of phosphatase activity(GO:0010923) |
| 0.1 | 0.2 | GO:0098506 | nucleotide-excision repair, DNA damage removal(GO:0000718) DNA excision(GO:0044349) DNA 3' dephosphorylation(GO:0098503) DNA 3' dephosphorylation involved in DNA repair(GO:0098504) polynucleotide 3' dephosphorylation(GO:0098506) |
| 0.1 | 4.4 | GO:0044070 | regulation of anion transport(GO:0044070) |
| 0.1 | 0.2 | GO:0035281 | pre-miRNA export from nucleus(GO:0035281) |
| 0.1 | 0.2 | GO:0009125 | nucleoside monophosphate catabolic process(GO:0009125) |
| 0.1 | 1.3 | GO:0006012 | galactose metabolic process(GO:0006012) |
| 0.1 | 0.4 | GO:1901078 | negative regulation of relaxation of muscle(GO:1901078) |
| 0.1 | 0.8 | GO:0060997 | dendritic spine morphogenesis(GO:0060997) |
| 0.1 | 2.5 | GO:0030488 | tRNA methylation(GO:0030488) |
| 0.1 | 0.3 | GO:0046898 | response to cycloheximide(GO:0046898) |
| 0.1 | 0.3 | GO:0046603 | negative regulation of mitotic centrosome separation(GO:0046603) |
| 0.1 | 3.8 | GO:0007032 | endosome organization(GO:0007032) |
| 0.1 | 0.4 | GO:0021797 | forebrain anterior/posterior pattern specification(GO:0021797) |
| 0.1 | 0.9 | GO:0000414 | regulation of histone H3-K36 methylation(GO:0000414) |
| 0.1 | 2.3 | GO:0003333 | amino acid transmembrane transport(GO:0003333) |
| 0.1 | 0.1 | GO:0072387 | flavin adenine dinucleotide metabolic process(GO:0072387) |
| 0.1 | 0.8 | GO:0019919 | peptidyl-arginine methylation, to asymmetrical-dimethyl arginine(GO:0019919) |
| 0.1 | 0.2 | GO:0001907 | killing by symbiont of host cells(GO:0001907) disruption by symbiont of host cell(GO:0044004) |
| 0.1 | 0.6 | GO:0045714 | regulation of low-density lipoprotein particle receptor biosynthetic process(GO:0045714) |
| 0.1 | 0.6 | GO:0006451 | selenocysteine incorporation(GO:0001514) translational readthrough(GO:0006451) |
| 0.1 | 0.5 | GO:0006063 | uronic acid metabolic process(GO:0006063) glucuronate metabolic process(GO:0019585) |
| 0.1 | 5.0 | GO:0019985 | translesion synthesis(GO:0019985) |
| 0.1 | 0.6 | GO:0090197 | positive regulation of chemokine secretion(GO:0090197) |
| 0.1 | 0.3 | GO:1902019 | regulation of cilium movement involved in cell motility(GO:0060295) regulation of cilium beat frequency involved in ciliary motility(GO:0060296) regulation of cilium-dependent cell motility(GO:1902019) |
| 0.1 | 0.2 | GO:0019878 | lysine biosynthetic process(GO:0009085) lysine biosynthetic process via aminoadipic acid(GO:0019878) |
| 0.1 | 0.5 | GO:0097480 | synaptic vesicle transport(GO:0048489) establishment of synaptic vesicle localization(GO:0097480) |
| 0.1 | 0.3 | GO:0044778 | meiotic DNA integrity checkpoint(GO:0044778) |
| 0.1 | 0.5 | GO:0044211 | CTP salvage(GO:0044211) |
| 0.1 | 2.5 | GO:0005980 | glycogen catabolic process(GO:0005980) |
| 0.1 | 0.2 | GO:0014870 | response to muscle inactivity(GO:0014870) |
| 0.1 | 1.1 | GO:0051084 | 'de novo' posttranslational protein folding(GO:0051084) |
| 0.1 | 0.9 | GO:0006384 | transcription initiation from RNA polymerase III promoter(GO:0006384) |
| 0.1 | 0.3 | GO:0048715 | negative regulation of oligodendrocyte differentiation(GO:0048715) |
| 0.1 | 0.3 | GO:0018065 | protein-cofactor linkage(GO:0018065) |
| 0.1 | 0.1 | GO:0032100 | positive regulation of response to food(GO:0032097) positive regulation of appetite(GO:0032100) |
| 0.1 | 1.1 | GO:0051131 | chaperone-mediated protein complex assembly(GO:0051131) |
| 0.1 | 0.8 | GO:0048026 | positive regulation of mRNA splicing, via spliceosome(GO:0048026) |
| 0.1 | 5.8 | GO:0006836 | neurotransmitter transport(GO:0006836) |
| 0.1 | 0.5 | GO:0010499 | proteasomal ubiquitin-independent protein catabolic process(GO:0010499) |
| 0.1 | 0.3 | GO:1900039 | positive regulation of cellular response to hypoxia(GO:1900039) |
| 0.1 | 9.6 | GO:0034605 | cellular response to heat(GO:0034605) |
| 0.1 | 0.7 | GO:0071787 | endoplasmic reticulum tubular network assembly(GO:0071787) |
| 0.1 | 0.2 | GO:2001016 | positive regulation of skeletal muscle cell differentiation(GO:2001016) |
| 0.1 | 0.1 | GO:0045080 | positive regulation of chemokine biosynthetic process(GO:0045080) |
| 0.1 | 0.3 | GO:0061107 | seminal vesicle development(GO:0061107) |
| 0.1 | 0.4 | GO:0030638 | polyketide metabolic process(GO:0030638) daunorubicin metabolic process(GO:0044597) doxorubicin metabolic process(GO:0044598) |
| 0.1 | 0.3 | GO:0006896 | Golgi to vacuole transport(GO:0006896) |
| 0.1 | 0.3 | GO:0002328 | pro-B cell differentiation(GO:0002328) |
| 0.1 | 5.0 | GO:0006695 | cholesterol biosynthetic process(GO:0006695) secondary alcohol biosynthetic process(GO:1902653) |
| 0.1 | 1.0 | GO:0021891 | olfactory bulb interneuron development(GO:0021891) |
| 0.1 | 0.8 | GO:0043922 | negative regulation by host of viral transcription(GO:0043922) |
| 0.1 | 0.3 | GO:0050802 | circadian sleep/wake cycle, sleep(GO:0050802) |
| 0.1 | 0.1 | GO:0040009 | regulation of growth rate(GO:0040009) |
| 0.1 | 1.0 | GO:0048741 | skeletal muscle fiber development(GO:0048741) |
| 0.1 | 0.4 | GO:0070537 | histone H2A K63-linked deubiquitination(GO:0070537) |
| 0.1 | 0.4 | GO:0035063 | nuclear speck organization(GO:0035063) |
| 0.1 | 0.2 | GO:0009443 | pyridoxal 5'-phosphate salvage(GO:0009443) |
| 0.1 | 0.2 | GO:1904158 | axonemal central apparatus assembly(GO:1904158) |
| 0.1 | 0.4 | GO:0042711 | maternal behavior(GO:0042711) parental behavior(GO:0060746) |
| 0.1 | 0.4 | GO:0046092 | deoxycytidine metabolic process(GO:0046092) |
| 0.1 | 1.7 | GO:0032958 | inositol phosphate biosynthetic process(GO:0032958) |
| 0.1 | 0.4 | GO:0010166 | wax biosynthetic process(GO:0010025) wax metabolic process(GO:0010166) |
| 0.1 | 0.2 | GO:0007386 | compartment pattern specification(GO:0007386) |
| 0.1 | 0.2 | GO:0030961 | peptidyl-arginine hydroxylation(GO:0030961) |
| 0.1 | 0.2 | GO:0008595 | tripartite regional subdivision(GO:0007351) anterior/posterior axis specification, embryo(GO:0008595) |
| 0.1 | 0.4 | GO:0032348 | negative regulation of aldosterone metabolic process(GO:0032345) negative regulation of aldosterone biosynthetic process(GO:0032348) negative regulation of cortisol biosynthetic process(GO:2000065) |
| 0.1 | 0.1 | GO:1900175 | regulation of nodal signaling pathway involved in determination of left/right asymmetry(GO:1900145) regulation of nodal signaling pathway involved in determination of lateral mesoderm left/right asymmetry(GO:1900175) |
| 0.1 | 0.1 | GO:1902003 | regulation of beta-amyloid formation(GO:1902003) |
| 0.1 | 0.7 | GO:0031119 | tRNA pseudouridine synthesis(GO:0031119) |
| 0.1 | 1.5 | GO:0010842 | retina layer formation(GO:0010842) |
| 0.1 | 0.1 | GO:0018312 | peptidyl-serine ADP-ribosylation(GO:0018312) |
| 0.1 | 0.7 | GO:0046501 | protoporphyrinogen IX metabolic process(GO:0046501) |
| 0.1 | 0.1 | GO:0016259 | selenocysteine metabolic process(GO:0016259) |
| 0.1 | 0.3 | GO:0032290 | peripheral nervous system myelin formation(GO:0032290) |
| 0.1 | 3.0 | GO:0045103 | intermediate filament-based process(GO:0045103) |
| 0.1 | 0.2 | GO:0010909 | regulation of heparan sulfate proteoglycan biosynthetic process(GO:0010908) positive regulation of heparan sulfate proteoglycan biosynthetic process(GO:0010909) positive regulation of proteoglycan biosynthetic process(GO:1902730) |
| 0.1 | 0.9 | GO:0032026 | response to magnesium ion(GO:0032026) |
| 0.1 | 0.5 | GO:0018243 | protein O-linked glycosylation via threonine(GO:0018243) |
| 0.1 | 0.2 | GO:0030423 | targeting of mRNA for destruction involved in RNA interference(GO:0030423) |
| 0.1 | 0.2 | GO:0060075 | regulation of resting membrane potential(GO:0060075) |
| 0.1 | 0.2 | GO:0035330 | regulation of hippo signaling(GO:0035330) |
| 0.1 | 0.2 | GO:0061015 | RNA import into nucleus(GO:0006404) snRNA import into nucleus(GO:0061015) |
| 0.1 | 0.6 | GO:1901409 | positive regulation of phosphorylation of RNA polymerase II C-terminal domain(GO:1901409) |
| 0.1 | 0.3 | GO:0002074 | extraocular skeletal muscle development(GO:0002074) |
| 0.1 | 0.3 | GO:0034239 | macrophage fusion(GO:0034238) regulation of macrophage fusion(GO:0034239) positive regulation of macrophage fusion(GO:0034241) |
| 0.1 | 0.6 | GO:0036010 | protein localization to endosome(GO:0036010) |
| 0.1 | 2.9 | GO:0016266 | O-glycan processing(GO:0016266) |
| 0.1 | 0.5 | GO:0006564 | L-serine biosynthetic process(GO:0006564) |
| 0.1 | 1.5 | GO:0018345 | protein palmitoylation(GO:0018345) |
| 0.1 | 0.2 | GO:0031584 | activation of phospholipase D activity(GO:0031584) |
| 0.1 | 0.2 | GO:1900108 | inner medullary collecting duct development(GO:0072061) negative regulation of nodal signaling pathway(GO:1900108) |
| 0.1 | 0.4 | GO:2000399 | negative regulation of T cell differentiation in thymus(GO:0033085) negative regulation of thymocyte aggregation(GO:2000399) |
| 0.1 | 0.4 | GO:0021988 | olfactory bulb development(GO:0021772) olfactory lobe development(GO:0021988) |
| 0.1 | 0.2 | GO:0030432 | peristalsis(GO:0030432) |
| 0.1 | 0.1 | GO:1905053 | regulation of base-excision repair(GO:1905051) positive regulation of base-excision repair(GO:1905053) |
| 0.1 | 0.3 | GO:0048069 | eye pigmentation(GO:0048069) |
| 0.1 | 1.7 | GO:0000281 | mitotic cytokinesis(GO:0000281) |
| 0.1 | 0.3 | GO:0050428 | purine ribonucleoside bisphosphate biosynthetic process(GO:0034036) 3'-phosphoadenosine 5'-phosphosulfate biosynthetic process(GO:0050428) |
| 0.1 | 0.2 | GO:2001045 | negative regulation of integrin-mediated signaling pathway(GO:2001045) |
| 0.1 | 0.3 | GO:0007000 | nucleolus organization(GO:0007000) |
| 0.1 | 1.7 | GO:0021762 | substantia nigra development(GO:0021762) |
| 0.1 | 1.1 | GO:0032411 | positive regulation of transporter activity(GO:0032411) |
| 0.1 | 0.3 | GO:0007042 | lysosomal lumen acidification(GO:0007042) |
| 0.1 | 0.4 | GO:0009404 | toxin metabolic process(GO:0009404) |
| 0.1 | 0.7 | GO:0007288 | sperm axoneme assembly(GO:0007288) |
| 0.1 | 0.2 | GO:0070127 | tRNA aminoacylation for mitochondrial protein translation(GO:0070127) |
| 0.1 | 1.0 | GO:0010800 | positive regulation of peptidyl-threonine phosphorylation(GO:0010800) |
| 0.1 | 0.6 | GO:0042168 | heme metabolic process(GO:0042168) |
| 0.1 | 0.8 | GO:0043457 | regulation of cellular respiration(GO:0043457) |
| 0.1 | 0.4 | GO:0030207 | chondroitin sulfate catabolic process(GO:0030207) |
| 0.1 | 0.7 | GO:0006833 | water transport(GO:0006833) |
| 0.1 | 0.5 | GO:0010265 | SCF complex assembly(GO:0010265) |
| 0.1 | 1.9 | GO:0046839 | phospholipid dephosphorylation(GO:0046839) |
| 0.1 | 0.1 | GO:0030149 | sphingolipid catabolic process(GO:0030149) |
| 0.1 | 0.1 | GO:0032911 | negative regulation of transforming growth factor beta1 production(GO:0032911) |
| 0.1 | 0.2 | GO:0035356 | cellular triglyceride homeostasis(GO:0035356) |
| 0.0 | 0.1 | GO:1902544 | regulation of DNA N-glycosylase activity(GO:1902544) |
| 0.0 | 0.2 | GO:0060012 | synaptic transmission, glycinergic(GO:0060012) |
| 0.0 | 0.3 | GO:2000210 | positive regulation of anoikis(GO:2000210) |
| 0.0 | 0.4 | GO:0006865 | amino acid transport(GO:0006865) |
| 0.0 | 0.7 | GO:0021692 | cerebellar Purkinje cell layer morphogenesis(GO:0021692) |
| 0.0 | 0.1 | GO:2000819 | regulation of nucleotide-excision repair(GO:2000819) |
| 0.0 | 0.8 | GO:0090527 | actin filament reorganization(GO:0090527) |
| 0.0 | 0.2 | GO:0045423 | regulation of granulocyte macrophage colony-stimulating factor biosynthetic process(GO:0045423) |
| 0.0 | 0.4 | GO:0035308 | negative regulation of protein dephosphorylation(GO:0035308) |
| 0.0 | 1.6 | GO:0048024 | regulation of mRNA splicing, via spliceosome(GO:0048024) |
| 0.0 | 0.2 | GO:0072641 | type I interferon secretion(GO:0072641) |
| 0.0 | 0.5 | GO:0001696 | gastric acid secretion(GO:0001696) |
| 0.0 | 2.7 | GO:0006891 | intra-Golgi vesicle-mediated transport(GO:0006891) |
| 0.0 | 0.3 | GO:0035864 | response to potassium ion(GO:0035864) |
| 0.0 | 1.9 | GO:0031103 | axon regeneration(GO:0031103) |
| 0.0 | 1.0 | GO:0045333 | cellular respiration(GO:0045333) |
| 0.0 | 0.7 | GO:0046716 | muscle cell cellular homeostasis(GO:0046716) |
| 0.0 | 0.6 | GO:0046602 | regulation of mitotic centrosome separation(GO:0046602) |
| 0.0 | 15.9 | GO:0050911 | detection of chemical stimulus involved in sensory perception of smell(GO:0050911) |
| 0.0 | 0.2 | GO:0014886 | transition between slow and fast fiber(GO:0014886) |
| 0.0 | 2.1 | GO:0007190 | activation of adenylate cyclase activity(GO:0007190) |
| 0.0 | 0.4 | GO:0017183 | peptidyl-diphthamide metabolic process(GO:0017182) peptidyl-diphthamide biosynthetic process from peptidyl-histidine(GO:0017183) |
| 0.0 | 0.5 | GO:0010032 | meiotic chromosome condensation(GO:0010032) |
| 0.0 | 0.3 | GO:0001573 | ganglioside metabolic process(GO:0001573) |
| 0.0 | 0.2 | GO:0060335 | positive regulation of response to interferon-gamma(GO:0060332) positive regulation of interferon-gamma-mediated signaling pathway(GO:0060335) |
| 0.0 | 1.0 | GO:2000171 | negative regulation of dendrite development(GO:2000171) |
| 0.0 | 0.5 | GO:0007638 | mechanosensory behavior(GO:0007638) |
| 0.0 | 0.4 | GO:0021678 | third ventricle development(GO:0021678) |
| 0.0 | 0.2 | GO:1904116 | response to vasopressin(GO:1904116) cellular response to vasopressin(GO:1904117) |
| 0.0 | 0.7 | GO:0000290 | deadenylation-dependent decapping of nuclear-transcribed mRNA(GO:0000290) |
| 0.0 | 0.2 | GO:0032511 | late endosome to vacuole transport via multivesicular body sorting pathway(GO:0032511) |
| 0.0 | 1.8 | GO:0019933 | cAMP-mediated signaling(GO:0019933) |
| 0.0 | 1.3 | GO:0050881 | multicellular organismal movement(GO:0050879) musculoskeletal movement(GO:0050881) |
| 0.0 | 0.3 | GO:0035494 | SNARE complex disassembly(GO:0035494) |
| 0.0 | 1.9 | GO:0005977 | glycogen metabolic process(GO:0005977) |
| 0.0 | 0.3 | GO:0042226 | interleukin-6 biosynthetic process(GO:0042226) |
| 0.0 | 0.1 | GO:0036451 | cap mRNA methylation(GO:0036451) |
| 0.0 | 1.0 | GO:1902083 | negative regulation of peptidyl-cysteine S-nitrosylation(GO:1902083) |
| 0.0 | 0.1 | GO:1904220 | regulation of serine C-palmitoyltransferase activity(GO:1904220) |
| 0.0 | 0.5 | GO:0051703 | social behavior(GO:0035176) intraspecies interaction between organisms(GO:0051703) |
| 0.0 | 0.3 | GO:1904751 | positive regulation of protein localization to nucleolus(GO:1904751) |
| 0.0 | 0.1 | GO:0048936 | peripheral nervous system neuron axonogenesis(GO:0048936) |
| 0.0 | 0.2 | GO:2000074 | regulation of type B pancreatic cell development(GO:2000074) |
| 0.0 | 0.1 | GO:0038028 | insulin receptor signaling pathway via phosphatidylinositol 3-kinase(GO:0038028) |
| 0.0 | 0.5 | GO:0048387 | negative regulation of retinoic acid receptor signaling pathway(GO:0048387) |
| 0.0 | 0.6 | GO:0006517 | protein deglycosylation(GO:0006517) |
| 0.0 | 0.1 | GO:0002024 | diet induced thermogenesis(GO:0002024) |
| 0.0 | 0.1 | GO:0031643 | positive regulation of myelination(GO:0031643) |
| 0.0 | 0.0 | GO:0036215 | response to stem cell factor(GO:0036215) cellular response to stem cell factor stimulus(GO:0036216) Kit signaling pathway(GO:0038109) |
| 0.0 | 0.1 | GO:0010992 | ubiquitin homeostasis(GO:0010992) |
| 0.0 | 0.4 | GO:0036109 | alpha-linolenic acid metabolic process(GO:0036109) |
| 0.0 | 0.3 | GO:0060742 | epithelial cell differentiation involved in prostate gland development(GO:0060742) |
| 0.0 | 0.3 | GO:0070940 | dephosphorylation of RNA polymerase II C-terminal domain(GO:0070940) |
| 0.0 | 0.3 | GO:0090161 | Golgi ribbon formation(GO:0090161) |
| 0.0 | 0.3 | GO:0006768 | biotin metabolic process(GO:0006768) |
| 0.0 | 0.3 | GO:1904274 | tricellular tight junction assembly(GO:1904274) |
| 0.0 | 0.7 | GO:0072583 | clathrin-mediated endocytosis(GO:0072583) |
| 0.0 | 0.2 | GO:1990414 | replication-born double-strand break repair via sister chromatid exchange(GO:1990414) |
| 0.0 | 6.2 | GO:0006814 | sodium ion transport(GO:0006814) |
| 0.0 | 0.9 | GO:0046037 | GMP metabolic process(GO:0046037) |
| 0.0 | 0.7 | GO:1902018 | negative regulation of cilium assembly(GO:1902018) |
| 0.0 | 2.0 | GO:0006749 | glutathione metabolic process(GO:0006749) |
| 0.0 | 0.4 | GO:0017196 | N-terminal peptidyl-methionine acetylation(GO:0017196) |
| 0.0 | 0.1 | GO:0099403 | negative regulation of maintenance of sister chromatid cohesion(GO:0034092) negative regulation of maintenance of mitotic sister chromatid cohesion(GO:0034183) maintenance of mitotic sister chromatid cohesion, telomeric(GO:0099403) mitotic sister chromatid cohesion, telomeric(GO:0099404) regulation of maintenance of mitotic sister chromatid cohesion, telomeric(GO:1904907) negative regulation of maintenance of mitotic sister chromatid cohesion, telomeric(GO:1904908) |
| 0.0 | 0.3 | GO:0060397 | JAK-STAT cascade involved in growth hormone signaling pathway(GO:0060397) |
| 0.0 | 0.1 | GO:1902527 | positive regulation of protein monoubiquitination(GO:1902527) |
| 0.0 | 0.2 | GO:0045345 | positive regulation of MHC class I biosynthetic process(GO:0045345) |
| 0.0 | 0.1 | GO:2001033 | negative regulation of double-strand break repair via nonhomologous end joining(GO:2001033) |
| 0.0 | 0.2 | GO:0070221 | sulfide oxidation(GO:0019418) sulfide oxidation, using sulfide:quinone oxidoreductase(GO:0070221) |
| 0.0 | 0.2 | GO:0061146 | Peyer's patch morphogenesis(GO:0061146) |
| 0.0 | 0.5 | GO:0034391 | smooth muscle cell apoptotic process(GO:0034390) regulation of smooth muscle cell apoptotic process(GO:0034391) |
| 0.0 | 0.2 | GO:0030886 | negative regulation of myeloid dendritic cell activation(GO:0030886) |
| 0.0 | 0.2 | GO:1902045 | negative regulation of Fas signaling pathway(GO:1902045) |
| 0.0 | 0.2 | GO:0031120 | snRNA pseudouridine synthesis(GO:0031120) |
| 0.0 | 0.1 | GO:0070895 | transposon integration(GO:0070893) regulation of transposon integration(GO:0070894) negative regulation of transposon integration(GO:0070895) |
| 0.0 | 1.8 | GO:0000413 | protein peptidyl-prolyl isomerization(GO:0000413) |
| 0.0 | 0.4 | GO:1904355 | positive regulation of telomere capping(GO:1904355) |
| 0.0 | 0.1 | GO:1900041 | negative regulation of interleukin-2 secretion(GO:1900041) |
| 0.0 | 0.1 | GO:1903565 | negative regulation of protein localization to cilium(GO:1903565) regulation of protein localization to ciliary membrane(GO:1903567) negative regulation of protein localization to ciliary membrane(GO:1903568) |
| 0.0 | 0.2 | GO:0030259 | lipid glycosylation(GO:0030259) |
| 0.0 | 0.1 | GO:0002728 | negative regulation of natural killer cell cytokine production(GO:0002728) |
| 0.0 | 0.2 | GO:0033572 | transferrin transport(GO:0033572) |
| 0.0 | 0.3 | GO:0014041 | regulation of neuron maturation(GO:0014041) |
| 0.0 | 0.1 | GO:0030576 | Cajal body organization(GO:0030576) |
| 0.0 | 0.2 | GO:0071044 | histone mRNA catabolic process(GO:0071044) |
| 0.0 | 0.3 | GO:0006777 | Mo-molybdopterin cofactor biosynthetic process(GO:0006777) Mo-molybdopterin cofactor metabolic process(GO:0019720) |
| 0.0 | 0.2 | GO:0032287 | peripheral nervous system myelin maintenance(GO:0032287) |
| 0.0 | 0.3 | GO:0098789 | pre-mRNA cleavage required for polyadenylation(GO:0098789) |
| 0.0 | 0.0 | GO:0019377 | glycolipid catabolic process(GO:0019377) |
| 0.0 | 0.3 | GO:1901314 | negative regulation of histone ubiquitination(GO:0033183) negative regulation of protein K63-linked ubiquitination(GO:1900045) regulation of histone H2A K63-linked ubiquitination(GO:1901314) negative regulation of histone H2A K63-linked ubiquitination(GO:1901315) negative regulation of protein polyubiquitination(GO:1902915) |
| 0.0 | 12.5 | GO:0000209 | protein polyubiquitination(GO:0000209) |
| 0.0 | 0.1 | GO:0002862 | negative regulation of inflammatory response to antigenic stimulus(GO:0002862) |
| 0.0 | 0.3 | GO:0006499 | N-terminal protein myristoylation(GO:0006499) |
| 0.0 | 0.1 | GO:0034134 | toll-like receptor 2 signaling pathway(GO:0034134) |
| 0.0 | 0.2 | GO:0006657 | CDP-choline pathway(GO:0006657) |
| 0.0 | 0.1 | GO:0044376 | RNA polymerase II complex import to nucleus(GO:0044376) RNA polymerase III complex localization to nucleus(GO:1990022) |
| 0.0 | 0.3 | GO:0002943 | tRNA dihydrouridine synthesis(GO:0002943) |
| 0.0 | 0.2 | GO:0036481 | intrinsic apoptotic signaling pathway in response to hydrogen peroxide(GO:0036481) |
| 0.0 | 0.3 | GO:0048853 | forebrain morphogenesis(GO:0048853) |
| 0.0 | 0.5 | GO:0006388 | tRNA splicing, via endonucleolytic cleavage and ligation(GO:0006388) |
| 0.0 | 0.4 | GO:0021516 | dorsal spinal cord development(GO:0021516) |
| 0.0 | 0.8 | GO:0007040 | lysosome organization(GO:0007040) lytic vacuole organization(GO:0080171) |
| 0.0 | 1.2 | GO:0006370 | 7-methylguanosine mRNA capping(GO:0006370) |
| 0.0 | 0.2 | GO:0098759 | interleukin-8-mediated signaling pathway(GO:0038112) response to interleukin-8(GO:0098758) cellular response to interleukin-8(GO:0098759) |
| 0.0 | 0.0 | GO:1904350 | regulation of exosomal secretion(GO:1903541) regulation of protein catabolic process in the vacuole(GO:1904350) |
| 0.0 | 0.0 | GO:0051439 | regulation of ubiquitin-protein ligase activity involved in mitotic cell cycle(GO:0051439) |
| 0.0 | 0.6 | GO:0071294 | cellular response to zinc ion(GO:0071294) |
| 0.0 | 2.9 | GO:0042787 | protein ubiquitination involved in ubiquitin-dependent protein catabolic process(GO:0042787) |
| 0.0 | 0.5 | GO:0031116 | positive regulation of microtubule polymerization(GO:0031116) |
| 0.0 | 0.1 | GO:1902037 | negative regulation of hematopoietic stem cell differentiation(GO:1902037) |
| 0.0 | 0.1 | GO:0061760 | antifungal innate immune response(GO:0061760) |
| 0.0 | 0.1 | GO:1901626 | regulation of postsynaptic membrane organization(GO:1901626) |
| 0.0 | 0.1 | GO:0034643 | establishment of mitochondrion localization, microtubule-mediated(GO:0034643) mitochondrion transport along microtubule(GO:0047497) |
| 0.0 | 0.1 | GO:0090222 | centrosome-templated microtubule nucleation(GO:0090222) |
| 0.0 | 0.0 | GO:0036292 | DNA rewinding(GO:0036292) |
| 0.0 | 0.1 | GO:0045229 | cell envelope organization(GO:0043163) external encapsulating structure organization(GO:0045229) |
| 0.0 | 0.2 | GO:0034773 | histone H4-K20 trimethylation(GO:0034773) |
| 0.0 | 0.1 | GO:0090659 | adult walking behavior(GO:0007628) walking behavior(GO:0090659) |
| 0.0 | 0.0 | GO:0032915 | positive regulation of transforming growth factor beta2 production(GO:0032915) |
| 0.0 | 0.1 | GO:1901355 | cellular response to rapamycin(GO:0072752) response to rapamycin(GO:1901355) |
| 0.0 | 0.1 | GO:0007402 | ganglion mother cell fate determination(GO:0007402) stem cell fate determination(GO:0048867) |
| 0.0 | 0.2 | GO:0034244 | negative regulation of transcription elongation from RNA polymerase II promoter(GO:0034244) |
| 0.0 | 0.7 | GO:0016339 | calcium-dependent cell-cell adhesion via plasma membrane cell adhesion molecules(GO:0016339) |
| 0.0 | 0.2 | GO:0000722 | telomere maintenance via recombination(GO:0000722) |
| 0.0 | 0.8 | GO:0006953 | acute-phase response(GO:0006953) |
| 0.0 | 0.1 | GO:0046940 | nucleoside monophosphate phosphorylation(GO:0046940) |
| 0.0 | 0.9 | GO:0050690 | regulation of defense response to virus by virus(GO:0050690) |
| 0.0 | 0.1 | GO:0072600 | establishment of protein localization to Golgi(GO:0072600) |
| 0.0 | 0.1 | GO:0071947 | protein deubiquitination involved in ubiquitin-dependent protein catabolic process(GO:0071947) |
| 0.0 | 0.1 | GO:0070493 | thrombin receptor signaling pathway(GO:0070493) |
| 0.0 | 0.0 | GO:0014010 | regulation of Schwann cell proliferation(GO:0010624) negative regulation of Schwann cell proliferation(GO:0010626) Schwann cell proliferation(GO:0014010) |
| 0.0 | 0.1 | GO:0097577 | intracellular sequestering of iron ion(GO:0006880) sequestering of iron ion(GO:0097577) |
| 0.0 | 0.2 | GO:0099515 | actin filament-based transport(GO:0099515) |
| 0.0 | 0.4 | GO:0030201 | heparan sulfate proteoglycan metabolic process(GO:0030201) |
| 0.0 | 0.1 | GO:0031064 | negative regulation of histone deacetylation(GO:0031064) |
| 0.0 | 0.6 | GO:0010738 | regulation of protein kinase A signaling(GO:0010738) |
| 0.0 | 0.1 | GO:2000672 | negative regulation of motor neuron apoptotic process(GO:2000672) |
| 0.0 | 0.2 | GO:0018317 | protein C-linked glycosylation(GO:0018103) peptidyl-tryptophan modification(GO:0018211) protein C-linked glycosylation via tryptophan(GO:0018317) protein C-linked glycosylation via 2'-alpha-mannosyl-L-tryptophan(GO:0018406) |
| 0.0 | 0.2 | GO:0044351 | macropinocytosis(GO:0044351) |
| 0.0 | 0.2 | GO:0039536 | negative regulation of RIG-I signaling pathway(GO:0039536) |
| 0.0 | 0.2 | GO:0014029 | neural crest formation(GO:0014029) |
| 0.0 | 1.0 | GO:0030206 | chondroitin sulfate biosynthetic process(GO:0030206) |
| 0.0 | 0.2 | GO:0048261 | negative regulation of receptor-mediated endocytosis(GO:0048261) |
| 0.0 | 0.3 | GO:0045745 | positive regulation of G-protein coupled receptor protein signaling pathway(GO:0045745) |
| 0.0 | 0.1 | GO:0070120 | ciliary neurotrophic factor-mediated signaling pathway(GO:0070120) |
| 0.0 | 0.1 | GO:1904415 | interferon-beta biosynthetic process(GO:0045350) regulation of interferon-beta biosynthetic process(GO:0045357) regulation of xenophagy(GO:1904415) positive regulation of xenophagy(GO:1904417) |
| 0.0 | 0.2 | GO:0045078 | positive regulation of interferon-gamma biosynthetic process(GO:0045078) |
| 0.0 | 0.1 | GO:0060536 | cartilage morphogenesis(GO:0060536) |
| 0.0 | 0.1 | GO:0050650 | chondroitin sulfate proteoglycan biosynthetic process(GO:0050650) |
| 0.0 | 0.7 | GO:0006637 | acyl-CoA metabolic process(GO:0006637) thioester metabolic process(GO:0035383) |
| 0.0 | 0.4 | GO:1900078 | positive regulation of cellular response to insulin stimulus(GO:1900078) |
| 0.0 | 0.3 | GO:0016576 | histone dephosphorylation(GO:0016576) |
| 0.0 | 0.1 | GO:0030174 | regulation of DNA-dependent DNA replication initiation(GO:0030174) |
| 0.0 | 0.1 | GO:0032700 | negative regulation of interleukin-17 production(GO:0032700) |
| 0.0 | 0.1 | GO:0006627 | protein processing involved in protein targeting to mitochondrion(GO:0006627) |
| 0.0 | 0.0 | GO:0030997 | regulation of centriole-centriole cohesion(GO:0030997) |
| 0.0 | 0.2 | GO:0045161 | neuronal ion channel clustering(GO:0045161) |
| 0.0 | 0.0 | GO:0097068 | response to thyroxine(GO:0097068) response to L-phenylalanine derivative(GO:1904386) |
| 0.0 | 0.2 | GO:0000463 | maturation of LSU-rRNA from tricistronic rRNA transcript (SSU-rRNA, 5.8S rRNA, LSU-rRNA)(GO:0000463) |
| 0.0 | 0.1 | GO:0090083 | regulation of inclusion body assembly(GO:0090083) |
| 0.0 | 0.6 | GO:0007141 | male meiosis I(GO:0007141) |
| 0.0 | 0.2 | GO:0070296 | sarcoplasmic reticulum calcium ion transport(GO:0070296) |
| 0.0 | 0.2 | GO:0008635 | activation of cysteine-type endopeptidase activity involved in apoptotic process by cytochrome c(GO:0008635) |
| 0.0 | 0.2 | GO:0003322 | pancreatic A cell development(GO:0003322) |
| 0.0 | 0.1 | GO:0061737 | leukotriene signaling pathway(GO:0061737) |
| 0.0 | 0.0 | GO:0016094 | polyprenol biosynthetic process(GO:0016094) |
| 0.0 | 0.1 | GO:0033277 | abortive mitotic cell cycle(GO:0033277) |
| 0.0 | 0.1 | GO:0006529 | asparagine biosynthetic process(GO:0006529) |
| 0.0 | 0.1 | GO:2000601 | positive regulation of Arp2/3 complex-mediated actin nucleation(GO:2000601) |
| 0.0 | 0.1 | GO:0008210 | estrogen metabolic process(GO:0008210) |
| 0.0 | 0.2 | GO:0045736 | negative regulation of cyclin-dependent protein serine/threonine kinase activity(GO:0045736) negative regulation of cyclin-dependent protein kinase activity(GO:1904030) |
| 0.0 | 0.1 | GO:0015937 | coenzyme A biosynthetic process(GO:0015937) |
| 0.0 | 0.1 | GO:0072131 | kidney mesenchyme morphogenesis(GO:0072131) metanephric mesenchyme morphogenesis(GO:0072133) |
| 0.0 | 0.1 | GO:0007253 | cytoplasmic sequestering of NF-kappaB(GO:0007253) |
| 0.0 | 0.3 | GO:0035563 | positive regulation of chromatin binding(GO:0035563) |
| 0.0 | 0.1 | GO:0060999 | positive regulation of dendritic spine development(GO:0060999) |
| 0.0 | 0.0 | GO:0050760 | thymidylate synthase biosynthetic process(GO:0050757) regulation of thymidylate synthase biosynthetic process(GO:0050758) negative regulation of thymidylate synthase biosynthetic process(GO:0050760) |
| 0.0 | 0.0 | GO:0032727 | positive regulation of interferon-alpha production(GO:0032727) |
| 0.0 | 0.0 | GO:0006835 | dicarboxylic acid transport(GO:0006835) |
| 0.0 | 0.1 | GO:0045954 | positive regulation of natural killer cell mediated cytotoxicity(GO:0045954) |
| 0.0 | 0.1 | GO:0090156 | negative regulation of sphingolipid biosynthetic process(GO:0090155) cellular sphingolipid homeostasis(GO:0090156) negative regulation of ceramide biosynthetic process(GO:1900060) |
| 0.0 | 0.1 | GO:2001034 | positive regulation of double-strand break repair via nonhomologous end joining(GO:2001034) |
Gene overrepresentation in cellular component category:
| Log-likelihood per target | Total log-likelihood | Term | Description |
|---|---|---|---|
| 2.7 | 8.1 | GO:0002947 | tumor necrosis factor receptor superfamily complex(GO:0002947) |
| 2.1 | 4.1 | GO:0034365 | discoidal high-density lipoprotein particle(GO:0034365) |
| 2.0 | 16.1 | GO:0070695 | FHF complex(GO:0070695) |
| 1.9 | 9.5 | GO:0005960 | glycine cleavage complex(GO:0005960) |
| 1.8 | 5.5 | GO:1990844 | subsarcolemmal mitochondrion(GO:1990843) interfibrillar mitochondrion(GO:1990844) |
| 1.4 | 11.5 | GO:0034363 | intermediate-density lipoprotein particle(GO:0034363) |
| 1.3 | 10.6 | GO:0002169 | 3-methylcrotonyl-CoA carboxylase complex, mitochondrial(GO:0002169) methylcrotonoyl-CoA carboxylase complex(GO:1905202) |
| 1.3 | 7.7 | GO:1990584 | cardiac Troponin complex(GO:1990584) |
| 1.1 | 22.9 | GO:0045179 | apical cortex(GO:0045179) |
| 1.0 | 11.5 | GO:0008282 | ATP-sensitive potassium channel complex(GO:0008282) |
| 1.0 | 3.1 | GO:0000229 | cytoplasmic chromosome(GO:0000229) |
| 1.0 | 4.0 | GO:0044307 | dendritic branch(GO:0044307) |
| 1.0 | 12.1 | GO:0033269 | internode region of axon(GO:0033269) |
| 1.0 | 6.0 | GO:0089717 | spanning component of plasma membrane(GO:0044214) spanning component of membrane(GO:0089717) |
| 0.9 | 33.0 | GO:0014731 | spectrin-associated cytoskeleton(GO:0014731) |
| 0.9 | 6.3 | GO:0009331 | glycerol-3-phosphate dehydrogenase complex(GO:0009331) |
| 0.8 | 2.4 | GO:0071665 | gamma-catenin-TCF7L2 complex(GO:0071665) |
| 0.8 | 2.4 | GO:0070069 | cytochrome complex(GO:0070069) |
| 0.7 | 4.3 | GO:0005916 | fascia adherens(GO:0005916) |
| 0.7 | 9.8 | GO:0042627 | chylomicron(GO:0042627) |
| 0.7 | 8.5 | GO:0061689 | tricellular tight junction(GO:0061689) |
| 0.6 | 18.9 | GO:0005922 | connexon complex(GO:0005922) |
| 0.6 | 6.3 | GO:0000220 | vacuolar proton-transporting V-type ATPase, V0 domain(GO:0000220) |
| 0.6 | 6.9 | GO:0000015 | phosphopyruvate hydratase complex(GO:0000015) |
| 0.6 | 1.7 | GO:0098831 | cytoskeleton of presynaptic active zone(GO:0048788) presynaptic active zone cytoplasmic component(GO:0098831) presynaptic cytoskeleton(GO:0099569) |
| 0.5 | 3.3 | GO:0000221 | vacuolar proton-transporting V-type ATPase, V1 domain(GO:0000221) |
| 0.5 | 10.2 | GO:0033270 | paranode region of axon(GO:0033270) |
| 0.5 | 5.3 | GO:0034366 | spherical high-density lipoprotein particle(GO:0034366) |
| 0.5 | 3.7 | GO:1990031 | pinceau fiber(GO:1990031) |
| 0.5 | 2.6 | GO:0017109 | glutamate-cysteine ligase complex(GO:0017109) |
| 0.5 | 7.7 | GO:0005861 | troponin complex(GO:0005861) |
| 0.5 | 3.6 | GO:0032144 | 4-aminobutyrate transaminase complex(GO:0032144) |
| 0.5 | 2.0 | GO:0034685 | integrin alphav-beta6 complex(GO:0034685) |
| 0.5 | 10.8 | GO:0061200 | clathrin-sculpted gamma-aminobutyric acid transport vesicle(GO:0061200) clathrin-sculpted gamma-aminobutyric acid transport vesicle membrane(GO:0061202) |
| 0.5 | 30.3 | GO:0030673 | axolemma(GO:0030673) |
| 0.5 | 3.4 | GO:0097513 | myosin II filament(GO:0097513) |
| 0.5 | 4.3 | GO:1990578 | perinuclear endoplasmic reticulum membrane(GO:1990578) |
| 0.5 | 4.2 | GO:0005579 | membrane attack complex(GO:0005579) |
| 0.5 | 2.8 | GO:0042584 | chromaffin granule membrane(GO:0042584) |
| 0.5 | 3.2 | GO:0070033 | synaptobrevin 2-SNAP-25-syntaxin-1a-complexin II complex(GO:0070033) |
| 0.5 | 5.0 | GO:0044294 | dendritic growth cone(GO:0044294) |
| 0.4 | 0.9 | GO:0097454 | Schwann cell microvillus(GO:0097454) |
| 0.4 | 4.5 | GO:0044305 | calyx of Held(GO:0044305) |
| 0.4 | 2.6 | GO:0097441 | basilar dendrite(GO:0097441) |
| 0.4 | 5.5 | GO:0097512 | cardiac myofibril(GO:0097512) |
| 0.4 | 2.5 | GO:0005896 | interleukin-6 receptor complex(GO:0005896) |
| 0.4 | 7.5 | GO:0097450 | astrocyte end-foot(GO:0097450) |
| 0.4 | 5.4 | GO:0005577 | fibrinogen complex(GO:0005577) |
| 0.4 | 10.7 | GO:0016342 | catenin complex(GO:0016342) |
| 0.4 | 3.1 | GO:0033010 | paranodal junction(GO:0033010) |
| 0.4 | 13.3 | GO:0031231 | integral component of peroxisomal membrane(GO:0005779) intrinsic component of peroxisomal membrane(GO:0031231) |
| 0.4 | 12.7 | GO:0034706 | sodium channel complex(GO:0034706) |
| 0.4 | 0.4 | GO:0033018 | sarcoplasmic reticulum lumen(GO:0033018) |
| 0.4 | 5.1 | GO:0005587 | collagen type IV trimer(GO:0005587) |
| 0.4 | 20.2 | GO:0031430 | M band(GO:0031430) |
| 0.4 | 2.1 | GO:0005818 | astral microtubule(GO:0000235) aster(GO:0005818) |
| 0.3 | 16.1 | GO:1902710 | GABA receptor complex(GO:1902710) |
| 0.3 | 32.5 | GO:0033017 | sarcoplasmic reticulum membrane(GO:0033017) |
| 0.3 | 9.9 | GO:0033268 | node of Ranvier(GO:0033268) |
| 0.3 | 2.7 | GO:0097025 | MPP7-DLG1-LIN7 complex(GO:0097025) |
| 0.3 | 12.0 | GO:0031143 | pseudopodium(GO:0031143) |
| 0.3 | 2.0 | GO:0070826 | paraferritin complex(GO:0070826) |
| 0.3 | 2.6 | GO:0005594 | collagen type IX trimer(GO:0005594) |
| 0.3 | 2.8 | GO:0097425 | smooth endoplasmic reticulum membrane(GO:0030868) smooth endoplasmic reticulum part(GO:0097425) |
| 0.3 | 1.6 | GO:0045272 | plasma membrane respiratory chain complex I(GO:0045272) |
| 0.3 | 7.5 | GO:0032426 | stereocilium tip(GO:0032426) |
| 0.3 | 0.9 | GO:1990435 | stereocilia tip link(GO:0002140) myosin VII complex(GO:0031477) stereocilia tip-link density(GO:1990427) upper tip-link density(GO:1990435) |
| 0.3 | 3.6 | GO:0043190 | ATP-binding cassette (ABC) transporter complex(GO:0043190) |
| 0.3 | 4.9 | GO:0016327 | apicolateral plasma membrane(GO:0016327) |
| 0.3 | 3.7 | GO:0060091 | kinocilium(GO:0060091) |
| 0.3 | 7.4 | GO:0005890 | sodium:potassium-exchanging ATPase complex(GO:0005890) |
| 0.3 | 0.3 | GO:0097449 | astrocyte projection(GO:0097449) |
| 0.3 | 1.1 | GO:0038038 | G-protein coupled receptor homodimeric complex(GO:0038038) |
| 0.3 | 6.1 | GO:0016461 | unconventional myosin complex(GO:0016461) |
| 0.3 | 2.2 | GO:0033180 | proton-transporting V-type ATPase, V1 domain(GO:0033180) |
| 0.3 | 1.6 | GO:1990357 | terminal web(GO:1990357) |
| 0.3 | 0.3 | GO:1990745 | EARP complex(GO:1990745) |
| 0.3 | 2.2 | GO:0043219 | lateral loop(GO:0043219) |
| 0.3 | 4.0 | GO:0034362 | low-density lipoprotein particle(GO:0034362) |
| 0.3 | 12.8 | GO:0048786 | presynaptic active zone(GO:0048786) |
| 0.3 | 9.3 | GO:0044295 | axonal growth cone(GO:0044295) |
| 0.3 | 6.8 | GO:0005859 | muscle myosin complex(GO:0005859) |
| 0.3 | 1.8 | GO:0043541 | UDP-N-acetylglucosamine transferase complex(GO:0043541) |
| 0.2 | 2.2 | GO:1990635 | proximal dendrite(GO:1990635) |
| 0.2 | 1.4 | GO:1990769 | proximal neuron projection(GO:1990769) |
| 0.2 | 5.5 | GO:0032585 | multivesicular body membrane(GO:0032585) |
| 0.2 | 0.9 | GO:0071817 | MMXD complex(GO:0071817) |
| 0.2 | 4.2 | GO:0035253 | ciliary rootlet(GO:0035253) |
| 0.2 | 0.9 | GO:0017071 | intracellular cyclic nucleotide activated cation channel complex(GO:0017071) |
| 0.2 | 3.7 | GO:0005750 | mitochondrial respiratory chain complex III(GO:0005750) respiratory chain complex III(GO:0045275) |
| 0.2 | 0.5 | GO:0034680 | integrin alpha10-beta1 complex(GO:0034680) |
| 0.2 | 31.8 | GO:0044438 | microbody part(GO:0044438) peroxisomal part(GO:0044439) |
| 0.2 | 14.5 | GO:0034707 | chloride channel complex(GO:0034707) |
| 0.2 | 2.0 | GO:0033179 | proton-transporting V-type ATPase, V0 domain(GO:0033179) |
| 0.2 | 2.8 | GO:0045254 | pyruvate dehydrogenase complex(GO:0045254) |
| 0.2 | 1.7 | GO:0097442 | CA3 pyramidal cell dendrite(GO:0097442) |
| 0.2 | 0.6 | GO:0033565 | ESCRT-0 complex(GO:0033565) |
| 0.2 | 2.1 | GO:0045252 | oxoglutarate dehydrogenase complex(GO:0045252) |
| 0.2 | 1.2 | GO:0043291 | RAVE complex(GO:0043291) |
| 0.2 | 1.0 | GO:0097362 | MCM8-MCM9 complex(GO:0097362) |
| 0.2 | 0.8 | GO:0030895 | apolipoprotein B mRNA editing enzyme complex(GO:0030895) |
| 0.2 | 4.2 | GO:0032433 | filopodium tip(GO:0032433) |
| 0.2 | 6.4 | GO:0005892 | acetylcholine-gated channel complex(GO:0005892) |
| 0.2 | 7.1 | GO:0031304 | intrinsic component of mitochondrial inner membrane(GO:0031304) integral component of mitochondrial inner membrane(GO:0031305) |
| 0.2 | 4.8 | GO:0031588 | nucleotide-activated protein kinase complex(GO:0031588) |
| 0.2 | 13.3 | GO:0045271 | mitochondrial respiratory chain complex I(GO:0005747) NADH dehydrogenase complex(GO:0030964) respiratory chain complex I(GO:0045271) |
| 0.2 | 20.9 | GO:0042734 | presynaptic membrane(GO:0042734) |
| 0.2 | 0.2 | GO:0034666 | integrin alpha2-beta1 complex(GO:0034666) |
| 0.2 | 1.5 | GO:0045239 | tricarboxylic acid cycle enzyme complex(GO:0045239) |
| 0.2 | 3.1 | GO:0046581 | intercellular canaliculus(GO:0046581) |
| 0.2 | 2.1 | GO:0031313 | extrinsic component of endosome membrane(GO:0031313) |
| 0.2 | 1.5 | GO:0097197 | tetraspanin-enriched microdomain(GO:0097197) |
| 0.2 | 11.5 | GO:0032281 | AMPA glutamate receptor complex(GO:0032281) |
| 0.2 | 1.1 | GO:0032807 | DNA ligase IV complex(GO:0032807) |
| 0.2 | 1.3 | GO:0070545 | PeBoW complex(GO:0070545) |
| 0.2 | 1.3 | GO:0020016 | ciliary pocket(GO:0020016) ciliary pocket membrane(GO:0020018) |
| 0.2 | 2.3 | GO:0031211 | serine C-palmitoyltransferase complex(GO:0017059) endoplasmic reticulum palmitoyltransferase complex(GO:0031211) |
| 0.2 | 0.9 | GO:0005826 | actomyosin contractile ring(GO:0005826) |
| 0.2 | 0.7 | GO:0030891 | VCB complex(GO:0030891) |
| 0.2 | 11.3 | GO:0042579 | peroxisome(GO:0005777) microbody(GO:0042579) |
| 0.2 | 8.6 | GO:0030140 | trans-Golgi network transport vesicle(GO:0030140) |
| 0.2 | 1.9 | GO:0005786 | signal recognition particle, endoplasmic reticulum targeting(GO:0005786) |
| 0.2 | 3.1 | GO:0005915 | zonula adherens(GO:0005915) |
| 0.2 | 5.8 | GO:0000314 | organellar small ribosomal subunit(GO:0000314) mitochondrial small ribosomal subunit(GO:0005763) |
| 0.2 | 106.4 | GO:0005759 | mitochondrial matrix(GO:0005759) |
| 0.2 | 1.3 | GO:0036056 | filtration diaphragm(GO:0036056) slit diaphragm(GO:0036057) |
| 0.2 | 4.2 | GO:0030658 | transport vesicle membrane(GO:0030658) |
| 0.2 | 0.5 | GO:0048269 | methionine adenosyltransferase complex(GO:0048269) |
| 0.2 | 1.8 | GO:0005964 | phosphorylase kinase complex(GO:0005964) |
| 0.2 | 1.0 | GO:0099634 | postsynaptic specialization membrane(GO:0099634) |
| 0.2 | 1.9 | GO:0005664 | origin recognition complex(GO:0000808) nuclear origin of replication recognition complex(GO:0005664) |
| 0.2 | 3.0 | GO:0043083 | synaptic cleft(GO:0043083) |
| 0.2 | 12.8 | GO:1904115 | axon cytoplasm(GO:1904115) |
| 0.2 | 13.7 | GO:0045095 | keratin filament(GO:0045095) |
| 0.2 | 4.0 | GO:0031235 | intrinsic component of the cytoplasmic side of the plasma membrane(GO:0031235) |
| 0.2 | 1.4 | GO:0016471 | vacuolar proton-transporting V-type ATPase complex(GO:0016471) |
| 0.2 | 0.3 | GO:0034686 | integrin alphav-beta8 complex(GO:0034686) |
| 0.2 | 0.8 | GO:0032937 | SREBP-SCAP-Insig complex(GO:0032937) |
| 0.2 | 10.9 | GO:0030315 | T-tubule(GO:0030315) |
| 0.2 | 2.5 | GO:0031045 | dense core granule(GO:0031045) |
| 0.2 | 6.5 | GO:0008328 | ionotropic glutamate receptor complex(GO:0008328) neurotransmitter receptor complex(GO:0098878) |
| 0.2 | 2.0 | GO:1990712 | HFE-transferrin receptor complex(GO:1990712) |
| 0.2 | 3.1 | GO:0031089 | platelet dense granule lumen(GO:0031089) |
| 0.2 | 0.6 | GO:0035517 | PR-DUB complex(GO:0035517) |
| 0.2 | 5.2 | GO:0032809 | neuronal cell body membrane(GO:0032809) cell body membrane(GO:0044298) |
| 0.1 | 0.3 | GO:0097059 | CNTFR-CLCF1 complex(GO:0097059) |
| 0.1 | 0.6 | GO:0031084 | BLOC-2 complex(GO:0031084) |
| 0.1 | 6.5 | GO:0035371 | microtubule plus-end(GO:0035371) |
| 0.1 | 34.9 | GO:0016323 | basolateral plasma membrane(GO:0016323) |
| 0.1 | 11.7 | GO:0030669 | clathrin-coated endocytic vesicle membrane(GO:0030669) |
| 0.1 | 0.4 | GO:0032002 | interleukin-28 receptor complex(GO:0032002) |
| 0.1 | 0.7 | GO:0005744 | mitochondrial inner membrane presequence translocase complex(GO:0005744) |
| 0.1 | 2.8 | GO:0097433 | dense body(GO:0097433) |
| 0.1 | 4.5 | GO:0005746 | mitochondrial respiratory chain(GO:0005746) |
| 0.1 | 0.4 | GO:0075341 | host cell PML body(GO:0075341) |
| 0.1 | 1.0 | GO:0098837 | postsynaptic recycling endosome(GO:0098837) |
| 0.1 | 75.2 | GO:0016324 | apical plasma membrane(GO:0016324) |
| 0.1 | 0.7 | GO:0032302 | MutSbeta complex(GO:0032302) |
| 0.1 | 0.6 | GO:0071821 | FANCM-MHF complex(GO:0071821) |
| 0.1 | 8.7 | GO:0005801 | cis-Golgi network(GO:0005801) |
| 0.1 | 1.1 | GO:0035032 | phosphatidylinositol 3-kinase complex, class III(GO:0035032) |
| 0.1 | 0.8 | GO:0030132 | clathrin coat of coated pit(GO:0030132) |
| 0.1 | 11.8 | GO:0099501 | synaptic vesicle membrane(GO:0030672) exocytic vesicle membrane(GO:0099501) |
| 0.1 | 0.9 | GO:0070552 | BRISC complex(GO:0070552) |
| 0.1 | 0.4 | GO:0060198 | clathrin-sculpted vesicle(GO:0060198) |
| 0.1 | 2.4 | GO:0030660 | Golgi-associated vesicle membrane(GO:0030660) |
| 0.1 | 3.4 | GO:0030137 | COPI-coated vesicle(GO:0030137) |
| 0.1 | 0.7 | GO:0097209 | epidermal lamellar body(GO:0097209) |
| 0.1 | 3.1 | GO:0098573 | intrinsic component of mitochondrial membrane(GO:0098573) |
| 0.1 | 5.9 | GO:0080008 | Cul4-RING E3 ubiquitin ligase complex(GO:0080008) |
| 0.1 | 5.4 | GO:0005770 | late endosome(GO:0005770) |
| 0.1 | 1.0 | GO:0033165 | interphotoreceptor matrix(GO:0033165) |
| 0.1 | 1.0 | GO:0005921 | gap junction(GO:0005921) |
| 0.1 | 5.2 | GO:0000791 | euchromatin(GO:0000791) |
| 0.1 | 1.5 | GO:0017119 | Golgi transport complex(GO:0017119) |
| 0.1 | 37.4 | GO:0005743 | mitochondrial inner membrane(GO:0005743) |
| 0.1 | 0.9 | GO:0071546 | pi-body(GO:0071546) |
| 0.1 | 34.2 | GO:0014069 | postsynaptic density(GO:0014069) postsynaptic specialization(GO:0099572) |
| 0.1 | 0.3 | GO:0051286 | growing cell tip(GO:0035838) new growing cell tip(GO:0035841) cell tip(GO:0051286) |
| 0.1 | 1.4 | GO:0000506 | glycosylphosphatidylinositol-N-acetylglucosaminyltransferase (GPI-GnT) complex(GO:0000506) |
| 0.1 | 0.4 | GO:0035354 | Toll-like receptor 1-Toll-like receptor 2 protein complex(GO:0035354) |
| 0.1 | 5.2 | GO:0000159 | protein phosphatase type 2A complex(GO:0000159) |
| 0.1 | 9.1 | GO:0033116 | endoplasmic reticulum-Golgi intermediate compartment membrane(GO:0033116) |
| 0.1 | 1.1 | GO:0031462 | Cul2-RING ubiquitin ligase complex(GO:0031462) |
| 0.1 | 1.5 | GO:0036019 | endolysosome(GO:0036019) |
| 0.1 | 0.7 | GO:0034678 | integrin alpha8-beta1 complex(GO:0034678) |
| 0.1 | 0.3 | GO:0031515 | tRNA (m1A) methyltransferase complex(GO:0031515) |
| 0.1 | 0.5 | GO:0036501 | UFD1-NPL4 complex(GO:0036501) |
| 0.1 | 4.0 | GO:0005758 | mitochondrial intermembrane space(GO:0005758) |
| 0.1 | 8.9 | GO:0008021 | synaptic vesicle(GO:0008021) |
| 0.1 | 0.6 | GO:1902560 | GMP reductase complex(GO:1902560) |
| 0.1 | 10.8 | GO:0032580 | Golgi cisterna membrane(GO:0032580) |
| 0.1 | 1.2 | GO:0031362 | anchored component of external side of plasma membrane(GO:0031362) |
| 0.1 | 4.6 | GO:0043195 | terminal bouton(GO:0043195) |
| 0.1 | 0.4 | GO:0030956 | glutamyl-tRNA(Gln) amidotransferase complex(GO:0030956) |
| 0.1 | 0.3 | GO:0036457 | keratohyalin granule(GO:0036457) |
| 0.1 | 1.0 | GO:1990316 | ATG1/ULK1 kinase complex(GO:1990316) |
| 0.1 | 1.3 | GO:0019773 | proteasome core complex, alpha-subunit complex(GO:0019773) |
| 0.1 | 0.4 | GO:0002189 | ribose phosphate diphosphokinase complex(GO:0002189) |
| 0.1 | 10.1 | GO:0031463 | Cul3-RING ubiquitin ligase complex(GO:0031463) |
| 0.1 | 0.5 | GO:0070971 | endoplasmic reticulum exit site(GO:0070971) |
| 0.1 | 0.8 | GO:0001940 | male pronucleus(GO:0001940) |
| 0.1 | 0.4 | GO:0032541 | cortical endoplasmic reticulum(GO:0032541) |
| 0.1 | 0.5 | GO:0000126 | transcription factor TFIIIB complex(GO:0000126) |
| 0.1 | 0.3 | GO:0034515 | proteasome storage granule(GO:0034515) |
| 0.1 | 0.7 | GO:1990452 | Parkin-FBXW7-Cul1 ubiquitin ligase complex(GO:1990452) |
| 0.1 | 1.2 | GO:0072546 | ER membrane protein complex(GO:0072546) |
| 0.1 | 0.3 | GO:0044322 | endoplasmic reticulum quality control compartment(GO:0044322) |
| 0.1 | 6.9 | GO:0043197 | dendritic spine(GO:0043197) |
| 0.1 | 14.5 | GO:0030426 | growth cone(GO:0030426) |
| 0.1 | 3.7 | GO:0005771 | multivesicular body(GO:0005771) |
| 0.1 | 13.0 | GO:0034702 | ion channel complex(GO:0034702) |
| 0.1 | 2.4 | GO:0005849 | mRNA cleavage factor complex(GO:0005849) |
| 0.1 | 0.6 | GO:0044352 | pinosome(GO:0044352) macropinosome(GO:0044354) |
| 0.1 | 7.6 | GO:0055037 | recycling endosome(GO:0055037) |
| 0.1 | 2.0 | GO:0030057 | desmosome(GO:0030057) |
| 0.1 | 4.1 | GO:0098793 | presynapse(GO:0098793) |
| 0.1 | 3.7 | GO:0031966 | mitochondrial membrane(GO:0031966) |
| 0.1 | 0.4 | GO:0017101 | aminoacyl-tRNA synthetase multienzyme complex(GO:0017101) |
| 0.1 | 0.4 | GO:0065010 | extracellular membrane-bounded organelle(GO:0065010) |
| 0.1 | 1.1 | GO:0034464 | BBSome(GO:0034464) |
| 0.1 | 1.8 | GO:0031265 | CD95 death-inducing signaling complex(GO:0031265) |
| 0.1 | 0.1 | GO:0016939 | kinesin II complex(GO:0016939) |
| 0.1 | 2.3 | GO:0005640 | nuclear outer membrane(GO:0005640) |
| 0.1 | 0.2 | GO:1990716 | axonemal central apparatus(GO:1990716) |
| 0.1 | 0.4 | GO:0005968 | Rab-protein geranylgeranyltransferase complex(GO:0005968) |
| 0.1 | 1.9 | GO:0097381 | photoreceptor disc membrane(GO:0097381) |
| 0.1 | 0.4 | GO:0000408 | EKC/KEOPS complex(GO:0000408) |
| 0.1 | 1.2 | GO:0032045 | guanyl-nucleotide exchange factor complex(GO:0032045) |
| 0.1 | 0.3 | GO:1902912 | pyruvate kinase complex(GO:1902912) |
| 0.1 | 8.4 | GO:0043209 | myelin sheath(GO:0043209) |
| 0.1 | 0.4 | GO:0042765 | GPI-anchor transamidase complex(GO:0042765) |
| 0.1 | 1.3 | GO:0005942 | phosphatidylinositol 3-kinase complex(GO:0005942) |
| 0.1 | 0.2 | GO:0097543 | ciliary inversin compartment(GO:0097543) |
| 0.1 | 1.8 | GO:0031904 | endosome lumen(GO:0031904) |
| 0.1 | 0.1 | GO:0097679 | other organism cytoplasm(GO:0097679) |
| 0.1 | 0.3 | GO:0044423 | virion(GO:0019012) virion part(GO:0044423) |
| 0.1 | 0.5 | GO:0070847 | core mediator complex(GO:0070847) |
| 0.1 | 0.3 | GO:0031466 | Cul5-RING ubiquitin ligase complex(GO:0031466) |
| 0.1 | 10.0 | GO:0019867 | outer membrane(GO:0019867) |
| 0.1 | 0.9 | GO:0031597 | cytosolic proteasome complex(GO:0031597) |
| 0.1 | 3.7 | GO:0005793 | endoplasmic reticulum-Golgi intermediate compartment(GO:0005793) |
| 0.1 | 1.0 | GO:0034364 | high-density lipoprotein particle(GO:0034364) |
| 0.1 | 0.9 | GO:0000815 | ESCRT III complex(GO:0000815) |
| 0.1 | 1.2 | GO:0030877 | beta-catenin destruction complex(GO:0030877) |
| 0.1 | 0.2 | GO:1990038 | glial cytoplasmic inclusion(GO:0097409) classical Lewy body(GO:0097414) Lewy neurite(GO:0097462) Lewy body corona(GO:1990038) |
| 0.1 | 5.5 | GO:0019866 | organelle inner membrane(GO:0019866) |
| 0.1 | 1.6 | GO:0045334 | clathrin-coated endocytic vesicle(GO:0045334) |
| 0.1 | 0.2 | GO:0031166 | integral component of vacuolar membrane(GO:0031166) intrinsic component of autophagosome membrane(GO:0097636) integral component of autophagosome membrane(GO:0097637) |
| 0.1 | 0.4 | GO:0031083 | BLOC-1 complex(GO:0031083) |
| 0.1 | 2.4 | GO:0005881 | cytoplasmic microtubule(GO:0005881) |
| 0.1 | 1.2 | GO:0043679 | axon terminus(GO:0043679) |
| 0.1 | 0.3 | GO:0002178 | palmitoyltransferase complex(GO:0002178) |
| 0.1 | 0.8 | GO:0030904 | retromer complex(GO:0030904) |
| 0.1 | 13.3 | GO:0098791 | Golgi subcompartment(GO:0098791) |
| 0.1 | 0.7 | GO:0033588 | Elongator holoenzyme complex(GO:0033588) |
| 0.1 | 1.7 | GO:0044291 | cell-cell contact zone(GO:0044291) |
| 0.1 | 4.4 | GO:0030136 | clathrin-coated vesicle(GO:0030136) |
| 0.1 | 0.2 | GO:0042565 | RNA nuclear export complex(GO:0042565) |
| 0.0 | 0.3 | GO:0000172 | ribonuclease MRP complex(GO:0000172) |
| 0.0 | 0.2 | GO:0070701 | mucus layer(GO:0070701) |
| 0.0 | 1.3 | GO:0046658 | anchored component of plasma membrane(GO:0046658) |
| 0.0 | 0.2 | GO:0031501 | mannosyltransferase complex(GO:0031501) |
| 0.0 | 2.8 | GO:0005871 | kinesin complex(GO:0005871) |
| 0.0 | 0.5 | GO:0071986 | Ragulator complex(GO:0071986) |
| 0.0 | 0.8 | GO:0008385 | IkappaB kinase complex(GO:0008385) |
| 0.0 | 52.4 | GO:0005789 | endoplasmic reticulum membrane(GO:0005789) |
| 0.0 | 5.2 | GO:0032587 | ruffle membrane(GO:0032587) |
| 0.0 | 0.2 | GO:0031467 | Cul7-RING ubiquitin ligase complex(GO:0031467) |
| 0.0 | 0.3 | GO:1990682 | CSF1-CSF1R complex(GO:1990682) |
| 0.0 | 1.2 | GO:0005665 | DNA-directed RNA polymerase II, core complex(GO:0005665) |
| 0.0 | 0.7 | GO:0005885 | Arp2/3 protein complex(GO:0005885) |
| 0.0 | 0.5 | GO:0031258 | lamellipodium membrane(GO:0031258) |
| 0.0 | 0.2 | GO:0070852 | cell body fiber(GO:0070852) |
| 0.0 | 0.2 | GO:0044306 | neuron projection terminus(GO:0044306) |
| 0.0 | 0.1 | GO:0033162 | melanosome membrane(GO:0033162) chitosome(GO:0045009) |
| 0.0 | 2.2 | GO:0001750 | photoreceptor outer segment(GO:0001750) |
| 0.0 | 0.6 | GO:0016013 | syntrophin complex(GO:0016013) |
| 0.0 | 0.4 | GO:0033391 | chromatoid body(GO:0033391) |
| 0.0 | 0.3 | GO:0005956 | protein kinase CK2 complex(GO:0005956) |
| 0.0 | 0.8 | GO:0016281 | eukaryotic translation initiation factor 4F complex(GO:0016281) |
| 0.0 | 0.1 | GO:0030119 | AP-type membrane coat adaptor complex(GO:0030119) |
| 0.0 | 1.8 | GO:0045171 | intercellular bridge(GO:0045171) |
| 0.0 | 0.1 | GO:0000818 | nuclear MIS12/MIND complex(GO:0000818) |
| 0.0 | 0.5 | GO:0030870 | Mre11 complex(GO:0030870) |
| 0.0 | 0.4 | GO:0044754 | autolysosome(GO:0044754) |
| 0.0 | 0.2 | GO:0043625 | delta DNA polymerase complex(GO:0043625) |
| 0.0 | 1.8 | GO:0019005 | SCF ubiquitin ligase complex(GO:0019005) |
| 0.0 | 0.2 | GO:1990726 | Lsm1-7-Pat1 complex(GO:1990726) |
| 0.0 | 8.7 | GO:0045202 | synapse(GO:0045202) |
| 0.0 | 0.5 | GO:0070776 | H3 histone acetyltransferase complex(GO:0070775) MOZ/MORF histone acetyltransferase complex(GO:0070776) |
| 0.0 | 0.2 | GO:0070876 | SOSS complex(GO:0070876) |
| 0.0 | 0.5 | GO:0061700 | GATOR2 complex(GO:0061700) |
| 0.0 | 0.3 | GO:0000796 | condensin complex(GO:0000796) |
| 0.0 | 1.0 | GO:0034451 | centriolar satellite(GO:0034451) |
| 0.0 | 0.3 | GO:0030008 | TRAPP complex(GO:0030008) |
| 0.0 | 0.1 | GO:0097058 | CRLF-CLCF1 complex(GO:0097058) |
| 0.0 | 0.2 | GO:0005869 | dynactin complex(GO:0005869) |
| 0.0 | 0.1 | GO:0097545 | axonemal outer doublet(GO:0097545) |
| 0.0 | 0.2 | GO:0008541 | proteasome regulatory particle, lid subcomplex(GO:0008541) |
| 0.0 | 0.2 | GO:0005851 | eukaryotic translation initiation factor 2B complex(GO:0005851) |
| 0.0 | 0.4 | GO:0030914 | STAGA complex(GO:0030914) |
| 0.0 | 0.3 | GO:0016529 | sarcoplasmic reticulum(GO:0016529) |
| 0.0 | 0.4 | GO:0032039 | integrator complex(GO:0032039) |
| 0.0 | 0.2 | GO:0070449 | elongin complex(GO:0070449) |
| 0.0 | 0.3 | GO:0034045 | pre-autophagosomal structure membrane(GO:0034045) |
| 0.0 | 0.3 | GO:0031301 | integral component of organelle membrane(GO:0031301) |
| 0.0 | 0.1 | GO:0034457 | Mpp10 complex(GO:0034457) |
| 0.0 | 8.1 | GO:0000139 | Golgi membrane(GO:0000139) |
| 0.0 | 0.5 | GO:0030670 | phagocytic vesicle membrane(GO:0030670) |
| 0.0 | 0.2 | GO:0005663 | DNA replication factor C complex(GO:0005663) |
| 0.0 | 0.2 | GO:0030896 | checkpoint clamp complex(GO:0030896) |
| 0.0 | 0.2 | GO:0072669 | tRNA-splicing ligase complex(GO:0072669) |
| 0.0 | 0.2 | GO:0005675 | holo TFIIH complex(GO:0005675) |
| 0.0 | 2.6 | GO:0000151 | ubiquitin ligase complex(GO:0000151) |
| 0.0 | 0.3 | GO:0042405 | nuclear inclusion body(GO:0042405) |
| 0.0 | 0.0 | GO:0034657 | GID complex(GO:0034657) |
| 0.0 | 0.2 | GO:0005776 | autophagosome(GO:0005776) |
| 0.0 | 0.2 | GO:0005790 | smooth endoplasmic reticulum(GO:0005790) |
| 0.0 | 3.2 | GO:0010008 | endosome membrane(GO:0010008) |
| 0.0 | 0.1 | GO:1990131 | Gtr1-Gtr2 GTPase complex(GO:1990131) |
| 0.0 | 0.2 | GO:0000421 | autophagosome membrane(GO:0000421) |
| 0.0 | 0.1 | GO:0035061 | interchromatin granule(GO:0035061) |
| 0.0 | 0.1 | GO:0031209 | SCAR complex(GO:0031209) |
| 0.0 | 0.8 | GO:0031519 | PcG protein complex(GO:0031519) |
| 0.0 | 0.1 | GO:0000308 | cytoplasmic cyclin-dependent protein kinase holoenzyme complex(GO:0000308) |
Gene overrepresentation in molecular function category:
| Log-likelihood per target | Total log-likelihood | Term | Description |
|---|---|---|---|
| 3.9 | 11.8 | GO:0015389 | pyrimidine- and adenine-specific:sodium symporter activity(GO:0015389) |
| 3.5 | 14.1 | GO:0008336 | gamma-butyrobetaine dioxygenase activity(GO:0008336) |
| 2.8 | 8.5 | GO:0061629 | RNA polymerase II sequence-specific DNA binding transcription factor binding(GO:0061629) |
| 2.7 | 8.1 | GO:0070280 | glycine dehydrogenase (decarboxylating) activity(GO:0004375) oxidoreductase activity, acting on the CH-NH2 group of donors, disulfide as acceptor(GO:0016642) vitamin B6 binding(GO:0070279) pyridoxal binding(GO:0070280) |
| 2.6 | 7.7 | GO:0019785 | ISG15-specific protease activity(GO:0019785) |
| 2.3 | 9.0 | GO:0042132 | fructose 1,6-bisphosphate 1-phosphatase activity(GO:0042132) |
| 2.2 | 11.0 | GO:0070653 | high-density lipoprotein particle receptor binding(GO:0070653) |
| 1.9 | 11.4 | GO:0004505 | phenylalanine 4-monooxygenase activity(GO:0004505) |
| 1.9 | 7.5 | GO:0061769 | ribosylnicotinamide kinase activity(GO:0050262) ribosylnicotinate kinase activity(GO:0061769) |
| 1.8 | 5.5 | GO:0004411 | homogentisate 1,2-dioxygenase activity(GO:0004411) |
| 1.8 | 7.1 | GO:0004341 | gluconolactonase activity(GO:0004341) |
| 1.7 | 11.7 | GO:0004800 | thyroxine 5'-deiodinase activity(GO:0004800) |
| 1.6 | 4.7 | GO:0016652 | NAD(P)+ transhydrogenase activity(GO:0008746) oxidoreductase activity, acting on NAD(P)H, NAD(P) as acceptor(GO:0016652) |
| 1.5 | 6.1 | GO:0016838 | carbon-oxygen lyase activity, acting on phosphates(GO:0016838) |
| 1.5 | 29.2 | GO:0019911 | structural constituent of myelin sheath(GO:0019911) |
| 1.5 | 5.8 | GO:0060001 | minus-end directed microfilament motor activity(GO:0060001) |
| 1.4 | 7.0 | GO:0034875 | oxidoreductase activity, acting on CH or CH2 groups, quinone or similar compound as acceptor(GO:0033695) caffeine oxidase activity(GO:0034875) |
| 1.3 | 10.6 | GO:0004485 | methylcrotonoyl-CoA carboxylase activity(GO:0004485) |
| 1.3 | 3.9 | GO:0099530 | G-protein coupled receptor activity involved in regulation of postsynaptic membrane potential(GO:0099530) |
| 1.3 | 7.8 | GO:0015111 | iodide transmembrane transporter activity(GO:0015111) |
| 1.3 | 7.6 | GO:0050051 | leukotriene-B4 20-monooxygenase activity(GO:0050051) |
| 1.2 | 7.4 | GO:0060230 | lipoprotein lipase activator activity(GO:0060230) |
| 1.2 | 14.4 | GO:0015272 | ATP-activated inward rectifier potassium channel activity(GO:0015272) |
| 1.2 | 3.6 | GO:0046577 | long-chain-alcohol oxidase activity(GO:0046577) |
| 1.2 | 1.2 | GO:0070506 | high-density lipoprotein particle receptor activity(GO:0070506) |
| 1.2 | 3.5 | GO:0047635 | L-alanine:2-oxoglutarate aminotransferase activity(GO:0004021) alanine-oxo-acid transaminase activity(GO:0047635) |
| 1.1 | 4.4 | GO:0015141 | succinate transmembrane transporter activity(GO:0015141) |
| 1.1 | 5.5 | GO:0004447 | iodide peroxidase activity(GO:0004447) |
| 1.1 | 3.3 | GO:0004421 | hydroxymethylglutaryl-CoA synthase activity(GO:0004421) |
| 1.1 | 6.5 | GO:0004368 | glycerol-3-phosphate dehydrogenase activity(GO:0004368) oxidoreductase activity, acting on the CH-OH group of donors, quinone or similar compound as acceptor(GO:0016901) |
| 1.1 | 3.2 | GO:0086059 | voltage-gated calcium channel activity involved SA node cell action potential(GO:0086059) |
| 1.1 | 8.6 | GO:0004351 | glutamate decarboxylase activity(GO:0004351) |
| 1.1 | 4.2 | GO:0047946 | glutamine N-acyltransferase activity(GO:0047946) |
| 1.0 | 7.3 | GO:0016841 | ammonia-lyase activity(GO:0016841) |
| 1.0 | 13.4 | GO:0008142 | oxysterol binding(GO:0008142) |
| 1.0 | 10.2 | GO:0004687 | myosin light chain kinase activity(GO:0004687) |
| 1.0 | 4.0 | GO:0008513 | acetylcholine transmembrane transporter activity(GO:0005277) secondary active organic cation transmembrane transporter activity(GO:0008513) acetate ester transmembrane transporter activity(GO:1901375) |
| 1.0 | 15.1 | GO:0015501 | glutamate:sodium symporter activity(GO:0015501) |
| 1.0 | 4.0 | GO:0003858 | 3-hydroxybutyrate dehydrogenase activity(GO:0003858) |
| 1.0 | 3.0 | GO:0080130 | L-phenylalanine:2-oxoglutarate aminotransferase activity(GO:0080130) |
| 1.0 | 3.0 | GO:0036505 | prosaposin receptor activity(GO:0036505) |
| 1.0 | 3.8 | GO:0004733 | pyridoxamine-phosphate oxidase activity(GO:0004733) |
| 1.0 | 8.6 | GO:0015057 | thrombin receptor activity(GO:0015057) |
| 0.9 | 3.8 | GO:0046573 | lactonohydrolase activity(GO:0046573) acyl-L-homoserine-lactone lactonohydrolase activity(GO:0102007) |
| 0.9 | 4.7 | GO:0070404 | NADH binding(GO:0070404) |
| 0.9 | 7.4 | GO:0017060 | 3-galactosyl-N-acetylglucosaminide 4-alpha-L-fucosyltransferase activity(GO:0017060) |
| 0.9 | 0.9 | GO:0016419 | [acyl-carrier-protein] S-malonyltransferase activity(GO:0004314) S-malonyltransferase activity(GO:0016419) malonyltransferase activity(GO:0016420) |
| 0.9 | 19.2 | GO:0009931 | calcium-dependent protein serine/threonine kinase activity(GO:0009931) |
| 0.9 | 5.4 | GO:0030172 | troponin C binding(GO:0030172) |
| 0.9 | 3.6 | GO:0008431 | vitamin E binding(GO:0008431) |
| 0.9 | 3.6 | GO:0003974 | UDP-N-acetylglucosamine 4-epimerase activity(GO:0003974) UDP-glucose 4-epimerase activity(GO:0003978) |
| 0.9 | 3.5 | GO:0031716 | calcitonin receptor binding(GO:0031716) |
| 0.8 | 8.4 | GO:0050833 | pyruvate transmembrane transporter activity(GO:0050833) |
| 0.8 | 5.8 | GO:0086089 | voltage-gated potassium channel activity involved in atrial cardiac muscle cell action potential repolarization(GO:0086089) |
| 0.8 | 2.5 | GO:0033989 | 3alpha,7alpha,12alpha-trihydroxy-5beta-cholest-24-enoyl-CoA hydratase activity(GO:0033989) 17-beta-hydroxysteroid dehydrogenase (NAD+) activity(GO:0044594) |
| 0.8 | 2.5 | GO:0005308 | creatine transmembrane transporter activity(GO:0005308) |
| 0.8 | 2.4 | GO:0008294 | calcium- and calmodulin-responsive adenylate cyclase activity(GO:0008294) |
| 0.8 | 4.1 | GO:0048403 | brain-derived neurotrophic factor binding(GO:0048403) |
| 0.8 | 12.0 | GO:0008392 | arachidonic acid monooxygenase activity(GO:0008391) arachidonic acid epoxygenase activity(GO:0008392) |
| 0.8 | 2.4 | GO:0005199 | structural constituent of cell wall(GO:0005199) |
| 0.8 | 9.5 | GO:0031014 | troponin T binding(GO:0031014) |
| 0.8 | 3.9 | GO:0004668 | protein-arginine deiminase activity(GO:0004668) |
| 0.7 | 2.2 | GO:0004416 | hydroxyacylglutathione hydrolase activity(GO:0004416) |
| 0.7 | 3.7 | GO:0070991 | medium-chain-acyl-CoA dehydrogenase activity(GO:0070991) |
| 0.7 | 2.9 | GO:0003985 | acetyl-CoA C-acetyltransferase activity(GO:0003985) |
| 0.7 | 2.1 | GO:0004047 | aminomethyltransferase activity(GO:0004047) |
| 0.7 | 2.1 | GO:0003845 | 11-beta-hydroxysteroid dehydrogenase [NAD(P)] activity(GO:0003845) |
| 0.7 | 4.2 | GO:0042392 | sphingosine-1-phosphate phosphatase activity(GO:0042392) |
| 0.7 | 2.8 | GO:0004040 | amidase activity(GO:0004040) |
| 0.7 | 8.8 | GO:0052833 | inositol monophosphate 1-phosphatase activity(GO:0008934) inositol monophosphate 3-phosphatase activity(GO:0052832) inositol monophosphate 4-phosphatase activity(GO:0052833) inositol monophosphate phosphatase activity(GO:0052834) |
| 0.7 | 2.7 | GO:0004104 | acetylcholinesterase activity(GO:0003990) cholinesterase activity(GO:0004104) |
| 0.7 | 6.7 | GO:0005237 | inhibitory extracellular ligand-gated ion channel activity(GO:0005237) |
| 0.7 | 14.0 | GO:0005243 | gap junction channel activity(GO:0005243) |
| 0.7 | 2.0 | GO:0008892 | guanine deaminase activity(GO:0008892) |
| 0.7 | 7.3 | GO:0005280 | hydrogen:amino acid symporter activity(GO:0005280) |
| 0.7 | 12.6 | GO:0015467 | G-protein activated inward rectifier potassium channel activity(GO:0015467) |
| 0.7 | 2.0 | GO:0036055 | protein-malonyllysine demalonylase activity(GO:0036054) protein-succinyllysine desuccinylase activity(GO:0036055) protein-glutaryllysine deglutarylase activity(GO:0061697) |
| 0.6 | 6.5 | GO:0005332 | gamma-aminobutyric acid:sodium symporter activity(GO:0005332) gamma-aminobutyric acid transmembrane transporter activity(GO:0015185) |
| 0.6 | 1.9 | GO:0008480 | sarcosine dehydrogenase activity(GO:0008480) |
| 0.6 | 2.5 | GO:0070119 | ciliary neurotrophic factor binding(GO:0070119) |
| 0.6 | 1.3 | GO:0070890 | L-ascorbate:sodium symporter activity(GO:0008520) L-ascorbic acid transporter activity(GO:0015229) sodium-dependent L-ascorbate transmembrane transporter activity(GO:0070890) |
| 0.6 | 2.5 | GO:0051538 | 3 iron, 4 sulfur cluster binding(GO:0051538) |
| 0.6 | 1.9 | GO:0047322 | [hydroxymethylglutaryl-CoA reductase (NADPH)] kinase activity(GO:0047322) [acetyl-CoA carboxylase] kinase activity(GO:0050405) |
| 0.6 | 1.8 | GO:0004998 | transferrin receptor activity(GO:0004998) |
| 0.6 | 17.7 | GO:0102391 | decanoate--CoA ligase activity(GO:0102391) |
| 0.6 | 4.8 | GO:1990254 | keratin filament binding(GO:1990254) |
| 0.6 | 3.0 | GO:0033300 | dehydroascorbic acid transporter activity(GO:0033300) |
| 0.6 | 4.7 | GO:0004873 | asialoglycoprotein receptor activity(GO:0004873) |
| 0.6 | 2.4 | GO:0033265 | choline binding(GO:0033265) |
| 0.6 | 2.3 | GO:0070905 | serine binding(GO:0070905) |
| 0.6 | 6.9 | GO:0004634 | phosphopyruvate hydratase activity(GO:0004634) |
| 0.6 | 2.3 | GO:0061609 | fructose-1-phosphate aldolase activity(GO:0061609) |
| 0.6 | 2.3 | GO:0032440 | 2-alkenal reductase [NAD(P)] activity(GO:0032440) |
| 0.6 | 11.2 | GO:0042975 | peroxisome proliferator activated receptor binding(GO:0042975) |
| 0.6 | 15.0 | GO:0031432 | titin binding(GO:0031432) |
| 0.6 | 1.7 | GO:0072545 | tyrosine binding(GO:0072545) |
| 0.6 | 2.2 | GO:0001855 | complement component C4b binding(GO:0001855) |
| 0.6 | 2.2 | GO:0004142 | diacylglycerol cholinephosphotransferase activity(GO:0004142) phosphatidate cytidylyltransferase activity(GO:0004605) |
| 0.6 | 9.4 | GO:0004865 | protein serine/threonine phosphatase inhibitor activity(GO:0004865) |
| 0.5 | 3.3 | GO:0032038 | myosin II heavy chain binding(GO:0032038) |
| 0.5 | 4.8 | GO:0048039 | ubiquinone binding(GO:0048039) |
| 0.5 | 0.5 | GO:0005315 | inorganic phosphate transmembrane transporter activity(GO:0005315) |
| 0.5 | 2.6 | GO:0004357 | glutamate-cysteine ligase activity(GO:0004357) |
| 0.5 | 5.2 | GO:0086006 | voltage-gated sodium channel activity involved in cardiac muscle cell action potential(GO:0086006) |
| 0.5 | 3.1 | GO:0015307 | drug:proton antiporter activity(GO:0015307) |
| 0.5 | 6.7 | GO:0030976 | thiamine pyrophosphate binding(GO:0030976) |
| 0.5 | 3.6 | GO:0032145 | 4-aminobutyrate transaminase activity(GO:0003867) succinate-semialdehyde dehydrogenase binding(GO:0032145) (S)-3-amino-2-methylpropionate transaminase activity(GO:0047298) |
| 0.5 | 22.2 | GO:0004683 | calmodulin-dependent protein kinase activity(GO:0004683) |
| 0.5 | 2.0 | GO:0004306 | ethanolamine-phosphate cytidylyltransferase activity(GO:0004306) |
| 0.5 | 8.9 | GO:0038062 | protein tyrosine kinase collagen receptor activity(GO:0038062) |
| 0.5 | 1.5 | GO:0070538 | oleic acid binding(GO:0070538) |
| 0.5 | 12.2 | GO:0005247 | voltage-gated chloride channel activity(GO:0005247) |
| 0.5 | 4.4 | GO:0016713 | oxidoreductase activity, acting on paired donors, with incorporation or reduction of molecular oxygen, reduced iron-sulfur protein as one donor, and incorporation of one atom of oxygen(GO:0016713) |
| 0.5 | 4.8 | GO:0003835 | beta-galactoside alpha-2,6-sialyltransferase activity(GO:0003835) |
| 0.5 | 1.0 | GO:0031696 | alpha-2C adrenergic receptor binding(GO:0031696) |
| 0.5 | 7.2 | GO:0008970 | phosphatidylcholine 1-acylhydrolase activity(GO:0008970) |
| 0.5 | 2.4 | GO:0008506 | sucrose:proton symporter activity(GO:0008506) sucrose transmembrane transporter activity(GO:0008515) disaccharide transmembrane transporter activity(GO:0015154) oligosaccharide transmembrane transporter activity(GO:0015157) |
| 0.5 | 1.4 | GO:0070336 | flap-structured DNA binding(GO:0070336) |
| 0.5 | 4.7 | GO:0016416 | O-palmitoyltransferase activity(GO:0016416) |
| 0.5 | 1.9 | GO:0030492 | hemoglobin binding(GO:0030492) |
| 0.5 | 1.9 | GO:0016155 | formyltetrahydrofolate dehydrogenase activity(GO:0016155) |
| 0.5 | 1.8 | GO:0031687 | A2A adenosine receptor binding(GO:0031687) |
| 0.5 | 14.1 | GO:0045295 | gamma-catenin binding(GO:0045295) |
| 0.4 | 1.3 | GO:1901702 | urate transmembrane transporter activity(GO:0015143) salt transmembrane transporter activity(GO:1901702) |
| 0.4 | 1.3 | GO:0015322 | proton-dependent oligopeptide secondary active transmembrane transporter activity(GO:0005427) secondary active oligopeptide transmembrane transporter activity(GO:0015322) |
| 0.4 | 2.2 | GO:0046920 | alpha-(1->3)-fucosyltransferase activity(GO:0046920) |
| 0.4 | 9.3 | GO:0005391 | sodium:potassium-exchanging ATPase activity(GO:0005391) |
| 0.4 | 1.7 | GO:0015207 | ATP:ADP antiporter activity(GO:0005471) adenine transmembrane transporter activity(GO:0015207) |
| 0.4 | 1.3 | GO:1990699 | palmitoleyl hydrolase activity(GO:1990699) |
| 0.4 | 4.3 | GO:0030160 | GKAP/Homer scaffold activity(GO:0030160) |
| 0.4 | 1.7 | GO:0018271 | biotin-[acetyl-CoA-carboxylase] ligase activity(GO:0004077) biotin-[methylcrotonoyl-CoA-carboxylase] ligase activity(GO:0004078) biotin-[methylmalonyl-CoA-carboxytransferase] ligase activity(GO:0004079) biotin-[propionyl-CoA-carboxylase (ATP-hydrolyzing)] ligase activity(GO:0004080) biotin-protein ligase activity(GO:0018271) |
| 0.4 | 2.1 | GO:0050421 | oxidoreductase activity, acting on other nitrogenous compounds as donors, cytochrome as acceptor(GO:0016662) nitrite reductase (NO-forming) activity(GO:0050421) carbon monoxide binding(GO:0070025) nitrite reductase activity(GO:0098809) |
| 0.4 | 2.5 | GO:0008321 | Ral guanyl-nucleotide exchange factor activity(GO:0008321) |
| 0.4 | 8.0 | GO:0015280 | ligand-gated sodium channel activity(GO:0015280) |
| 0.4 | 1.3 | GO:0019166 | 2,4-dienoyl-CoA reductase (NADPH) activity(GO:0008670) trans-2-enoyl-CoA reductase (NADPH) activity(GO:0019166) |
| 0.4 | 34.4 | GO:0030507 | spectrin binding(GO:0030507) |
| 0.4 | 14.5 | GO:0071949 | FAD binding(GO:0071949) |
| 0.4 | 4.1 | GO:0005372 | water transmembrane transporter activity(GO:0005372) water channel activity(GO:0015250) |
| 0.4 | 9.4 | GO:0052629 | phosphatidylinositol-3,5-bisphosphate 3-phosphatase activity(GO:0052629) |
| 0.4 | 1.2 | GO:0004611 | phosphoenolpyruvate carboxykinase activity(GO:0004611) phosphoenolpyruvate carboxykinase (GTP) activity(GO:0004613) |
| 0.4 | 1.6 | GO:0030379 | neurotensin receptor activity, non-G-protein coupled(GO:0030379) |
| 0.4 | 1.6 | GO:0004419 | hydroxymethylglutaryl-CoA lyase activity(GO:0004419) |
| 0.4 | 0.8 | GO:0004052 | arachidonate 12-lipoxygenase activity(GO:0004052) |
| 0.4 | 1.6 | GO:0004937 | alpha1-adrenergic receptor activity(GO:0004937) |
| 0.4 | 1.6 | GO:0004452 | isopentenyl-diphosphate delta-isomerase activity(GO:0004452) |
| 0.4 | 16.7 | GO:0043560 | insulin receptor substrate binding(GO:0043560) |
| 0.4 | 6.3 | GO:0015386 | potassium:proton antiporter activity(GO:0015386) |
| 0.4 | 12.9 | GO:0044769 | ATPase activity, coupled to transmembrane movement of ions, rotational mechanism(GO:0044769) proton-transporting ATPase activity, rotational mechanism(GO:0046961) |
| 0.4 | 15.4 | GO:0000146 | microfilament motor activity(GO:0000146) |
| 0.4 | 1.2 | GO:0030156 | benzodiazepine receptor binding(GO:0030156) |
| 0.4 | 16.4 | GO:0015347 | sodium-independent organic anion transmembrane transporter activity(GO:0015347) |
| 0.4 | 1.9 | GO:0047374 | methylumbelliferyl-acetate deacetylase activity(GO:0047374) |
| 0.4 | 3.8 | GO:0004784 | superoxide dismutase activity(GO:0004784) oxidoreductase activity, acting on superoxide radicals as acceptor(GO:0016721) |
| 0.4 | 1.9 | GO:0047787 | delta4-3-oxosteroid 5beta-reductase activity(GO:0047787) |
| 0.4 | 1.1 | GO:0016503 | pheromone receptor activity(GO:0016503) |
| 0.4 | 2.9 | GO:0052796 | exo-alpha-(2->3)-sialidase activity(GO:0052794) exo-alpha-(2->6)-sialidase activity(GO:0052795) exo-alpha-(2->8)-sialidase activity(GO:0052796) |
| 0.4 | 5.9 | GO:0015321 | sodium-dependent phosphate transmembrane transporter activity(GO:0015321) |
| 0.4 | 1.5 | GO:0043812 | phosphatidylinositol-4-phosphate phosphatase activity(GO:0043812) |
| 0.4 | 1.1 | GO:0097604 | temperature-gated cation channel activity(GO:0097604) |
| 0.4 | 1.8 | GO:0017095 | heparan sulfate 6-O-sulfotransferase activity(GO:0017095) |
| 0.4 | 3.6 | GO:0005094 | Rho GDP-dissociation inhibitor activity(GO:0005094) |
| 0.4 | 10.4 | GO:0008242 | omega peptidase activity(GO:0008242) |
| 0.4 | 0.7 | GO:0004999 | vasoactive intestinal polypeptide receptor activity(GO:0004999) |
| 0.4 | 18.4 | GO:0015020 | glucuronosyltransferase activity(GO:0015020) |
| 0.4 | 1.4 | GO:0004001 | adenosine kinase activity(GO:0004001) |
| 0.4 | 5.3 | GO:0004321 | fatty-acyl-CoA synthase activity(GO:0004321) |
| 0.4 | 0.4 | GO:0045550 | geranylgeranyl reductase activity(GO:0045550) |
| 0.4 | 2.8 | GO:0004111 | creatine kinase activity(GO:0004111) |
| 0.4 | 1.1 | GO:0090555 | phosphatidylethanolamine-translocating ATPase activity(GO:0090555) |
| 0.3 | 1.4 | GO:0061714 | folic acid receptor activity(GO:0061714) |
| 0.3 | 6.3 | GO:0031433 | telethonin binding(GO:0031433) |
| 0.3 | 1.4 | GO:0008260 | 3-oxoacid CoA-transferase activity(GO:0008260) |
| 0.3 | 3.1 | GO:0016421 | CoA carboxylase activity(GO:0016421) |
| 0.3 | 2.1 | GO:0004706 | JUN kinase kinase kinase activity(GO:0004706) |
| 0.3 | 1.0 | GO:0008401 | retinoic acid 4-hydroxylase activity(GO:0008401) |
| 0.3 | 3.4 | GO:0042577 | lipid phosphatase activity(GO:0042577) |
| 0.3 | 0.7 | GO:0019238 | cyclohydrolase activity(GO:0019238) |
| 0.3 | 1.0 | GO:0004165 | dodecenoyl-CoA delta-isomerase activity(GO:0004165) |
| 0.3 | 4.3 | GO:0005416 | cation:amino acid symporter activity(GO:0005416) |
| 0.3 | 3.0 | GO:0051430 | corticotropin-releasing hormone receptor 1 binding(GO:0051430) |
| 0.3 | 3.0 | GO:0043237 | laminin-1 binding(GO:0043237) |
| 0.3 | 2.0 | GO:0015086 | cadmium ion transmembrane transporter activity(GO:0015086) cobalt ion transmembrane transporter activity(GO:0015087) lead ion transmembrane transporter activity(GO:0015094) ferrous iron uptake transmembrane transporter activity(GO:0015639) |
| 0.3 | 2.3 | GO:0008467 | [heparan sulfate]-glucosamine 3-sulfotransferase 1 activity(GO:0008467) |
| 0.3 | 3.3 | GO:0015038 | glutathione disulfide oxidoreductase activity(GO:0015038) |
| 0.3 | 5.6 | GO:0022851 | GABA-gated chloride ion channel activity(GO:0022851) |
| 0.3 | 4.6 | GO:0048406 | nerve growth factor binding(GO:0048406) |
| 0.3 | 1.3 | GO:0004022 | alcohol dehydrogenase (NAD) activity(GO:0004022) |
| 0.3 | 1.0 | GO:0016899 | oxidoreductase activity, acting on the CH-OH group of donors, oxygen as acceptor(GO:0016899) |
| 0.3 | 4.2 | GO:0052658 | inositol-1,4,5-trisphosphate 5-phosphatase activity(GO:0052658) |
| 0.3 | 6.7 | GO:0005523 | tropomyosin binding(GO:0005523) |
| 0.3 | 9.0 | GO:0050321 | tau-protein kinase activity(GO:0050321) |
| 0.3 | 6.4 | GO:0043125 | ErbB-3 class receptor binding(GO:0043125) |
| 0.3 | 2.5 | GO:0004996 | thyroid-stimulating hormone receptor activity(GO:0004996) |
| 0.3 | 1.3 | GO:0016495 | C-X3-C chemokine receptor activity(GO:0016495) |
| 0.3 | 1.6 | GO:0003839 | gamma-glutamylcyclotransferase activity(GO:0003839) |
| 0.3 | 0.9 | GO:0008502 | melatonin receptor activity(GO:0008502) |
| 0.3 | 0.6 | GO:0016406 | carnitine O-acyltransferase activity(GO:0016406) |
| 0.3 | 1.5 | GO:0032795 | heterotrimeric G-protein binding(GO:0032795) |
| 0.3 | 4.9 | GO:0019871 | sodium channel inhibitor activity(GO:0019871) |
| 0.3 | 1.5 | GO:0046538 | bisphosphoglycerate mutase activity(GO:0004082) phosphoglycerate mutase activity(GO:0004619) 2,3-bisphosphoglycerate-dependent phosphoglycerate mutase activity(GO:0046538) |
| 0.3 | 2.7 | GO:0015184 | L-cystine transmembrane transporter activity(GO:0015184) |
| 0.3 | 1.2 | GO:0008568 | microtubule-severing ATPase activity(GO:0008568) |
| 0.3 | 4.5 | GO:0005225 | volume-sensitive anion channel activity(GO:0005225) |
| 0.3 | 1.2 | GO:0008745 | N-acetylmuramoyl-L-alanine amidase activity(GO:0008745) |
| 0.3 | 1.2 | GO:0005136 | interleukin-4 receptor binding(GO:0005136) |
| 0.3 | 0.9 | GO:0033858 | N-acetylgalactosamine kinase activity(GO:0033858) |
| 0.3 | 5.6 | GO:0097016 | L27 domain binding(GO:0097016) |
| 0.3 | 8.5 | GO:0005229 | intracellular calcium activated chloride channel activity(GO:0005229) |
| 0.3 | 2.9 | GO:0003910 | DNA ligase (ATP) activity(GO:0003910) |
| 0.3 | 9.3 | GO:0044548 | S100 protein binding(GO:0044548) |
| 0.3 | 1.7 | GO:0004882 | androgen receptor activity(GO:0004882) |
| 0.3 | 8.4 | GO:0031698 | beta-2 adrenergic receptor binding(GO:0031698) |
| 0.3 | 0.6 | GO:0004315 | 3-oxoacyl-[acyl-carrier-protein] synthase activity(GO:0004315) |
| 0.3 | 1.1 | GO:0016716 | oxidoreductase activity, acting on paired donors, with incorporation or reduction of molecular oxygen, another compound as one donor, and incorporation of one atom of oxygen(GO:0016716) |
| 0.3 | 1.1 | GO:0036132 | 13-prostaglandin reductase activity(GO:0036132) 15-oxoprostaglandin 13-oxidase activity(GO:0047522) |
| 0.3 | 1.7 | GO:0003875 | ADP-ribosylarginine hydrolase activity(GO:0003875) |
| 0.3 | 4.0 | GO:0046975 | histone methyltransferase activity (H3-K36 specific)(GO:0046975) |
| 0.3 | 2.0 | GO:0000179 | rRNA (adenine-N6,N6-)-dimethyltransferase activity(GO:0000179) |
| 0.3 | 2.3 | GO:0016454 | serine C-palmitoyltransferase activity(GO:0004758) C-palmitoyltransferase activity(GO:0016454) |
| 0.3 | 2.2 | GO:0004046 | aminoacylase activity(GO:0004046) |
| 0.3 | 1.4 | GO:0048763 | calcium-induced calcium release activity(GO:0048763) |
| 0.3 | 0.3 | GO:0010857 | calcium-dependent protein kinase activity(GO:0010857) |
| 0.3 | 1.1 | GO:0099583 | neurotransmitter receptor activity involved in regulation of postsynaptic cytosolic calcium ion concentration(GO:0099583) |
| 0.3 | 4.4 | GO:0004971 | AMPA glutamate receptor activity(GO:0004971) |
| 0.3 | 6.3 | GO:0015095 | magnesium ion transmembrane transporter activity(GO:0015095) |
| 0.3 | 2.5 | GO:0047756 | chondroitin 4-sulfotransferase activity(GO:0047756) |
| 0.3 | 11.5 | GO:0008093 | cytoskeletal adaptor activity(GO:0008093) |
| 0.3 | 3.0 | GO:0016286 | small conductance calcium-activated potassium channel activity(GO:0016286) |
| 0.3 | 1.3 | GO:0004329 | formate-tetrahydrofolate ligase activity(GO:0004329) |
| 0.3 | 1.6 | GO:0015119 | hexose phosphate transmembrane transporter activity(GO:0015119) organophosphate:inorganic phosphate antiporter activity(GO:0015315) hexose-phosphate:inorganic phosphate antiporter activity(GO:0015526) glucose 6-phosphate:inorganic phosphate antiporter activity(GO:0061513) |
| 0.3 | 1.8 | GO:0030060 | L-malate dehydrogenase activity(GO:0030060) |
| 0.3 | 3.4 | GO:0004679 | AMP-activated protein kinase activity(GO:0004679) |
| 0.3 | 0.8 | GO:0008139 | nuclear localization sequence binding(GO:0008139) |
| 0.3 | 1.6 | GO:0042030 | ATPase inhibitor activity(GO:0042030) |
| 0.3 | 7.3 | GO:0016769 | transferase activity, transferring nitrogenous groups(GO:0016769) |
| 0.3 | 2.3 | GO:0034711 | inhibin binding(GO:0034711) |
| 0.3 | 7.0 | GO:0004143 | diacylglycerol kinase activity(GO:0004143) |
| 0.3 | 0.8 | GO:0008193 | tRNA guanylyltransferase activity(GO:0008193) |
| 0.3 | 0.8 | GO:0004336 | galactosylceramidase activity(GO:0004336) |
| 0.3 | 1.5 | GO:0070704 | C-5 sterol desaturase activity(GO:0000248) sterol desaturase activity(GO:0070704) |
| 0.3 | 0.8 | GO:0052642 | lysophosphatidic acid phosphatase activity(GO:0052642) |
| 0.3 | 39.0 | GO:0030276 | clathrin binding(GO:0030276) |
| 0.3 | 1.8 | GO:0015265 | urea channel activity(GO:0015265) |
| 0.3 | 2.8 | GO:0043533 | inositol 1,3,4,5 tetrakisphosphate binding(GO:0043533) |
| 0.3 | 0.8 | GO:0035375 | zymogen binding(GO:0035375) |
| 0.2 | 1.0 | GO:0042165 | neurotransmitter binding(GO:0042165) |
| 0.2 | 7.0 | GO:0005212 | structural constituent of eye lens(GO:0005212) |
| 0.2 | 1.5 | GO:0003986 | acetyl-CoA hydrolase activity(GO:0003986) |
| 0.2 | 1.5 | GO:0060228 | phosphatidylcholine-sterol O-acyltransferase activator activity(GO:0060228) |
| 0.2 | 0.7 | GO:0070326 | very-low-density lipoprotein particle receptor binding(GO:0070326) |
| 0.2 | 1.7 | GO:0016802 | adenosylhomocysteinase activity(GO:0004013) trialkylsulfonium hydrolase activity(GO:0016802) |
| 0.2 | 4.1 | GO:0004791 | thioredoxin-disulfide reductase activity(GO:0004791) |
| 0.2 | 2.9 | GO:0015037 | peptide disulfide oxidoreductase activity(GO:0015037) |
| 0.2 | 0.7 | GO:0008434 | calcitriol receptor activity(GO:0008434) lithocholic acid receptor activity(GO:0038186) calcitriol binding(GO:1902098) lithocholic acid binding(GO:1902121) |
| 0.2 | 1.2 | GO:0004572 | mannosyl-oligosaccharide 1,3-1,6-alpha-mannosidase activity(GO:0004572) |
| 0.2 | 6.9 | GO:0051537 | 2 iron, 2 sulfur cluster binding(GO:0051537) |
| 0.2 | 1.4 | GO:0004792 | thiosulfate sulfurtransferase activity(GO:0004792) |
| 0.2 | 1.0 | GO:0004852 | uroporphyrinogen-III synthase activity(GO:0004852) |
| 0.2 | 0.2 | GO:0005010 | insulin-like growth factor-activated receptor activity(GO:0005010) |
| 0.2 | 5.0 | GO:0030306 | ADP-ribosylation factor binding(GO:0030306) |
| 0.2 | 0.7 | GO:0050613 | delta14-sterol reductase activity(GO:0050613) |
| 0.2 | 1.4 | GO:0004647 | phosphoserine phosphatase activity(GO:0004647) |
| 0.2 | 1.9 | GO:0005497 | androgen binding(GO:0005497) |
| 0.2 | 0.9 | GO:0016639 | oxidoreductase activity, acting on the CH-NH2 group of donors, NAD or NADP as acceptor(GO:0016639) |
| 0.2 | 2.3 | GO:0008503 | benzodiazepine receptor activity(GO:0008503) |
| 0.2 | 3.3 | GO:0033691 | sialic acid binding(GO:0033691) |
| 0.2 | 0.9 | GO:0004113 | 2',3'-cyclic-nucleotide 3'-phosphodiesterase activity(GO:0004113) |
| 0.2 | 10.8 | GO:0005385 | zinc ion transmembrane transporter activity(GO:0005385) |
| 0.2 | 1.6 | GO:0048495 | Roundabout binding(GO:0048495) |
| 0.2 | 0.5 | GO:0019912 | cyclin-dependent protein kinase activating kinase activity(GO:0019912) |
| 0.2 | 2.3 | GO:0050682 | AF-2 domain binding(GO:0050682) |
| 0.2 | 0.9 | GO:0035241 | protein-arginine omega-N monomethyltransferase activity(GO:0035241) |
| 0.2 | 0.9 | GO:0099609 | microtubule lateral binding(GO:0099609) |
| 0.2 | 0.7 | GO:0033842 | N-acetyl-beta-glucosaminyl-glycoprotein 4-beta-N-acetylgalactosaminyltransferase activity(GO:0033842) |
| 0.2 | 1.8 | GO:0004468 | lysine N-acetyltransferase activity, acting on acetyl phosphate as donor(GO:0004468) |
| 0.2 | 0.7 | GO:0030366 | molybdopterin synthase activity(GO:0030366) |
| 0.2 | 1.8 | GO:0031849 | olfactory receptor binding(GO:0031849) |
| 0.2 | 0.7 | GO:0003826 | alpha-ketoacid dehydrogenase activity(GO:0003826) 3-methyl-2-oxobutanoate dehydrogenase (2-methylpropanoyl-transferring) activity(GO:0003863) |
| 0.2 | 4.9 | GO:0016878 | acid-thiol ligase activity(GO:0016878) |
| 0.2 | 7.7 | GO:0034237 | protein kinase A regulatory subunit binding(GO:0034237) |
| 0.2 | 0.7 | GO:0033862 | UMP kinase activity(GO:0033862) |
| 0.2 | 0.9 | GO:0047134 | protein-disulfide reductase activity(GO:0047134) |
| 0.2 | 1.3 | GO:0005502 | 11-cis retinal binding(GO:0005502) |
| 0.2 | 1.1 | GO:0004348 | glucosylceramidase activity(GO:0004348) |
| 0.2 | 1.3 | GO:0047894 | flavonol 3-sulfotransferase activity(GO:0047894) |
| 0.2 | 1.3 | GO:0004965 | G-protein coupled GABA receptor activity(GO:0004965) |
| 0.2 | 1.9 | GO:0034603 | pyruvate dehydrogenase activity(GO:0004738) pyruvate dehydrogenase [NAD(P)+] activity(GO:0034603) pyruvate dehydrogenase (NAD+) activity(GO:0034604) |
| 0.2 | 1.1 | GO:0004991 | parathyroid hormone receptor activity(GO:0004991) |
| 0.2 | 1.3 | GO:0102008 | cytosolic dipeptidase activity(GO:0102008) |
| 0.2 | 6.4 | GO:0022848 | acetylcholine-gated cation channel activity(GO:0022848) |
| 0.2 | 0.8 | GO:0004925 | prolactin receptor activity(GO:0004925) |
| 0.2 | 2.1 | GO:0005412 | glucose:sodium symporter activity(GO:0005412) |
| 0.2 | 3.1 | GO:0005007 | fibroblast growth factor-activated receptor activity(GO:0005007) |
| 0.2 | 0.6 | GO:0016263 | glycoprotein-N-acetylgalactosamine 3-beta-galactosyltransferase activity(GO:0016263) |
| 0.2 | 0.4 | GO:0015349 | thyroid hormone transmembrane transporter activity(GO:0015349) |
| 0.2 | 1.4 | GO:0015199 | amino-acid betaine transmembrane transporter activity(GO:0015199) carnitine transmembrane transporter activity(GO:0015226) |
| 0.2 | 11.8 | GO:0050136 | NADH dehydrogenase (ubiquinone) activity(GO:0008137) NADH dehydrogenase (quinone) activity(GO:0050136) |
| 0.2 | 11.2 | GO:0030676 | Rac guanyl-nucleotide exchange factor activity(GO:0030676) |
| 0.2 | 1.6 | GO:0004359 | glutaminase activity(GO:0004359) |
| 0.2 | 0.4 | GO:0045504 | dynein heavy chain binding(GO:0045504) |
| 0.2 | 1.6 | GO:0045134 | uridine-diphosphatase activity(GO:0045134) |
| 0.2 | 0.6 | GO:0098640 | integrin binding involved in cell-matrix adhesion(GO:0098640) |
| 0.2 | 1.6 | GO:0004514 | nicotinate-nucleotide diphosphorylase (carboxylating) activity(GO:0004514) |
| 0.2 | 1.0 | GO:0004886 | 9-cis retinoic acid receptor activity(GO:0004886) |
| 0.2 | 1.8 | GO:0008109 | N-acetyllactosaminide beta-1,6-N-acetylglucosaminyltransferase activity(GO:0008109) |
| 0.2 | 1.6 | GO:0000064 | L-ornithine transmembrane transporter activity(GO:0000064) |
| 0.2 | 4.3 | GO:0047617 | acyl-CoA hydrolase activity(GO:0047617) |
| 0.2 | 32.1 | GO:0004867 | serine-type endopeptidase inhibitor activity(GO:0004867) |
| 0.2 | 1.2 | GO:0046870 | cadmium ion binding(GO:0046870) |
| 0.2 | 1.6 | GO:0019215 | intermediate filament binding(GO:0019215) |
| 0.2 | 12.3 | GO:0005504 | fatty acid binding(GO:0005504) |
| 0.2 | 1.4 | GO:0004300 | enoyl-CoA hydratase activity(GO:0004300) |
| 0.2 | 9.3 | GO:0004033 | aldo-keto reductase (NADP) activity(GO:0004033) |
| 0.2 | 7.0 | GO:0030506 | ankyrin binding(GO:0030506) |
| 0.2 | 0.4 | GO:0016885 | ligase activity, forming carbon-carbon bonds(GO:0016885) |
| 0.2 | 0.6 | GO:0071566 | UFM1 activating enzyme activity(GO:0071566) |
| 0.2 | 0.8 | GO:0008427 | calcium-dependent protein kinase inhibitor activity(GO:0008427) |
| 0.2 | 15.9 | GO:0019894 | kinesin binding(GO:0019894) |
| 0.2 | 0.8 | GO:0038047 | beta-endorphin receptor activity(GO:0004979) morphine receptor activity(GO:0038047) |
| 0.2 | 1.1 | GO:0004427 | inorganic diphosphatase activity(GO:0004427) |
| 0.2 | 1.1 | GO:0004740 | pyruvate dehydrogenase (acetyl-transferring) kinase activity(GO:0004740) |
| 0.2 | 0.6 | GO:0050692 | DBD domain binding(GO:0050692) |
| 0.2 | 0.9 | GO:0052798 | beta-galactoside alpha-2,3-sialyltransferase activity(GO:0052798) |
| 0.2 | 0.7 | GO:0098519 | nucleotide phosphatase activity, acting on free nucleotides(GO:0098519) |
| 0.2 | 0.6 | GO:0004815 | aspartate-tRNA ligase activity(GO:0004815) aspartate-tRNA(Asn) ligase activity(GO:0050560) |
| 0.2 | 0.9 | GO:0008517 | folic acid transporter activity(GO:0008517) |
| 0.2 | 2.7 | GO:0015194 | L-serine transmembrane transporter activity(GO:0015194) serine transmembrane transporter activity(GO:0022889) |
| 0.2 | 1.6 | GO:0004176 | ATP-dependent peptidase activity(GO:0004176) |
| 0.2 | 1.8 | GO:0003857 | 3-hydroxyacyl-CoA dehydrogenase activity(GO:0003857) |
| 0.2 | 2.5 | GO:0102336 | fatty acid elongase activity(GO:0009922) 3-oxo-arachidoyl-CoA synthase activity(GO:0102336) 3-oxo-cerotoyl-CoA synthase activity(GO:0102337) 3-oxo-lignoceronyl-CoA synthase activity(GO:0102338) |
| 0.2 | 0.9 | GO:0003828 | alpha-N-acetylneuraminate alpha-2,8-sialyltransferase activity(GO:0003828) |
| 0.2 | 0.4 | GO:0015140 | malate transmembrane transporter activity(GO:0015140) |
| 0.2 | 2.5 | GO:0004118 | cGMP-stimulated cyclic-nucleotide phosphodiesterase activity(GO:0004118) |
| 0.2 | 2.8 | GO:0008179 | adenylate cyclase binding(GO:0008179) |
| 0.2 | 2.5 | GO:0034452 | dynactin binding(GO:0034452) |
| 0.2 | 0.5 | GO:0004056 | argininosuccinate lyase activity(GO:0004056) |
| 0.2 | 1.4 | GO:0001849 | complement component C1q binding(GO:0001849) |
| 0.2 | 0.5 | GO:0031626 | beta-endorphin binding(GO:0031626) |
| 0.2 | 1.7 | GO:0015464 | acetylcholine receptor activity(GO:0015464) |
| 0.2 | 2.1 | GO:0098599 | palmitoyl-(protein) hydrolase activity(GO:0008474) palmitoyl hydrolase activity(GO:0098599) |
| 0.2 | 0.9 | GO:0005499 | vitamin D binding(GO:0005499) |
| 0.2 | 2.0 | GO:0090599 | alpha-glucosidase activity(GO:0090599) |
| 0.2 | 0.5 | GO:1990175 | EH domain binding(GO:1990175) |
| 0.2 | 1.0 | GO:0005105 | type 1 fibroblast growth factor receptor binding(GO:0005105) |
| 0.2 | 4.9 | GO:0008510 | sodium:bicarbonate symporter activity(GO:0008510) |
| 0.2 | 0.5 | GO:0032090 | Pyrin domain binding(GO:0032090) |
| 0.2 | 0.7 | GO:0003865 | 3-oxo-5-alpha-steroid 4-dehydrogenase activity(GO:0003865) steroid dehydrogenase activity, acting on the CH-CH group of donors(GO:0033765) cholestenone 5-alpha-reductase activity(GO:0047751) |
| 0.2 | 0.7 | GO:1904492 | Ac-Asp-Glu binding(GO:1904492) tetrahydrofolyl-poly(glutamate) polymer binding(GO:1904493) |
| 0.2 | 0.5 | GO:0043262 | adenosine-diphosphatase activity(GO:0043262) |
| 0.2 | 5.8 | GO:0008301 | DNA binding, bending(GO:0008301) |
| 0.2 | 1.3 | GO:0008172 | S-methyltransferase activity(GO:0008172) |
| 0.2 | 8.1 | GO:0022839 | ion gated channel activity(GO:0022839) |
| 0.2 | 0.5 | GO:0051377 | mannose-ethanolamine phosphotransferase activity(GO:0051377) |
| 0.2 | 0.8 | GO:0047273 | galactosylgalactosylglucosylceramide beta-D-acetylgalactosaminyltransferase activity(GO:0047273) |
| 0.2 | 1.0 | GO:0016748 | succinyltransferase activity(GO:0016748) |
| 0.2 | 2.1 | GO:0050694 | galactosylceramide sulfotransferase activity(GO:0001733) galactose 3-O-sulfotransferase activity(GO:0050694) |
| 0.2 | 0.5 | GO:0046970 | NAD-dependent histone deacetylase activity (H4-K16 specific)(GO:0046970) |
| 0.2 | 1.9 | GO:0004457 | lactate dehydrogenase activity(GO:0004457) |
| 0.2 | 1.0 | GO:1902444 | riboflavin binding(GO:1902444) |
| 0.2 | 1.6 | GO:0047499 | calcium-independent phospholipase A2 activity(GO:0047499) |
| 0.2 | 15.4 | GO:0016765 | transferase activity, transferring alkyl or aryl (other than methyl) groups(GO:0016765) |
| 0.2 | 0.9 | GO:0003998 | acylphosphatase activity(GO:0003998) |
| 0.2 | 0.5 | GO:0034416 | bisphosphoglycerate phosphatase activity(GO:0034416) |
| 0.2 | 1.3 | GO:0008121 | ubiquinol-cytochrome-c reductase activity(GO:0008121) oxidoreductase activity, acting on diphenols and related substances as donors, cytochrome as acceptor(GO:0016681) |
| 0.2 | 0.2 | GO:0005415 | nucleoside:sodium symporter activity(GO:0005415) |
| 0.2 | 0.5 | GO:0005368 | taurine transmembrane transporter activity(GO:0005368) taurine:sodium symporter activity(GO:0005369) |
| 0.2 | 0.8 | GO:0042781 | 3'-tRNA processing endoribonuclease activity(GO:0042781) |
| 0.2 | 0.6 | GO:0047006 | 17-alpha,20-alpha-dihydroxypregn-4-en-3-one dehydrogenase activity(GO:0047006) |
| 0.2 | 1.8 | GO:0008312 | 7S RNA binding(GO:0008312) |
| 0.2 | 1.2 | GO:0004305 | ethanolamine kinase activity(GO:0004305) |
| 0.2 | 0.9 | GO:0004833 | tryptophan 2,3-dioxygenase activity(GO:0004833) |
| 0.2 | 0.9 | GO:0005353 | fructose transmembrane transporter activity(GO:0005353) |
| 0.2 | 1.8 | GO:0004726 | non-membrane spanning protein tyrosine phosphatase activity(GO:0004726) |
| 0.1 | 1.3 | GO:0003846 | 2-acylglycerol O-acyltransferase activity(GO:0003846) |
| 0.1 | 1.3 | GO:0001517 | N-acetylglucosamine 6-O-sulfotransferase activity(GO:0001517) |
| 0.1 | 0.4 | GO:0004750 | ribulose-phosphate 3-epimerase activity(GO:0004750) |
| 0.1 | 1.5 | GO:0034046 | poly(G) binding(GO:0034046) |
| 0.1 | 1.3 | GO:0030882 | lipid antigen binding(GO:0030882) endogenous lipid antigen binding(GO:0030883) exogenous lipid antigen binding(GO:0030884) |
| 0.1 | 0.9 | GO:0046899 | nucleoside triphosphate adenylate kinase activity(GO:0046899) |
| 0.1 | 1.5 | GO:0033857 | diphosphoinositol-pentakisphosphate kinase activity(GO:0033857) |
| 0.1 | 1.2 | GO:0008853 | exodeoxyribonuclease III activity(GO:0008853) |
| 0.1 | 0.4 | GO:0003880 | protein C-terminal carboxyl O-methyltransferase activity(GO:0003880) |
| 0.1 | 1.0 | GO:0086083 | cell adhesive protein binding involved in bundle of His cell-Purkinje myocyte communication(GO:0086083) |
| 0.1 | 0.3 | GO:0000104 | succinate dehydrogenase activity(GO:0000104) |
| 0.1 | 2.5 | GO:0097493 | structural molecule activity conferring elasticity(GO:0097493) |
| 0.1 | 1.9 | GO:0004985 | opioid receptor activity(GO:0004985) |
| 0.1 | 1.4 | GO:0008308 | voltage-gated anion channel activity(GO:0008308) |
| 0.1 | 0.6 | GO:0005011 | macrophage colony-stimulating factor receptor activity(GO:0005011) |
| 0.1 | 0.7 | GO:0016822 | hydrolase activity, acting on acid carbon-carbon bonds(GO:0016822) hydrolase activity, acting on acid carbon-carbon bonds, in ketonic substances(GO:0016823) |
| 0.1 | 1.0 | GO:0016427 | tRNA (cytosine) methyltransferase activity(GO:0016427) |
| 0.1 | 21.1 | GO:0030165 | PDZ domain binding(GO:0030165) |
| 0.1 | 0.3 | GO:0047025 | 3-oxoacyl-[acyl-carrier-protein] reductase (NADH) activity(GO:0047025) |
| 0.1 | 0.6 | GO:0047223 | beta-1,3-galactosyl-O-glycosyl-glycoprotein beta-1,3-N-acetylglucosaminyltransferase activity(GO:0047223) |
| 0.1 | 2.5 | GO:0004062 | aryl sulfotransferase activity(GO:0004062) |
| 0.1 | 0.7 | GO:0004910 | interleukin-1, Type II, blocking receptor activity(GO:0004910) |
| 0.1 | 0.7 | GO:0032181 | double-strand/single-strand DNA junction binding(GO:0000406) dinucleotide repeat insertion binding(GO:0032181) |
| 0.1 | 0.7 | GO:0070579 | methylcytosine dioxygenase activity(GO:0070579) |
| 0.1 | 0.1 | GO:1904713 | beta-catenin destruction complex binding(GO:1904713) |
| 0.1 | 1.4 | GO:0017176 | phosphatidylinositol N-acetylglucosaminyltransferase activity(GO:0017176) |
| 0.1 | 0.7 | GO:0050254 | rhodopsin kinase activity(GO:0050254) |
| 0.1 | 1.6 | GO:0070569 | uridylyltransferase activity(GO:0070569) |
| 0.1 | 0.4 | GO:0099580 | ion antiporter activity involved in regulation of postsynaptic membrane potential(GO:0099580) |
| 0.1 | 0.8 | GO:0031735 | CCR10 chemokine receptor binding(GO:0031735) |
| 0.1 | 1.3 | GO:0017040 | ceramidase activity(GO:0017040) |
| 0.1 | 1.3 | GO:0071855 | neuropeptide receptor binding(GO:0071855) |
| 0.1 | 0.8 | GO:0008113 | peptide-methionine (S)-S-oxide reductase activity(GO:0008113) |
| 0.1 | 2.6 | GO:0016709 | oxidoreductase activity, acting on paired donors, with incorporation or reduction of molecular oxygen, NAD(P)H as one donor, and incorporation of one atom of oxygen(GO:0016709) |
| 0.1 | 4.3 | GO:0031489 | myosin V binding(GO:0031489) |
| 0.1 | 2.5 | GO:0047372 | acylglycerol lipase activity(GO:0047372) |
| 0.1 | 1.8 | GO:0005132 | type I interferon receptor binding(GO:0005132) |
| 0.1 | 0.4 | GO:0015222 | serotonin transmembrane transporter activity(GO:0015222) |
| 0.1 | 0.5 | GO:0016714 | oxidoreductase activity, acting on paired donors, with incorporation or reduction of molecular oxygen, reduced pteridine as one donor, and incorporation of one atom of oxygen(GO:0016714) |
| 0.1 | 0.6 | GO:0003963 | RNA-3'-phosphate cyclase activity(GO:0003963) |
| 0.1 | 1.5 | GO:0043176 | amine binding(GO:0043176) serotonin binding(GO:0051378) |
| 0.1 | 0.5 | GO:0022865 | transmembrane electron transfer carrier(GO:0022865) |
| 0.1 | 0.5 | GO:0001588 | dopamine neurotransmitter receptor activity, coupled via Gs(GO:0001588) |
| 0.1 | 2.3 | GO:0005542 | folic acid binding(GO:0005542) |
| 0.1 | 1.3 | GO:0022850 | serotonin-gated cation channel activity(GO:0022850) |
| 0.1 | 3.1 | GO:0016646 | oxidoreductase activity, acting on the CH-NH group of donors, NAD or NADP as acceptor(GO:0016646) |
| 0.1 | 0.9 | GO:0030144 | alpha-1,6-mannosylglycoprotein 6-beta-N-acetylglucosaminyltransferase activity(GO:0030144) |
| 0.1 | 0.5 | GO:0004466 | long-chain-acyl-CoA dehydrogenase activity(GO:0004466) |
| 0.1 | 0.4 | GO:1904854 | proteasome core complex binding(GO:1904854) |
| 0.1 | 0.7 | GO:0004741 | [pyruvate dehydrogenase (lipoamide)] phosphatase activity(GO:0004741) |
| 0.1 | 3.1 | GO:0008527 | taste receptor activity(GO:0008527) |
| 0.1 | 0.2 | GO:0031893 | vasopressin receptor binding(GO:0031893) |
| 0.1 | 0.8 | GO:0102344 | 3-hydroxy-behenoyl-CoA dehydratase activity(GO:0102344) 3-hydroxy-lignoceroyl-CoA dehydratase activity(GO:0102345) |
| 0.1 | 0.2 | GO:0048273 | mitogen-activated protein kinase p38 binding(GO:0048273) |
| 0.1 | 0.5 | GO:0016979 | lipoate-protein ligase activity(GO:0016979) |
| 0.1 | 0.6 | GO:0016434 | rRNA (cytosine) methyltransferase activity(GO:0016434) |
| 0.1 | 4.9 | GO:0051959 | dynein light intermediate chain binding(GO:0051959) |
| 0.1 | 1.6 | GO:0019966 | interleukin-1 binding(GO:0019966) |
| 0.1 | 0.9 | GO:0005222 | intracellular cAMP activated cation channel activity(GO:0005222) |
| 0.1 | 0.7 | GO:0050436 | microfibril binding(GO:0050436) |
| 0.1 | 11.6 | GO:0003777 | microtubule motor activity(GO:0003777) |
| 0.1 | 0.8 | GO:0016174 | NAD(P)H oxidase activity(GO:0016174) |
| 0.1 | 0.8 | GO:0016655 | oxidoreductase activity, acting on NAD(P)H, quinone or similar compound as acceptor(GO:0016655) |
| 0.1 | 1.0 | GO:0005052 | peroxisome matrix targeting signal-1 binding(GO:0005052) |
| 0.1 | 0.3 | GO:0000247 | C-8 sterol isomerase activity(GO:0000247) |
| 0.1 | 2.9 | GO:0022840 | leak channel activity(GO:0022840) narrow pore channel activity(GO:0022842) |
| 0.1 | 1.1 | GO:0046974 | histone methyltransferase activity (H3-K9 specific)(GO:0046974) |
| 0.1 | 0.8 | GO:0070679 | inositol 1,4,5 trisphosphate binding(GO:0070679) |
| 0.1 | 1.1 | GO:0003995 | acyl-CoA dehydrogenase activity(GO:0003995) |
| 0.1 | 0.6 | GO:0004347 | glucose-6-phosphate isomerase activity(GO:0004347) |
| 0.1 | 0.4 | GO:0005462 | UDP-N-acetylglucosamine transmembrane transporter activity(GO:0005462) |
| 0.1 | 0.7 | GO:0032422 | purine-rich negative regulatory element binding(GO:0032422) |
| 0.1 | 1.3 | GO:0016628 | oxidoreductase activity, acting on the CH-CH group of donors, NAD or NADP as acceptor(GO:0016628) |
| 0.1 | 1.0 | GO:0008889 | glycerophosphodiester phosphodiesterase activity(GO:0008889) |
| 0.1 | 0.3 | GO:0004832 | valine-tRNA ligase activity(GO:0004832) |
| 0.1 | 2.7 | GO:0004708 | MAP kinase kinase activity(GO:0004708) |
| 0.1 | 4.3 | GO:0035255 | ionotropic glutamate receptor binding(GO:0035255) |
| 0.1 | 3.3 | GO:0005003 | ephrin receptor activity(GO:0005003) |
| 0.1 | 1.4 | GO:0070330 | aromatase activity(GO:0070330) |
| 0.1 | 0.6 | GO:0035242 | protein-arginine omega-N asymmetric methyltransferase activity(GO:0035242) |
| 0.1 | 5.1 | GO:0003785 | actin monomer binding(GO:0003785) |
| 0.1 | 0.2 | GO:0051120 | hepoxilin A3 synthase activity(GO:0051120) |
| 0.1 | 0.6 | GO:0004530 | deoxyribonuclease I activity(GO:0004530) |
| 0.1 | 0.6 | GO:0061649 | ubiquitinated histone binding(GO:0061649) |
| 0.1 | 0.3 | GO:0005169 | neurotrophin TRKB receptor binding(GO:0005169) |
| 0.1 | 2.3 | GO:0001161 | intronic transcription regulatory region sequence-specific DNA binding(GO:0001161) intronic transcription regulatory region DNA binding(GO:0044213) |
| 0.1 | 1.5 | GO:0000062 | fatty-acyl-CoA binding(GO:0000062) |
| 0.1 | 1.3 | GO:0004705 | JUN kinase activity(GO:0004705) SAP kinase activity(GO:0016909) |
| 0.1 | 0.6 | GO:0033188 | sphingomyelin synthase activity(GO:0033188) ceramide cholinephosphotransferase activity(GO:0047493) |
| 0.1 | 0.6 | GO:0001594 | trace-amine receptor activity(GO:0001594) |
| 0.1 | 1.1 | GO:0008020 | G-protein coupled photoreceptor activity(GO:0008020) |
| 0.1 | 0.5 | GO:0072345 | NAADP-sensitive calcium-release channel activity(GO:0072345) |
| 0.1 | 1.7 | GO:0016917 | GABA receptor activity(GO:0016917) |
| 0.1 | 1.0 | GO:0019784 | NEDD8-specific protease activity(GO:0019784) |
| 0.1 | 0.4 | GO:1904455 | ubiquitin-specific protease activity involved in negative regulation of ERAD pathway(GO:1904455) |
| 0.1 | 0.9 | GO:0016842 | amidine-lyase activity(GO:0016842) |
| 0.1 | 0.6 | GO:0003920 | GMP reductase activity(GO:0003920) oxidoreductase activity, acting on NAD(P)H, nitrogenous group as acceptor(GO:0016657) |
| 0.1 | 0.3 | GO:0047012 | C-3 sterol dehydrogenase (C-4 sterol decarboxylase) activity(GO:0000252) sterol-4-alpha-carboxylate 3-dehydrogenase (decarboxylating) activity(GO:0047012) |
| 0.1 | 2.1 | GO:0030215 | semaphorin receptor binding(GO:0030215) |
| 0.1 | 0.3 | GO:0043849 | Ras palmitoyltransferase activity(GO:0043849) |
| 0.1 | 0.2 | GO:0036361 | racemase and epimerase activity, acting on amino acids and derivatives(GO:0016855) racemase activity, acting on amino acids and derivatives(GO:0036361) amino-acid racemase activity(GO:0047661) |
| 0.1 | 0.8 | GO:0009019 | tRNA (guanine-N1-)-methyltransferase activity(GO:0009019) |
| 0.1 | 0.4 | GO:0016165 | linoleate 13S-lipoxygenase activity(GO:0016165) |
| 0.1 | 0.5 | GO:0016520 | growth hormone-releasing hormone receptor activity(GO:0016520) |
| 0.1 | 0.5 | GO:0050816 | phosphothreonine binding(GO:0050816) |
| 0.1 | 3.1 | GO:0015175 | neutral amino acid transmembrane transporter activity(GO:0015175) |
| 0.1 | 0.5 | GO:0047045 | testosterone 17-beta-dehydrogenase (NADP+) activity(GO:0047045) |
| 0.1 | 0.3 | GO:0004615 | phosphomannomutase activity(GO:0004615) |
| 0.1 | 0.5 | GO:0016404 | 15-hydroxyprostaglandin dehydrogenase (NAD+) activity(GO:0016404) |
| 0.1 | 0.6 | GO:0004809 | tRNA (guanine-N2-)-methyltransferase activity(GO:0004809) |
| 0.1 | 0.7 | GO:0004966 | galanin receptor activity(GO:0004966) |
| 0.1 | 0.9 | GO:0089720 | caspase binding(GO:0089720) |
| 0.1 | 0.7 | GO:0055131 | C3HC4-type RING finger domain binding(GO:0055131) |
| 0.1 | 0.5 | GO:0001026 | TFIIIB-type transcription factor activity(GO:0001026) |
| 0.1 | 0.5 | GO:0015183 | L-aspartate transmembrane transporter activity(GO:0015183) |
| 0.1 | 0.4 | GO:0042978 | ornithine decarboxylase activator activity(GO:0042978) |
| 0.1 | 3.5 | GO:0016836 | hydro-lyase activity(GO:0016836) |
| 0.1 | 1.1 | GO:0004767 | sphingomyelin phosphodiesterase activity(GO:0004767) |
| 0.1 | 0.3 | GO:0000035 | acyl binding(GO:0000035) |
| 0.1 | 0.1 | GO:0030549 | acetylcholine receptor activator activity(GO:0030549) |
| 0.1 | 2.2 | GO:0005545 | 1-phosphatidylinositol binding(GO:0005545) |
| 0.1 | 0.3 | GO:0048040 | UDP-glucuronate decarboxylase activity(GO:0048040) |
| 0.1 | 0.7 | GO:0016846 | carbon-sulfur lyase activity(GO:0016846) |
| 0.1 | 0.5 | GO:0051731 | polynucleotide 5'-hydroxyl-kinase activity(GO:0051731) |
| 0.1 | 1.8 | GO:0030955 | potassium ion binding(GO:0030955) |
| 0.1 | 0.3 | GO:0043546 | molybdopterin cofactor binding(GO:0043546) |
| 0.1 | 0.2 | GO:0044020 | histone methyltransferase activity (H4-R3 specific)(GO:0044020) |
| 0.1 | 0.9 | GO:0004645 | phosphorylase activity(GO:0004645) |
| 0.1 | 3.5 | GO:0005001 | transmembrane receptor protein tyrosine phosphatase activity(GO:0005001) transmembrane receptor protein phosphatase activity(GO:0019198) |
| 0.1 | 0.7 | GO:0005250 | A-type (transient outward) potassium channel activity(GO:0005250) |
| 0.1 | 0.6 | GO:1900750 | oligopeptide binding(GO:1900750) |
| 0.1 | 0.1 | GO:0004339 | glucan 1,4-alpha-glucosidase activity(GO:0004339) |
| 0.1 | 2.4 | GO:0017075 | syntaxin-1 binding(GO:0017075) |
| 0.1 | 0.3 | GO:0004513 | neolactotetraosylceramide alpha-2,3-sialyltransferase activity(GO:0004513) lactosylceramide alpha-2,3-sialyltransferase activity(GO:0047291) |
| 0.1 | 0.5 | GO:0003854 | 3-beta-hydroxy-delta5-steroid dehydrogenase activity(GO:0003854) |
| 0.1 | 0.6 | GO:0004035 | alkaline phosphatase activity(GO:0004035) |
| 0.1 | 1.1 | GO:0045499 | chemorepellent activity(GO:0045499) |
| 0.1 | 3.6 | GO:0005086 | ARF guanyl-nucleotide exchange factor activity(GO:0005086) |
| 0.1 | 0.6 | GO:0035368 | selenocysteine insertion sequence binding(GO:0035368) |
| 0.1 | 0.6 | GO:0002114 | interleukin-33 receptor activity(GO:0002114) |
| 0.1 | 0.2 | GO:0004584 | dolichyl-phosphate-mannose-glycolipid alpha-mannosyltransferase activity(GO:0004584) |
| 0.1 | 0.3 | GO:0008476 | protein-tyrosine sulfotransferase activity(GO:0008476) |
| 0.1 | 0.2 | GO:0042731 | PH domain binding(GO:0042731) |
| 0.1 | 4.7 | GO:0004864 | protein phosphatase inhibitor activity(GO:0004864) |
| 0.1 | 1.5 | GO:0001055 | RNA polymerase II activity(GO:0001055) |
| 0.1 | 13.8 | GO:0005200 | structural constituent of cytoskeleton(GO:0005200) |
| 0.1 | 0.5 | GO:0004749 | ribose phosphate diphosphokinase activity(GO:0004749) |
| 0.1 | 0.5 | GO:0004977 | melanocortin receptor activity(GO:0004977) |
| 0.1 | 0.2 | GO:0016886 | ligase activity, forming phosphoric ester bonds(GO:0016886) |
| 0.1 | 2.1 | GO:0017081 | chloride channel regulator activity(GO:0017081) |
| 0.1 | 0.4 | GO:0008607 | phosphorylase kinase regulator activity(GO:0008607) |
| 0.1 | 0.6 | GO:0015165 | pyrimidine nucleotide-sugar transmembrane transporter activity(GO:0015165) |
| 0.1 | 0.5 | GO:0016783 | sulfurtransferase activity(GO:0016783) |
| 0.1 | 0.6 | GO:1903136 | cuprous ion binding(GO:1903136) |
| 0.1 | 1.1 | GO:0015232 | heme transporter activity(GO:0015232) |
| 0.1 | 0.3 | GO:0005483 | soluble NSF attachment protein activity(GO:0005483) |
| 0.1 | 0.1 | GO:0005137 | interleukin-5 receptor binding(GO:0005137) |
| 0.1 | 1.2 | GO:0009982 | pseudouridine synthase activity(GO:0009982) |
| 0.1 | 0.3 | GO:0051500 | D-aminoacyl-tRNA deacylase activity(GO:0051499) D-tyrosyl-tRNA(Tyr) deacylase activity(GO:0051500) |
| 0.1 | 0.5 | GO:0015450 | P-P-bond-hydrolysis-driven protein transmembrane transporter activity(GO:0015450) |
| 0.1 | 0.5 | GO:0004045 | aminoacyl-tRNA hydrolase activity(GO:0004045) |
| 0.1 | 0.6 | GO:0004571 | mannosyl-oligosaccharide 1,2-alpha-mannosidase activity(GO:0004571) mannosyl-oligosaccharide mannosidase activity(GO:0015924) |
| 0.1 | 0.4 | GO:0097001 | ceramide binding(GO:0097001) |
| 0.1 | 0.3 | GO:0016672 | oxidoreductase activity, acting on a sulfur group of donors, quinone or similar compound as acceptor(GO:0016672) sulfide:quinone oxidoreductase activity(GO:0070224) |
| 0.1 | 1.4 | GO:0043027 | cysteine-type endopeptidase inhibitor activity involved in apoptotic process(GO:0043027) |
| 0.1 | 0.8 | GO:0035312 | 5'-3' exodeoxyribonuclease activity(GO:0035312) |
| 0.1 | 6.3 | GO:0005267 | potassium channel activity(GO:0005267) |
| 0.1 | 0.4 | GO:0003747 | translation release factor activity(GO:0003747) translation termination factor activity(GO:0008079) |
| 0.1 | 13.4 | GO:0017137 | Rab GTPase binding(GO:0017137) |
| 0.1 | 51.3 | GO:0004842 | ubiquitin-protein transferase activity(GO:0004842) |
| 0.1 | 1.0 | GO:0050291 | sphingosine N-acyltransferase activity(GO:0050291) |
| 0.1 | 0.9 | GO:0016832 | aldehyde-lyase activity(GO:0016832) |
| 0.1 | 0.7 | GO:0003720 | telomerase activity(GO:0003720) RNA-directed DNA polymerase activity(GO:0003964) |
| 0.1 | 1.9 | GO:0008190 | eukaryotic initiation factor 4E binding(GO:0008190) |
| 0.1 | 0.3 | GO:0015433 | peptide antigen-transporting ATPase activity(GO:0015433) |
| 0.1 | 0.9 | GO:0004622 | lysophospholipase activity(GO:0004622) |
| 0.1 | 0.6 | GO:0036402 | proteasome-activating ATPase activity(GO:0036402) |
| 0.1 | 0.5 | GO:0004694 | eukaryotic translation initiation factor 2alpha kinase activity(GO:0004694) |
| 0.1 | 0.3 | GO:1990430 | extracellular matrix protein binding(GO:1990430) |
| 0.1 | 1.1 | GO:0031545 | peptidyl-proline 4-dioxygenase activity(GO:0031545) |
| 0.1 | 0.4 | GO:0003923 | GPI-anchor transamidase activity(GO:0003923) |
| 0.1 | 1.6 | GO:0008066 | glutamate receptor activity(GO:0008066) |
| 0.1 | 0.2 | GO:0016936 | galactoside binding(GO:0016936) |
| 0.1 | 1.9 | GO:0004653 | polypeptide N-acetylgalactosaminyltransferase activity(GO:0004653) |
| 0.1 | 0.2 | GO:0005549 | odorant binding(GO:0005549) |
| 0.1 | 0.1 | GO:0008969 | phosphohistidine phosphatase activity(GO:0008969) |
| 0.1 | 0.3 | GO:0004127 | cytidylate kinase activity(GO:0004127) |
| 0.1 | 0.5 | GO:0004849 | uridine kinase activity(GO:0004849) |
| 0.1 | 1.2 | GO:0001965 | G-protein alpha-subunit binding(GO:0001965) |
| 0.1 | 2.0 | GO:0005528 | macrolide binding(GO:0005527) FK506 binding(GO:0005528) |
| 0.1 | 0.1 | GO:0002060 | purine nucleobase binding(GO:0002060) |
| 0.1 | 0.5 | GO:0050811 | GABA receptor binding(GO:0050811) |
| 0.1 | 0.3 | GO:0052829 | inositol-1,4-bisphosphate 1-phosphatase activity(GO:0004441) inositol-1,3,4-trisphosphate 1-phosphatase activity(GO:0052829) |
| 0.1 | 1.5 | GO:0015297 | antiporter activity(GO:0015297) |
| 0.1 | 0.6 | GO:0042835 | BRE binding(GO:0042835) |
| 0.1 | 0.2 | GO:0050253 | retinyl-palmitate esterase activity(GO:0050253) |
| 0.1 | 6.8 | GO:0004722 | protein serine/threonine phosphatase activity(GO:0004722) |
| 0.1 | 0.8 | GO:0015278 | calcium-release channel activity(GO:0015278) ligand-gated calcium channel activity(GO:0099604) |
| 0.1 | 0.6 | GO:0008158 | hedgehog receptor activity(GO:0008158) |
| 0.1 | 1.3 | GO:0030170 | pyridoxal phosphate binding(GO:0030170) |
| 0.1 | 0.8 | GO:0002151 | G-quadruplex RNA binding(GO:0002151) |
| 0.1 | 0.3 | GO:0004719 | protein-L-isoaspartate (D-aspartate) O-methyltransferase activity(GO:0004719) |
| 0.1 | 1.2 | GO:0045294 | alpha-catenin binding(GO:0045294) |
| 0.1 | 0.3 | GO:0004803 | transposase activity(GO:0004803) |
| 0.1 | 0.8 | GO:0099589 | serotonin receptor activity(GO:0099589) |
| 0.1 | 0.4 | GO:0004797 | deoxycytidine kinase activity(GO:0004137) thymidine kinase activity(GO:0004797) |
| 0.1 | 0.5 | GO:0005127 | ciliary neurotrophic factor receptor binding(GO:0005127) |
| 0.1 | 0.6 | GO:0097322 | 7SK snRNA binding(GO:0097322) |
| 0.1 | 0.7 | GO:0015116 | sulfate transmembrane transporter activity(GO:0015116) |
| 0.1 | 0.3 | GO:0070051 | fibrinogen binding(GO:0070051) |
| 0.1 | 0.2 | GO:0016608 | growth hormone-releasing hormone activity(GO:0016608) |
| 0.1 | 0.3 | GO:0004169 | dolichyl-phosphate-mannose-protein mannosyltransferase activity(GO:0004169) |
| 0.1 | 0.3 | GO:0000268 | peroxisome targeting sequence binding(GO:0000268) |
| 0.1 | 0.2 | GO:0008532 | N-acetyllactosaminide beta-1,3-N-acetylglucosaminyltransferase activity(GO:0008532) |
| 0.1 | 2.1 | GO:0005546 | phosphatidylinositol-4,5-bisphosphate binding(GO:0005546) |
| 0.1 | 0.2 | GO:0016715 | oxidoreductase activity, acting on paired donors, with incorporation or reduction of molecular oxygen, reduced ascorbate as one donor, and incorporation of one atom of oxygen(GO:0016715) |
| 0.1 | 2.0 | GO:0015078 | hydrogen ion transmembrane transporter activity(GO:0015078) |
| 0.1 | 0.4 | GO:0004430 | 1-phosphatidylinositol 4-kinase activity(GO:0004430) |
| 0.1 | 0.2 | GO:0090631 | pre-miRNA transporter activity(GO:0090631) |
| 0.1 | 0.9 | GO:0016854 | racemase and epimerase activity(GO:0016854) |
| 0.1 | 0.1 | GO:0016833 | oxo-acid-lyase activity(GO:0016833) |
| 0.0 | 0.3 | GO:0004594 | pantothenate kinase activity(GO:0004594) |
| 0.0 | 0.1 | GO:0043739 | G/U mismatch-specific uracil-DNA glycosylase activity(GO:0043739) |
| 0.0 | 0.4 | GO:0071723 | lipopeptide binding(GO:0071723) |
| 0.0 | 1.5 | GO:0051787 | misfolded protein binding(GO:0051787) |
| 0.0 | 0.9 | GO:0016702 | oxidoreductase activity, acting on single donors with incorporation of molecular oxygen, incorporation of two atoms of oxygen(GO:0016702) |
| 0.0 | 1.1 | GO:0005344 | oxygen transporter activity(GO:0005344) |
| 0.0 | 1.1 | GO:0004385 | guanylate kinase activity(GO:0004385) |
| 0.0 | 1.4 | GO:0004012 | phospholipid-translocating ATPase activity(GO:0004012) |
| 0.0 | 0.7 | GO:0004551 | nucleotide diphosphatase activity(GO:0004551) |
| 0.0 | 0.9 | GO:0070016 | armadillo repeat domain binding(GO:0070016) |
| 0.0 | 2.0 | GO:0071617 | 1-acylglycerol-3-phosphate O-acyltransferase activity(GO:0003841) lysophosphatidic acid acyltransferase activity(GO:0042171) lysophospholipid acyltransferase activity(GO:0071617) |
| 0.0 | 1.5 | GO:0017056 | structural constituent of nuclear pore(GO:0017056) |
| 0.0 | 3.3 | GO:0019003 | GDP binding(GO:0019003) |
| 0.0 | 0.3 | GO:0016812 | hydrolase activity, acting on carbon-nitrogen (but not peptide) bonds, in cyclic amides(GO:0016812) |
| 0.0 | 1.6 | GO:0080025 | phosphatidylinositol-3,5-bisphosphate binding(GO:0080025) |
| 0.0 | 0.8 | GO:0004602 | glutathione peroxidase activity(GO:0004602) |
| 0.0 | 0.1 | GO:0002046 | opsin binding(GO:0002046) |
| 0.0 | 0.2 | GO:0047844 | deoxycytidine deaminase activity(GO:0047844) |
| 0.0 | 0.4 | GO:0008454 | alpha-1,3-mannosylglycoprotein 4-beta-N-acetylglucosaminyltransferase activity(GO:0008454) |
| 0.0 | 15.4 | GO:0004984 | olfactory receptor activity(GO:0004984) |
| 0.0 | 0.0 | GO:0003829 | beta-1,3-galactosyl-O-glycosyl-glycoprotein beta-1,6-N-acetylglucosaminyltransferase activity(GO:0003829) |
| 0.0 | 0.5 | GO:0004565 | beta-galactosidase activity(GO:0004565) |
| 0.0 | 0.5 | GO:0004017 | adenylate kinase activity(GO:0004017) |
| 0.0 | 0.2 | GO:0004616 | phosphogluconate dehydrogenase (decarboxylating) activity(GO:0004616) |
| 0.0 | 1.0 | GO:0070628 | proteasome binding(GO:0070628) |
| 0.0 | 0.3 | GO:0043274 | phospholipase binding(GO:0043274) |
| 0.0 | 0.3 | GO:0031544 | peptidyl-proline 3-dioxygenase activity(GO:0031544) |
| 0.0 | 0.5 | GO:0008195 | phosphatidate phosphatase activity(GO:0008195) |
| 0.0 | 0.1 | GO:0004483 | mRNA (nucleoside-2'-O-)-methyltransferase activity(GO:0004483) |
| 0.0 | 0.3 | GO:0070061 | fructose binding(GO:0070061) |
| 0.0 | 0.2 | GO:0016300 | tRNA (uracil) methyltransferase activity(GO:0016300) |
| 0.0 | 1.3 | GO:0016209 | antioxidant activity(GO:0016209) |
| 0.0 | 0.8 | GO:0004887 | thyroid hormone receptor activity(GO:0004887) |
| 0.0 | 1.3 | GO:0051879 | Hsp90 protein binding(GO:0051879) |
| 0.0 | 0.2 | GO:0016807 | cysteine-type carboxypeptidase activity(GO:0016807) cysteine-type exopeptidase activity(GO:0070004) |
| 0.0 | 0.1 | GO:0016005 | phospholipase A2 activator activity(GO:0016005) |
| 0.0 | 0.2 | GO:0004652 | polynucleotide adenylyltransferase activity(GO:0004652) |
| 0.0 | 0.2 | GO:0005334 | norepinephrine:sodium symporter activity(GO:0005334) |
| 0.0 | 0.3 | GO:0000213 | tRNA-intron endonuclease activity(GO:0000213) |
| 0.0 | 0.3 | GO:0097506 | uracil DNA N-glycosylase activity(GO:0004844) deaminated base DNA N-glycosylase activity(GO:0097506) |
| 0.0 | 0.3 | GO:0004331 | fructose-2,6-bisphosphate 2-phosphatase activity(GO:0004331) |
| 0.0 | 0.2 | GO:0008384 | IkappaB kinase activity(GO:0008384) |
| 0.0 | 0.7 | GO:0017162 | aryl hydrocarbon receptor binding(GO:0017162) |
| 0.0 | 1.7 | GO:0001784 | phosphotyrosine binding(GO:0001784) |
| 0.0 | 0.2 | GO:0005124 | scavenger receptor binding(GO:0005124) |
| 0.0 | 0.5 | GO:0036312 | phosphatidylinositol 3-kinase regulatory subunit binding(GO:0036312) |
| 0.0 | 2.3 | GO:0043621 | protein self-association(GO:0043621) |
| 0.0 | 0.3 | GO:0003956 | NAD(P)+-protein-arginine ADP-ribosyltransferase activity(GO:0003956) |
| 0.0 | 0.9 | GO:0008146 | sulfotransferase activity(GO:0008146) |
| 0.0 | 0.2 | GO:0004303 | estradiol 17-beta-dehydrogenase activity(GO:0004303) |
| 0.0 | 0.2 | GO:0008525 | phosphatidylcholine transporter activity(GO:0008525) |
| 0.0 | 0.2 | GO:0008523 | sodium-dependent multivitamin transmembrane transporter activity(GO:0008523) |
| 0.0 | 1.3 | GO:0030145 | manganese ion binding(GO:0030145) |
| 0.0 | 0.2 | GO:0004105 | choline-phosphate cytidylyltransferase activity(GO:0004105) |
| 0.0 | 3.4 | GO:0022832 | voltage-gated ion channel activity(GO:0005244) voltage-gated channel activity(GO:0022832) |
| 0.0 | 0.1 | GO:0032139 | dinucleotide insertion or deletion binding(GO:0032139) |
| 0.0 | 0.4 | GO:0070300 | phosphatidic acid binding(GO:0070300) |
| 0.0 | 0.6 | GO:0016627 | oxidoreductase activity, acting on the CH-CH group of donors(GO:0016627) |
| 0.0 | 0.1 | GO:0090541 | MIT domain binding(GO:0090541) |
| 0.0 | 0.1 | GO:0047708 | biotinidase activity(GO:0047708) |
| 0.0 | 0.1 | GO:0032093 | SAM domain binding(GO:0032093) |
| 0.0 | 0.1 | GO:0001632 | leukotriene B4 receptor activity(GO:0001632) |
| 0.0 | 0.2 | GO:0039552 | RIG-I binding(GO:0039552) |
| 0.0 | 1.3 | GO:0004869 | cysteine-type endopeptidase inhibitor activity(GO:0004869) |
| 0.0 | 4.2 | GO:0008565 | protein transporter activity(GO:0008565) |
| 0.0 | 0.3 | GO:0031435 | mitogen-activated protein kinase kinase kinase binding(GO:0031435) |
| 0.0 | 0.2 | GO:0009378 | four-way junction helicase activity(GO:0009378) |
| 0.0 | 4.2 | GO:0005179 | hormone activity(GO:0005179) |
| 0.0 | 0.3 | GO:1990239 | steroid hormone binding(GO:1990239) |
| 0.0 | 0.0 | GO:0016309 | 1-phosphatidylinositol-5-phosphate 4-kinase activity(GO:0016309) |
| 0.0 | 1.2 | GO:0005123 | death receptor binding(GO:0005123) |
| 0.0 | 0.3 | GO:0048185 | activin binding(GO:0048185) |
| 0.0 | 0.1 | GO:0004449 | isocitrate dehydrogenase (NAD+) activity(GO:0004449) |
| 0.0 | 0.2 | GO:0019959 | interleukin-8 receptor activity(GO:0004918) interleukin-8 binding(GO:0019959) |
| 0.0 | 0.1 | GO:0016426 | tRNA (adenine) methyltransferase activity(GO:0016426) |
| 0.0 | 0.1 | GO:0005047 | signal recognition particle binding(GO:0005047) |
| 0.0 | 0.1 | GO:0004982 | N-formyl peptide receptor activity(GO:0004982) |
| 0.0 | 0.3 | GO:0016780 | phosphotransferase activity, for other substituted phosphate groups(GO:0016780) |
| 0.0 | 0.1 | GO:0004771 | sterol esterase activity(GO:0004771) |
| 0.0 | 2.0 | GO:0016820 | hydrolase activity, acting on acid anhydrides, catalyzing transmembrane movement of substances(GO:0016820) |
| 0.0 | 0.5 | GO:0005104 | fibroblast growth factor receptor binding(GO:0005104) |
| 0.0 | 0.2 | GO:0008376 | acetylgalactosaminyltransferase activity(GO:0008376) |
| 0.0 | 0.1 | GO:0004577 | N-acetylglucosaminyldiphosphodolichol N-acetylglucosaminyltransferase activity(GO:0004577) |
| 0.0 | 1.0 | GO:0016409 | palmitoyltransferase activity(GO:0016409) |
| 0.0 | 0.1 | GO:0030274 | LIM domain binding(GO:0030274) |
| 0.0 | 0.1 | GO:0046964 | 3'-phosphoadenosine 5'-phosphosulfate transmembrane transporter activity(GO:0046964) |
| 0.0 | 0.0 | GO:0019781 | NEDD8 activating enzyme activity(GO:0019781) |
| 0.0 | 0.1 | GO:0042289 | MHC class II protein binding(GO:0042289) |
| 0.0 | 0.2 | GO:0043426 | MRF binding(GO:0043426) |
| 0.0 | 0.1 | GO:0005166 | neurotrophin p75 receptor binding(GO:0005166) |
| 0.0 | 0.6 | GO:0016881 | acid-amino acid ligase activity(GO:0016881) |
| 0.0 | 0.1 | GO:0004906 | interferon-gamma receptor activity(GO:0004906) |
| 0.0 | 0.3 | GO:0031418 | L-ascorbic acid binding(GO:0031418) |
| 0.0 | 0.4 | GO:0004691 | cAMP-dependent protein kinase activity(GO:0004691) |
| 0.0 | 0.0 | GO:0070095 | fructose-6-phosphate binding(GO:0070095) |
| 0.0 | 0.4 | GO:0097109 | neuroligin family protein binding(GO:0097109) |
| 0.0 | 0.6 | GO:0004866 | endopeptidase inhibitor activity(GO:0004866) |
| 0.0 | 0.3 | GO:0008353 | RNA polymerase II carboxy-terminal domain kinase activity(GO:0008353) |
| 0.0 | 0.1 | GO:0098821 | BMP receptor activity(GO:0098821) |
| 0.0 | 0.2 | GO:0005025 | transforming growth factor beta receptor activity, type I(GO:0005025) |
| 0.0 | 0.1 | GO:0047961 | glycine N-acyltransferase activity(GO:0047961) |
| 0.0 | 0.2 | GO:0035612 | AP-2 adaptor complex binding(GO:0035612) |
| 0.0 | 0.8 | GO:0030332 | cyclin binding(GO:0030332) |
| 0.0 | 0.2 | GO:0046972 | histone acetyltransferase activity (H4-K5 specific)(GO:0043995) histone acetyltransferase activity (H4-K8 specific)(GO:0043996) histone acetyltransferase activity (H4-K16 specific)(GO:0046972) |
| 0.0 | 0.5 | GO:0001671 | ATPase activator activity(GO:0001671) |
| 0.0 | 7.2 | GO:0015631 | tubulin binding(GO:0015631) |
| 0.0 | 0.1 | GO:0080019 | fatty-acyl-CoA reductase (alcohol-forming) activity(GO:0080019) |
| 0.0 | 0.2 | GO:1990247 | N6-methyladenosine-containing RNA binding(GO:1990247) |
| 0.0 | 0.2 | GO:0035374 | chondroitin sulfate binding(GO:0035374) |
| 0.0 | 0.0 | GO:0017153 | sodium:dicarboxylate symporter activity(GO:0017153) |
| 0.0 | 0.6 | GO:0004198 | calcium-dependent cysteine-type endopeptidase activity(GO:0004198) |
| 0.0 | 0.0 | GO:0043734 | DNA demethylase activity(GO:0035514) DNA-N1-methyladenine dioxygenase activity(GO:0043734) |
| 0.0 | 0.1 | GO:0043492 | ATPase activity, coupled to movement of substances(GO:0043492) |
| 0.0 | 0.4 | GO:0030296 | protein tyrosine kinase activator activity(GO:0030296) |
| 0.0 | 0.1 | GO:0050211 | procollagen galactosyltransferase activity(GO:0050211) |
| 0.0 | 0.3 | GO:0004065 | arylsulfatase activity(GO:0004065) |
| 0.0 | 0.2 | GO:0043024 | ribosomal small subunit binding(GO:0043024) |
| 0.0 | 0.2 | GO:0001727 | lipid kinase activity(GO:0001727) |
| 0.0 | 0.1 | GO:0004126 | cytidine deaminase activity(GO:0004126) |
| 0.0 | 0.6 | GO:0004693 | cyclin-dependent protein serine/threonine kinase activity(GO:0004693) |
| 0.0 | 0.1 | GO:0060590 | ATPase regulator activity(GO:0060590) |
| 0.0 | 0.1 | GO:0016790 | thiolester hydrolase activity(GO:0016790) |
| 0.0 | 0.2 | GO:0001206 | transcriptional repressor activity, RNA polymerase II distal enhancer sequence-specific binding(GO:0001206) |
| 0.0 | 0.1 | GO:0031802 | type 5 metabotropic glutamate receptor binding(GO:0031802) |
| 0.0 | 0.1 | GO:0004066 | asparagine synthase (glutamine-hydrolyzing) activity(GO:0004066) |
| 0.0 | 1.6 | GO:0051082 | unfolded protein binding(GO:0051082) |
| 0.0 | 0.2 | GO:0004745 | retinol dehydrogenase activity(GO:0004745) |
| 0.0 | 0.4 | GO:0008239 | dipeptidyl-peptidase activity(GO:0008239) |
| 0.0 | 0.0 | GO:0008665 | 2'-phosphotransferase activity(GO:0008665) |
| 0.0 | 0.1 | GO:0016308 | 1-phosphatidylinositol-4-phosphate 5-kinase activity(GO:0016308) |
| 0.0 | 0.0 | GO:0004711 | ribosomal protein S6 kinase activity(GO:0004711) |
Gene overrepresentation in curated gene sets: canonical pathways category:
| Log-likelihood per target | Total log-likelihood | Term | Description |
|---|---|---|---|
| 1.0 | 49.5 | ST WNT CA2 CYCLIC GMP PATHWAY | Wnt/Ca2+/cyclic GMP signaling. |
| 0.5 | 6.0 | PID TNF PATHWAY | TNF receptor signaling pathway |
| 0.5 | 42.9 | PID HNF3B PATHWAY | FOXA2 and FOXA3 transcription factor networks |
| 0.3 | 1.5 | ST PHOSPHOINOSITIDE 3 KINASE PATHWAY | PI3K Pathway |
| 0.2 | 26.8 | PID ECADHERIN STABILIZATION PATHWAY | Stabilization and expansion of the E-cadherin adherens junction |
| 0.2 | 0.6 | SA FAS SIGNALING | The TNF-type receptor Fas induces apoptosis on ligand binding. |
| 0.2 | 14.7 | PID NEPHRIN NEPH1 PATHWAY | Nephrin/Neph1 signaling in the kidney podocyte |
| 0.2 | 2.7 | ST STAT3 PATHWAY | STAT3 Pathway |
| 0.2 | 3.6 | PID ECADHERIN KERATINOCYTE PATHWAY | E-cadherin signaling in keratinocytes |
| 0.2 | 8.1 | PID ERBB NETWORK PATHWAY | ErbB receptor signaling network |
| 0.2 | 5.4 | PID ERB GENOMIC PATHWAY | Validated nuclear estrogen receptor beta network |
| 0.2 | 2.7 | ST TYPE I INTERFERON PATHWAY | Type I Interferon (alpha/beta IFN) Pathway |
| 0.2 | 5.9 | ST GA12 PATHWAY | G alpha 12 Pathway |
| 0.2 | 0.5 | PID AR NONGENOMIC PATHWAY | Nongenotropic Androgen signaling |
| 0.2 | 7.5 | ST MYOCYTE AD PATHWAY | Myocyte Adrenergic Pathway is a specific case of the generalized Adrenergic Pathway. |
| 0.2 | 3.0 | PID BETA CATENIN DEG PATHWAY | Degradation of beta catenin |
| 0.2 | 1.6 | PID EPHA2 FWD PATHWAY | EPHA2 forward signaling |
| 0.1 | 0.4 | SA CASPASE CASCADE | Apoptosis is mediated by caspases, cysteine proteases arranged in a proteolytic cascade. |
| 0.1 | 2.1 | PID IL6 7 PATHWAY | IL6-mediated signaling events |
| 0.1 | 10.6 | PID ERBB1 INTERNALIZATION PATHWAY | Internalization of ErbB1 |
| 0.1 | 2.8 | PID INTEGRIN A9B1 PATHWAY | Alpha9 beta1 integrin signaling events |
| 0.1 | 2.3 | PID ERBB1 DOWNSTREAM PATHWAY | ErbB1 downstream signaling |
| 0.1 | 3.6 | PID ARF6 DOWNSTREAM PATHWAY | Arf6 downstream pathway |
| 0.1 | 3.8 | PID EPHA FWDPATHWAY | EPHA forward signaling |
| 0.1 | 1.2 | ST INTEGRIN SIGNALING PATHWAY | Integrin Signaling Pathway |
| 0.1 | 1.8 | PID INTEGRIN5 PATHWAY | Beta5 beta6 beta7 and beta8 integrin cell surface interactions |
| 0.1 | 1.1 | PID ERBB2 ERBB3 PATHWAY | ErbB2/ErbB3 signaling events |
| 0.1 | 2.6 | PID SYNDECAN 3 PATHWAY | Syndecan-3-mediated signaling events |
| 0.1 | 4.9 | PID HDAC CLASSIII PATHWAY | Signaling events mediated by HDAC Class III |
| 0.1 | 6.3 | PID AJDISS 2PATHWAY | Posttranslational regulation of adherens junction stability and dissassembly |
| 0.1 | 3.4 | PID CONE PATHWAY | Visual signal transduction: Cones |
| 0.1 | 6.9 | SIG CHEMOTAXIS | Genes related to chemotaxis |
| 0.1 | 2.3 | PID PI3KCI AKT PATHWAY | Class I PI3K signaling events mediated by Akt |
| 0.1 | 6.2 | PID ALPHA SYNUCLEIN PATHWAY | Alpha-synuclein signaling |
| 0.1 | 9.7 | PID LKB1 PATHWAY | LKB1 signaling events |
| 0.1 | 6.0 | PID FOXO PATHWAY | FoxO family signaling |
| 0.1 | 2.9 | PID RETINOIC ACID PATHWAY | Retinoic acid receptors-mediated signaling |
| 0.1 | 2.6 | PID FAS PATHWAY | FAS (CD95) signaling pathway |
| 0.1 | 2.0 | PID P38 ALPHA BETA PATHWAY | Regulation of p38-alpha and p38-beta |
| 0.1 | 1.1 | PID LYSOPHOSPHOLIPID PATHWAY | LPA receptor mediated events |
| 0.1 | 0.7 | PID MET PATHWAY | Signaling events mediated by Hepatocyte Growth Factor Receptor (c-Met) |
| 0.1 | 2.7 | PID NFAT TFPATHWAY | Calcineurin-regulated NFAT-dependent transcription in lymphocytes |
| 0.1 | 0.4 | ST ADRENERGIC | Adrenergic Pathway |
| 0.1 | 3.8 | PID ARF6 PATHWAY | Arf6 signaling events |
| 0.1 | 4.1 | PID P75 NTR PATHWAY | p75(NTR)-mediated signaling |
| 0.1 | 0.3 | PID AVB3 INTEGRIN PATHWAY | Integrins in angiogenesis |
| 0.1 | 1.0 | PID ERBB4 PATHWAY | ErbB4 signaling events |
| 0.1 | 3.7 | PID P38 ALPHA BETA DOWNSTREAM PATHWAY | Signaling mediated by p38-alpha and p38-beta |
| 0.1 | 0.6 | PID HDAC CLASSII PATHWAY | Signaling events mediated by HDAC Class II |
| 0.1 | 1.0 | PID ALK2 PATHWAY | ALK2 signaling events |
| 0.0 | 0.4 | SA G1 AND S PHASES | Cdk2, 4, and 6 bind cyclin D in G1, while cdk2/cyclin E promotes the G1/S transition. |
| 0.0 | 0.9 | PID TXA2PATHWAY | Thromboxane A2 receptor signaling |
| 0.0 | 2.8 | PID MTOR 4PATHWAY | mTOR signaling pathway |
| 0.0 | 1.2 | PID P38 MKK3 6PATHWAY | p38 MAPK signaling pathway |
| 0.0 | 0.8 | ST G ALPHA I PATHWAY | G alpha i Pathway |
| 0.0 | 6.0 | PID P73PATHWAY | p73 transcription factor network |
| 0.0 | 0.4 | PID IL2 PI3K PATHWAY | IL2 signaling events mediated by PI3K |
| 0.0 | 2.4 | PID HIF2PATHWAY | HIF-2-alpha transcription factor network |
| 0.0 | 2.4 | PID CDC42 REG PATHWAY | Regulation of CDC42 activity |
| 0.0 | 0.2 | PID LYMPH ANGIOGENESIS PATHWAY | VEGFR3 signaling in lymphatic endothelium |
| 0.0 | 0.9 | ST DIFFERENTIATION PATHWAY IN PC12 CELLS | Differentiation Pathway in PC12 Cells; this is a specific case of PAC1 Receptor Pathway. |
| 0.0 | 2.3 | PID INTEGRIN3 PATHWAY | Beta3 integrin cell surface interactions |
| 0.0 | 0.2 | ST G ALPHA S PATHWAY | G alpha s Pathway |
| 0.0 | 0.6 | PID LPA4 PATHWAY | LPA4-mediated signaling events |
| 0.0 | 0.1 | PID S1P S1P3 PATHWAY | S1P3 pathway |
| 0.0 | 0.2 | PID RANBP2 PATHWAY | Sumoylation by RanBP2 regulates transcriptional repression |
| 0.0 | 9.7 | NABA ECM REGULATORS | Genes encoding enzymes and their regulators involved in the remodeling of the extracellular matrix |
| 0.0 | 0.5 | PID CIRCADIAN PATHWAY | Circadian rhythm pathway |
| 0.0 | 0.6 | PID ARF6 TRAFFICKING PATHWAY | Arf6 trafficking events |
| 0.0 | 0.7 | PID ECADHERIN NASCENT AJ PATHWAY | E-cadherin signaling in the nascent adherens junction |
| 0.0 | 0.0 | ST GRANULE CELL SURVIVAL PATHWAY | Granule Cell Survival Pathway is a specific case of more general PAC1 Receptor Pathway. |
| 0.0 | 0.6 | PID NETRIN PATHWAY | Netrin-mediated signaling events |
| 0.0 | 0.2 | PID ALK1 PATHWAY | ALK1 signaling events |
| 0.0 | 0.4 | PID ARF 3PATHWAY | Arf1 pathway |
| 0.0 | 0.3 | PID EPHB FWD PATHWAY | EPHB forward signaling |
| 0.0 | 0.0 | PID THROMBIN PAR1 PATHWAY | PAR1-mediated thrombin signaling events |
| 0.0 | 0.1 | PID SHP2 PATHWAY | SHP2 signaling |
Gene overrepresentation in curated gene sets: REACTOME pathways category:
| Log-likelihood per target | Total log-likelihood | Term | Description |
|---|---|---|---|
| 1.1 | 20.6 | REACTOME XENOBIOTICS | Genes involved in Xenobiotics |
| 1.1 | 46.7 | REACTOME RAS ACTIVATION UOPN CA2 INFUX THROUGH NMDA RECEPTOR | Genes involved in Ras activation uopn Ca2+ infux through NMDA receptor |
| 0.9 | 13.8 | REACTOME SYNTHESIS OF BILE ACIDS AND BILE SALTS VIA 24 HYDROXYCHOLESTEROL | Genes involved in Synthesis of bile acids and bile salts via 24-hydroxycholesterol |
| 0.8 | 20.2 | REACTOME AMINE DERIVED HORMONES | Genes involved in Amine-derived hormones |
| 0.7 | 17.9 | REACTOME CHYLOMICRON MEDIATED LIPID TRANSPORT | Genes involved in Chylomicron-mediated lipid transport |
| 0.7 | 18.9 | REACTOME GAP JUNCTION ASSEMBLY | Genes involved in Gap junction assembly |
| 0.6 | 30.5 | REACTOME TIGHT JUNCTION INTERACTIONS | Genes involved in Tight junction interactions |
| 0.6 | 1.8 | REACTOME DSCAM INTERACTIONS | Genes involved in DSCAM interactions |
| 0.5 | 31.8 | REACTOME INTERACTION BETWEEN L1 AND ANKYRINS | Genes involved in Interaction between L1 and Ankyrins |
| 0.5 | 14.3 | REACTOME ORGANIC CATION ANION ZWITTERION TRANSPORT | Genes involved in Organic cation/anion/zwitterion transport |
| 0.5 | 6.6 | REACTOME GAMMA CARBOXYLATION TRANSPORT AND AMINO TERMINAL CLEAVAGE OF PROTEINS | Genes involved in Gamma-carboxylation, transport, and amino-terminal cleavage of proteins |
| 0.5 | 20.0 | REACTOME SULFUR AMINO ACID METABOLISM | Genes involved in Sulfur amino acid metabolism |
| 0.5 | 13.9 | REACTOME BRANCHED CHAIN AMINO ACID CATABOLISM | Genes involved in Branched-chain amino acid catabolism |
| 0.5 | 17.9 | REACTOME POST CHAPERONIN TUBULIN FOLDING PATHWAY | Genes involved in Post-chaperonin tubulin folding pathway |
| 0.4 | 8.4 | REACTOME MITOCHONDRIAL FATTY ACID BETA OXIDATION | Genes involved in Mitochondrial Fatty Acid Beta-Oxidation |
| 0.4 | 30.3 | REACTOME INWARDLY RECTIFYING K CHANNELS | Genes involved in Inwardly rectifying K+ channels |
| 0.4 | 7.7 | REACTOME GAP JUNCTION TRAFFICKING | Genes involved in Gap junction trafficking |
| 0.4 | 12.4 | REACTOME AMINO ACID SYNTHESIS AND INTERCONVERSION TRANSAMINATION | Genes involved in Amino acid synthesis and interconversion (transamination) |
| 0.4 | 11.5 | REACTOME CITRIC ACID CYCLE TCA CYCLE | Genes involved in Citric acid cycle (TCA cycle) |
| 0.4 | 7.1 | REACTOME SYNTHESIS OF PIPS AT THE LATE ENDOSOME MEMBRANE | Genes involved in Synthesis of PIPs at the late endosome membrane |
| 0.4 | 17.6 | REACTOME GABA A RECEPTOR ACTIVATION | Genes involved in GABA A receptor activation |
| 0.4 | 11.2 | REACTOME DOWNREGULATION OF ERBB2 ERBB3 SIGNALING | Genes involved in Downregulation of ERBB2:ERBB3 signaling |
| 0.4 | 7.4 | REACTOME SIGNALING BY FGFR3 MUTANTS | Genes involved in Signaling by FGFR3 mutants |
| 0.4 | 69.7 | REACTOME METABOLISM OF AMINO ACIDS AND DERIVATIVES | Genes involved in Metabolism of amino acids and derivatives |
| 0.4 | 13.0 | REACTOME INSULIN RECEPTOR RECYCLING | Genes involved in Insulin receptor recycling |
| 0.3 | 15.4 | REACTOME LYSOSOME VESICLE BIOGENESIS | Genes involved in Lysosome Vesicle Biogenesis |
| 0.3 | 7.8 | REACTOME TRANSPORT OF ORGANIC ANIONS | Genes involved in Transport of organic anions |
| 0.3 | 19.0 | REACTOME GABA SYNTHESIS RELEASE REUPTAKE AND DEGRADATION | Genes involved in GABA synthesis, release, reuptake and degradation |
| 0.3 | 9.4 | REACTOME TGF BETA RECEPTOR SIGNALING IN EMT EPITHELIAL TO MESENCHYMAL TRANSITION | Genes involved in TGF-beta receptor signaling in EMT (epithelial to mesenchymal transition) |
| 0.3 | 0.3 | REACTOME PEPTIDE LIGAND BINDING RECEPTORS | Genes involved in Peptide ligand-binding receptors |
| 0.3 | 9.5 | REACTOME GLUCURONIDATION | Genes involved in Glucuronidation |
| 0.3 | 5.9 | REACTOME COMMON PATHWAY | Genes involved in Common Pathway |
| 0.3 | 13.3 | REACTOME TIE2 SIGNALING | Genes involved in Tie2 Signaling |
| 0.3 | 22.2 | REACTOME STRIATED MUSCLE CONTRACTION | Genes involved in Striated Muscle Contraction |
| 0.3 | 21.4 | REACTOME GLUCONEOGENESIS | Genes involved in Gluconeogenesis |
| 0.3 | 4.4 | REACTOME UNBLOCKING OF NMDA RECEPTOR GLUTAMATE BINDING AND ACTIVATION | Genes involved in Unblocking of NMDA receptor, glutamate binding and activation |
| 0.3 | 7.3 | REACTOME ALPHA LINOLENIC ACID ALA METABOLISM | Genes involved in alpha-linolenic acid (ALA) metabolism |
| 0.3 | 5.8 | REACTOME BILE SALT AND ORGANIC ANION SLC TRANSPORTERS | Genes involved in Bile salt and organic anion SLC transporters |
| 0.3 | 14.4 | REACTOME REGULATION OF GENE EXPRESSION IN BETA CELLS | Genes involved in Regulation of gene expression in beta cells |
| 0.3 | 28.1 | REACTOME AMINO ACID AND OLIGOPEPTIDE SLC TRANSPORTERS | Genes involved in Amino acid and oligopeptide SLC transporters |
| 0.3 | 1.0 | REACTOME TRANSFERRIN ENDOCYTOSIS AND RECYCLING | Genes involved in Transferrin endocytosis and recycling |
| 0.2 | 24.6 | REACTOME TRANSPORT OF INORGANIC CATIONS ANIONS AND AMINO ACIDS OLIGOPEPTIDES | Genes involved in Transport of inorganic cations/anions and amino acids/oligopeptides |
| 0.2 | 9.1 | REACTOME TRANSPORT OF VITAMINS NUCLEOSIDES AND RELATED MOLECULES | Genes involved in Transport of vitamins, nucleosides, and related molecules |
| 0.2 | 9.8 | REACTOME CHOLESTEROL BIOSYNTHESIS | Genes involved in Cholesterol biosynthesis |
| 0.2 | 5.1 | REACTOME REGULATION OF RHEB GTPASE ACTIVITY BY AMPK | Genes involved in Regulation of Rheb GTPase activity by AMPK |
| 0.2 | 19.9 | REACTOME RESPIRATORY ELECTRON TRANSPORT | Genes involved in Respiratory electron transport |
| 0.2 | 10.8 | REACTOME CIRCADIAN REPRESSION OF EXPRESSION BY REV ERBA | Genes involved in Circadian Repression of Expression by REV-ERBA |
| 0.2 | 14.7 | REACTOME ION TRANSPORT BY P TYPE ATPASES | Genes involved in Ion transport by P-type ATPases |
| 0.2 | 4.0 | REACTOME REGULATION OF PYRUVATE DEHYDROGENASE PDH COMPLEX | Genes involved in Regulation of pyruvate dehydrogenase (PDH) complex |
| 0.2 | 13.4 | REACTOME GOLGI ASSOCIATED VESICLE BIOGENESIS | Genes involved in Golgi Associated Vesicle Biogenesis |
| 0.2 | 1.0 | REACTOME DOPAMINE NEUROTRANSMITTER RELEASE CYCLE | Genes involved in Dopamine Neurotransmitter Release Cycle |
| 0.2 | 4.8 | REACTOME TRAFFICKING OF GLUR2 CONTAINING AMPA RECEPTORS | Genes involved in Trafficking of GluR2-containing AMPA receptors |
| 0.2 | 14.7 | REACTOME VOLTAGE GATED POTASSIUM CHANNELS | Genes involved in Voltage gated Potassium channels |
| 0.2 | 4.3 | REACTOME PEROXISOMAL LIPID METABOLISM | Genes involved in Peroxisomal lipid metabolism |
| 0.2 | 3.2 | REACTOME SYNTHESIS OF PE | Genes involved in Synthesis of PE |
| 0.2 | 6.0 | REACTOME METABOLISM OF STEROID HORMONES AND VITAMINS A AND D | Genes involved in Metabolism of steroid hormones and vitamins A and D |
| 0.2 | 5.8 | REACTOME POST NMDA RECEPTOR ACTIVATION EVENTS | Genes involved in Post NMDA receptor activation events |
| 0.2 | 6.2 | REACTOME SYNTHESIS OF VERY LONG CHAIN FATTY ACYL COAS | Genes involved in Synthesis of very long-chain fatty acyl-CoAs |
| 0.2 | 6.3 | REACTOME ZINC TRANSPORTERS | Genes involved in Zinc transporters |
| 0.2 | 7.7 | REACTOME TRIGLYCERIDE BIOSYNTHESIS | Genes involved in Triglyceride Biosynthesis |
| 0.1 | 3.6 | REACTOME GLYCOGEN BREAKDOWN GLYCOGENOLYSIS | Genes involved in Glycogen breakdown (glycogenolysis) |
| 0.1 | 4.1 | REACTOME APOPTOTIC CLEAVAGE OF CELL ADHESION PROTEINS | Genes involved in Apoptotic cleavage of cell adhesion proteins |
| 0.1 | 2.9 | REACTOME PURINE CATABOLISM | Genes involved in Purine catabolism |
| 0.1 | 2.9 | REACTOME IL 6 SIGNALING | Genes involved in Interleukin-6 signaling |
| 0.1 | 4.4 | REACTOME IONOTROPIC ACTIVITY OF KAINATE RECEPTORS | Genes involved in Ionotropic activity of Kainate Receptors |
| 0.1 | 4.1 | REACTOME N GLYCAN ANTENNAE ELONGATION | Genes involved in N-Glycan antennae elongation |
| 0.1 | 6.4 | REACTOME CYTOCHROME P450 ARRANGED BY SUBSTRATE TYPE | Genes involved in Cytochrome P450 - arranged by substrate type |
| 0.1 | 8.3 | REACTOME REGULATION OF WATER BALANCE BY RENAL AQUAPORINS | Genes involved in Regulation of Water Balance by Renal Aquaporins |
| 0.1 | 3.3 | REACTOME ABCA TRANSPORTERS IN LIPID HOMEOSTASIS | Genes involved in ABCA transporters in lipid homeostasis |
| 0.1 | 1.1 | REACTOME ENOS ACTIVATION AND REGULATION | Genes involved in eNOS activation and regulation |
| 0.1 | 2.7 | REACTOME CLASS C 3 METABOTROPIC GLUTAMATE PHEROMONE RECEPTORS | Genes involved in Class C/3 (Metabotropic glutamate/pheromone receptors) |
| 0.1 | 1.8 | REACTOME SEROTONIN RECEPTORS | Genes involved in Serotonin receptors |
| 0.1 | 1.4 | REACTOME COPI MEDIATED TRANSPORT | Genes involved in COPI Mediated Transport |
| 0.1 | 0.8 | REACTOME FGFR2C LIGAND BINDING AND ACTIVATION | Genes involved in FGFR2c ligand binding and activation |
| 0.1 | 1.6 | REACTOME PYRUVATE METABOLISM AND CITRIC ACID TCA CYCLE | Genes involved in Pyruvate metabolism and Citric Acid (TCA) cycle |
| 0.1 | 0.9 | REACTOME INHIBITION OF INSULIN SECRETION BY ADRENALINE NORADRENALINE | Genes involved in Inhibition of Insulin Secretion by Adrenaline/Noradrenaline |
| 0.1 | 2.6 | REACTOME INSULIN SYNTHESIS AND PROCESSING | Genes involved in Insulin Synthesis and Processing |
| 0.1 | 5.2 | REACTOME SPHINGOLIPID DE NOVO BIOSYNTHESIS | Genes involved in Sphingolipid de novo biosynthesis |
| 0.1 | 8.1 | REACTOME SPHINGOLIPID METABOLISM | Genes involved in Sphingolipid metabolism |
| 0.1 | 3.1 | REACTOME METABOLISM OF PORPHYRINS | Genes involved in Metabolism of porphyrins |
| 0.1 | 0.9 | REACTOME CYTOSOLIC TRNA AMINOACYLATION | Genes involved in Cytosolic tRNA aminoacylation |
| 0.1 | 2.9 | REACTOME SYNTHESIS OF GLYCOSYLPHOSPHATIDYLINOSITOL GPI | Genes involved in Synthesis of glycosylphosphatidylinositol (GPI) |
| 0.1 | 1.4 | REACTOME OPSINS | Genes involved in Opsins |
| 0.1 | 5.0 | REACTOME COMPLEMENT CASCADE | Genes involved in Complement cascade |
| 0.1 | 3.8 | REACTOME SEMA4D INDUCED CELL MIGRATION AND GROWTH CONE COLLAPSE | Genes involved in Sema4D induced cell migration and growth-cone collapse |
| 0.1 | 0.9 | REACTOME LIGAND GATED ION CHANNEL TRANSPORT | Genes involved in Ligand-gated ion channel transport |
| 0.1 | 3.0 | REACTOME NUCLEOTIDE LIKE PURINERGIC RECEPTORS | Genes involved in Nucleotide-like (purinergic) receptors |
| 0.1 | 4.7 | REACTOME SYNTHESIS OF PIPS AT THE PLASMA MEMBRANE | Genes involved in Synthesis of PIPs at the plasma membrane |
| 0.1 | 6.8 | REACTOME SIGNALING BY ROBO RECEPTOR | Genes involved in Signaling by Robo receptor |
| 0.1 | 2.2 | REACTOME MITOCHONDRIAL TRNA AMINOACYLATION | Genes involved in Mitochondrial tRNA aminoacylation |
| 0.1 | 2.4 | REACTOME CYTOSOLIC SULFONATION OF SMALL MOLECULES | Genes involved in Cytosolic sulfonation of small molecules |
| 0.1 | 1.4 | REACTOME SYNTHESIS OF SUBSTRATES IN N GLYCAN BIOSYTHESIS | Genes involved in Synthesis of substrates in N-glycan biosythesis |
| 0.1 | 2.4 | REACTOME PROCESSING OF INTRONLESS PRE MRNAS | Genes involved in Processing of Intronless Pre-mRNAs |
| 0.1 | 0.2 | REACTOME SEMA3A PLEXIN REPULSION SIGNALING BY INHIBITING INTEGRIN ADHESION | Genes involved in SEMA3A-Plexin repulsion signaling by inhibiting Integrin adhesion |
| 0.1 | 3.8 | REACTOME KINESINS | Genes involved in Kinesins |
| 0.1 | 0.5 | REACTOME PLATELET HOMEOSTASIS | Genes involved in Platelet homeostasis |
| 0.1 | 1.4 | REACTOME ETHANOL OXIDATION | Genes involved in Ethanol oxidation |
| 0.1 | 2.6 | REACTOME ENDOSOMAL SORTING COMPLEX REQUIRED FOR TRANSPORT ESCRT | Genes involved in Endosomal Sorting Complex Required For Transport (ESCRT) |
| 0.1 | 1.0 | REACTOME SYNTHESIS OF PIPS AT THE GOLGI MEMBRANE | Genes involved in Synthesis of PIPs at the Golgi membrane |
| 0.1 | 1.6 | REACTOME TANDEM PORE DOMAIN POTASSIUM CHANNELS | Genes involved in Tandem pore domain potassium channels |
| 0.1 | 6.3 | REACTOME METABOLISM OF VITAMINS AND COFACTORS | Genes involved in Metabolism of vitamins and cofactors |
| 0.1 | 3.8 | REACTOME MITOCHONDRIAL PROTEIN IMPORT | Genes involved in Mitochondrial Protein Import |
| 0.1 | 1.0 | REACTOME SIGNALING BY CONSTITUTIVELY ACTIVE EGFR | Genes involved in Signaling by constitutively active EGFR |
| 0.1 | 0.3 | REACTOME REGULATION OF AMPK ACTIVITY VIA LKB1 | Genes involved in Regulation of AMPK activity via LKB1 |
| 0.1 | 1.8 | REACTOME ACTIVATED TAK1 MEDIATES P38 MAPK ACTIVATION | Genes involved in activated TAK1 mediates p38 MAPK activation |
| 0.1 | 2.7 | REACTOME DARPP 32 EVENTS | Genes involved in DARPP-32 events |
| 0.1 | 1.6 | REACTOME ERK MAPK TARGETS | Genes involved in ERK/MAPK targets |
| 0.1 | 5.4 | REACTOME L1CAM INTERACTIONS | Genes involved in L1CAM interactions |
| 0.1 | 1.0 | REACTOME AKT PHOSPHORYLATES TARGETS IN THE CYTOSOL | Genes involved in AKT phosphorylates targets in the cytosol |
| 0.1 | 3.6 | REACTOME P75 NTR RECEPTOR MEDIATED SIGNALLING | Genes involved in p75 NTR receptor-mediated signalling |
| 0.1 | 6.7 | REACTOME TRANSMISSION ACROSS CHEMICAL SYNAPSES | Genes involved in Transmission across Chemical Synapses |
| 0.1 | 1.4 | REACTOME VIRAL MESSENGER RNA SYNTHESIS | Genes involved in Viral Messenger RNA Synthesis |
| 0.1 | 0.9 | REACTOME ACTIVATION OF CHAPERONE GENES BY ATF6 ALPHA | Genes involved in Activation of Chaperone Genes by ATF6-alpha |
| 0.1 | 1.8 | REACTOME RESOLUTION OF AP SITES VIA THE MULTIPLE NUCLEOTIDE PATCH REPLACEMENT PATHWAY | Genes involved in Resolution of AP sites via the multiple-nucleotide patch replacement pathway |
| 0.0 | 0.4 | REACTOME ABACAVIR TRANSPORT AND METABOLISM | Genes involved in Abacavir transport and metabolism |
| 0.0 | 13.5 | REACTOME OLFACTORY SIGNALING PATHWAY | Genes involved in Olfactory Signaling Pathway |
| 0.0 | 1.2 | REACTOME PURINE SALVAGE | Genes involved in Purine salvage |
| 0.0 | 0.7 | REACTOME NFKB ACTIVATION THROUGH FADD RIP1 PATHWAY MEDIATED BY CASPASE 8 AND10 | Genes involved in NF-kB activation through FADD/RIP-1 pathway mediated by caspase-8 and -10 |
| 0.0 | 0.4 | REACTOME RECYCLING OF BILE ACIDS AND SALTS | Genes involved in Recycling of bile acids and salts |
| 0.0 | 0.9 | REACTOME TRAF3 DEPENDENT IRF ACTIVATION PATHWAY | Genes involved in TRAF3-dependent IRF activation pathway |
| 0.0 | 1.0 | REACTOME FACILITATIVE NA INDEPENDENT GLUCOSE TRANSPORTERS | Genes involved in Facilitative Na+-independent glucose transporters |
| 0.0 | 3.0 | REACTOME NETRIN1 SIGNALING | Genes involved in Netrin-1 signaling |
| 0.0 | 0.7 | REACTOME REVERSIBLE HYDRATION OF CARBON DIOXIDE | Genes involved in Reversible Hydration of Carbon Dioxide |
| 0.0 | 1.0 | REACTOME SIGNALING BY WNT | Genes involved in Signaling by Wnt |
| 0.0 | 9.4 | REACTOME SIGNALING BY RHO GTPASES | Genes involved in Signaling by Rho GTPases |
| 0.0 | 0.7 | REACTOME MTORC1 MEDIATED SIGNALLING | Genes involved in mTORC1-mediated signalling |
| 0.0 | 2.8 | REACTOME O LINKED GLYCOSYLATION OF MUCINS | Genes involved in O-linked glycosylation of mucins |
| 0.0 | 0.7 | REACTOME REGULATION OF IFNA SIGNALING | Genes involved in Regulation of IFNA signaling |
| 0.0 | 0.1 | REACTOME TRAF6 MEDIATED IRF7 ACTIVATION IN TLR7 8 OR 9 SIGNALING | Genes involved in TRAF6 mediated IRF7 activation in TLR7/8 or 9 signaling |
| 0.0 | 1.1 | REACTOME PYRIMIDINE METABOLISM | Genes involved in Pyrimidine metabolism |
| 0.0 | 0.2 | REACTOME YAP1 AND WWTR1 TAZ STIMULATED GENE EXPRESSION | Genes involved in YAP1- and WWTR1 (TAZ)-stimulated gene expression |
| 0.0 | 0.5 | REACTOME PURINE RIBONUCLEOSIDE MONOPHOSPHATE BIOSYNTHESIS | Genes involved in Purine ribonucleoside monophosphate biosynthesis |
| 0.0 | 0.4 | REACTOME CDT1 ASSOCIATION WITH THE CDC6 ORC ORIGIN COMPLEX | Genes involved in CDT1 association with the CDC6:ORC:origin complex |
| 0.0 | 0.5 | REACTOME ABC FAMILY PROTEINS MEDIATED TRANSPORT | Genes involved in ABC-family proteins mediated transport |
| 0.0 | 0.8 | REACTOME PLATELET AGGREGATION PLUG FORMATION | Genes involved in Platelet Aggregation (Plug Formation) |
| 0.0 | 0.3 | REACTOME ARMS MEDIATED ACTIVATION | Genes involved in ARMS-mediated activation |
| 0.0 | 0.1 | REACTOME TRANSPORT OF RIBONUCLEOPROTEINS INTO THE HOST NUCLEUS | Genes involved in Transport of Ribonucleoproteins into the Host Nucleus |
| 0.0 | 0.4 | REACTOME METABOLISM OF NON CODING RNA | Genes involved in Metabolism of non-coding RNA |
| 0.0 | 0.2 | REACTOME SYNTHESIS OF PC | Genes involved in Synthesis of PC |
| 0.0 | 0.6 | REACTOME DOWNSTREAM SIGNALING EVENTS OF B CELL RECEPTOR BCR | Genes involved in Downstream Signaling Events Of B Cell Receptor (BCR) |
| 0.0 | 0.1 | REACTOME RORA ACTIVATES CIRCADIAN EXPRESSION | Genes involved in RORA Activates Circadian Expression |
| 0.0 | 2.1 | REACTOME NUCLEAR RECEPTOR TRANSCRIPTION PATHWAY | Genes involved in Nuclear Receptor transcription pathway |
| 0.0 | 4.5 | REACTOME ANTIGEN PROCESSING UBIQUITINATION PROTEASOME DEGRADATION | Genes involved in Antigen processing: Ubiquitination & Proteasome degradation |
| 0.0 | 0.2 | REACTOME MICRORNA MIRNA BIOGENESIS | Genes involved in MicroRNA (miRNA) Biogenesis |
| 0.0 | 0.1 | REACTOME P53 INDEPENDENT G1 S DNA DAMAGE CHECKPOINT | Genes involved in p53-Independent G1/S DNA damage checkpoint |
| 0.0 | 0.2 | REACTOME GLUCOSE METABOLISM | Genes involved in Glucose metabolism |
| 0.0 | 0.6 | REACTOME INTEGRATION OF ENERGY METABOLISM | Genes involved in Integration of energy metabolism |
| 0.0 | 0.1 | REACTOME MRNA DECAY BY 3 TO 5 EXORIBONUCLEASE | Genes involved in mRNA Decay by 3' to 5' Exoribonuclease |
| 0.0 | 0.2 | REACTOME ACTIVATED AMPK STIMULATES FATTY ACID OXIDATION IN MUSCLE | Genes involved in Activated AMPK stimulates fatty-acid oxidation in muscle |
| 0.0 | 0.4 | REACTOME RNA POL II TRANSCRIPTION PRE INITIATION AND PROMOTER OPENING | Genes involved in RNA Polymerase II Transcription Pre-Initiation And Promoter Opening |