Project
avrg: Illumina Body Map 2 (GSE30611)
Navigation
Downloads
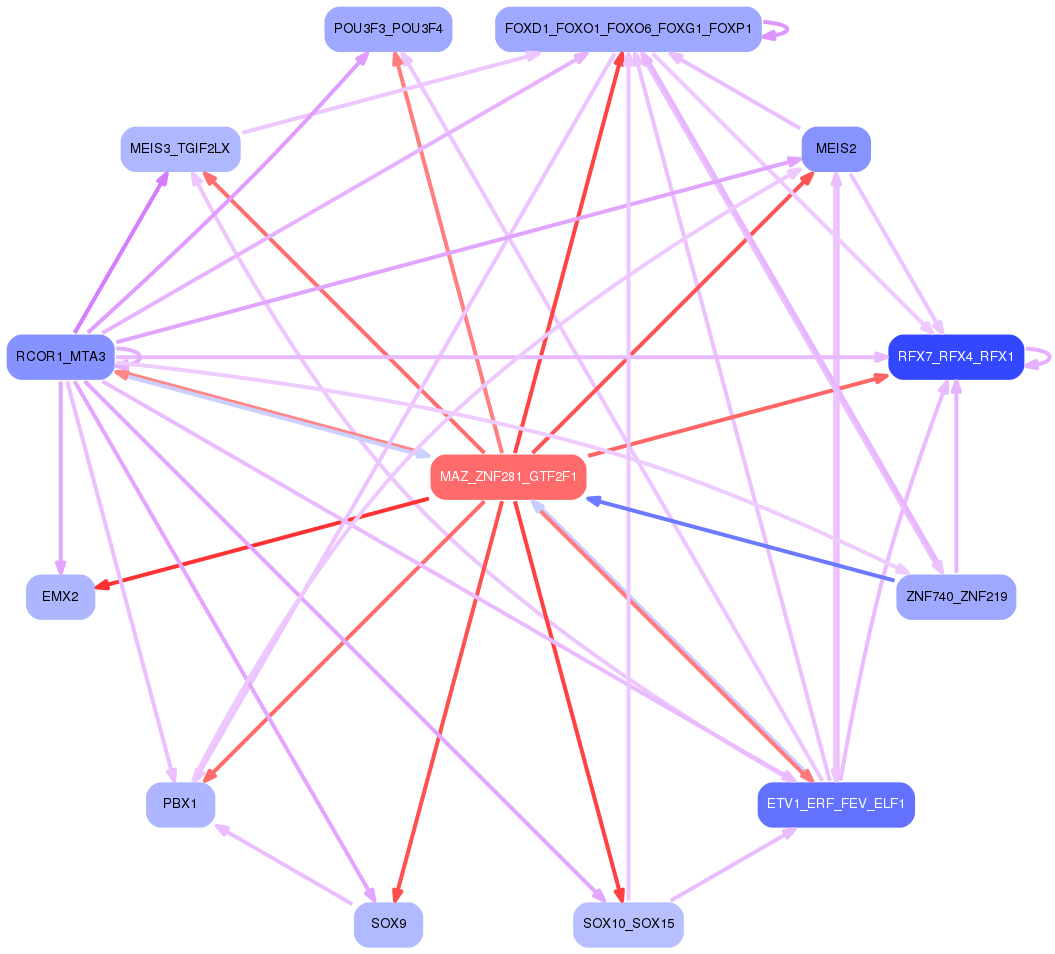
Results for MAZ_ZNF281_GTF2F1
Z-value: 4.85
Motif logo
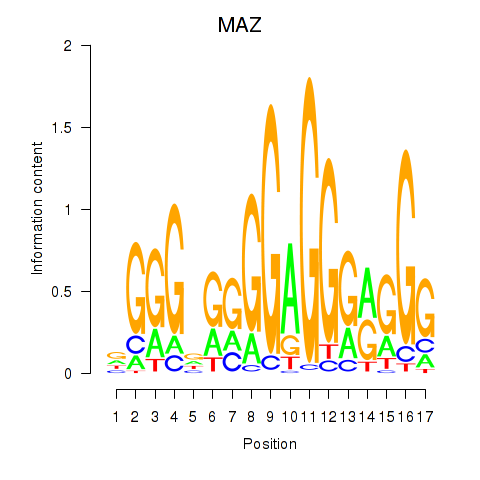
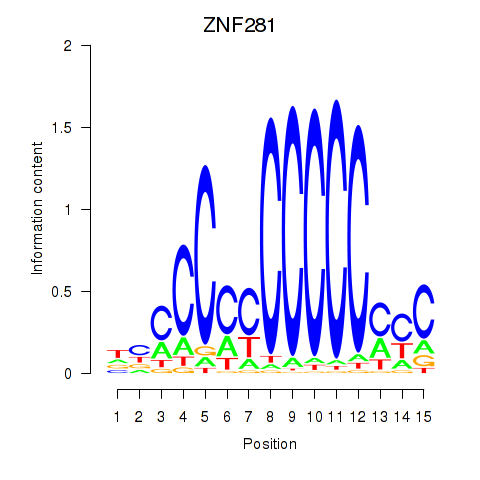
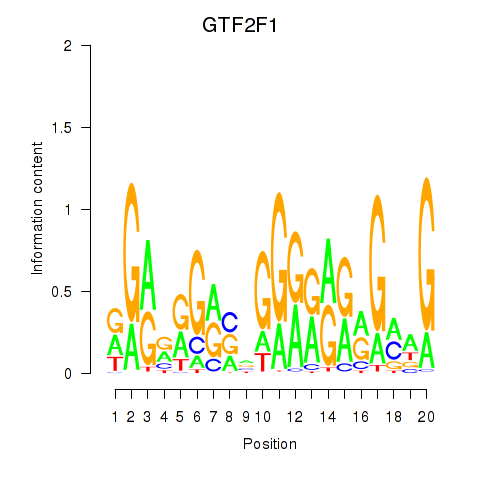
Transcription factors associated with MAZ_ZNF281_GTF2F1
| Gene Symbol | Gene ID | Gene Info |
|---|---|---|
|
MAZ
|
ENSG00000103495.14 | MAZ |
|
ZNF281
|
ENSG00000162702.8 | ZNF281 |
|
GTF2F1
|
ENSG00000125651.14 | GTF2F1 |
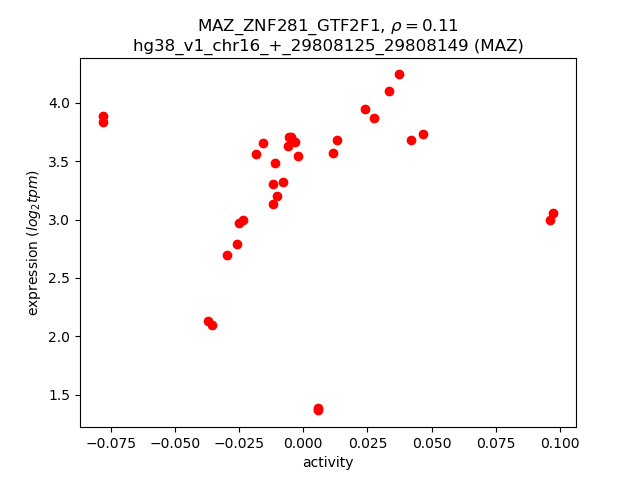
Activity-expression correlation:
| Gene | Promoter | Pearson corr. coef. | P-value | Plot |
|---|---|---|---|---|
| GTF2F1 | hg38_v1_chr19_-_6393205_6393218 | 0.43 | 1.5e-02 | Click! |
| MAZ | hg38_v1_chr16_+_29808125_29808149 | 0.11 | 5.6e-01 | Click! |
| ZNF281 | hg38_v1_chr1_-_200409976_200410000 | 0.03 | 8.5e-01 | Click! |
Activity profile of MAZ_ZNF281_GTF2F1 motif
Sorted Z-values of MAZ_ZNF281_GTF2F1 motif
Network of associatons between targets according to the STRING database.

First level regulatory network of MAZ_ZNF281_GTF2F1
Gene Ontology Analysis
Gene overrepresentation in biological process category:
| Log-likelihood per target | Total log-likelihood | Term | Description |
|---|---|---|---|
| 3.7 | 14.9 | GO:0060221 | retinal rod cell differentiation(GO:0060221) |
| 3.7 | 7.4 | GO:0021699 | cerebellum maturation(GO:0021590) cerebellar cortex maturation(GO:0021699) |
| 3.6 | 10.9 | GO:0051939 | gamma-aminobutyric acid import(GO:0051939) |
| 3.6 | 32.7 | GO:0031630 | regulation of synaptic vesicle fusion to presynaptic membrane(GO:0031630) |
| 3.5 | 14.1 | GO:0033693 | neurofilament bundle assembly(GO:0033693) |
| 3.3 | 10.0 | GO:1904692 | positive regulation of type B pancreatic cell proliferation(GO:1904692) |
| 3.3 | 50.0 | GO:0097116 | gephyrin clustering involved in postsynaptic density assembly(GO:0097116) |
| 3.0 | 9.1 | GO:1903422 | negative regulation of synaptic vesicle recycling(GO:1903422) |
| 3.0 | 12.0 | GO:0031117 | positive regulation of microtubule depolymerization(GO:0031117) |
| 3.0 | 8.9 | GO:1903280 | negative regulation of calcium:sodium antiporter activity(GO:1903280) |
| 2.9 | 8.6 | GO:0071206 | establishment of protein localization to juxtaparanode region of axon(GO:0071206) |
| 2.7 | 10.8 | GO:1990926 | short-term synaptic potentiation(GO:1990926) |
| 2.6 | 10.3 | GO:0019056 | modulation by virus of host transcription(GO:0019056) positive regulation of sprouting of injured axon(GO:0048687) positive regulation of axon extension involved in regeneration(GO:0048691) modulation by symbiont of host transcription(GO:0052026) |
| 2.5 | 12.7 | GO:0018352 | protein-pyridoxal-5-phosphate linkage(GO:0018352) |
| 2.5 | 42.8 | GO:2000821 | regulation of grooming behavior(GO:2000821) |
| 2.4 | 7.3 | GO:0021529 | spinal cord oligodendrocyte cell differentiation(GO:0021529) spinal cord oligodendrocyte cell fate specification(GO:0021530) |
| 2.4 | 7.2 | GO:0003064 | regulation of heart rate by hormone(GO:0003064) |
| 2.3 | 11.7 | GO:0015688 | iron chelate transport(GO:0015688) siderophore transport(GO:0015891) |
| 2.3 | 4.6 | GO:0014052 | regulation of gamma-aminobutyric acid secretion(GO:0014052) |
| 2.3 | 31.6 | GO:0070495 | regulation of thrombin receptor signaling pathway(GO:0070494) negative regulation of thrombin receptor signaling pathway(GO:0070495) |
| 2.1 | 14.5 | GO:1903288 | positive regulation of potassium ion import(GO:1903288) |
| 2.1 | 20.5 | GO:0018231 | peptidyl-L-cysteine S-palmitoylation(GO:0018230) peptidyl-S-diacylglycerol-L-cysteine biosynthetic process from peptidyl-cysteine(GO:0018231) |
| 2.0 | 8.1 | GO:0072023 | thick ascending limb development(GO:0072023) metanephric thick ascending limb development(GO:0072233) |
| 2.0 | 31.7 | GO:0021942 | radial glia guided migration of Purkinje cell(GO:0021942) |
| 2.0 | 7.9 | GO:0035498 | carnosine metabolic process(GO:0035498) |
| 2.0 | 5.9 | GO:0070093 | negative regulation of glucagon secretion(GO:0070093) |
| 2.0 | 11.8 | GO:0093001 | glycolysis from storage polysaccharide through glucose-1-phosphate(GO:0093001) |
| 2.0 | 2.0 | GO:0033602 | negative regulation of dopamine secretion(GO:0033602) |
| 1.9 | 15.6 | GO:1902612 | regulation of anti-Mullerian hormone signaling pathway(GO:1902612) negative regulation of anti-Mullerian hormone signaling pathway(GO:1902613) anti-Mullerian hormone signaling pathway(GO:1990262) |
| 1.9 | 1.9 | GO:0061341 | non-canonical Wnt signaling pathway involved in heart development(GO:0061341) planar cell polarity pathway involved in heart morphogenesis(GO:0061346) |
| 1.9 | 11.6 | GO:0015961 | diadenosine polyphosphate catabolic process(GO:0015961) diphosphoinositol polyphosphate metabolic process(GO:0071543) diadenosine pentaphosphate metabolic process(GO:1901906) diadenosine pentaphosphate catabolic process(GO:1901907) diadenosine hexaphosphate metabolic process(GO:1901908) diadenosine hexaphosphate catabolic process(GO:1901909) adenosine 5'-(hexahydrogen pentaphosphate) metabolic process(GO:1901910) adenosine 5'-(hexahydrogen pentaphosphate) catabolic process(GO:1901911) |
| 1.9 | 13.1 | GO:0031161 | phosphatidylinositol catabolic process(GO:0031161) |
| 1.9 | 5.6 | GO:0006173 | dADP biosynthetic process(GO:0006173) |
| 1.9 | 44.4 | GO:0048172 | regulation of short-term neuronal synaptic plasticity(GO:0048172) |
| 1.8 | 27.2 | GO:0030007 | cellular potassium ion homeostasis(GO:0030007) |
| 1.8 | 105.8 | GO:0007214 | gamma-aminobutyric acid signaling pathway(GO:0007214) |
| 1.8 | 7.0 | GO:1905073 | occluding junction disassembly(GO:1905071) regulation of occluding junction disassembly(GO:1905073) positive regulation of occluding junction disassembly(GO:1905075) |
| 1.7 | 3.4 | GO:0008050 | female courtship behavior(GO:0008050) |
| 1.7 | 6.9 | GO:0040040 | thermosensory behavior(GO:0040040) |
| 1.7 | 6.8 | GO:1904529 | regulation of actin filament binding(GO:1904529) regulation of actin binding(GO:1904616) |
| 1.7 | 11.9 | GO:0050893 | sensory processing(GO:0050893) |
| 1.7 | 1.7 | GO:2000211 | regulation of glutamate metabolic process(GO:2000211) |
| 1.7 | 1.7 | GO:0097114 | NMDA glutamate receptor clustering(GO:0097114) |
| 1.7 | 8.4 | GO:1901202 | negative regulation of extracellular matrix assembly(GO:1901202) |
| 1.6 | 4.9 | GO:0042137 | sequestering of neurotransmitter(GO:0042137) |
| 1.6 | 4.9 | GO:0050760 | negative regulation of thymidylate synthase biosynthetic process(GO:0050760) |
| 1.6 | 1.6 | GO:1902959 | regulation of aspartic-type endopeptidase activity involved in amyloid precursor protein catabolic process(GO:1902959) positive regulation of aspartic-type endopeptidase activity involved in amyloid precursor protein catabolic process(GO:1902961) regulation of aspartic-type peptidase activity(GO:1905245) positive regulation of aspartic-type peptidase activity(GO:1905247) |
| 1.6 | 4.8 | GO:0097274 | urea homeostasis(GO:0097274) |
| 1.6 | 12.8 | GO:0045163 | clustering of voltage-gated potassium channels(GO:0045163) |
| 1.6 | 6.4 | GO:0034628 | nicotinamide nucleotide biosynthetic process from aspartate(GO:0019355) 'de novo' NAD biosynthetic process from aspartate(GO:0034628) |
| 1.5 | 3.1 | GO:0086013 | membrane repolarization during cardiac muscle cell action potential(GO:0086013) |
| 1.5 | 26.1 | GO:0070445 | oligodendrocyte progenitor proliferation(GO:0070444) regulation of oligodendrocyte progenitor proliferation(GO:0070445) |
| 1.5 | 4.5 | GO:0070256 | negative regulation of circadian sleep/wake cycle, non-REM sleep(GO:0042323) negative regulation of mucus secretion(GO:0070256) |
| 1.5 | 7.5 | GO:1990504 | dense core granule exocytosis(GO:1990504) |
| 1.5 | 23.9 | GO:0070779 | D-aspartate transport(GO:0070777) D-aspartate import(GO:0070779) |
| 1.5 | 39.7 | GO:0001675 | acrosome assembly(GO:0001675) |
| 1.5 | 8.8 | GO:0021966 | corticospinal neuron axon guidance(GO:0021966) |
| 1.5 | 5.8 | GO:0016103 | diterpenoid catabolic process(GO:0016103) retinoic acid catabolic process(GO:0034653) |
| 1.5 | 7.3 | GO:0071393 | cellular response to progesterone stimulus(GO:0071393) |
| 1.4 | 2.9 | GO:0071874 | cellular response to norepinephrine stimulus(GO:0071874) |
| 1.4 | 10.0 | GO:0030421 | defecation(GO:0030421) |
| 1.4 | 5.7 | GO:1900533 | medium-chain fatty-acyl-CoA catabolic process(GO:0036114) long-chain fatty-acyl-CoA catabolic process(GO:0036116) palmitic acid metabolic process(GO:1900533) palmitic acid biosynthetic process(GO:1900535) |
| 1.4 | 8.4 | GO:0030035 | microspike assembly(GO:0030035) |
| 1.4 | 18.2 | GO:0016198 | axon choice point recognition(GO:0016198) |
| 1.4 | 4.2 | GO:0072720 | response to dithiothreitol(GO:0072720) |
| 1.4 | 5.5 | GO:0030644 | cellular chloride ion homeostasis(GO:0030644) |
| 1.4 | 6.8 | GO:0042494 | detection of bacterial lipoprotein(GO:0042494) |
| 1.3 | 4.0 | GO:1902598 | creatine transport(GO:0015881) creatine transmembrane transport(GO:1902598) |
| 1.3 | 6.7 | GO:0033058 | directional locomotion(GO:0033058) |
| 1.3 | 4.0 | GO:0000412 | histone peptidyl-prolyl isomerization(GO:0000412) |
| 1.3 | 15.7 | GO:0003190 | atrioventricular valve formation(GO:0003190) |
| 1.3 | 9.1 | GO:0051612 | negative regulation of neurotransmitter uptake(GO:0051581) regulation of serotonin uptake(GO:0051611) negative regulation of serotonin uptake(GO:0051612) |
| 1.3 | 14.0 | GO:2000601 | positive regulation of Arp2/3 complex-mediated actin nucleation(GO:2000601) |
| 1.3 | 3.8 | GO:1904204 | regulation of skeletal muscle hypertrophy(GO:1904204) |
| 1.3 | 5.0 | GO:1902683 | regulation of receptor localization to synapse(GO:1902683) |
| 1.3 | 23.8 | GO:0090361 | platelet-derived growth factor production(GO:0090360) regulation of platelet-derived growth factor production(GO:0090361) |
| 1.2 | 6.1 | GO:0030070 | insulin processing(GO:0030070) |
| 1.2 | 7.3 | GO:2000302 | positive regulation of synaptic vesicle exocytosis(GO:2000302) |
| 1.2 | 2.4 | GO:0031133 | regulation of axon diameter(GO:0031133) |
| 1.2 | 3.6 | GO:1903367 | positive regulation of fear response(GO:1903367) positive regulation of behavioral fear response(GO:2000987) |
| 1.2 | 4.7 | GO:0038060 | nitric oxide-cGMP-mediated signaling pathway(GO:0038060) |
| 1.2 | 10.6 | GO:0007197 | adenylate cyclase-inhibiting G-protein coupled acetylcholine receptor signaling pathway(GO:0007197) |
| 1.2 | 1.2 | GO:0046959 | habituation(GO:0046959) |
| 1.2 | 17.5 | GO:0019227 | neuronal action potential propagation(GO:0019227) action potential propagation(GO:0098870) |
| 1.1 | 2.3 | GO:0014051 | gamma-aminobutyric acid secretion(GO:0014051) |
| 1.1 | 3.4 | GO:0072134 | nephrogenic mesenchyme morphogenesis(GO:0072134) |
| 1.1 | 4.5 | GO:0061163 | endoplasmic reticulum polarization(GO:0061163) actin filament bundle retrograde transport(GO:0061573) actin filament bundle distribution(GO:0070650) |
| 1.1 | 5.6 | GO:0002318 | myeloid progenitor cell differentiation(GO:0002318) |
| 1.1 | 5.6 | GO:0008628 | hormone-mediated apoptotic signaling pathway(GO:0008628) |
| 1.1 | 5.6 | GO:1904141 | mammary gland fat development(GO:0060611) positive regulation of macrophage colony-stimulating factor signaling pathway(GO:1902228) positive regulation of response to macrophage colony-stimulating factor(GO:1903971) positive regulation of cellular response to macrophage colony-stimulating factor stimulus(GO:1903974) positive regulation of microglial cell migration(GO:1904141) |
| 1.1 | 6.7 | GO:0098746 | fast, calcium ion-dependent exocytosis of neurotransmitter(GO:0098746) |
| 1.1 | 3.3 | GO:0051039 | histone displacement(GO:0001207) positive regulation of transcription involved in meiotic cell cycle(GO:0051039) |
| 1.1 | 1.1 | GO:0048686 | regulation of sprouting of injured axon(GO:0048686) regulation of axon extension involved in regeneration(GO:0048690) |
| 1.1 | 14.4 | GO:0031115 | negative regulation of microtubule polymerization(GO:0031115) |
| 1.1 | 16.6 | GO:0010499 | proteasomal ubiquitin-independent protein catabolic process(GO:0010499) |
| 1.1 | 5.5 | GO:0035544 | negative regulation of SNARE complex assembly(GO:0035544) |
| 1.1 | 2.2 | GO:0061394 | regulation of transcription from RNA polymerase II promoter in response to arsenic-containing substance(GO:0061394) |
| 1.1 | 5.5 | GO:0097210 | response to gonadotropin-releasing hormone(GO:0097210) cellular response to gonadotropin-releasing hormone(GO:0097211) |
| 1.1 | 5.4 | GO:1905205 | positive regulation of connective tissue replacement(GO:1905205) |
| 1.1 | 5.4 | GO:0099558 | maintenance of synapse structure(GO:0099558) |
| 1.1 | 3.3 | GO:1905053 | regulation of base-excision repair(GO:1905051) positive regulation of base-excision repair(GO:1905053) |
| 1.1 | 23.7 | GO:0019800 | peptide cross-linking via chondroitin 4-sulfate glycosaminoglycan(GO:0019800) |
| 1.1 | 1.1 | GO:0014048 | regulation of glutamate secretion(GO:0014048) |
| 1.1 | 36.5 | GO:0061577 | calcium ion transmembrane transport via high voltage-gated calcium channel(GO:0061577) |
| 1.1 | 2.1 | GO:1901069 | guanosine-containing compound catabolic process(GO:1901069) |
| 1.1 | 3.2 | GO:1902722 | positive regulation of prolactin secretion(GO:1902722) |
| 1.1 | 30.0 | GO:2000311 | regulation of alpha-amino-3-hydroxy-5-methyl-4-isoxazole propionate selective glutamate receptor activity(GO:2000311) |
| 1.1 | 3.2 | GO:0032289 | central nervous system myelin formation(GO:0032289) |
| 1.1 | 3.2 | GO:1904956 | regulation of midbrain dopaminergic neuron differentiation(GO:1904956) |
| 1.1 | 3.2 | GO:0045715 | negative regulation of low-density lipoprotein particle receptor biosynthetic process(GO:0045715) |
| 1.1 | 2.1 | GO:2000793 | cell proliferation involved in heart valve development(GO:2000793) |
| 1.1 | 3.2 | GO:0070563 | negative regulation of vitamin D receptor signaling pathway(GO:0070563) |
| 1.1 | 5.3 | GO:0038026 | reelin-mediated signaling pathway(GO:0038026) |
| 1.0 | 4.2 | GO:0050915 | sensory perception of sour taste(GO:0050915) |
| 1.0 | 3.1 | GO:0060981 | cell migration involved in coronary angiogenesis(GO:0060981) |
| 1.0 | 3.1 | GO:0042660 | positive regulation of cell fate specification(GO:0042660) |
| 1.0 | 3.1 | GO:1990764 | regulation of myofibroblast contraction(GO:1904328) myofibroblast contraction(GO:1990764) |
| 1.0 | 15.5 | GO:0090394 | negative regulation of excitatory postsynaptic potential(GO:0090394) |
| 1.0 | 5.2 | GO:0014050 | negative regulation of glutamate secretion(GO:0014050) |
| 1.0 | 4.1 | GO:0009956 | radial pattern formation(GO:0009956) |
| 1.0 | 3.1 | GO:0035378 | carbon dioxide transmembrane transport(GO:0035378) |
| 1.0 | 1.0 | GO:2000465 | regulation of glycogen (starch) synthase activity(GO:2000465) |
| 1.0 | 3.1 | GO:1990258 | box C/D snoRNA 3'-end processing(GO:0000494) box C/D snoRNA metabolic process(GO:0033967) box C/D snoRNA processing(GO:0034963) histone glutamine methylation(GO:1990258) |
| 1.0 | 7.1 | GO:0097105 | presynaptic membrane assembly(GO:0097105) |
| 1.0 | 5.0 | GO:2001074 | regulation of metanephric ureteric bud development(GO:2001074) positive regulation of metanephric ureteric bud development(GO:2001076) |
| 1.0 | 6.0 | GO:2000195 | negative regulation of female gonad development(GO:2000195) |
| 1.0 | 4.0 | GO:0097350 | neutrophil clearance(GO:0097350) |
| 1.0 | 3.0 | GO:0099538 | synaptic signaling via neuropeptide(GO:0099538) trans-synaptic signaling by neuropeptide(GO:0099540) trans-synaptic signaling by neuropeptide, modulating synaptic transmission(GO:0099551) |
| 1.0 | 1.0 | GO:0021626 | hindbrain maturation(GO:0021578) central nervous system maturation(GO:0021626) |
| 1.0 | 3.9 | GO:0035054 | embryonic heart tube anterior/posterior pattern specification(GO:0035054) |
| 1.0 | 2.9 | GO:0060385 | axonogenesis involved in innervation(GO:0060385) |
| 1.0 | 16.4 | GO:0021681 | cerebellar granular layer development(GO:0021681) |
| 1.0 | 25.0 | GO:0032291 | central nervous system myelination(GO:0022010) axon ensheathment in central nervous system(GO:0032291) |
| 1.0 | 8.6 | GO:0033564 | anterior/posterior axon guidance(GO:0033564) |
| 0.9 | 8.5 | GO:1902473 | regulation of protein localization to synapse(GO:1902473) |
| 0.9 | 39.7 | GO:0035640 | exploration behavior(GO:0035640) |
| 0.9 | 9.4 | GO:0099566 | regulation of postsynaptic cytosolic calcium ion concentration(GO:0099566) |
| 0.9 | 3.7 | GO:1903892 | negative regulation of ATF6-mediated unfolded protein response(GO:1903892) |
| 0.9 | 12.9 | GO:0007621 | negative regulation of female receptivity(GO:0007621) |
| 0.9 | 2.7 | GO:0002588 | positive regulation of antigen processing and presentation of peptide or polysaccharide antigen via MHC class II(GO:0002582) positive regulation of antigen processing and presentation of peptide antigen(GO:0002585) positive regulation of antigen processing and presentation of peptide antigen via MHC class II(GO:0002588) |
| 0.9 | 8.1 | GO:0000395 | mRNA 5'-splice site recognition(GO:0000395) |
| 0.9 | 0.9 | GO:0015670 | carbon dioxide transport(GO:0015670) |
| 0.9 | 11.7 | GO:0098887 | neurotransmitter receptor transport, endosome to postsynaptic membrane(GO:0098887) |
| 0.9 | 0.9 | GO:1990709 | presynaptic active zone organization(GO:1990709) |
| 0.9 | 3.6 | GO:0031455 | glycine betaine biosynthetic process from choline(GO:0019285) glycine betaine metabolic process(GO:0031455) glycine betaine biosynthetic process(GO:0031456) |
| 0.9 | 2.7 | GO:0060081 | membrane hyperpolarization(GO:0060081) |
| 0.9 | 5.3 | GO:0045964 | positive regulation of catecholamine metabolic process(GO:0045915) positive regulation of dopamine metabolic process(GO:0045964) |
| 0.9 | 1.8 | GO:0051885 | positive regulation of anagen(GO:0051885) |
| 0.9 | 20.1 | GO:0007021 | tubulin complex assembly(GO:0007021) |
| 0.9 | 5.2 | GO:1900454 | positive regulation of long term synaptic depression(GO:1900454) |
| 0.9 | 2.6 | GO:0060166 | olfactory pit development(GO:0060166) |
| 0.9 | 0.9 | GO:0060599 | lateral sprouting involved in mammary gland duct morphogenesis(GO:0060599) |
| 0.9 | 3.4 | GO:0060254 | regulation of N-terminal protein palmitoylation(GO:0060254) negative regulation of N-terminal protein palmitoylation(GO:0060262) negative regulation of protein lipidation(GO:1903060) |
| 0.9 | 4.3 | GO:0044858 | plasma membrane raft distribution(GO:0044855) plasma membrane raft localization(GO:0044856) plasma membrane raft polarization(GO:0044858) regulation of plasma membrane raft polarization(GO:1903906) |
| 0.8 | 0.8 | GO:0016188 | synaptic vesicle maturation(GO:0016188) |
| 0.8 | 3.4 | GO:0098971 | anterograde dendritic transport of neurotransmitter receptor complex(GO:0098971) |
| 0.8 | 3.4 | GO:1905150 | regulation of voltage-gated sodium channel activity(GO:1905150) |
| 0.8 | 3.3 | GO:2000297 | negative regulation of synapse maturation(GO:2000297) |
| 0.8 | 2.5 | GO:0018963 | phthalate metabolic process(GO:0018963) |
| 0.8 | 5.8 | GO:0033159 | negative regulation of protein import into nucleus, translocation(GO:0033159) |
| 0.8 | 1.7 | GO:0033686 | positive regulation of luteinizing hormone secretion(GO:0033686) |
| 0.8 | 3.3 | GO:0000454 | snoRNA guided rRNA pseudouridine synthesis(GO:0000454) |
| 0.8 | 1.6 | GO:1900168 | glial cell-derived neurotrophic factor secretion(GO:0044467) regulation of glial cell-derived neurotrophic factor secretion(GO:1900166) positive regulation of glial cell-derived neurotrophic factor secretion(GO:1900168) |
| 0.8 | 5.7 | GO:0021831 | embryonic olfactory bulb interneuron precursor migration(GO:0021831) |
| 0.8 | 0.8 | GO:0061032 | visceral serous pericardium development(GO:0061032) |
| 0.8 | 11.4 | GO:0021869 | forebrain ventricular zone progenitor cell division(GO:0021869) |
| 0.8 | 2.4 | GO:1902630 | regulation of membrane hyperpolarization(GO:1902630) |
| 0.8 | 1.6 | GO:0021965 | spinal cord ventral commissure morphogenesis(GO:0021965) |
| 0.8 | 0.8 | GO:0010615 | positive regulation of cardiac muscle adaptation(GO:0010615) positive regulation of cardiac muscle hypertrophy in response to stress(GO:1903244) |
| 0.8 | 2.4 | GO:0036091 | positive regulation of transcription from RNA polymerase II promoter in response to oxidative stress(GO:0036091) |
| 0.8 | 8.7 | GO:2000324 | positive regulation of glucocorticoid receptor signaling pathway(GO:2000324) |
| 0.8 | 2.4 | GO:0003050 | regulation of systemic arterial blood pressure by atrial natriuretic peptide(GO:0003050) |
| 0.8 | 2.4 | GO:2000438 | CD24 biosynthetic process(GO:0035724) activation of meiosis involved in egg activation(GO:0060466) negative regulation of monocyte extravasation(GO:2000438) regulation of CD24 biosynthetic process(GO:2000559) positive regulation of CD24 biosynthetic process(GO:2000560) |
| 0.8 | 1.5 | GO:0008065 | establishment of blood-nerve barrier(GO:0008065) |
| 0.8 | 0.8 | GO:0071603 | endothelial cell-cell adhesion(GO:0071603) |
| 0.8 | 2.3 | GO:0061536 | glycine secretion(GO:0061536) glycine secretion, neurotransmission(GO:0061537) |
| 0.8 | 17.6 | GO:0031915 | positive regulation of synaptic plasticity(GO:0031915) |
| 0.8 | 2.3 | GO:0036353 | histone H2A-K119 monoubiquitination(GO:0036353) |
| 0.8 | 3.8 | GO:1900194 | negative regulation of oocyte maturation(GO:1900194) |
| 0.8 | 3.0 | GO:0021800 | cerebral cortex tangential migration(GO:0021800) |
| 0.7 | 4.5 | GO:0016185 | synaptic vesicle budding from presynaptic endocytic zone membrane(GO:0016185) |
| 0.7 | 3.7 | GO:0032425 | positive regulation of mismatch repair(GO:0032425) |
| 0.7 | 16.3 | GO:2000480 | negative regulation of cAMP-dependent protein kinase activity(GO:2000480) |
| 0.7 | 5.2 | GO:0021764 | amygdala development(GO:0021764) |
| 0.7 | 1.5 | GO:0035262 | gonad morphogenesis(GO:0035262) |
| 0.7 | 2.9 | GO:1901165 | positive regulation of trophoblast cell migration(GO:1901165) |
| 0.7 | 2.2 | GO:1901897 | regulation of relaxation of cardiac muscle(GO:1901897) |
| 0.7 | 5.1 | GO:0006535 | cysteine biosynthetic process from serine(GO:0006535) cysteine biosynthetic process via cystathionine(GO:0019343) |
| 0.7 | 1.4 | GO:0060316 | positive regulation of ryanodine-sensitive calcium-release channel activity(GO:0060316) |
| 0.7 | 2.9 | GO:0002541 | activation of plasma proteins involved in acute inflammatory response(GO:0002541) |
| 0.7 | 2.1 | GO:0031550 | positive regulation of brain-derived neurotrophic factor receptor signaling pathway(GO:0031550) |
| 0.7 | 12.1 | GO:0035414 | negative regulation of catenin import into nucleus(GO:0035414) |
| 0.7 | 27.5 | GO:0060074 | synapse maturation(GO:0060074) |
| 0.7 | 2.1 | GO:0009996 | negative regulation of cell fate specification(GO:0009996) |
| 0.7 | 10.6 | GO:0007258 | JUN phosphorylation(GO:0007258) |
| 0.7 | 7.0 | GO:2000467 | positive regulation of glycogen (starch) synthase activity(GO:2000467) |
| 0.7 | 2.1 | GO:0006864 | pyrimidine nucleotide transport(GO:0006864) mitochondrial pyrimidine nucleotide import(GO:1990519) |
| 0.7 | 0.7 | GO:0006589 | octopamine biosynthetic process(GO:0006589) octopamine metabolic process(GO:0046333) |
| 0.7 | 7.6 | GO:0036072 | intramembranous ossification(GO:0001957) direct ossification(GO:0036072) |
| 0.7 | 5.5 | GO:0061669 | spontaneous neurotransmitter secretion(GO:0061669) spontaneous synaptic transmission(GO:0098814) |
| 0.7 | 3.5 | GO:0051586 | positive regulation of dopamine uptake involved in synaptic transmission(GO:0051586) positive regulation of catecholamine uptake involved in synaptic transmission(GO:0051944) |
| 0.7 | 2.8 | GO:0031106 | septin ring assembly(GO:0000921) septin ring organization(GO:0031106) regulation of bleb assembly(GO:1904170) positive regulation of bleb assembly(GO:1904172) |
| 0.7 | 17.3 | GO:0071786 | endoplasmic reticulum tubular network organization(GO:0071786) |
| 0.7 | 0.7 | GO:0006620 | posttranslational protein targeting to membrane(GO:0006620) |
| 0.7 | 6.1 | GO:0010265 | SCF complex assembly(GO:0010265) |
| 0.7 | 4.0 | GO:0002760 | positive regulation of antimicrobial peptide production(GO:0002225) positive regulation of antimicrobial humoral response(GO:0002760) positive regulation of antibacterial peptide production(GO:0002803) |
| 0.7 | 2.0 | GO:1904237 | regulation of substrate-dependent cell migration, cell attachment to substrate(GO:1904235) positive regulation of substrate-dependent cell migration, cell attachment to substrate(GO:1904237) |
| 0.7 | 8.5 | GO:0055059 | asymmetric neuroblast division(GO:0055059) |
| 0.7 | 5.2 | GO:1900383 | regulation of synaptic plasticity by receptor localization to synapse(GO:1900383) |
| 0.7 | 1.3 | GO:0045650 | negative regulation of macrophage differentiation(GO:0045650) |
| 0.7 | 2.0 | GO:0003365 | establishment of cell polarity involved in ameboidal cell migration(GO:0003365) |
| 0.6 | 3.2 | GO:0060399 | positive regulation of growth hormone receptor signaling pathway(GO:0060399) |
| 0.6 | 7.1 | GO:0045162 | clustering of voltage-gated sodium channels(GO:0045162) |
| 0.6 | 0.6 | GO:1900377 | negative regulation of melanin biosynthetic process(GO:0048022) negative regulation of secondary metabolite biosynthetic process(GO:1900377) |
| 0.6 | 39.5 | GO:0007190 | activation of adenylate cyclase activity(GO:0007190) |
| 0.6 | 1.9 | GO:2000051 | negative regulation of non-canonical Wnt signaling pathway(GO:2000051) |
| 0.6 | 1.9 | GO:0006043 | glucosamine catabolic process(GO:0006043) |
| 0.6 | 3.8 | GO:0071638 | negative regulation of monocyte chemotactic protein-1 production(GO:0071638) |
| 0.6 | 1.9 | GO:2001013 | epithelial cell proliferation involved in renal tubule morphogenesis(GO:2001013) |
| 0.6 | 4.4 | GO:0015798 | myo-inositol transport(GO:0015798) |
| 0.6 | 6.3 | GO:1900449 | regulation of glutamate receptor signaling pathway(GO:1900449) |
| 0.6 | 2.5 | GO:0072287 | metanephric distal tubule morphogenesis(GO:0072287) |
| 0.6 | 3.1 | GO:1904565 | response to 1-oleoyl-sn-glycerol 3-phosphate(GO:1904565) cellular response to 1-oleoyl-sn-glycerol 3-phosphate(GO:1904566) |
| 0.6 | 9.3 | GO:0099612 | protein localization to axon(GO:0099612) |
| 0.6 | 13.0 | GO:1904714 | regulation of chaperone-mediated autophagy(GO:1904714) |
| 0.6 | 14.8 | GO:2001256 | regulation of store-operated calcium entry(GO:2001256) |
| 0.6 | 1.8 | GO:0051866 | general adaptation syndrome(GO:0051866) |
| 0.6 | 8.0 | GO:0048251 | elastic fiber assembly(GO:0048251) |
| 0.6 | 24.3 | GO:0048168 | regulation of neuronal synaptic plasticity(GO:0048168) |
| 0.6 | 3.0 | GO:0061086 | negative regulation of histone H3-K27 methylation(GO:0061086) |
| 0.6 | 4.8 | GO:0019236 | response to pheromone(GO:0019236) |
| 0.6 | 5.4 | GO:0043314 | negative regulation of neutrophil degranulation(GO:0043314) |
| 0.6 | 4.2 | GO:0051012 | microtubule sliding(GO:0051012) |
| 0.6 | 3.6 | GO:1904321 | response to forskolin(GO:1904321) cellular response to forskolin(GO:1904322) |
| 0.6 | 1.8 | GO:0051040 | regulation of calcium-independent cell-cell adhesion(GO:0051040) positive regulation of calcium-independent cell-cell adhesion(GO:0051041) |
| 0.6 | 1.8 | GO:0002121 | inter-male aggressive behavior(GO:0002121) |
| 0.6 | 9.5 | GO:0031284 | positive regulation of guanylate cyclase activity(GO:0031284) |
| 0.6 | 7.1 | GO:2000766 | negative regulation of cytoplasmic translation(GO:2000766) |
| 0.6 | 3.5 | GO:0060994 | regulation of transcription from RNA polymerase II promoter involved in kidney development(GO:0060994) |
| 0.6 | 0.6 | GO:1990009 | retinal cell apoptotic process(GO:1990009) |
| 0.6 | 0.6 | GO:0042661 | regulation of mesodermal cell fate specification(GO:0042661) |
| 0.6 | 2.3 | GO:1990535 | neuron projection maintenance(GO:1990535) |
| 0.6 | 2.9 | GO:0072675 | osteoclast fusion(GO:0072675) |
| 0.6 | 2.3 | GO:0070317 | negative regulation of G0 to G1 transition(GO:0070317) |
| 0.6 | 1.7 | GO:0019614 | catechol-containing compound catabolic process(GO:0019614) catecholamine catabolic process(GO:0042424) |
| 0.6 | 6.3 | GO:1990573 | potassium ion import across plasma membrane(GO:1990573) |
| 0.6 | 7.4 | GO:0097091 | synaptic vesicle clustering(GO:0097091) |
| 0.6 | 2.3 | GO:0048749 | compound eye development(GO:0048749) |
| 0.6 | 2.3 | GO:0051410 | detoxification of nitrogen compound(GO:0051410) cellular detoxification of nitrogen compound(GO:0070458) |
| 0.6 | 6.8 | GO:0007196 | adenylate cyclase-inhibiting G-protein coupled glutamate receptor signaling pathway(GO:0007196) |
| 0.6 | 8.5 | GO:0007158 | neuron cell-cell adhesion(GO:0007158) |
| 0.6 | 1.7 | GO:0014719 | skeletal muscle satellite cell activation(GO:0014719) |
| 0.6 | 2.8 | GO:0042659 | regulation of cell fate specification(GO:0042659) |
| 0.6 | 4.5 | GO:0015812 | gamma-aminobutyric acid transport(GO:0015812) |
| 0.6 | 4.5 | GO:0046726 | positive regulation by virus of viral protein levels in host cell(GO:0046726) |
| 0.6 | 1.7 | GO:1903515 | regulation of calcium ion-dependent exocytosis of neurotransmitter(GO:1903233) calcium ion transport from cytosol to endoplasmic reticulum(GO:1903515) |
| 0.6 | 1.7 | GO:0060723 | spongiotrophoblast cell proliferation(GO:0060720) regulation of spongiotrophoblast cell proliferation(GO:0060721) cell proliferation involved in embryonic placenta development(GO:0060722) regulation of cell proliferation involved in embryonic placenta development(GO:0060723) |
| 0.6 | 44.6 | GO:0051965 | positive regulation of synapse assembly(GO:0051965) |
| 0.5 | 1.6 | GO:1902299 | pre-replicative complex assembly involved in nuclear cell cycle DNA replication(GO:0006267) pre-replicative complex assembly(GO:0036388) pre-replicative complex assembly involved in cell cycle DNA replication(GO:1902299) |
| 0.5 | 6.0 | GO:1990034 | calcium ion export from cell(GO:1990034) |
| 0.5 | 1.1 | GO:1902746 | regulation of lens fiber cell differentiation(GO:1902746) |
| 0.5 | 1.6 | GO:0031104 | dendrite regeneration(GO:0031104) |
| 0.5 | 2.2 | GO:2000298 | regulation of Rho-dependent protein serine/threonine kinase activity(GO:2000298) |
| 0.5 | 0.5 | GO:0061298 | retina vasculature development in camera-type eye(GO:0061298) |
| 0.5 | 2.2 | GO:1903644 | regulation of chaperone-mediated protein folding(GO:1903644) |
| 0.5 | 2.7 | GO:0010644 | cell communication by electrical coupling(GO:0010644) |
| 0.5 | 5.4 | GO:0042428 | serotonin metabolic process(GO:0042428) |
| 0.5 | 2.7 | GO:0070459 | prolactin secretion(GO:0070459) |
| 0.5 | 0.5 | GO:0035038 | female pronucleus assembly(GO:0035038) |
| 0.5 | 2.1 | GO:1900114 | positive regulation of histone H3-K9 trimethylation(GO:1900114) |
| 0.5 | 2.1 | GO:0021784 | postganglionic parasympathetic fiber development(GO:0021784) |
| 0.5 | 0.5 | GO:1900273 | positive regulation of long-term synaptic potentiation(GO:1900273) |
| 0.5 | 11.7 | GO:1904706 | negative regulation of vascular smooth muscle cell proliferation(GO:1904706) |
| 0.5 | 8.0 | GO:0008090 | retrograde axonal transport(GO:0008090) |
| 0.5 | 2.6 | GO:0044830 | modulation by host of viral RNA genome replication(GO:0044830) positive regulation of intracellular transport of viral material(GO:1901254) |
| 0.5 | 2.1 | GO:0045212 | negative regulation of synaptic transmission, cholinergic(GO:0032223) neurotransmitter receptor biosynthetic process(GO:0045212) |
| 0.5 | 21.5 | GO:1903861 | positive regulation of dendrite extension(GO:1903861) |
| 0.5 | 2.6 | GO:0098904 | regulation of AV node cell action potential(GO:0098904) |
| 0.5 | 2.6 | GO:0070982 | L-asparagine biosynthetic process(GO:0070981) L-asparagine metabolic process(GO:0070982) |
| 0.5 | 9.4 | GO:0050884 | neuromuscular process controlling posture(GO:0050884) |
| 0.5 | 18.7 | GO:0010971 | positive regulation of G2/M transition of mitotic cell cycle(GO:0010971) |
| 0.5 | 5.2 | GO:0021914 | negative regulation of smoothened signaling pathway involved in ventral spinal cord patterning(GO:0021914) |
| 0.5 | 3.6 | GO:0021859 | pyramidal neuron differentiation(GO:0021859) |
| 0.5 | 1.0 | GO:0098712 | L-glutamate import across plasma membrane(GO:0098712) |
| 0.5 | 2.1 | GO:0019087 | transformation of host cell by virus(GO:0019087) |
| 0.5 | 2.1 | GO:0060029 | convergent extension involved in organogenesis(GO:0060029) |
| 0.5 | 2.0 | GO:0060075 | regulation of resting membrane potential(GO:0060075) |
| 0.5 | 22.0 | GO:0035235 | ionotropic glutamate receptor signaling pathway(GO:0035235) |
| 0.5 | 2.0 | GO:0072102 | glomerulus morphogenesis(GO:0072102) |
| 0.5 | 1.0 | GO:0034226 | lysine import(GO:0034226) L-lysine import(GO:0061461) L-lysine import into cell(GO:1903410) |
| 0.5 | 1.0 | GO:0097106 | postsynaptic density organization(GO:0097106) |
| 0.5 | 0.5 | GO:0097252 | oligodendrocyte apoptotic process(GO:0097252) |
| 0.5 | 22.4 | GO:0032292 | myelination in peripheral nervous system(GO:0022011) peripheral nervous system axon ensheathment(GO:0032292) |
| 0.5 | 3.5 | GO:0001920 | negative regulation of receptor recycling(GO:0001920) |
| 0.5 | 7.1 | GO:0070327 | thyroid hormone transport(GO:0070327) |
| 0.5 | 1.5 | GO:0021894 | cerebral cortex GABAergic interneuron development(GO:0021894) |
| 0.5 | 3.0 | GO:1903566 | positive regulation of protein localization to cilium(GO:1903566) |
| 0.5 | 1.0 | GO:1901491 | negative regulation of lymphangiogenesis(GO:1901491) |
| 0.5 | 11.9 | GO:0098815 | modulation of excitatory postsynaptic potential(GO:0098815) |
| 0.5 | 4.5 | GO:0021902 | commitment of neuronal cell to specific neuron type in forebrain(GO:0021902) |
| 0.5 | 2.0 | GO:1904980 | positive regulation of endosome organization(GO:1904980) |
| 0.5 | 2.0 | GO:0032185 | septin cytoskeleton organization(GO:0032185) |
| 0.5 | 9.7 | GO:0021957 | corticospinal tract morphogenesis(GO:0021957) |
| 0.5 | 6.8 | GO:0034626 | fatty acid elongation, saturated fatty acid(GO:0019367) fatty acid elongation, unsaturated fatty acid(GO:0019368) fatty acid elongation, monounsaturated fatty acid(GO:0034625) fatty acid elongation, polyunsaturated fatty acid(GO:0034626) |
| 0.5 | 24.7 | GO:0046839 | phospholipid dephosphorylation(GO:0046839) |
| 0.5 | 14.5 | GO:0008038 | neuron recognition(GO:0008038) |
| 0.5 | 0.5 | GO:0072190 | ureter urothelium development(GO:0072190) |
| 0.5 | 5.8 | GO:0070120 | ciliary neurotrophic factor-mediated signaling pathway(GO:0070120) |
| 0.5 | 5.3 | GO:0006657 | CDP-choline pathway(GO:0006657) |
| 0.5 | 1.0 | GO:1903056 | regulation of melanosome organization(GO:1903056) |
| 0.5 | 8.6 | GO:1904261 | regulation of basement membrane assembly involved in embryonic body morphogenesis(GO:1904259) positive regulation of basement membrane assembly involved in embryonic body morphogenesis(GO:1904261) basement membrane assembly involved in embryonic body morphogenesis(GO:2001197) |
| 0.5 | 1.4 | GO:0099526 | presynaptic signal transduction(GO:0098928) presynapse to nucleus signaling pathway(GO:0099526) |
| 0.5 | 3.3 | GO:0097461 | ferric iron import into cell(GO:0097461) ferric iron import across plasma membrane(GO:0098706) |
| 0.5 | 0.5 | GO:0038065 | collagen-activated signaling pathway(GO:0038065) |
| 0.5 | 2.4 | GO:0055011 | atrial cardiac muscle cell differentiation(GO:0055011) atrial cardiac muscle cell development(GO:0055014) |
| 0.5 | 0.5 | GO:0072034 | renal vesicle induction(GO:0072034) |
| 0.5 | 0.5 | GO:0072674 | multinuclear osteoclast differentiation(GO:0072674) |
| 0.5 | 0.5 | GO:2001184 | positive regulation of interleukin-12 secretion(GO:2001184) |
| 0.5 | 1.4 | GO:0042727 | flavin-containing compound biosynthetic process(GO:0042727) |
| 0.5 | 1.8 | GO:2000097 | regulation of smooth muscle cell-matrix adhesion(GO:2000097) |
| 0.5 | 7.4 | GO:0089711 | L-glutamate transmembrane transport(GO:0089711) |
| 0.5 | 4.6 | GO:0016191 | synaptic vesicle uncoating(GO:0016191) |
| 0.5 | 11.9 | GO:0021846 | cell proliferation in forebrain(GO:0021846) |
| 0.5 | 1.4 | GO:1904864 | regulation of beta-catenin-TCF complex assembly(GO:1904863) negative regulation of beta-catenin-TCF complex assembly(GO:1904864) |
| 0.5 | 8.7 | GO:2001135 | regulation of endocytic recycling(GO:2001135) |
| 0.5 | 10.9 | GO:0009437 | carnitine metabolic process(GO:0009437) |
| 0.5 | 2.3 | GO:2000686 | regulation of rubidium ion transmembrane transporter activity(GO:2000686) |
| 0.5 | 7.3 | GO:0045793 | positive regulation of cell size(GO:0045793) |
| 0.5 | 6.3 | GO:0035524 | proline transmembrane transport(GO:0035524) |
| 0.5 | 4.5 | GO:0008343 | adult feeding behavior(GO:0008343) |
| 0.5 | 4.1 | GO:0043615 | astrocyte cell migration(GO:0043615) |
| 0.5 | 0.9 | GO:0018916 | nitrobenzene metabolic process(GO:0018916) |
| 0.5 | 1.8 | GO:2000639 | regulation of SREBP signaling pathway(GO:2000638) negative regulation of SREBP signaling pathway(GO:2000639) |
| 0.4 | 4.0 | GO:0000160 | phosphorelay signal transduction system(GO:0000160) |
| 0.4 | 1.3 | GO:0048817 | regulation of monophenol monooxygenase activity(GO:0032771) positive regulation of monophenol monooxygenase activity(GO:0032773) negative regulation of hair follicle maturation(GO:0048817) negative regulation of catagen(GO:0051796) regulation of hair cycle by canonical Wnt signaling pathway(GO:0060901) regulation of melanosome transport(GO:1902908) positive regulation of melanosome transport(GO:1902910) |
| 0.4 | 0.4 | GO:1903413 | cellular response to bile acid(GO:1903413) |
| 0.4 | 6.6 | GO:0000733 | DNA strand renaturation(GO:0000733) |
| 0.4 | 1.8 | GO:0014028 | notochord formation(GO:0014028) |
| 0.4 | 1.8 | GO:0086016 | AV node cell action potential(GO:0086016) AV node cell to bundle of His cell signaling(GO:0086027) |
| 0.4 | 0.4 | GO:0021910 | smoothened signaling pathway involved in ventral spinal cord patterning(GO:0021910) |
| 0.4 | 1.3 | GO:2000562 | negative regulation of CD4-positive, alpha-beta T cell proliferation(GO:2000562) |
| 0.4 | 0.4 | GO:0098912 | membrane depolarization during atrial cardiac muscle cell action potential(GO:0098912) |
| 0.4 | 3.5 | GO:0097500 | receptor localization to nonmotile primary cilium(GO:0097500) |
| 0.4 | 2.2 | GO:0006669 | sphinganine-1-phosphate biosynthetic process(GO:0006669) |
| 0.4 | 0.4 | GO:0048371 | lateral mesodermal cell differentiation(GO:0048371) |
| 0.4 | 2.6 | GO:1905123 | regulation of glucosylceramidase activity(GO:1905123) |
| 0.4 | 2.6 | GO:0060373 | regulation of ventricular cardiac muscle cell membrane depolarization(GO:0060373) |
| 0.4 | 0.9 | GO:0015808 | L-alanine transport(GO:0015808) |
| 0.4 | 4.7 | GO:1904179 | regulation of adipose tissue development(GO:1904177) positive regulation of adipose tissue development(GO:1904179) |
| 0.4 | 21.8 | GO:0048791 | calcium ion-regulated exocytosis of neurotransmitter(GO:0048791) |
| 0.4 | 1.7 | GO:1903610 | regulation of calcium-dependent ATPase activity(GO:1903610) negative regulation of calcium-dependent ATPase activity(GO:1903611) regulation of dUTP diphosphatase activity(GO:1903627) positive regulation of dUTP diphosphatase activity(GO:1903629) negative regulation of aminoacyl-tRNA ligase activity(GO:1903631) regulation of leucine-tRNA ligase activity(GO:1903633) negative regulation of leucine-tRNA ligase activity(GO:1903634) |
| 0.4 | 2.5 | GO:0035507 | regulation of myosin-light-chain-phosphatase activity(GO:0035507) |
| 0.4 | 0.4 | GO:0010636 | positive regulation of mitochondrial fusion(GO:0010636) |
| 0.4 | 5.1 | GO:0048672 | positive regulation of collateral sprouting(GO:0048672) |
| 0.4 | 8.4 | GO:0001574 | ganglioside biosynthetic process(GO:0001574) |
| 0.4 | 0.4 | GO:0048669 | collateral sprouting in absence of injury(GO:0048669) |
| 0.4 | 3.3 | GO:0035093 | spermatogenesis, exchange of chromosomal proteins(GO:0035093) |
| 0.4 | 1.7 | GO:0060686 | negative regulation of prostatic bud formation(GO:0060686) |
| 0.4 | 1.7 | GO:0061002 | negative regulation of dendritic spine morphogenesis(GO:0061002) |
| 0.4 | 2.1 | GO:1901091 | regulation of protein tetramerization(GO:1901090) negative regulation of protein tetramerization(GO:1901091) regulation of protein homotetramerization(GO:1901093) negative regulation of protein homotetramerization(GO:1901094) |
| 0.4 | 2.0 | GO:0048808 | male genitalia morphogenesis(GO:0048808) male anatomical structure morphogenesis(GO:0090598) |
| 0.4 | 1.2 | GO:0009386 | translational attenuation(GO:0009386) |
| 0.4 | 1.2 | GO:1990172 | G-protein coupled receptor catabolic process(GO:1990172) |
| 0.4 | 6.1 | GO:0070050 | neuron cellular homeostasis(GO:0070050) |
| 0.4 | 4.9 | GO:0070294 | renal sodium ion transport(GO:0003096) renal sodium ion absorption(GO:0070294) |
| 0.4 | 4.0 | GO:0051694 | pointed-end actin filament capping(GO:0051694) |
| 0.4 | 1.6 | GO:0046603 | negative regulation of mitotic centrosome separation(GO:0046603) |
| 0.4 | 1.2 | GO:0019676 | ammonia assimilation cycle(GO:0019676) |
| 0.4 | 2.4 | GO:1903385 | regulation of homophilic cell adhesion(GO:1903385) |
| 0.4 | 0.8 | GO:0031282 | regulation of guanylate cyclase activity(GO:0031282) |
| 0.4 | 1.2 | GO:1901079 | positive regulation of relaxation of muscle(GO:1901079) positive regulation of relaxation of cardiac muscle(GO:1901899) |
| 0.4 | 3.2 | GO:0071279 | cellular response to cobalt ion(GO:0071279) |
| 0.4 | 1.2 | GO:0061357 | positive regulation of Wnt protein secretion(GO:0061357) |
| 0.4 | 2.0 | GO:0042360 | vitamin E metabolic process(GO:0042360) |
| 0.4 | 3.1 | GO:0071947 | protein deubiquitination involved in ubiquitin-dependent protein catabolic process(GO:0071947) |
| 0.4 | 4.3 | GO:2000253 | positive regulation of feeding behavior(GO:2000253) |
| 0.4 | 1.2 | GO:2000744 | anterior head development(GO:0097065) regulation of anterior head development(GO:2000742) positive regulation of anterior head development(GO:2000744) |
| 0.4 | 2.6 | GO:0060011 | Sertoli cell proliferation(GO:0060011) |
| 0.4 | 12.0 | GO:0038063 | collagen-activated tyrosine kinase receptor signaling pathway(GO:0038063) |
| 0.4 | 5.6 | GO:0098703 | calcium ion import across plasma membrane(GO:0098703) calcium ion import into cell(GO:1990035) |
| 0.4 | 1.9 | GO:0071500 | cellular response to nitrosative stress(GO:0071500) |
| 0.4 | 48.2 | GO:0007269 | neurotransmitter secretion(GO:0007269) signal release from synapse(GO:0099643) |
| 0.4 | 1.5 | GO:0099563 | modification of synaptic structure(GO:0099563) |
| 0.4 | 1.9 | GO:0060087 | relaxation of vascular smooth muscle(GO:0060087) |
| 0.4 | 0.7 | GO:1900220 | semaphorin-plexin signaling pathway involved in bone trabecula morphogenesis(GO:1900220) |
| 0.4 | 1.1 | GO:0033385 | geranylgeranyl diphosphate metabolic process(GO:0033385) geranylgeranyl diphosphate biosynthetic process(GO:0033386) |
| 0.4 | 0.7 | GO:0042704 | uterine wall breakdown(GO:0042704) |
| 0.4 | 4.0 | GO:0019919 | peptidyl-arginine methylation, to asymmetrical-dimethyl arginine(GO:0019919) |
| 0.4 | 1.1 | GO:0090315 | negative regulation of protein targeting to membrane(GO:0090315) |
| 0.4 | 1.1 | GO:2000851 | positive regulation of glucocorticoid secretion(GO:2000851) |
| 0.4 | 1.1 | GO:0001970 | positive regulation of activation of membrane attack complex(GO:0001970) |
| 0.4 | 1.1 | GO:1903401 | lysine transport(GO:0015819) L-lysine transport(GO:1902022) L-lysine transmembrane transport(GO:1903401) |
| 0.4 | 1.1 | GO:0006883 | cellular sodium ion homeostasis(GO:0006883) |
| 0.4 | 2.1 | GO:0070278 | extracellular matrix constituent secretion(GO:0070278) |
| 0.3 | 1.0 | GO:1904776 | regulation of protein localization to cell cortex(GO:1904776) positive regulation of protein localization to cell cortex(GO:1904778) |
| 0.3 | 2.8 | GO:0099601 | regulation of neurotransmitter receptor activity(GO:0099601) |
| 0.3 | 0.7 | GO:2000074 | regulation of type B pancreatic cell development(GO:2000074) |
| 0.3 | 0.3 | GO:0019336 | phenol-containing compound catabolic process(GO:0019336) |
| 0.3 | 1.0 | GO:0046416 | D-amino acid metabolic process(GO:0046416) |
| 0.3 | 1.0 | GO:0098828 | positive regulation of inhibitory postsynaptic potential(GO:0097151) modulation of inhibitory postsynaptic potential(GO:0098828) |
| 0.3 | 1.7 | GO:0032497 | detection of lipopolysaccharide(GO:0032497) |
| 0.3 | 1.0 | GO:0061567 | dADP phosphorylation(GO:0006174) dGDP phosphorylation(GO:0006186) AMP phosphorylation(GO:0006756) CDP phosphorylation(GO:0061508) dAMP phosphorylation(GO:0061565) CMP phosphorylation(GO:0061566) dCMP phosphorylation(GO:0061567) GDP phosphorylation(GO:0061568) UDP phosphorylation(GO:0061569) dCDP phosphorylation(GO:0061570) TDP phosphorylation(GO:0061571) |
| 0.3 | 0.3 | GO:0051097 | negative regulation of helicase activity(GO:0051097) |
| 0.3 | 0.3 | GO:0043619 | regulation of transcription from RNA polymerase II promoter in response to oxidative stress(GO:0043619) |
| 0.3 | 8.8 | GO:0033622 | integrin activation(GO:0033622) |
| 0.3 | 3.0 | GO:0031444 | slow-twitch skeletal muscle fiber contraction(GO:0031444) |
| 0.3 | 2.4 | GO:0043985 | histone H4-R3 methylation(GO:0043985) |
| 0.3 | 0.3 | GO:2000078 | positive regulation of type B pancreatic cell development(GO:2000078) |
| 0.3 | 4.7 | GO:0090385 | phagosome-lysosome fusion(GO:0090385) |
| 0.3 | 2.3 | GO:0035494 | SNARE complex disassembly(GO:0035494) |
| 0.3 | 13.9 | GO:0060997 | dendritic spine morphogenesis(GO:0060997) |
| 0.3 | 1.3 | GO:0000711 | meiotic DNA repair synthesis(GO:0000711) |
| 0.3 | 2.0 | GO:2000346 | negative regulation of hepatocyte proliferation(GO:2000346) |
| 0.3 | 1.0 | GO:0035788 | cell migration involved in metanephros development(GO:0035788) metanephric mesenchymal cell migration(GO:0035789) regulation of metanephric mesenchymal cell migration(GO:2000589) |
| 0.3 | 3.9 | GO:0018095 | protein polyglutamylation(GO:0018095) |
| 0.3 | 1.0 | GO:0070316 | regulation of G0 to G1 transition(GO:0070316) |
| 0.3 | 2.5 | GO:0035766 | cell chemotaxis to fibroblast growth factor(GO:0035766) endothelial cell chemotaxis to fibroblast growth factor(GO:0035768) regulation of cell chemotaxis to fibroblast growth factor(GO:1904847) regulation of endothelial cell chemotaxis to fibroblast growth factor(GO:2000544) |
| 0.3 | 8.5 | GO:0070208 | protein heterotrimerization(GO:0070208) |
| 0.3 | 1.9 | GO:0061760 | antifungal innate immune response(GO:0061760) |
| 0.3 | 2.2 | GO:0061299 | retina vasculature morphogenesis in camera-type eye(GO:0061299) |
| 0.3 | 1.6 | GO:0071468 | cellular response to acidic pH(GO:0071468) |
| 0.3 | 1.9 | GO:1990253 | cellular response to leucine starvation(GO:1990253) |
| 0.3 | 2.5 | GO:1900827 | maintenance of protein location in membrane(GO:0072658) maintenance of protein location in plasma membrane(GO:0072660) positive regulation of membrane depolarization during cardiac muscle cell action potential(GO:1900827) |
| 0.3 | 5.0 | GO:0016540 | protein autoprocessing(GO:0016540) |
| 0.3 | 4.3 | GO:0001573 | ganglioside metabolic process(GO:0001573) |
| 0.3 | 1.2 | GO:0033591 | response to L-ascorbic acid(GO:0033591) |
| 0.3 | 1.5 | GO:0045762 | positive regulation of adenylate cyclase activity(GO:0045762) |
| 0.3 | 3.4 | GO:2000795 | negative regulation of epithelial cell proliferation involved in lung morphogenesis(GO:2000795) |
| 0.3 | 1.2 | GO:0035519 | protein K29-linked ubiquitination(GO:0035519) |
| 0.3 | 3.1 | GO:0009134 | nucleoside diphosphate catabolic process(GO:0009134) |
| 0.3 | 1.2 | GO:0086043 | bundle of His cell to Purkinje myocyte signaling(GO:0086028) bundle of His cell action potential(GO:0086043) |
| 0.3 | 0.6 | GO:0010961 | cellular magnesium ion homeostasis(GO:0010961) |
| 0.3 | 1.2 | GO:1903575 | cornified envelope assembly(GO:1903575) |
| 0.3 | 1.2 | GO:0060168 | positive regulation of adenosine receptor signaling pathway(GO:0060168) |
| 0.3 | 0.6 | GO:0051695 | actin filament uncapping(GO:0051695) |
| 0.3 | 0.3 | GO:1903587 | regulation of blood vessel endothelial cell proliferation involved in sprouting angiogenesis(GO:1903587) negative regulation of blood vessel endothelial cell proliferation involved in sprouting angiogenesis(GO:1903588) |
| 0.3 | 2.1 | GO:0006975 | DNA damage induced protein phosphorylation(GO:0006975) |
| 0.3 | 3.0 | GO:0048149 | behavioral response to ethanol(GO:0048149) |
| 0.3 | 0.3 | GO:0086019 | cell-cell signaling involved in cardiac conduction(GO:0086019) |
| 0.3 | 1.2 | GO:2001247 | positive regulation of phosphatidylcholine biosynthetic process(GO:2001247) |
| 0.3 | 0.9 | GO:1903697 | negative regulation of microvillus assembly(GO:1903697) |
| 0.3 | 2.7 | GO:0035469 | determination of pancreatic left/right asymmetry(GO:0035469) |
| 0.3 | 1.2 | GO:0090131 | mesenchyme migration(GO:0090131) |
| 0.3 | 0.9 | GO:0019085 | early viral transcription(GO:0019085) |
| 0.3 | 1.8 | GO:0035063 | nuclear speck organization(GO:0035063) |
| 0.3 | 0.3 | GO:0048852 | diencephalon morphogenesis(GO:0048852) |
| 0.3 | 6.7 | GO:1900025 | negative regulation of substrate adhesion-dependent cell spreading(GO:1900025) |
| 0.3 | 0.9 | GO:0003147 | neural crest cell migration involved in heart formation(GO:0003147) cell migration involved in heart formation(GO:0060974) anterior neural tube closure(GO:0061713) |
| 0.3 | 1.7 | GO:0035105 | sterol regulatory element binding protein import into nucleus(GO:0035105) |
| 0.3 | 1.4 | GO:1903275 | regulation of sodium ion export(GO:1903273) positive regulation of sodium ion export(GO:1903275) regulation of sodium ion export from cell(GO:1903276) positive regulation of sodium ion export from cell(GO:1903278) |
| 0.3 | 10.9 | GO:0048268 | clathrin coat assembly(GO:0048268) |
| 0.3 | 1.7 | GO:0048050 | post-embryonic eye morphogenesis(GO:0048050) |
| 0.3 | 2.0 | GO:0045602 | negative regulation of endothelial cell differentiation(GO:0045602) |
| 0.3 | 2.8 | GO:0042754 | negative regulation of circadian rhythm(GO:0042754) |
| 0.3 | 1.7 | GO:0007506 | gonadal mesoderm development(GO:0007506) |
| 0.3 | 1.4 | GO:0048104 | establishment of body hair or bristle planar orientation(GO:0048104) establishment of body hair planar orientation(GO:0048105) |
| 0.3 | 1.1 | GO:1902463 | protein localization to cell leading edge(GO:1902463) |
| 0.3 | 3.4 | GO:1900004 | negative regulation of serine-type endopeptidase activity(GO:1900004) negative regulation of serine-type peptidase activity(GO:1902572) |
| 0.3 | 0.8 | GO:1990168 | protein K33-linked deubiquitination(GO:1990168) |
| 0.3 | 1.1 | GO:0032962 | positive regulation of inositol trisphosphate biosynthetic process(GO:0032962) |
| 0.3 | 0.3 | GO:0001560 | regulation of cell growth by extracellular stimulus(GO:0001560) |
| 0.3 | 1.9 | GO:0007352 | zygotic specification of dorsal/ventral axis(GO:0007352) |
| 0.3 | 1.9 | GO:0010968 | regulation of microtubule nucleation(GO:0010968) positive regulation of microtubule nucleation(GO:0090063) |
| 0.3 | 1.4 | GO:0045112 | integrin biosynthetic process(GO:0045112) |
| 0.3 | 1.1 | GO:0002143 | tRNA wobble position uridine thiolation(GO:0002143) |
| 0.3 | 3.6 | GO:0035360 | positive regulation of peroxisome proliferator activated receptor signaling pathway(GO:0035360) |
| 0.3 | 7.1 | GO:0032515 | negative regulation of phosphoprotein phosphatase activity(GO:0032515) |
| 0.3 | 3.3 | GO:1902083 | negative regulation of peptidyl-cysteine S-nitrosylation(GO:1902083) |
| 0.3 | 0.8 | GO:0010511 | regulation of phosphatidylinositol biosynthetic process(GO:0010511) |
| 0.3 | 7.1 | GO:0010765 | positive regulation of sodium ion transport(GO:0010765) |
| 0.3 | 0.5 | GO:0090427 | embryonic nail plate morphogenesis(GO:0035880) activation of meiosis(GO:0090427) |
| 0.3 | 7.8 | GO:0055003 | cardiac myofibril assembly(GO:0055003) |
| 0.3 | 1.6 | GO:0015755 | fructose transport(GO:0015755) fructose import(GO:0032445) carbohydrate import into cell(GO:0097319) carbohydrate import across plasma membrane(GO:0098704) fructose import across plasma membrane(GO:1990539) |
| 0.3 | 4.0 | GO:0014722 | regulation of skeletal muscle contraction by calcium ion signaling(GO:0014722) |
| 0.3 | 9.9 | GO:0097120 | receptor localization to synapse(GO:0097120) |
| 0.3 | 1.3 | GO:0030826 | regulation of cGMP biosynthetic process(GO:0030826) |
| 0.3 | 3.2 | GO:2000574 | regulation of microtubule motor activity(GO:2000574) |
| 0.3 | 7.7 | GO:0043567 | regulation of insulin-like growth factor receptor signaling pathway(GO:0043567) |
| 0.3 | 0.3 | GO:1900126 | negative regulation of hyaluronan biosynthetic process(GO:1900126) |
| 0.3 | 0.8 | GO:0032849 | positive regulation of cellular pH reduction(GO:0032849) |
| 0.3 | 2.9 | GO:2000786 | positive regulation of autophagosome assembly(GO:2000786) |
| 0.3 | 11.8 | GO:0032012 | regulation of ARF protein signal transduction(GO:0032012) |
| 0.3 | 1.6 | GO:0030579 | ubiquitin-dependent SMAD protein catabolic process(GO:0030579) |
| 0.3 | 1.8 | GO:0045586 | regulation of gamma-delta T cell differentiation(GO:0045586) |
| 0.3 | 0.3 | GO:0010641 | positive regulation of platelet-derived growth factor receptor signaling pathway(GO:0010641) |
| 0.3 | 7.3 | GO:0003351 | epithelial cilium movement(GO:0003351) |
| 0.3 | 0.8 | GO:0044335 | canonical Wnt signaling pathway involved in neural crest cell differentiation(GO:0044335) |
| 0.3 | 1.6 | GO:0060353 | regulation of cell adhesion molecule production(GO:0060353) |
| 0.3 | 2.3 | GO:0051127 | positive regulation of actin nucleation(GO:0051127) |
| 0.3 | 1.3 | GO:0009082 | branched-chain amino acid biosynthetic process(GO:0009082) leucine biosynthetic process(GO:0009098) valine biosynthetic process(GO:0009099) |
| 0.3 | 10.9 | GO:0014072 | response to isoquinoline alkaloid(GO:0014072) response to morphine(GO:0043278) |
| 0.3 | 1.5 | GO:0048478 | replication fork protection(GO:0048478) |
| 0.3 | 2.8 | GO:0033578 | protein glycosylation in Golgi(GO:0033578) |
| 0.3 | 1.5 | GO:0010760 | negative regulation of macrophage chemotaxis(GO:0010760) |
| 0.3 | 3.1 | GO:0032288 | myelin assembly(GO:0032288) |
| 0.3 | 2.1 | GO:0035542 | regulation of SNARE complex assembly(GO:0035542) |
| 0.3 | 32.6 | GO:0001578 | microtubule bundle formation(GO:0001578) |
| 0.3 | 0.8 | GO:1990834 | response to odorant(GO:1990834) |
| 0.3 | 0.3 | GO:0070309 | lens fiber cell morphogenesis(GO:0070309) |
| 0.3 | 3.8 | GO:0045475 | locomotor rhythm(GO:0045475) |
| 0.3 | 2.0 | GO:0035694 | mitochondrial protein catabolic process(GO:0035694) |
| 0.3 | 3.0 | GO:0090336 | positive regulation of brown fat cell differentiation(GO:0090336) |
| 0.3 | 0.5 | GO:0035502 | metanephric part of ureteric bud development(GO:0035502) |
| 0.3 | 2.5 | GO:0043951 | negative regulation of cAMP-mediated signaling(GO:0043951) |
| 0.3 | 4.3 | GO:0003322 | pancreatic A cell development(GO:0003322) |
| 0.2 | 2.2 | GO:0050775 | positive regulation of dendrite morphogenesis(GO:0050775) |
| 0.2 | 3.2 | GO:0042985 | negative regulation of amyloid precursor protein biosynthetic process(GO:0042985) |
| 0.2 | 0.7 | GO:2000656 | regulation of apolipoprotein binding(GO:2000656) negative regulation of apolipoprotein binding(GO:2000657) |
| 0.2 | 12.3 | GO:1901385 | regulation of voltage-gated calcium channel activity(GO:1901385) |
| 0.2 | 0.7 | GO:0031445 | regulation of heterochromatin assembly(GO:0031445) positive regulation of heterochromatin assembly(GO:0031453) |
| 0.2 | 1.0 | GO:0060478 | acrosomal vesicle exocytosis(GO:0060478) |
| 0.2 | 6.1 | GO:0070262 | peptidyl-serine dephosphorylation(GO:0070262) |
| 0.2 | 2.4 | GO:0002741 | positive regulation of cytokine secretion involved in immune response(GO:0002741) |
| 0.2 | 0.7 | GO:0008057 | eye pigment granule organization(GO:0008057) |
| 0.2 | 0.7 | GO:0031204 | posttranslational protein targeting to membrane, translocation(GO:0031204) |
| 0.2 | 28.5 | GO:1901379 | regulation of potassium ion transmembrane transport(GO:1901379) |
| 0.2 | 0.5 | GO:0038031 | non-canonical Wnt signaling pathway via JNK cascade(GO:0038031) |
| 0.2 | 1.9 | GO:0070831 | basement membrane assembly(GO:0070831) |
| 0.2 | 19.3 | GO:1903779 | regulation of cardiac conduction(GO:1903779) |
| 0.2 | 26.5 | GO:0006501 | C-terminal protein lipidation(GO:0006501) |
| 0.2 | 4.3 | GO:0042749 | regulation of circadian sleep/wake cycle(GO:0042749) |
| 0.2 | 0.7 | GO:0097010 | eukaryotic translation initiation factor 4F complex assembly(GO:0097010) |
| 0.2 | 3.3 | GO:0035878 | nail development(GO:0035878) |
| 0.2 | 1.9 | GO:0016129 | phytosteroid metabolic process(GO:0016128) phytosteroid biosynthetic process(GO:0016129) |
| 0.2 | 1.9 | GO:2000322 | regulation of glucocorticoid receptor signaling pathway(GO:2000322) |
| 0.2 | 4.9 | GO:0014850 | response to muscle activity(GO:0014850) |
| 0.2 | 0.9 | GO:0051968 | positive regulation of synaptic transmission, glutamatergic(GO:0051968) |
| 0.2 | 0.2 | GO:1903061 | positive regulation of protein lipidation(GO:1903061) |
| 0.2 | 2.3 | GO:0070649 | formin-nucleated actin cable assembly(GO:0070649) |
| 0.2 | 6.5 | GO:0035338 | long-chain fatty-acyl-CoA biosynthetic process(GO:0035338) |
| 0.2 | 3.2 | GO:0042417 | dopamine metabolic process(GO:0042417) |
| 0.2 | 2.1 | GO:0035405 | histone-threonine phosphorylation(GO:0035405) |
| 0.2 | 0.9 | GO:1902283 | negative regulation of primary amine oxidase activity(GO:1902283) |
| 0.2 | 0.7 | GO:0061763 | multivesicular body-lysosome fusion(GO:0061763) |
| 0.2 | 4.1 | GO:0034587 | piRNA metabolic process(GO:0034587) |
| 0.2 | 1.4 | GO:0006127 | glycerophosphate shuttle(GO:0006127) |
| 0.2 | 9.6 | GO:0045879 | negative regulation of smoothened signaling pathway(GO:0045879) |
| 0.2 | 0.9 | GO:0036269 | swimming behavior(GO:0036269) |
| 0.2 | 2.2 | GO:0060294 | cilium movement involved in cell motility(GO:0060294) |
| 0.2 | 1.1 | GO:0034242 | negative regulation of syncytium formation by plasma membrane fusion(GO:0034242) |
| 0.2 | 0.7 | GO:1904106 | protein localization to microvillus(GO:1904106) |
| 0.2 | 1.7 | GO:0021521 | ventral spinal cord interneuron specification(GO:0021521) cell fate specification involved in pattern specification(GO:0060573) |
| 0.2 | 0.7 | GO:0060052 | neurofilament cytoskeleton organization(GO:0060052) |
| 0.2 | 2.8 | GO:0006995 | cellular response to nitrogen starvation(GO:0006995) cellular response to nitrogen levels(GO:0043562) |
| 0.2 | 1.3 | GO:0045836 | positive regulation of meiotic nuclear division(GO:0045836) |
| 0.2 | 3.3 | GO:0042249 | establishment of planar polarity of embryonic epithelium(GO:0042249) |
| 0.2 | 0.7 | GO:0060830 | ciliary receptor clustering involved in smoothened signaling pathway(GO:0060830) |
| 0.2 | 0.7 | GO:1904020 | regulation of G-protein coupled receptor internalization(GO:1904020) |
| 0.2 | 0.6 | GO:0071257 | cellular response to electrical stimulus(GO:0071257) |
| 0.2 | 2.8 | GO:2000042 | negative regulation of double-strand break repair via homologous recombination(GO:2000042) |
| 0.2 | 0.4 | GO:1903031 | regulation of microtubule plus-end binding(GO:1903031) positive regulation of microtubule plus-end binding(GO:1903033) |
| 0.2 | 3.6 | GO:0060219 | camera-type eye photoreceptor cell differentiation(GO:0060219) |
| 0.2 | 1.1 | GO:0021551 | central nervous system morphogenesis(GO:0021551) cardiac muscle tissue regeneration(GO:0061026) regulation of STAT protein import into nucleus(GO:2000364) positive regulation of STAT protein import into nucleus(GO:2000366) |
| 0.2 | 4.5 | GO:0009650 | UV protection(GO:0009650) |
| 0.2 | 1.1 | GO:0043456 | regulation of pentose-phosphate shunt(GO:0043456) |
| 0.2 | 1.3 | GO:2000671 | regulation of motor neuron apoptotic process(GO:2000671) |
| 0.2 | 4.4 | GO:0090051 | negative regulation of cell migration involved in sprouting angiogenesis(GO:0090051) |
| 0.2 | 4.0 | GO:0071157 | negative regulation of cell cycle arrest(GO:0071157) |
| 0.2 | 0.6 | GO:0035754 | B cell chemotaxis(GO:0035754) |
| 0.2 | 3.4 | GO:0051256 | mitotic spindle midzone assembly(GO:0051256) |
| 0.2 | 0.8 | GO:0021794 | thalamus development(GO:0021794) |
| 0.2 | 8.2 | GO:0035774 | positive regulation of insulin secretion involved in cellular response to glucose stimulus(GO:0035774) |
| 0.2 | 0.6 | GO:0061181 | regulation of chondrocyte development(GO:0061181) negative regulation of chondrocyte development(GO:0061182) |
| 0.2 | 1.5 | GO:0044565 | dendritic cell proliferation(GO:0044565) |
| 0.2 | 0.2 | GO:0072236 | metanephric loop of Henle development(GO:0072236) |
| 0.2 | 2.5 | GO:0051964 | negative regulation of synapse assembly(GO:0051964) |
| 0.2 | 0.4 | GO:0034165 | positive regulation of toll-like receptor 9 signaling pathway(GO:0034165) |
| 0.2 | 1.3 | GO:0060414 | aorta smooth muscle tissue morphogenesis(GO:0060414) |
| 0.2 | 5.4 | GO:0043651 | linoleic acid metabolic process(GO:0043651) |
| 0.2 | 1.2 | GO:0048664 | neuron fate determination(GO:0048664) |
| 0.2 | 0.8 | GO:1900276 | negative regulation of phospholipase C activity(GO:1900275) regulation of proteinase activated receptor activity(GO:1900276) negative regulation of phospholipase C-activating G-protein coupled receptor signaling pathway(GO:1900737) |
| 0.2 | 0.6 | GO:0071073 | positive regulation of phospholipid biosynthetic process(GO:0071073) |
| 0.2 | 1.0 | GO:1901994 | negative regulation of meiotic cell cycle phase transition(GO:1901994) |
| 0.2 | 1.2 | GO:0030043 | actin filament fragmentation(GO:0030043) |
| 0.2 | 0.6 | GO:0060086 | circadian temperature homeostasis(GO:0060086) positive regulation of bile acid biosynthetic process(GO:0070859) positive regulation of bile acid metabolic process(GO:1904253) |
| 0.2 | 4.5 | GO:1901685 | glutathione derivative metabolic process(GO:1901685) glutathione derivative biosynthetic process(GO:1901687) |
| 0.2 | 2.0 | GO:0042148 | strand invasion(GO:0042148) |
| 0.2 | 0.4 | GO:0033594 | response to hydroxyisoflavone(GO:0033594) |
| 0.2 | 1.8 | GO:0003341 | cilium movement(GO:0003341) |
| 0.2 | 1.6 | GO:0060988 | lipid tube assembly(GO:0060988) |
| 0.2 | 1.6 | GO:0036481 | intrinsic apoptotic signaling pathway in response to hydrogen peroxide(GO:0036481) |
| 0.2 | 16.3 | GO:0000381 | regulation of alternative mRNA splicing, via spliceosome(GO:0000381) |
| 0.2 | 0.4 | GO:1901668 | regulation of superoxide dismutase activity(GO:1901668) |
| 0.2 | 1.2 | GO:0097676 | histone H3-K36 dimethylation(GO:0097676) |
| 0.2 | 1.4 | GO:0001696 | gastric acid secretion(GO:0001696) |
| 0.2 | 2.4 | GO:0051654 | establishment of mitochondrion localization(GO:0051654) |
| 0.2 | 10.4 | GO:0050650 | chondroitin sulfate proteoglycan biosynthetic process(GO:0050650) |
| 0.2 | 16.8 | GO:0035308 | negative regulation of protein dephosphorylation(GO:0035308) |
| 0.2 | 4.0 | GO:0032968 | positive regulation of transcription elongation from RNA polymerase II promoter(GO:0032968) |
| 0.2 | 3.0 | GO:0006089 | lactate metabolic process(GO:0006089) |
| 0.2 | 0.6 | GO:0045161 | neuronal ion channel clustering(GO:0045161) |
| 0.2 | 7.7 | GO:0008089 | anterograde axonal transport(GO:0008089) |
| 0.2 | 0.6 | GO:0042361 | menaquinone catabolic process(GO:0042361) vitamin K catabolic process(GO:0042377) |
| 0.2 | 2.0 | GO:0046940 | nucleoside monophosphate phosphorylation(GO:0046940) |
| 0.2 | 1.2 | GO:1904781 | positive regulation of protein localization to centrosome(GO:1904781) |
| 0.2 | 0.4 | GO:0006533 | glycerol biosynthetic process(GO:0006114) aspartate catabolic process(GO:0006533) |
| 0.2 | 3.5 | GO:0090084 | negative regulation of inclusion body assembly(GO:0090084) |
| 0.2 | 7.7 | GO:0030866 | cortical actin cytoskeleton organization(GO:0030866) |
| 0.2 | 0.4 | GO:0018312 | peptidyl-serine ADP-ribosylation(GO:0018312) |
| 0.2 | 0.2 | GO:0051598 | meiotic recombination checkpoint(GO:0051598) |
| 0.2 | 1.1 | GO:0061052 | negative regulation of cell growth involved in cardiac muscle cell development(GO:0061052) |
| 0.2 | 2.7 | GO:0035249 | synaptic transmission, glutamatergic(GO:0035249) |
| 0.2 | 0.6 | GO:1904908 | negative regulation of maintenance of sister chromatid cohesion(GO:0034092) negative regulation of maintenance of mitotic sister chromatid cohesion(GO:0034183) maintenance of mitotic sister chromatid cohesion, telomeric(GO:0099403) mitotic sister chromatid cohesion, telomeric(GO:0099404) regulation of maintenance of mitotic sister chromatid cohesion, telomeric(GO:1904907) negative regulation of maintenance of mitotic sister chromatid cohesion, telomeric(GO:1904908) |
| 0.2 | 0.4 | GO:0033634 | positive regulation of cell-cell adhesion mediated by integrin(GO:0033634) |
| 0.2 | 0.7 | GO:0035865 | cellular response to potassium ion(GO:0035865) |
| 0.2 | 6.7 | GO:0030513 | positive regulation of BMP signaling pathway(GO:0030513) |
| 0.2 | 5.1 | GO:0010669 | epithelial structure maintenance(GO:0010669) |
| 0.2 | 27.6 | GO:0071805 | cellular potassium ion transport(GO:0071804) potassium ion transmembrane transport(GO:0071805) |
| 0.2 | 0.5 | GO:0046379 | extracellular polysaccharide biosynthetic process(GO:0045226) extracellular polysaccharide metabolic process(GO:0046379) |
| 0.2 | 0.4 | GO:0042418 | epinephrine metabolic process(GO:0042414) epinephrine biosynthetic process(GO:0042418) |
| 0.2 | 1.3 | GO:0032468 | Golgi calcium ion homeostasis(GO:0032468) |
| 0.2 | 0.5 | GO:0032487 | regulation of Rap protein signal transduction(GO:0032487) |
| 0.2 | 0.4 | GO:0006531 | aspartate metabolic process(GO:0006531) |
| 0.2 | 1.1 | GO:0003383 | apical constriction(GO:0003383) |
| 0.2 | 4.5 | GO:0051764 | actin crosslink formation(GO:0051764) |
| 0.2 | 0.2 | GO:1902595 | regulation of DNA replication origin binding(GO:1902595) |
| 0.2 | 9.3 | GO:0035735 | intraciliary transport involved in cilium morphogenesis(GO:0035735) |
| 0.2 | 2.1 | GO:0032060 | bleb assembly(GO:0032060) |
| 0.2 | 1.6 | GO:0051725 | protein de-ADP-ribosylation(GO:0051725) |
| 0.2 | 2.3 | GO:0042355 | fucose catabolic process(GO:0019317) L-fucose metabolic process(GO:0042354) L-fucose catabolic process(GO:0042355) |
| 0.2 | 1.2 | GO:0051152 | positive regulation of smooth muscle cell differentiation(GO:0051152) |
| 0.2 | 0.7 | GO:0033184 | positive regulation of histone ubiquitination(GO:0033184) regulation of histone H2B ubiquitination(GO:2001166) positive regulation of histone H2B ubiquitination(GO:2001168) |
| 0.2 | 0.7 | GO:0014046 | dopamine secretion(GO:0014046) regulation of dopamine secretion(GO:0014059) |
| 0.2 | 0.5 | GO:0009197 | dUDP biosynthetic process(GO:0006227) dTDP biosynthetic process(GO:0006233) pyrimidine nucleoside diphosphate metabolic process(GO:0009138) pyrimidine nucleoside diphosphate biosynthetic process(GO:0009139) pyrimidine deoxyribonucleoside diphosphate metabolic process(GO:0009196) pyrimidine deoxyribonucleoside diphosphate biosynthetic process(GO:0009197) dTDP metabolic process(GO:0046072) dUDP metabolic process(GO:0046077) |
| 0.2 | 0.2 | GO:0014827 | intestine smooth muscle contraction(GO:0014827) |
| 0.2 | 0.2 | GO:0003310 | pancreatic A cell differentiation(GO:0003310) |
| 0.2 | 0.5 | GO:0045578 | negative regulation of B cell differentiation(GO:0045578) |
| 0.2 | 0.5 | GO:0043012 | regulation of fusion of sperm to egg plasma membrane(GO:0043012) |
| 0.2 | 3.1 | GO:0019388 | galactose catabolic process(GO:0019388) |
| 0.2 | 6.7 | GO:0008542 | visual learning(GO:0008542) |
| 0.2 | 2.6 | GO:1900364 | negative regulation of mRNA polyadenylation(GO:1900364) |
| 0.2 | 0.9 | GO:0046116 | queuosine biosynthetic process(GO:0008616) queuosine metabolic process(GO:0046116) |
| 0.2 | 1.4 | GO:2000490 | negative regulation of hepatic stellate cell activation(GO:2000490) |
| 0.2 | 0.7 | GO:0071418 | cellular response to amine stimulus(GO:0071418) |
| 0.2 | 0.5 | GO:1902410 | mitotic cytokinetic process(GO:1902410) |
| 0.2 | 2.5 | GO:2001224 | positive regulation of neuron migration(GO:2001224) |
| 0.2 | 0.7 | GO:0090299 | regulation of neural crest formation(GO:0090299) negative regulation of neural crest formation(GO:0090301) negative regulation of fibroblast growth factor receptor signaling pathway involved in neural plate anterior/posterior pattern formation(GO:2000314) |
| 0.2 | 1.0 | GO:0007185 | transmembrane receptor protein tyrosine phosphatase signaling pathway(GO:0007185) |
| 0.2 | 2.2 | GO:0030091 | protein repair(GO:0030091) |
| 0.2 | 2.5 | GO:0044458 | motile cilium assembly(GO:0044458) |
| 0.2 | 0.2 | GO:0070099 | regulation of chemokine-mediated signaling pathway(GO:0070099) |
| 0.2 | 0.3 | GO:0097167 | circadian regulation of translation(GO:0097167) |
| 0.2 | 0.3 | GO:0090261 | positive regulation of inclusion body assembly(GO:0090261) |
| 0.2 | 1.6 | GO:0070535 | histone H2A K63-linked ubiquitination(GO:0070535) |
| 0.2 | 1.8 | GO:0045876 | positive regulation of sister chromatid cohesion(GO:0045876) |
| 0.2 | 4.2 | GO:0008045 | motor neuron axon guidance(GO:0008045) |
| 0.2 | 0.5 | GO:0014735 | regulation of muscle atrophy(GO:0014735) negative regulation of muscle atrophy(GO:0014736) response to injury involved in regulation of muscle adaptation(GO:0014876) |
| 0.2 | 2.1 | GO:0006600 | creatine metabolic process(GO:0006600) |
| 0.2 | 0.6 | GO:0019520 | aldonic acid metabolic process(GO:0019520) D-gluconate metabolic process(GO:0019521) |
| 0.2 | 1.1 | GO:0010739 | positive regulation of protein kinase A signaling(GO:0010739) |
| 0.2 | 2.1 | GO:0000492 | box C/D snoRNP assembly(GO:0000492) |
| 0.2 | 0.6 | GO:0021511 | spinal cord patterning(GO:0021511) |
| 0.2 | 0.5 | GO:0006407 | rRNA export from nucleus(GO:0006407) |
| 0.2 | 0.5 | GO:0007386 | compartment pattern specification(GO:0007386) |
| 0.2 | 1.3 | GO:0006642 | triglyceride mobilization(GO:0006642) |
| 0.2 | 0.5 | GO:0016122 | tetraterpenoid metabolic process(GO:0016108) carotenoid metabolic process(GO:0016116) carotene catabolic process(GO:0016121) xanthophyll metabolic process(GO:0016122) terpene catabolic process(GO:0046247) |
| 0.2 | 0.5 | GO:0001188 | RNA polymerase I transcriptional preinitiation complex assembly(GO:0001188) RNA polymerase I transcriptional preinitiation complex assembly at the promoter for the nuclear large rRNA transcript(GO:0001189) |
| 0.2 | 0.8 | GO:0038098 | sequestering of BMP from receptor via BMP binding(GO:0038098) |
| 0.2 | 0.8 | GO:0051562 | negative regulation of mitochondrial calcium ion concentration(GO:0051562) |
| 0.2 | 0.6 | GO:0060012 | synaptic transmission, glycinergic(GO:0060012) |
| 0.2 | 0.8 | GO:0010286 | heat acclimation(GO:0010286) cellular heat acclimation(GO:0070370) |
| 0.2 | 0.3 | GO:0051533 | positive regulation of NFAT protein import into nucleus(GO:0051533) |
| 0.1 | 1.0 | GO:0044210 | 'de novo' CTP biosynthetic process(GO:0044210) |
| 0.1 | 1.6 | GO:0010613 | positive regulation of cardiac muscle hypertrophy(GO:0010613) positive regulation of muscle hypertrophy(GO:0014742) |
| 0.1 | 3.1 | GO:0006646 | phosphatidylethanolamine biosynthetic process(GO:0006646) |
| 0.1 | 1.0 | GO:0043128 | regulation of 1-phosphatidylinositol 4-kinase activity(GO:0043126) positive regulation of 1-phosphatidylinositol 4-kinase activity(GO:0043128) |
| 0.1 | 0.7 | GO:0051892 | negative regulation of cardioblast differentiation(GO:0051892) regulation of cardiac muscle cell myoblast differentiation(GO:2000690) negative regulation of cardiac muscle cell myoblast differentiation(GO:2000691) |
| 0.1 | 1.8 | GO:1902018 | negative regulation of cilium assembly(GO:1902018) |
| 0.1 | 1.7 | GO:0090141 | positive regulation of mitochondrial fission(GO:0090141) |
| 0.1 | 0.4 | GO:0015847 | putrescine transport(GO:0015847) |
| 0.1 | 3.6 | GO:0046949 | fatty-acyl-CoA biosynthetic process(GO:0046949) |
| 0.1 | 0.4 | GO:0033140 | negative regulation of peptidyl-serine phosphorylation of STAT protein(GO:0033140) |
| 0.1 | 4.3 | GO:0043968 | histone H2A acetylation(GO:0043968) |
| 0.1 | 2.5 | GO:0001514 | selenocysteine incorporation(GO:0001514) translational readthrough(GO:0006451) |
| 0.1 | 0.6 | GO:0061015 | snRNA import into nucleus(GO:0061015) |
| 0.1 | 2.2 | GO:0006610 | ribosomal protein import into nucleus(GO:0006610) |
| 0.1 | 0.7 | GO:0010387 | COP9 signalosome assembly(GO:0010387) |
| 0.1 | 1.7 | GO:0045724 | positive regulation of cilium assembly(GO:0045724) |
| 0.1 | 1.0 | GO:0035610 | protein side chain deglutamylation(GO:0035610) |
| 0.1 | 0.6 | GO:0018277 | protein deamination(GO:0018277) |
| 0.1 | 0.4 | GO:0010482 | epidermal cell division(GO:0010481) regulation of epidermal cell division(GO:0010482) |
| 0.1 | 0.1 | GO:0046452 | dihydrofolate metabolic process(GO:0046452) |
| 0.1 | 0.4 | GO:0060382 | regulation of DNA strand elongation(GO:0060382) |
| 0.1 | 1.1 | GO:0019255 | glucose 1-phosphate metabolic process(GO:0019255) |
| 0.1 | 0.6 | GO:0002043 | blood vessel endothelial cell proliferation involved in sprouting angiogenesis(GO:0002043) |
| 0.1 | 1.1 | GO:0051684 | maintenance of Golgi location(GO:0051684) |
| 0.1 | 0.8 | GO:0019509 | L-methionine biosynthetic process from methylthioadenosine(GO:0019509) |
| 0.1 | 5.7 | GO:0007274 | neuromuscular synaptic transmission(GO:0007274) |
| 0.1 | 0.8 | GO:0038161 | prolactin signaling pathway(GO:0038161) |
| 0.1 | 0.3 | GO:0061724 | lipophagy(GO:0061724) regulation of lipophagy(GO:1904502) positive regulation of lipophagy(GO:1904504) |
| 0.1 | 1.2 | GO:0048368 | lateral mesoderm development(GO:0048368) |
| 0.1 | 0.3 | GO:0010520 | regulation of reciprocal meiotic recombination(GO:0010520) |
| 0.1 | 0.8 | GO:0070164 | negative regulation of adiponectin secretion(GO:0070164) |
| 0.1 | 1.4 | GO:0034551 | respiratory chain complex III assembly(GO:0017062) mitochondrial respiratory chain complex III assembly(GO:0034551) |
| 0.1 | 0.4 | GO:2000616 | negative regulation of histone H3-K9 acetylation(GO:2000616) |
| 0.1 | 2.9 | GO:0045026 | plasma membrane fusion(GO:0045026) |
| 0.1 | 1.2 | GO:0007616 | long-term memory(GO:0007616) |
| 0.1 | 0.3 | GO:0003160 | endocardium morphogenesis(GO:0003160) |
| 0.1 | 0.4 | GO:0006597 | spermine biosynthetic process(GO:0006597) |
| 0.1 | 1.1 | GO:0009414 | response to water deprivation(GO:0009414) |
| 0.1 | 0.5 | GO:0010269 | response to selenium ion(GO:0010269) |
| 0.1 | 3.6 | GO:0019228 | neuronal action potential(GO:0019228) |
| 0.1 | 0.9 | GO:0044791 | modulation by host of viral release from host cell(GO:0044789) positive regulation by host of viral release from host cell(GO:0044791) |
| 0.1 | 3.6 | GO:0070207 | protein homotrimerization(GO:0070207) |
| 0.1 | 0.5 | GO:0001994 | norepinephrine-epinephrine vasoconstriction involved in regulation of systemic arterial blood pressure(GO:0001994) |
| 0.1 | 0.1 | GO:2000381 | negative regulation of mesoderm development(GO:2000381) |
| 0.1 | 6.9 | GO:0006270 | DNA replication initiation(GO:0006270) |
| 0.1 | 5.0 | GO:0007140 | male meiosis(GO:0007140) |
| 0.1 | 0.4 | GO:0060484 | lung-associated mesenchyme development(GO:0060484) |
| 0.1 | 0.1 | GO:0009912 | auditory receptor cell fate commitment(GO:0009912) inner ear receptor cell fate commitment(GO:0060120) |
| 0.1 | 0.4 | GO:0000710 | meiotic mismatch repair(GO:0000710) |
| 0.1 | 1.1 | GO:1901673 | regulation of mitotic spindle assembly(GO:1901673) |
| 0.1 | 0.3 | GO:0090083 | regulation of inclusion body assembly(GO:0090083) |
| 0.1 | 3.9 | GO:0045746 | negative regulation of Notch signaling pathway(GO:0045746) |
| 0.1 | 2.3 | GO:0001937 | negative regulation of endothelial cell proliferation(GO:0001937) |
| 0.1 | 3.6 | GO:0071377 | cellular response to glucagon stimulus(GO:0071377) |
| 0.1 | 0.8 | GO:0033029 | neutrophil apoptotic process(GO:0001781) regulation of neutrophil apoptotic process(GO:0033029) |
| 0.1 | 1.5 | GO:1901838 | positive regulation of transcription of nuclear large rRNA transcript from RNA polymerase I promoter(GO:1901838) |
| 0.1 | 0.6 | GO:1901350 | cell-cell signaling involved in cell-cell junction organization(GO:1901350) |
| 0.1 | 0.5 | GO:0002074 | extraocular skeletal muscle development(GO:0002074) |
| 0.1 | 1.5 | GO:0003091 | renal water homeostasis(GO:0003091) |
| 0.1 | 2.2 | GO:0045292 | mRNA cis splicing, via spliceosome(GO:0045292) |
| 0.1 | 0.1 | GO:1904779 | regulation of protein localization to centrosome(GO:1904779) |
| 0.1 | 4.4 | GO:0007029 | endoplasmic reticulum organization(GO:0007029) |
| 0.1 | 0.2 | GO:0060632 | regulation of microtubule-based movement(GO:0060632) |
| 0.1 | 1.1 | GO:0002091 | negative regulation of receptor internalization(GO:0002091) |
| 0.1 | 0.4 | GO:0032228 | regulation of synaptic transmission, GABAergic(GO:0032228) |
| 0.1 | 0.7 | GO:0019323 | pentose catabolic process(GO:0019323) |
| 0.1 | 1.0 | GO:2000194 | regulation of female gonad development(GO:2000194) |
| 0.1 | 0.9 | GO:0043117 | positive regulation of vascular permeability(GO:0043117) |
| 0.1 | 0.6 | GO:0009298 | GDP-mannose biosynthetic process(GO:0009298) |
| 0.1 | 2.2 | GO:0018027 | peptidyl-lysine dimethylation(GO:0018027) |
| 0.1 | 0.1 | GO:1903216 | regulation of protein processing involved in protein targeting to mitochondrion(GO:1903216) negative regulation of protein processing involved in protein targeting to mitochondrion(GO:1903217) |
| 0.1 | 1.3 | GO:0001778 | plasma membrane repair(GO:0001778) |
| 0.1 | 4.1 | GO:0001953 | negative regulation of cell-matrix adhesion(GO:0001953) |
| 0.1 | 0.4 | GO:0030576 | Cajal body organization(GO:0030576) |
| 0.1 | 0.7 | GO:0042759 | long-chain fatty acid biosynthetic process(GO:0042759) |
| 0.1 | 1.2 | GO:0070977 | bone maturation(GO:0070977) |
| 0.1 | 0.7 | GO:0019464 | glycine catabolic process(GO:0006546) glycine decarboxylation via glycine cleavage system(GO:0019464) |
| 0.1 | 0.4 | GO:0051414 | response to cortisol(GO:0051414) |
| 0.1 | 0.2 | GO:1990166 | protein localization to site of double-strand break(GO:1990166) |
| 0.1 | 1.5 | GO:0060716 | labyrinthine layer blood vessel development(GO:0060716) |
| 0.1 | 3.2 | GO:0036152 | phosphatidylethanolamine acyl-chain remodeling(GO:0036152) |
| 0.1 | 0.2 | GO:0007315 | oocyte construction(GO:0007308) oocyte axis specification(GO:0007309) oocyte anterior/posterior axis specification(GO:0007314) pole plasm assembly(GO:0007315) maternal determination of anterior/posterior axis, embryo(GO:0008358) P granule organization(GO:0030719) |
| 0.1 | 1.5 | GO:0015074 | DNA integration(GO:0015074) |
| 0.1 | 0.7 | GO:0016560 | protein import into peroxisome matrix, docking(GO:0016560) |
| 0.1 | 7.7 | GO:0006891 | intra-Golgi vesicle-mediated transport(GO:0006891) |
| 0.1 | 1.1 | GO:0006857 | oligopeptide transport(GO:0006857) |
| 0.1 | 1.5 | GO:0015693 | magnesium ion transport(GO:0015693) |
| 0.1 | 0.1 | GO:0043006 | activation of phospholipase A2 activity by calcium-mediated signaling(GO:0043006) |
| 0.1 | 2.4 | GO:0097320 | membrane tubulation(GO:0097320) |
| 0.1 | 0.3 | GO:0051387 | negative regulation of neurotrophin TRK receptor signaling pathway(GO:0051387) |
| 0.1 | 0.3 | GO:0048505 | regulation of development, heterochronic(GO:0040034) regulation of timing of cell differentiation(GO:0048505) |
| 0.1 | 0.5 | GO:0033326 | cerebrospinal fluid secretion(GO:0033326) |
| 0.1 | 0.5 | GO:0006566 | threonine metabolic process(GO:0006566) |
| 0.1 | 1.0 | GO:0006704 | glucocorticoid biosynthetic process(GO:0006704) |
| 0.1 | 3.3 | GO:0007130 | synaptonemal complex assembly(GO:0007130) |
| 0.1 | 0.4 | GO:1902530 | regulation of protein linear polyubiquitination(GO:1902528) positive regulation of protein linear polyubiquitination(GO:1902530) |
| 0.1 | 2.8 | GO:0035728 | response to hepatocyte growth factor(GO:0035728) |
| 0.1 | 0.4 | GO:0050651 | dermatan sulfate proteoglycan biosynthetic process(GO:0050651) |
| 0.1 | 0.5 | GO:0002357 | defense response to tumor cell(GO:0002357) |
| 0.1 | 0.4 | GO:0000730 | DNA recombinase assembly(GO:0000730) double-strand break repair via synthesis-dependent strand annealing(GO:0045003) |
| 0.1 | 0.2 | GO:0061300 | cerebellum vasculature development(GO:0061300) |
| 0.1 | 1.0 | GO:1904354 | negative regulation of telomere capping(GO:1904354) |
| 0.1 | 0.3 | GO:0006481 | C-terminal protein methylation(GO:0006481) |
| 0.1 | 0.3 | GO:0035803 | egg coat formation(GO:0035803) |
| 0.1 | 1.2 | GO:0016926 | protein desumoylation(GO:0016926) |
| 0.1 | 0.6 | GO:0051823 | regulation of synapse structural plasticity(GO:0051823) |
| 0.1 | 0.3 | GO:2000642 | negative regulation of early endosome to late endosome transport(GO:2000642) |
| 0.1 | 0.1 | GO:0006565 | L-serine catabolic process(GO:0006565) |
| 0.1 | 1.3 | GO:0000052 | citrulline metabolic process(GO:0000052) |
| 0.1 | 1.8 | GO:0046710 | GDP metabolic process(GO:0046710) |
| 0.1 | 0.1 | GO:0051409 | response to nitrosative stress(GO:0051409) |
| 0.1 | 0.6 | GO:0045085 | negative regulation of interleukin-2 biosynthetic process(GO:0045085) |
| 0.1 | 0.4 | GO:0008211 | glucocorticoid metabolic process(GO:0008211) |
| 0.1 | 2.2 | GO:0050812 | regulation of acyl-CoA biosynthetic process(GO:0050812) |
| 0.1 | 0.5 | GO:0002329 | pre-B cell differentiation(GO:0002329) |
| 0.1 | 0.4 | GO:0044313 | protein K6-linked deubiquitination(GO:0044313) |
| 0.1 | 1.7 | GO:0010804 | negative regulation of tumor necrosis factor-mediated signaling pathway(GO:0010804) |
| 0.1 | 0.2 | GO:0045229 | cell envelope organization(GO:0043163) external encapsulating structure organization(GO:0045229) |
| 0.1 | 0.3 | GO:1904116 | response to vasopressin(GO:1904116) cellular response to vasopressin(GO:1904117) |
| 0.1 | 2.9 | GO:0030252 | growth hormone secretion(GO:0030252) |
| 0.1 | 0.4 | GO:0098901 | regulation of cardiac muscle cell action potential(GO:0098901) |
| 0.1 | 1.0 | GO:0030321 | transepithelial chloride transport(GO:0030321) |
| 0.1 | 0.7 | GO:1904694 | negative regulation of vascular smooth muscle contraction(GO:1904694) |
| 0.1 | 0.6 | GO:0032534 | regulation of microvillus assembly(GO:0032534) |
| 0.1 | 0.4 | GO:0070681 | glutaminyl-tRNAGln biosynthesis via transamidation(GO:0070681) |
| 0.1 | 0.2 | GO:0070472 | uterine smooth muscle contraction(GO:0070471) regulation of uterine smooth muscle contraction(GO:0070472) |
| 0.1 | 0.5 | GO:0036363 | transforming growth factor beta activation(GO:0036363) regulation of mesenchymal stem cell proliferation(GO:1902460) positive regulation of mesenchymal stem cell proliferation(GO:1902462) |
| 0.1 | 0.1 | GO:0043268 | positive regulation of potassium ion transport(GO:0043268) |
| 0.1 | 0.6 | GO:0009950 | dorsal/ventral axis specification(GO:0009950) |
| 0.1 | 0.3 | GO:0039534 | negative regulation of MDA-5 signaling pathway(GO:0039534) |
| 0.1 | 1.2 | GO:0045899 | positive regulation of RNA polymerase II transcriptional preinitiation complex assembly(GO:0045899) |
| 0.1 | 0.4 | GO:1903251 | multi-ciliated epithelial cell differentiation(GO:1903251) |
| 0.1 | 0.2 | GO:0006930 | substrate-dependent cell migration, cell extension(GO:0006930) |
| 0.1 | 2.4 | GO:0034389 | lipid particle organization(GO:0034389) |
| 0.1 | 0.1 | GO:1903215 | negative regulation of protein targeting to mitochondrion(GO:1903215) |
| 0.1 | 0.6 | GO:0006772 | thiamine metabolic process(GO:0006772) |
| 0.1 | 0.3 | GO:0003062 | regulation of heart rate by chemical signal(GO:0003062) |
| 0.1 | 16.2 | GO:0007156 | homophilic cell adhesion via plasma membrane adhesion molecules(GO:0007156) |
| 0.1 | 0.9 | GO:0021952 | central nervous system projection neuron axonogenesis(GO:0021952) |
| 0.1 | 5.8 | GO:0015701 | bicarbonate transport(GO:0015701) |
| 0.1 | 0.5 | GO:0002249 | lymphocyte anergy(GO:0002249) regulation of T cell anergy(GO:0002667) T cell anergy(GO:0002870) regulation of lymphocyte anergy(GO:0002911) |
| 0.1 | 0.1 | GO:1901620 | regulation of smoothened signaling pathway involved in dorsal/ventral neural tube patterning(GO:1901620) |
| 0.1 | 0.3 | GO:0071163 | DNA replication preinitiation complex assembly(GO:0071163) |
| 0.1 | 0.3 | GO:0060693 | regulation of branching involved in salivary gland morphogenesis(GO:0060693) |
| 0.1 | 0.3 | GO:0071460 | cellular response to cell-matrix adhesion(GO:0071460) |
| 0.1 | 0.8 | GO:0018317 | protein C-linked glycosylation(GO:0018103) peptidyl-tryptophan modification(GO:0018211) protein C-linked glycosylation via tryptophan(GO:0018317) protein C-linked glycosylation via 2'-alpha-mannosyl-L-tryptophan(GO:0018406) |
| 0.1 | 3.0 | GO:0006836 | neurotransmitter transport(GO:0006836) |
| 0.1 | 0.3 | GO:0034473 | U1 snRNA 3'-end processing(GO:0034473) U5 snRNA 3'-end processing(GO:0034476) nuclear polyadenylation-dependent mRNA catabolic process(GO:0071042) polyadenylation-dependent mRNA catabolic process(GO:0071047) |
| 0.1 | 0.4 | GO:0042335 | cuticle development(GO:0042335) |
| 0.1 | 0.3 | GO:0002904 | positive regulation of B cell apoptotic process(GO:0002904) |
| 0.1 | 1.7 | GO:0051602 | response to electrical stimulus(GO:0051602) |
| 0.1 | 2.1 | GO:0010837 | regulation of keratinocyte proliferation(GO:0010837) |
| 0.1 | 0.6 | GO:0018026 | peptidyl-lysine monomethylation(GO:0018026) |
| 0.1 | 0.3 | GO:0052651 | monoacylglycerol metabolic process(GO:0046462) monoacylglycerol catabolic process(GO:0052651) |
| 0.1 | 0.5 | GO:0021984 | adenohypophysis development(GO:0021984) |
| 0.1 | 0.3 | GO:0048388 | endosomal lumen acidification(GO:0048388) |
| 0.1 | 2.1 | GO:0006825 | copper ion transport(GO:0006825) |
| 0.1 | 0.6 | GO:0016584 | nucleosome positioning(GO:0016584) |
| 0.1 | 0.3 | GO:0061684 | chaperone-mediated autophagy(GO:0061684) |
| 0.1 | 0.5 | GO:0006573 | valine metabolic process(GO:0006573) valine catabolic process(GO:0006574) |
| 0.1 | 0.3 | GO:0090335 | regulation of brown fat cell differentiation(GO:0090335) |
| 0.1 | 0.6 | GO:0046604 | positive regulation of mitotic centrosome separation(GO:0046604) |
| 0.1 | 1.0 | GO:0051382 | kinetochore assembly(GO:0051382) |
| 0.1 | 0.1 | GO:0090370 | negative regulation of cholesterol efflux(GO:0090370) |
| 0.1 | 0.2 | GO:0048549 | positive regulation of pinocytosis(GO:0048549) |
| 0.1 | 3.5 | GO:0000413 | protein peptidyl-prolyl isomerization(GO:0000413) |
| 0.1 | 0.2 | GO:0060827 | regulation of canonical Wnt signaling pathway involved in neural plate anterior/posterior pattern formation(GO:0060827) negative regulation of canonical Wnt signaling pathway involved in neural plate anterior/posterior pattern formation(GO:0060829) |
| 0.1 | 1.8 | GO:0010664 | negative regulation of striated muscle cell apoptotic process(GO:0010664) |
| 0.1 | 1.1 | GO:0061088 | regulation of sequestering of zinc ion(GO:0061088) |
| 0.1 | 1.5 | GO:0014003 | oligodendrocyte development(GO:0014003) |
| 0.1 | 1.1 | GO:0010832 | negative regulation of myotube differentiation(GO:0010832) |
| 0.1 | 0.6 | GO:0032049 | cardiolipin biosynthetic process(GO:0032049) |
| 0.1 | 0.2 | GO:1903450 | regulation of G1 to G0 transition(GO:1903450) positive regulation of G1 to G0 transition(GO:1903452) |
| 0.1 | 2.3 | GO:0007131 | reciprocal meiotic recombination(GO:0007131) reciprocal DNA recombination(GO:0035825) |
| 0.1 | 0.1 | GO:0032707 | negative regulation of interleukin-23 production(GO:0032707) |
| 0.1 | 0.2 | GO:0042541 | hemoglobin biosynthetic process(GO:0042541) |
| 0.1 | 0.4 | GO:0051013 | microtubule severing(GO:0051013) |
| 0.1 | 0.6 | GO:0036342 | post-anal tail morphogenesis(GO:0036342) |
| 0.1 | 0.6 | GO:0022038 | corpus callosum development(GO:0022038) |
| 0.1 | 0.2 | GO:0080120 | CAAX-box protein processing(GO:0071586) CAAX-box protein maturation(GO:0080120) |
| 0.1 | 0.3 | GO:2000739 | regulation of mesenchymal stem cell differentiation(GO:2000739) |
| 0.1 | 0.9 | GO:0060050 | positive regulation of protein glycosylation(GO:0060050) |
| 0.1 | 0.2 | GO:0090310 | negative regulation of methylation-dependent chromatin silencing(GO:0090310) |
| 0.1 | 0.3 | GO:1903070 | negative regulation of ER-associated ubiquitin-dependent protein catabolic process(GO:1903070) |
| 0.1 | 0.1 | GO:1903721 | regulation of I-kappaB phosphorylation(GO:1903719) positive regulation of I-kappaB phosphorylation(GO:1903721) |
| 0.1 | 0.3 | GO:0051754 | meiotic sister chromatid cohesion, centromeric(GO:0051754) |
| 0.1 | 0.1 | GO:0033341 | regulation of collagen binding(GO:0033341) |
| 0.1 | 0.2 | GO:0071372 | cellular response to follicle-stimulating hormone stimulus(GO:0071372) |
| 0.1 | 0.3 | GO:0006478 | peptidyl-tyrosine sulfation(GO:0006478) |
| 0.1 | 1.0 | GO:0000338 | protein deneddylation(GO:0000338) |
| 0.1 | 0.2 | GO:0050928 | negative regulation of positive chemotaxis(GO:0050928) |
| 0.1 | 0.6 | GO:0055129 | L-proline biosynthetic process(GO:0055129) |
| 0.1 | 1.4 | GO:1901984 | negative regulation of protein acetylation(GO:1901984) |
| 0.1 | 1.0 | GO:0033235 | positive regulation of protein sumoylation(GO:0033235) |
| 0.1 | 0.3 | GO:0061303 | cornea development in camera-type eye(GO:0061303) |
| 0.1 | 0.2 | GO:0035572 | N-terminal peptidyl-alanine methylation(GO:0018011) N-terminal peptidyl-alanine trimethylation(GO:0018012) N-terminal peptidyl-glycine methylation(GO:0018013) N-terminal peptidyl-proline dimethylation(GO:0018016) peptidyl-alanine modification(GO:0018194) N-terminal peptidyl-proline methylation(GO:0035568) N-terminal peptidyl-serine methylation(GO:0035570) N-terminal peptidyl-serine dimethylation(GO:0035572) N-terminal peptidyl-serine trimethylation(GO:0035573) |
| 0.1 | 1.6 | GO:0006688 | glycosphingolipid biosynthetic process(GO:0006688) |
| 0.1 | 0.5 | GO:1902231 | positive regulation of intrinsic apoptotic signaling pathway in response to DNA damage(GO:1902231) |
| 0.1 | 0.3 | GO:0006393 | termination of mitochondrial transcription(GO:0006393) |
| 0.1 | 0.9 | GO:0042340 | keratan sulfate catabolic process(GO:0042340) |
| 0.1 | 0.4 | GO:2000781 | positive regulation of double-strand break repair(GO:2000781) |
| 0.1 | 0.3 | GO:0035493 | SNARE complex assembly(GO:0035493) |
| 0.1 | 0.1 | GO:0042940 | D-amino acid transport(GO:0042940) |
| 0.1 | 0.1 | GO:0007168 | receptor guanylyl cyclase signaling pathway(GO:0007168) |
| 0.1 | 0.2 | GO:0018262 | isopeptide cross-linking via N6-(L-isoglutamyl)-L-lysine(GO:0018153) isopeptide cross-linking(GO:0018262) |
| 0.1 | 0.2 | GO:0060633 | negative regulation of transcription initiation from RNA polymerase II promoter(GO:0060633) |
| 0.1 | 1.1 | GO:1904262 | negative regulation of TORC1 signaling(GO:1904262) |
| 0.1 | 0.1 | GO:0099638 | endosome to plasma membrane protein transport(GO:0099638) |
| 0.1 | 0.9 | GO:0090197 | regulation of chemokine secretion(GO:0090196) positive regulation of chemokine secretion(GO:0090197) |
| 0.1 | 0.4 | GO:2000676 | positive regulation of type B pancreatic cell apoptotic process(GO:2000676) |
| 0.1 | 0.2 | GO:0071922 | establishment of sister chromatid cohesion(GO:0034085) cohesin loading(GO:0071921) regulation of cohesin loading(GO:0071922) |
| 0.1 | 0.3 | GO:0071051 | polyadenylation-dependent snoRNA 3'-end processing(GO:0071051) |
| 0.1 | 0.6 | GO:0003340 | negative regulation of mesenchymal to epithelial transition involved in metanephros morphogenesis(GO:0003340) |
| 0.1 | 0.2 | GO:0009085 | lysine biosynthetic process(GO:0009085) lysine biosynthetic process via aminoadipic acid(GO:0019878) |
| 0.1 | 0.4 | GO:1903830 | magnesium ion transmembrane transport(GO:1903830) |
| 0.1 | 0.1 | GO:1902498 | regulation of protein autoubiquitination(GO:1902498) |
| 0.1 | 0.4 | GO:0033127 | regulation of histone phosphorylation(GO:0033127) |
| 0.1 | 3.7 | GO:0007602 | phototransduction(GO:0007602) |
| 0.1 | 0.3 | GO:0034453 | microtubule anchoring(GO:0034453) |
| 0.1 | 0.7 | GO:0006307 | DNA dealkylation involved in DNA repair(GO:0006307) |
| 0.1 | 0.3 | GO:0035617 | stress granule disassembly(GO:0035617) |
| 0.1 | 0.3 | GO:0071472 | cellular response to salt stress(GO:0071472) |
| 0.1 | 0.6 | GO:0006703 | estrogen biosynthetic process(GO:0006703) |
| 0.1 | 0.2 | GO:0015813 | acidic amino acid transport(GO:0015800) L-glutamate transport(GO:0015813) |
| 0.1 | 1.7 | GO:0035428 | hexose transmembrane transport(GO:0035428) glucose transmembrane transport(GO:1904659) |
| 0.1 | 0.2 | GO:0000960 | mitochondrial RNA catabolic process(GO:0000957) regulation of mitochondrial RNA catabolic process(GO:0000960) |
| 0.1 | 0.3 | GO:0007056 | spindle assembly involved in female meiosis(GO:0007056) |
| 0.1 | 0.5 | GO:0042908 | xenobiotic transport(GO:0042908) |
| 0.1 | 0.3 | GO:0046391 | 5-phosphoribose 1-diphosphate biosynthetic process(GO:0006015) 5-phosphoribose 1-diphosphate metabolic process(GO:0046391) |
| 0.1 | 0.2 | GO:0002759 | regulation of antimicrobial humoral response(GO:0002759) |
| 0.1 | 1.5 | GO:0010738 | regulation of protein kinase A signaling(GO:0010738) |
| 0.1 | 0.7 | GO:0015867 | ATP transport(GO:0015867) |
| 0.0 | 0.2 | GO:0009443 | pyridoxal 5'-phosphate salvage(GO:0009443) |
| 0.0 | 0.1 | GO:0070898 | RNA polymerase III transcriptional preinitiation complex assembly(GO:0070898) |
| 0.0 | 0.1 | GO:0060831 | smoothened signaling pathway involved in dorsal/ventral neural tube patterning(GO:0060831) |
| 0.0 | 0.8 | GO:0006776 | vitamin A metabolic process(GO:0006776) |
| 0.0 | 0.1 | GO:1903516 | regulation of single strand break repair(GO:1903516) |
| 0.0 | 0.1 | GO:0070305 | response to cGMP(GO:0070305) |
| 0.0 | 0.5 | GO:0032482 | Rab protein signal transduction(GO:0032482) |
| 0.0 | 0.4 | GO:0034058 | endosomal vesicle fusion(GO:0034058) |
| 0.0 | 0.1 | GO:0001579 | medium-chain fatty acid transport(GO:0001579) |
| 0.0 | 0.2 | GO:0007079 | mitotic chromosome movement towards spindle pole(GO:0007079) |
| 0.0 | 0.1 | GO:0035166 | post-embryonic hemopoiesis(GO:0035166) |
| 0.0 | 0.2 | GO:0039533 | regulation of MDA-5 signaling pathway(GO:0039533) positive regulation of MDA-5 signaling pathway(GO:1900245) |
| 0.0 | 0.1 | GO:0045819 | positive regulation of glycogen catabolic process(GO:0045819) |
| 0.0 | 0.5 | GO:0006265 | DNA topological change(GO:0006265) |
| 0.0 | 0.1 | GO:1990641 | response to iron ion starvation(GO:1990641) |
| 0.0 | 0.1 | GO:0061744 | motor behavior(GO:0061744) |
| 0.0 | 0.2 | GO:1901977 | negative regulation of cell cycle checkpoint(GO:1901977) |
| 0.0 | 1.2 | GO:0046785 | microtubule polymerization(GO:0046785) |
| 0.0 | 0.8 | GO:0000729 | DNA double-strand break processing(GO:0000729) |
| 0.0 | 1.1 | GO:0036258 | multivesicular body assembly(GO:0036258) |
| 0.0 | 1.1 | GO:0005980 | glycogen catabolic process(GO:0005980) |
| 0.0 | 0.2 | GO:0016480 | negative regulation of transcription from RNA polymerase III promoter(GO:0016480) |
| 0.0 | 0.2 | GO:0038169 | somatostatin receptor signaling pathway(GO:0038169) somatostatin signaling pathway(GO:0038170) |
| 0.0 | 0.7 | GO:1904353 | regulation of telomere capping(GO:1904353) |
| 0.0 | 0.3 | GO:0072592 | oxygen metabolic process(GO:0072592) |
| 0.0 | 0.2 | GO:0001905 | activation of membrane attack complex(GO:0001905) regulation of activation of membrane attack complex(GO:0001969) |
| 0.0 | 0.2 | GO:0006420 | arginyl-tRNA aminoacylation(GO:0006420) |
| 0.0 | 0.1 | GO:0060842 | arterial endothelial cell differentiation(GO:0060842) |
| 0.0 | 6.2 | GO:0098916 | chemical synaptic transmission(GO:0007268) anterograde trans-synaptic signaling(GO:0098916) |
| 0.0 | 0.5 | GO:0006103 | 2-oxoglutarate metabolic process(GO:0006103) |
| 0.0 | 0.1 | GO:0002426 | immunoglobulin production in mucosal tissue(GO:0002426) |
| 0.0 | 0.1 | GO:0034427 | nuclear-transcribed mRNA catabolic process, exonucleolytic, 3'-5'(GO:0034427) |
| 0.0 | 1.6 | GO:0006699 | bile acid biosynthetic process(GO:0006699) |
| 0.0 | 0.3 | GO:1904424 | regulation of GTP binding(GO:1904424) |
| 0.0 | 0.1 | GO:1902723 | negative regulation of skeletal muscle cell proliferation(GO:0014859) negative regulation of skeletal muscle satellite cell proliferation(GO:1902723) |
| 0.0 | 0.3 | GO:0060267 | positive regulation of respiratory burst(GO:0060267) |
| 0.0 | 0.1 | GO:0045875 | negative regulation of sister chromatid cohesion(GO:0045875) |
| 0.0 | 0.1 | GO:0019477 | L-lysine catabolic process to acetyl-CoA(GO:0019474) L-lysine catabolic process(GO:0019477) L-lysine metabolic process(GO:0046440) |
| 0.0 | 0.1 | GO:0050993 | dimethylallyl diphosphate biosynthetic process(GO:0050992) dimethylallyl diphosphate metabolic process(GO:0050993) |
| 0.0 | 0.1 | GO:0032490 | detection of molecule of bacterial origin(GO:0032490) |
| 0.0 | 0.2 | GO:1990481 | mRNA pseudouridine synthesis(GO:1990481) |
| 0.0 | 0.2 | GO:2000825 | positive regulation of androgen receptor activity(GO:2000825) |
| 0.0 | 0.2 | GO:0097039 | protein linear polyubiquitination(GO:0097039) |
| 0.0 | 0.1 | GO:0070634 | transepithelial ammonium transport(GO:0070634) |
| 0.0 | 0.3 | GO:0034501 | protein localization to kinetochore(GO:0034501) |
| 0.0 | 0.2 | GO:0018094 | protein polyglycylation(GO:0018094) |
| 0.0 | 0.1 | GO:0031120 | snRNA pseudouridine synthesis(GO:0031120) |
| 0.0 | 0.3 | GO:0019720 | Mo-molybdopterin cofactor biosynthetic process(GO:0006777) Mo-molybdopterin cofactor metabolic process(GO:0019720) |
| 0.0 | 0.1 | GO:0034312 | diol biosynthetic process(GO:0034312) sphingosine biosynthetic process(GO:0046512) |
| 0.0 | 0.6 | GO:0051131 | chaperone-mediated protein complex assembly(GO:0051131) |
| 0.0 | 0.1 | GO:0018106 | peptidyl-histidine phosphorylation(GO:0018106) |
| 0.0 | 0.1 | GO:1903265 | positive regulation of tumor necrosis factor-mediated signaling pathway(GO:1903265) |
| 0.0 | 0.2 | GO:0006741 | NADP biosynthetic process(GO:0006741) |
| 0.0 | 0.3 | GO:0006662 | glycerol ether metabolic process(GO:0006662) |
| 0.0 | 0.1 | GO:0019470 | 4-hydroxyproline catabolic process(GO:0019470) |
| 0.0 | 0.5 | GO:0048240 | sperm capacitation(GO:0048240) |
| 0.0 | 0.6 | GO:0046676 | negative regulation of insulin secretion(GO:0046676) |
| 0.0 | 0.4 | GO:2001275 | positive regulation of glucose import in response to insulin stimulus(GO:2001275) |
| 0.0 | 0.0 | GO:0071233 | cellular response to leucine(GO:0071233) |
| 0.0 | 0.0 | GO:1902725 | negative regulation of satellite cell differentiation(GO:1902725) |
| 0.0 | 0.1 | GO:0075713 | establishment of integrated proviral latency(GO:0075713) |
| 0.0 | 0.2 | GO:1900262 | regulation of DNA-directed DNA polymerase activity(GO:1900262) positive regulation of DNA-directed DNA polymerase activity(GO:1900264) |
| 0.0 | 0.2 | GO:0046069 | cGMP catabolic process(GO:0046069) |
| 0.0 | 0.2 | GO:0071711 | basement membrane organization(GO:0071711) |
| 0.0 | 0.2 | GO:0007598 | blood coagulation, extrinsic pathway(GO:0007598) |
| 0.0 | 0.1 | GO:0033615 | mitochondrial proton-transporting ATP synthase complex assembly(GO:0033615) |
| 0.0 | 0.2 | GO:2001259 | positive regulation of cation channel activity(GO:2001259) |
| 0.0 | 0.1 | GO:0001302 | replicative cell aging(GO:0001302) |
| 0.0 | 0.3 | GO:0044821 | meiotic telomere tethering at nuclear periphery(GO:0044821) meiotic attachment of telomere to nuclear envelope(GO:0070197) chromosome attachment to the nuclear envelope(GO:0097240) |
| 0.0 | 0.3 | GO:0016998 | cell wall macromolecule catabolic process(GO:0016998) |
| 0.0 | 0.2 | GO:0042262 | DNA protection(GO:0042262) |
| 0.0 | 0.1 | GO:1904245 | regulation of polynucleotide adenylyltransferase activity(GO:1904245) |
| 0.0 | 0.2 | GO:0043162 | ubiquitin-dependent protein catabolic process via the multivesicular body sorting pathway(GO:0043162) |
| 0.0 | 0.2 | GO:0098789 | pre-mRNA cleavage required for polyadenylation(GO:0098789) |
| 0.0 | 0.2 | GO:0003094 | glomerular filtration(GO:0003094) |
| 0.0 | 0.1 | GO:1903564 | regulation of protein localization to cilium(GO:1903564) |
| 0.0 | 0.3 | GO:0071044 | histone mRNA catabolic process(GO:0071044) |
| 0.0 | 0.1 | GO:2000535 | regulation of entry of bacterium into host cell(GO:2000535) |
| 0.0 | 0.1 | GO:0071596 | ubiquitin-dependent protein catabolic process via the N-end rule pathway(GO:0071596) |
| 0.0 | 0.5 | GO:0061641 | CENP-A containing nucleosome assembly(GO:0034080) CENP-A containing chromatin organization(GO:0061641) |
| 0.0 | 0.1 | GO:0046874 | quinolinate metabolic process(GO:0046874) |
| 0.0 | 0.2 | GO:0006622 | protein targeting to lysosome(GO:0006622) |
| 0.0 | 0.0 | GO:0060363 | cranial suture morphogenesis(GO:0060363) |
| 0.0 | 0.2 | GO:0006384 | transcription initiation from RNA polymerase III promoter(GO:0006384) |
| 0.0 | 0.1 | GO:0060384 | innervation(GO:0060384) |
| 0.0 | 0.1 | GO:1902525 | regulation of protein monoubiquitination(GO:1902525) |
| 0.0 | 0.1 | GO:0090070 | positive regulation of ribosome biogenesis(GO:0090070) positive regulation of rRNA processing(GO:2000234) |
| 0.0 | 0.2 | GO:0098535 | de novo centriole assembly(GO:0098535) |
| 0.0 | 0.1 | GO:0060628 | regulation of ER to Golgi vesicle-mediated transport(GO:0060628) |
| 0.0 | 0.2 | GO:0030207 | chondroitin sulfate catabolic process(GO:0030207) |
| 0.0 | 0.6 | GO:0015949 | nucleobase-containing small molecule interconversion(GO:0015949) |
| 0.0 | 0.1 | GO:0071600 | otic vesicle morphogenesis(GO:0071600) |
| 0.0 | 0.1 | GO:0035815 | positive regulation of renal sodium excretion(GO:0035815) |
| 0.0 | 0.2 | GO:0001682 | tRNA 5'-leader removal(GO:0001682) |
| 0.0 | 0.0 | GO:0048867 | ganglion mother cell fate determination(GO:0007402) stem cell fate determination(GO:0048867) |
| 0.0 | 0.1 | GO:0006729 | tetrahydrobiopterin biosynthetic process(GO:0006729) tetrahydrobiopterin metabolic process(GO:0046146) |
| 0.0 | 0.0 | GO:1900020 | regulation of protein kinase C activity(GO:1900019) positive regulation of protein kinase C activity(GO:1900020) |
| 0.0 | 0.1 | GO:0007016 | cytoskeletal anchoring at plasma membrane(GO:0007016) |
| 0.0 | 0.2 | GO:0003334 | keratinocyte development(GO:0003334) |
| 0.0 | 0.1 | GO:0061709 | reticulophagy(GO:0061709) |
| 0.0 | 0.0 | GO:0035674 | tricarboxylic acid transmembrane transport(GO:0035674) |
| 0.0 | 0.0 | GO:1903015 | regulation of exo-alpha-sialidase activity(GO:1903015) |
| 0.0 | 0.9 | GO:0008277 | regulation of G-protein coupled receptor protein signaling pathway(GO:0008277) |
| 0.0 | 0.1 | GO:0001833 | inner cell mass cell proliferation(GO:0001833) |
| 0.0 | 0.1 | GO:1990845 | adaptive thermogenesis(GO:1990845) |
| 0.0 | 0.3 | GO:0046475 | glycerophospholipid catabolic process(GO:0046475) |
| 0.0 | 0.0 | GO:0035616 | histone H2B conserved C-terminal lysine deubiquitination(GO:0035616) |
| 0.0 | 0.2 | GO:0035090 | maintenance of apical/basal cell polarity(GO:0035090) maintenance of epithelial cell apical/basal polarity(GO:0045199) |
| 0.0 | 0.0 | GO:0040009 | regulation of growth rate(GO:0040009) |
| 0.0 | 0.2 | GO:0061049 | physiological muscle hypertrophy(GO:0003298) physiological cardiac muscle hypertrophy(GO:0003301) cell growth involved in cardiac muscle cell development(GO:0061049) |
| 0.0 | 0.1 | GO:0042407 | cristae formation(GO:0042407) |
| 0.0 | 0.1 | GO:0010756 | positive regulation of plasminogen activation(GO:0010756) |
Gene overrepresentation in cellular component category:
| Log-likelihood per target | Total log-likelihood | Term | Description |
|---|---|---|---|
| 6.8 | 33.9 | GO:0038039 | G-protein coupled receptor heterodimeric complex(GO:0038039) |
| 3.9 | 19.5 | GO:0072534 | perineuronal net(GO:0072534) |
| 3.5 | 27.9 | GO:0070554 | synaptobrevin 2-SNAP-25-syntaxin-3-complexin complex(GO:0070554) |
| 3.0 | 8.9 | GO:0034686 | integrin alphav-beta8 complex(GO:0034686) |
| 2.7 | 10.8 | GO:0070032 | synaptobrevin 2-SNAP-25-syntaxin-1a-complexin I complex(GO:0070032) |
| 2.4 | 21.8 | GO:0048787 | presynaptic active zone membrane(GO:0048787) |
| 2.2 | 65.0 | GO:0044300 | cerebellar mossy fiber(GO:0044300) |
| 2.0 | 28.0 | GO:0030314 | junctional membrane complex(GO:0030314) |
| 2.0 | 9.8 | GO:1902937 | inward rectifier potassium channel complex(GO:1902937) |
| 1.7 | 11.7 | GO:0005945 | 6-phosphofructokinase complex(GO:0005945) |
| 1.6 | 14.8 | GO:0044326 | dendritic spine neck(GO:0044326) |
| 1.6 | 1.6 | GO:0044301 | climbing fiber(GO:0044301) |
| 1.6 | 72.1 | GO:1902710 | GABA receptor complex(GO:1902710) GABA-A receptor complex(GO:1902711) |
| 1.6 | 36.0 | GO:0060077 | inhibitory synapse(GO:0060077) |
| 1.5 | 12.3 | GO:0060203 | clathrin-sculpted glutamate transport vesicle(GO:0060199) clathrin-sculpted glutamate transport vesicle membrane(GO:0060203) |
| 1.5 | 4.6 | GO:0060187 | cell pole(GO:0060187) |
| 1.5 | 60.9 | GO:0043194 | axon initial segment(GO:0043194) |
| 1.5 | 17.8 | GO:0033269 | internode region of axon(GO:0033269) |
| 1.4 | 2.9 | GO:0097135 | cyclin E2-CDK2 complex(GO:0097135) |
| 1.4 | 12.5 | GO:0032584 | growth cone membrane(GO:0032584) |
| 1.4 | 8.2 | GO:0044393 | microspike(GO:0044393) |
| 1.4 | 4.1 | GO:1990622 | CHOP-ATF3 complex(GO:1990622) |
| 1.3 | 22.0 | GO:0097512 | cardiac myofibril(GO:0097512) |
| 1.3 | 1.3 | GO:0005883 | neurofilament(GO:0005883) |
| 1.2 | 6.2 | GO:1990742 | microvesicle(GO:1990742) |
| 1.2 | 12.4 | GO:0071953 | elastic fiber(GO:0071953) |
| 1.2 | 28.3 | GO:1990454 | L-type voltage-gated calcium channel complex(GO:1990454) |
| 1.2 | 61.2 | GO:0032281 | AMPA glutamate receptor complex(GO:0032281) |
| 1.2 | 5.9 | GO:0033596 | TSC1-TSC2 complex(GO:0033596) |
| 1.2 | 3.5 | GO:0005914 | spot adherens junction(GO:0005914) |
| 1.1 | 4.5 | GO:0097123 | cyclin A1-CDK2 complex(GO:0097123) |
| 1.1 | 9.8 | GO:0016012 | sarcoglycan complex(GO:0016012) |
| 1.1 | 11.8 | GO:0098845 | postsynaptic endosome(GO:0098845) |
| 1.1 | 3.2 | GO:0097489 | multivesicular body, internal vesicle lumen(GO:0097489) |
| 1.0 | 25.1 | GO:0017146 | NMDA selective glutamate receptor complex(GO:0017146) |
| 1.0 | 16.6 | GO:0031209 | SCAR complex(GO:0031209) |
| 1.0 | 3.1 | GO:0030849 | autosome(GO:0030849) |
| 1.0 | 23.8 | GO:0005890 | sodium:potassium-exchanging ATPase complex(GO:0005890) |
| 1.0 | 7.9 | GO:0032279 | asymmetric synapse(GO:0032279) |
| 1.0 | 1.0 | GO:0016533 | cyclin-dependent protein kinase 5 holoenzyme complex(GO:0016533) |
| 0.9 | 4.5 | GO:0014802 | terminal cisterna(GO:0014802) |
| 0.9 | 8.0 | GO:0031673 | H zone(GO:0031673) |
| 0.9 | 12.9 | GO:0030285 | integral component of synaptic vesicle membrane(GO:0030285) intrinsic component of synaptic vesicle membrane(GO:0098563) |
| 0.8 | 2.5 | GO:0005584 | collagen type I trimer(GO:0005584) |
| 0.8 | 38.9 | GO:0002080 | acrosomal membrane(GO:0002080) |
| 0.8 | 3.3 | GO:0098855 | HCN channel complex(GO:0098855) |
| 0.8 | 0.8 | GO:0043260 | laminin-11 complex(GO:0043260) |
| 0.8 | 17.7 | GO:0001518 | voltage-gated sodium channel complex(GO:0001518) |
| 0.8 | 11.0 | GO:0016942 | insulin-like growth factor binding protein complex(GO:0016942) growth factor complex(GO:0036454) |
| 0.8 | 3.1 | GO:0038038 | G-protein coupled receptor homodimeric complex(GO:0038038) |
| 0.8 | 10.7 | GO:0005853 | eukaryotic translation elongation factor 1 complex(GO:0005853) |
| 0.8 | 5.3 | GO:1990761 | growth cone lamellipodium(GO:1990761) |
| 0.7 | 8.2 | GO:0097442 | CA3 pyramidal cell dendrite(GO:0097442) |
| 0.7 | 13.3 | GO:0097418 | neurofibrillary tangle(GO:0097418) |
| 0.7 | 5.6 | GO:1990682 | CSF1-CSF1R complex(GO:1990682) |
| 0.7 | 12.6 | GO:0033270 | paranode region of axon(GO:0033270) |
| 0.7 | 3.4 | GO:0005854 | nascent polypeptide-associated complex(GO:0005854) |
| 0.7 | 147.2 | GO:0043204 | perikaryon(GO:0043204) |
| 0.6 | 1.9 | GO:0020005 | symbiont-containing vacuole membrane(GO:0020005) |
| 0.6 | 3.2 | GO:0044294 | dendritic growth cone(GO:0044294) |
| 0.6 | 17.5 | GO:0005952 | cAMP-dependent protein kinase complex(GO:0005952) |
| 0.6 | 5.1 | GO:0070110 | ciliary neurotrophic factor receptor complex(GO:0070110) |
| 0.6 | 4.5 | GO:0097209 | epidermal lamellar body(GO:0097209) |
| 0.6 | 7.7 | GO:0005955 | calcineurin complex(GO:0005955) |
| 0.6 | 8.1 | GO:0005589 | collagen type VI trimer(GO:0005589) collagen beaded filament(GO:0098647) |
| 0.6 | 1.8 | GO:0098839 | postsynaptic density membrane(GO:0098839) |
| 0.6 | 4.2 | GO:1990393 | 3M complex(GO:1990393) |
| 0.6 | 8.9 | GO:0030478 | actin cap(GO:0030478) |
| 0.6 | 7.1 | GO:0005664 | origin recognition complex(GO:0000808) nuclear origin of replication recognition complex(GO:0005664) |
| 0.6 | 4.1 | GO:0030934 | anchoring collagen complex(GO:0030934) |
| 0.6 | 8.8 | GO:0000137 | Golgi cis cisterna(GO:0000137) |
| 0.6 | 90.0 | GO:0008076 | voltage-gated potassium channel complex(GO:0008076) |
| 0.6 | 6.8 | GO:0016589 | NURF complex(GO:0016589) |
| 0.6 | 6.8 | GO:0030061 | mitochondrial crista(GO:0030061) |
| 0.6 | 9.6 | GO:0032591 | dendritic spine membrane(GO:0032591) |
| 0.5 | 2.7 | GO:0002133 | polycystin complex(GO:0002133) |
| 0.5 | 2.2 | GO:0070701 | mucus layer(GO:0070701) |
| 0.5 | 46.3 | GO:0042734 | presynaptic membrane(GO:0042734) |
| 0.5 | 1.6 | GO:0034673 | inhibin-betaglycan-ActRII complex(GO:0034673) |
| 0.5 | 56.2 | GO:0030672 | synaptic vesicle membrane(GO:0030672) exocytic vesicle membrane(GO:0099501) |
| 0.5 | 7.7 | GO:0035253 | ciliary rootlet(GO:0035253) |
| 0.5 | 9.7 | GO:0008091 | spectrin(GO:0008091) |
| 0.5 | 197.5 | GO:0099572 | postsynaptic density(GO:0014069) postsynaptic specialization(GO:0099572) |
| 0.5 | 4.0 | GO:0012510 | trans-Golgi network transport vesicle membrane(GO:0012510) |
| 0.5 | 17.0 | GO:0030673 | axolemma(GO:0030673) |
| 0.5 | 8.6 | GO:0045180 | basal cortex(GO:0045180) |
| 0.5 | 0.5 | GO:0034681 | integrin alpha11-beta1 complex(GO:0034681) |
| 0.5 | 7.1 | GO:0043083 | synaptic cleft(GO:0043083) |
| 0.5 | 7.5 | GO:0048786 | presynaptic active zone(GO:0048786) |
| 0.5 | 1.4 | GO:0016939 | kinesin II complex(GO:0016939) |
| 0.5 | 0.9 | GO:0048237 | rough endoplasmic reticulum lumen(GO:0048237) |
| 0.5 | 1.8 | GO:0097229 | sperm end piece(GO:0097229) |
| 0.4 | 3.0 | GO:0090661 | box H/ACA scaRNP complex(GO:0072589) box H/ACA telomerase RNP complex(GO:0090661) |
| 0.4 | 1.3 | GO:0097224 | sperm connecting piece(GO:0097224) |
| 0.4 | 1.3 | GO:0043291 | RAVE complex(GO:0043291) |
| 0.4 | 8.7 | GO:0008074 | guanylate cyclase complex, soluble(GO:0008074) |
| 0.4 | 8.0 | GO:0043203 | axon hillock(GO:0043203) |
| 0.4 | 3.9 | GO:0000798 | nuclear cohesin complex(GO:0000798) |
| 0.4 | 3.1 | GO:0032133 | chromosome passenger complex(GO:0032133) |
| 0.4 | 2.7 | GO:0000801 | central element(GO:0000801) |
| 0.4 | 3.7 | GO:0005593 | FACIT collagen trimer(GO:0005593) |
| 0.4 | 3.3 | GO:0097425 | smooth endoplasmic reticulum membrane(GO:0030868) smooth endoplasmic reticulum part(GO:0097425) |
| 0.4 | 0.4 | GO:0043034 | costamere(GO:0043034) |
| 0.4 | 1.1 | GO:0000229 | cytoplasmic chromosome(GO:0000229) |
| 0.3 | 0.7 | GO:0005900 | oncostatin-M receptor complex(GO:0005900) |
| 0.3 | 1.0 | GO:1990917 | sperm head plasma membrane(GO:1990913) ooplasm(GO:1990917) |
| 0.3 | 1.7 | GO:0014701 | junctional sarcoplasmic reticulum membrane(GO:0014701) |
| 0.3 | 12.3 | GO:0043198 | dendritic shaft(GO:0043198) |
| 0.3 | 14.4 | GO:0016581 | NuRD complex(GO:0016581) CHD-type complex(GO:0090545) |
| 0.3 | 3.1 | GO:0031428 | box C/D snoRNP complex(GO:0031428) |
| 0.3 | 0.3 | GO:0043259 | laminin-10 complex(GO:0043259) |
| 0.3 | 20.4 | GO:0043195 | terminal bouton(GO:0043195) |
| 0.3 | 5.1 | GO:0033391 | chromatoid body(GO:0033391) |
| 0.3 | 75.4 | GO:0031225 | anchored component of membrane(GO:0031225) |
| 0.3 | 0.3 | GO:0097441 | basilar dendrite(GO:0097441) |
| 0.3 | 4.6 | GO:0032589 | neuron projection membrane(GO:0032589) |
| 0.3 | 6.1 | GO:0060076 | excitatory synapse(GO:0060076) |
| 0.3 | 0.9 | GO:0043159 | acrosomal matrix(GO:0043159) |
| 0.3 | 0.6 | GO:0005656 | nuclear pre-replicative complex(GO:0005656) pre-replicative complex(GO:0036387) |
| 0.3 | 3.6 | GO:0036128 | CatSper complex(GO:0036128) |
| 0.3 | 0.6 | GO:0016011 | dystroglycan complex(GO:0016011) |
| 0.3 | 1.8 | GO:1990131 | Gtr1-Gtr2 GTPase complex(GO:1990131) |
| 0.3 | 1.2 | GO:0030893 | meiotic cohesin complex(GO:0030893) |
| 0.3 | 1.2 | GO:0035748 | myelin sheath abaxonal region(GO:0035748) |
| 0.3 | 23.2 | GO:0005834 | heterotrimeric G-protein complex(GO:0005834) |
| 0.3 | 2.0 | GO:0072687 | meiotic spindle(GO:0072687) |
| 0.3 | 5.7 | GO:0005818 | astral microtubule(GO:0000235) aster(GO:0005818) |
| 0.3 | 2.8 | GO:0097427 | microtubule bundle(GO:0097427) |
| 0.3 | 2.2 | GO:1990452 | Parkin-FBXW7-Cul1 ubiquitin ligase complex(GO:1990452) |
| 0.3 | 55.0 | GO:0030426 | growth cone(GO:0030426) |
| 0.3 | 8.0 | GO:0005922 | connexon complex(GO:0005922) |
| 0.3 | 0.5 | GO:0098592 | cytoplasmic side of apical plasma membrane(GO:0098592) |
| 0.3 | 2.7 | GO:0005672 | transcription factor TFIIA complex(GO:0005672) |
| 0.3 | 0.5 | GO:1905103 | integral component of lysosomal membrane(GO:1905103) |
| 0.3 | 4.7 | GO:0032059 | bleb(GO:0032059) |
| 0.3 | 2.6 | GO:0031298 | replication fork protection complex(GO:0031298) |
| 0.3 | 88.0 | GO:0043025 | neuronal cell body(GO:0043025) |
| 0.3 | 1.3 | GO:0097440 | apical dendrite(GO:0097440) |
| 0.3 | 1.3 | GO:0036156 | inner dynein arm(GO:0036156) |
| 0.2 | 3.5 | GO:0005587 | collagen type IV trimer(GO:0005587) |
| 0.2 | 1.2 | GO:0071149 | TEAD-2-YAP complex(GO:0071149) |
| 0.2 | 1.0 | GO:0032982 | myosin filament(GO:0032982) |
| 0.2 | 3.0 | GO:0070449 | elongin complex(GO:0070449) |
| 0.2 | 1.5 | GO:0046696 | lipopolysaccharide receptor complex(GO:0046696) |
| 0.2 | 1.0 | GO:0071920 | cleavage body(GO:0071920) |
| 0.2 | 2.8 | GO:0005869 | dynactin complex(GO:0005869) |
| 0.2 | 1.8 | GO:0002177 | manchette(GO:0002177) |
| 0.2 | 11.2 | GO:0000159 | protein phosphatase type 2A complex(GO:0000159) |
| 0.2 | 5.4 | GO:0030056 | hemidesmosome(GO:0030056) |
| 0.2 | 2.9 | GO:0001939 | female pronucleus(GO:0001939) |
| 0.2 | 2.2 | GO:0002116 | semaphorin receptor complex(GO:0002116) |
| 0.2 | 0.9 | GO:0000333 | telomerase catalytic core complex(GO:0000333) |
| 0.2 | 4.4 | GO:0005605 | basal lamina(GO:0005605) |
| 0.2 | 0.6 | GO:0001534 | radial spoke(GO:0001534) |
| 0.2 | 0.4 | GO:1990923 | PET complex(GO:1990923) |
| 0.2 | 30.1 | GO:0097060 | synaptic membrane(GO:0097060) |
| 0.2 | 0.8 | GO:0005899 | insulin receptor complex(GO:0005899) |
| 0.2 | 0.2 | GO:0005606 | laminin-1 complex(GO:0005606) |
| 0.2 | 0.8 | GO:0039714 | viral factory(GO:0039713) cytoplasmic viral factory(GO:0039714) host cell viral assembly compartment(GO:0072517) |
| 0.2 | 16.7 | GO:0005871 | kinesin complex(GO:0005871) |
| 0.2 | 6.1 | GO:0031307 | integral component of mitochondrial outer membrane(GO:0031307) |
| 0.2 | 1.6 | GO:0033165 | interphotoreceptor matrix(GO:0033165) |
| 0.2 | 1.0 | GO:0043219 | lateral loop(GO:0043219) |
| 0.2 | 7.9 | GO:0005865 | striated muscle thin filament(GO:0005865) |
| 0.2 | 1.2 | GO:0044306 | neuron projection terminus(GO:0044306) |
| 0.2 | 22.1 | GO:0005905 | clathrin-coated pit(GO:0005905) |
| 0.2 | 0.4 | GO:0019034 | viral replication complex(GO:0019034) |
| 0.2 | 1.4 | GO:0009331 | glycerol-3-phosphate dehydrogenase complex(GO:0009331) |
| 0.2 | 1.1 | GO:0033565 | ESCRT-0 complex(GO:0033565) |
| 0.2 | 0.7 | GO:0005588 | collagen type V trimer(GO:0005588) |
| 0.2 | 1.8 | GO:0031466 | Cul5-RING ubiquitin ligase complex(GO:0031466) |
| 0.2 | 1.1 | GO:0005967 | mitochondrial pyruvate dehydrogenase complex(GO:0005967) |
| 0.2 | 1.8 | GO:0097539 | ciliary transition fiber(GO:0097539) |
| 0.2 | 2.2 | GO:0031595 | nuclear proteasome complex(GO:0031595) |
| 0.2 | 1.3 | GO:0070761 | pre-snoRNP complex(GO:0070761) |
| 0.2 | 0.5 | GO:0033011 | perinuclear theca(GO:0033011) |
| 0.2 | 1.2 | GO:0032444 | activin responsive factor complex(GO:0032444) |
| 0.2 | 0.5 | GO:0089717 | spanning component of plasma membrane(GO:0044214) spanning component of membrane(GO:0089717) |
| 0.2 | 0.5 | GO:0031510 | SUMO activating enzyme complex(GO:0031510) |
| 0.2 | 84.1 | GO:0045202 | synapse(GO:0045202) |
| 0.2 | 2.0 | GO:0001673 | male germ cell nucleus(GO:0001673) |
| 0.2 | 0.3 | GO:0097125 | cyclin B1-CDK1 complex(GO:0097125) |
| 0.2 | 0.7 | GO:0034455 | t-UTP complex(GO:0034455) |
| 0.2 | 1.8 | GO:0036157 | outer dynein arm(GO:0036157) |
| 0.2 | 0.7 | GO:0097422 | tubular endosome(GO:0097422) |
| 0.2 | 1.0 | GO:0005958 | DNA-dependent protein kinase-DNA ligase 4 complex(GO:0005958) |
| 0.2 | 2.8 | GO:0030877 | beta-catenin destruction complex(GO:0030877) |
| 0.2 | 1.9 | GO:0097197 | tetraspanin-enriched microdomain(GO:0097197) |
| 0.2 | 4.6 | GO:0035327 | transcriptionally active chromatin(GO:0035327) |
| 0.2 | 1.2 | GO:0016272 | prefoldin complex(GO:0016272) |
| 0.2 | 17.2 | GO:0005581 | collagen trimer(GO:0005581) |
| 0.1 | 0.6 | GO:0002189 | ribose phosphate diphosphokinase complex(GO:0002189) |
| 0.1 | 1.3 | GO:0001739 | sex chromatin(GO:0001739) |
| 0.1 | 1.6 | GO:0016342 | catenin complex(GO:0016342) |
| 0.1 | 8.8 | GO:0034704 | calcium channel complex(GO:0034704) |
| 0.1 | 0.4 | GO:1990716 | axonemal central apparatus(GO:1990716) |
| 0.1 | 0.6 | GO:0031515 | tRNA (m1A) methyltransferase complex(GO:0031515) |
| 0.1 | 5.1 | GO:0031312 | extrinsic component of organelle membrane(GO:0031312) |
| 0.1 | 0.6 | GO:0071547 | piP-body(GO:0071547) |
| 0.1 | 3.0 | GO:0000800 | lateral element(GO:0000800) |
| 0.1 | 2.1 | GO:0034464 | BBSome(GO:0034464) |
| 0.1 | 1.1 | GO:0032021 | NELF complex(GO:0032021) |
| 0.1 | 10.9 | GO:0036064 | ciliary basal body(GO:0036064) |
| 0.1 | 4.2 | GO:0035145 | exon-exon junction complex(GO:0035145) |
| 0.1 | 1.5 | GO:0033643 | host cell part(GO:0033643) |
| 0.1 | 11.2 | GO:0036126 | sperm flagellum(GO:0036126) |
| 0.1 | 0.7 | GO:0032301 | MutSalpha complex(GO:0032301) |
| 0.1 | 1.7 | GO:0031527 | filopodium membrane(GO:0031527) |
| 0.1 | 0.3 | GO:0002139 | stereocilia coupling link(GO:0002139) |
| 0.1 | 3.6 | GO:0030992 | intraciliary transport particle B(GO:0030992) |
| 0.1 | 4.3 | GO:0000421 | autophagosome membrane(GO:0000421) |
| 0.1 | 0.8 | GO:0032044 | DSIF complex(GO:0032044) |
| 0.1 | 12.7 | GO:0005875 | microtubule associated complex(GO:0005875) |
| 0.1 | 3.9 | GO:0071782 | endoplasmic reticulum tubular network(GO:0071782) |
| 0.1 | 2.0 | GO:0030123 | AP-3 adaptor complex(GO:0030123) |
| 0.1 | 1.1 | GO:0030896 | checkpoint clamp complex(GO:0030896) |
| 0.1 | 0.1 | GO:0034274 | Atg12-Atg5-Atg16 complex(GO:0034274) |
| 0.1 | 3.9 | GO:0005685 | U1 snRNP(GO:0005685) |
| 0.1 | 5.3 | GO:0031514 | motile cilium(GO:0031514) |
| 0.1 | 0.2 | GO:0031436 | BRCA1-BARD1 complex(GO:0031436) |
| 0.1 | 9.5 | GO:0055038 | recycling endosome membrane(GO:0055038) |
| 0.1 | 0.5 | GO:0032798 | Swi5-Sfr1 complex(GO:0032798) |
| 0.1 | 3.7 | GO:0005614 | interstitial matrix(GO:0005614) |
| 0.1 | 4.4 | GO:0035869 | ciliary transition zone(GO:0035869) |
| 0.1 | 2.1 | GO:0030904 | retromer complex(GO:0030904) |
| 0.1 | 1.7 | GO:0000940 | condensed chromosome outer kinetochore(GO:0000940) |
| 0.1 | 1.8 | GO:0046930 | pore complex(GO:0046930) |
| 0.1 | 1.5 | GO:0044291 | cell-cell contact zone(GO:0044291) |
| 0.1 | 0.5 | GO:0061617 | MICOS complex(GO:0061617) |
| 0.1 | 0.3 | GO:0032391 | photoreceptor connecting cilium(GO:0032391) |
| 0.1 | 0.3 | GO:0070877 | microprocessor complex(GO:0070877) ribonuclease III complex(GO:1903095) |
| 0.1 | 0.9 | GO:0031462 | Cul2-RING ubiquitin ligase complex(GO:0031462) |
| 0.1 | 6.0 | GO:0005901 | caveola(GO:0005901) |
| 0.1 | 2.4 | GO:0032585 | multivesicular body membrane(GO:0032585) |
| 0.1 | 0.5 | GO:0001652 | granular component(GO:0001652) |
| 0.1 | 0.7 | GO:0036021 | endolysosome lumen(GO:0036021) |
| 0.1 | 0.9 | GO:0031528 | microvillus membrane(GO:0031528) |
| 0.1 | 0.6 | GO:0090665 | dystrophin-associated glycoprotein complex(GO:0016010) glycoprotein complex(GO:0090665) |
| 0.1 | 13.3 | GO:0030424 | axon(GO:0030424) |
| 0.1 | 11.0 | GO:0031903 | peroxisomal membrane(GO:0005778) microbody membrane(GO:0031903) |
| 0.1 | 0.7 | GO:0002199 | zona pellucida receptor complex(GO:0002199) |
| 0.1 | 4.7 | GO:0035861 | site of double-strand break(GO:0035861) |
| 0.1 | 0.4 | GO:0030956 | glutamyl-tRNA(Gln) amidotransferase complex(GO:0030956) |
| 0.1 | 0.8 | GO:0097255 | R2TP complex(GO:0097255) |
| 0.1 | 1.6 | GO:0016580 | Sin3 complex(GO:0016580) |
| 0.1 | 1.6 | GO:0010369 | chromocenter(GO:0010369) |
| 0.1 | 0.9 | GO:0044354 | pinosome(GO:0044352) macropinosome(GO:0044354) |
| 0.1 | 14.3 | GO:0043209 | myelin sheath(GO:0043209) |
| 0.1 | 1.5 | GO:0043218 | compact myelin(GO:0043218) |
| 0.1 | 0.5 | GO:0051286 | cell tip(GO:0051286) |
| 0.1 | 0.8 | GO:0034709 | methylosome(GO:0034709) |
| 0.1 | 6.3 | GO:0060170 | ciliary membrane(GO:0060170) |
| 0.1 | 0.4 | GO:0000788 | nuclear nucleosome(GO:0000788) |
| 0.1 | 0.4 | GO:0070822 | Sin3-type complex(GO:0070822) |
| 0.1 | 0.3 | GO:0031467 | Cul7-RING ubiquitin ligase complex(GO:0031467) |
| 0.1 | 0.4 | GO:0005960 | glycine cleavage complex(GO:0005960) |
| 0.1 | 20.3 | GO:0030017 | sarcomere(GO:0030017) |
| 0.1 | 0.8 | GO:0033180 | proton-transporting V-type ATPase, V1 domain(GO:0033180) |
| 0.1 | 0.1 | GO:0031429 | box H/ACA snoRNP complex(GO:0031429) box H/ACA RNP complex(GO:0072588) |
| 0.1 | 1.1 | GO:0005686 | U2 snRNP(GO:0005686) |
| 0.1 | 0.4 | GO:0000125 | PCAF complex(GO:0000125) |
| 0.1 | 0.2 | GO:0071546 | pi-body(GO:0071546) |
| 0.1 | 2.2 | GO:0043189 | NuA4 histone acetyltransferase complex(GO:0035267) H4/H2A histone acetyltransferase complex(GO:0043189) H4 histone acetyltransferase complex(GO:1902562) |
| 0.1 | 1.1 | GO:0099738 | cell cortex region(GO:0099738) |
| 0.1 | 0.5 | GO:0032389 | MutLalpha complex(GO:0032389) |
| 0.1 | 0.7 | GO:0016593 | Cdc73/Paf1 complex(GO:0016593) |
| 0.1 | 1.1 | GO:0072546 | ER membrane protein complex(GO:0072546) |
| 0.1 | 0.2 | GO:0072563 | endothelial microparticle(GO:0072563) |
| 0.1 | 0.1 | GO:0030981 | cortical microtubule cytoskeleton(GO:0030981) |
| 0.1 | 27.5 | GO:0005874 | microtubule(GO:0005874) |
| 0.1 | 0.3 | GO:0033018 | sarcoplasmic reticulum lumen(GO:0033018) |
| 0.1 | 0.4 | GO:0000126 | transcription factor TFIIIB complex(GO:0000126) |
| 0.1 | 0.2 | GO:0071006 | U2-type catalytic step 1 spliceosome(GO:0071006) |
| 0.1 | 0.6 | GO:0042719 | mitochondrial intermembrane space protein transporter complex(GO:0042719) |
| 0.1 | 1.4 | GO:0030057 | desmosome(GO:0030057) |
| 0.1 | 0.4 | GO:0005916 | fascia adherens(GO:0005916) |
| 0.1 | 0.3 | GO:0030891 | VCB complex(GO:0030891) |
| 0.1 | 0.2 | GO:0044611 | nuclear pore inner ring(GO:0044611) |
| 0.1 | 0.2 | GO:0071439 | clathrin complex(GO:0071439) |
| 0.1 | 0.7 | GO:0033162 | melanosome membrane(GO:0033162) chitosome(GO:0045009) |
| 0.1 | 2.4 | GO:0042383 | sarcolemma(GO:0042383) |
| 0.1 | 2.5 | GO:0097014 | axoneme(GO:0005930) ciliary plasm(GO:0097014) |
| 0.1 | 0.3 | GO:0045293 | MIS complex(GO:0036396) mRNA editing complex(GO:0045293) |
| 0.1 | 0.2 | GO:0016222 | procollagen-proline 4-dioxygenase complex(GO:0016222) |
| 0.1 | 1.0 | GO:0005640 | nuclear outer membrane(GO:0005640) |
| 0.1 | 0.3 | GO:0070826 | paraferritin complex(GO:0070826) |
| 0.1 | 0.1 | GO:1990423 | RZZ complex(GO:1990423) |
| 0.1 | 4.7 | GO:0042641 | actomyosin(GO:0042641) |
| 0.1 | 0.2 | GO:0042720 | mitochondrial inner membrane peptidase complex(GO:0042720) |
| 0.1 | 0.3 | GO:0043564 | Ku70:Ku80 complex(GO:0043564) |
| 0.1 | 0.4 | GO:0005846 | nuclear cap binding complex(GO:0005846) |
| 0.1 | 0.4 | GO:1990130 | Iml1 complex(GO:1990130) |
| 0.1 | 0.1 | GO:1990723 | cytoplasmic periphery of the nuclear pore complex(GO:1990723) |
| 0.1 | 0.4 | GO:0033063 | Rad51B-Rad51C-Rad51D-XRCC2 complex(GO:0033063) |
| 0.1 | 3.3 | GO:0019005 | SCF ubiquitin ligase complex(GO:0019005) |
| 0.1 | 0.1 | GO:0033178 | proton-transporting two-sector ATPase complex, catalytic domain(GO:0033178) |
| 0.0 | 0.2 | GO:0097232 | lamellar body membrane(GO:0097232) alveolar lamellar body membrane(GO:0097233) |
| 0.0 | 0.2 | GO:0030991 | intraciliary transport particle A(GO:0030991) |
| 0.0 | 0.5 | GO:0000439 | core TFIIH complex(GO:0000439) |
| 0.0 | 0.6 | GO:0034045 | pre-autophagosomal structure membrane(GO:0034045) |
| 0.0 | 3.1 | GO:0005604 | basement membrane(GO:0005604) |
| 0.0 | 0.7 | GO:0000815 | ESCRT III complex(GO:0000815) |
| 0.0 | 1.0 | GO:0046540 | U4/U6 x U5 tri-snRNP complex(GO:0046540) |
| 0.0 | 0.4 | GO:0000176 | nuclear exosome (RNase complex)(GO:0000176) |
| 0.0 | 0.3 | GO:0032797 | SMN complex(GO:0032797) |
| 0.0 | 0.3 | GO:0000407 | pre-autophagosomal structure(GO:0000407) |
| 0.0 | 0.1 | GO:0031306 | intrinsic component of mitochondrial outer membrane(GO:0031306) |
| 0.0 | 0.1 | GO:0097543 | ciliary inversin compartment(GO:0097543) |
| 0.0 | 0.4 | GO:0005638 | lamin filament(GO:0005638) |
| 0.0 | 1.2 | GO:0016528 | sarcoplasm(GO:0016528) |
| 0.0 | 0.6 | GO:0035859 | Seh1-associated complex(GO:0035859) |
| 0.0 | 0.7 | GO:0033176 | proton-transporting V-type ATPase complex(GO:0033176) |
| 0.0 | 0.2 | GO:0071797 | LUBAC complex(GO:0071797) |
| 0.0 | 5.2 | GO:0031012 | extracellular matrix(GO:0031012) |
| 0.0 | 0.1 | GO:0035101 | FACT complex(GO:0035101) |
| 0.0 | 0.3 | GO:0072379 | BAT3 complex(GO:0071818) ER membrane insertion complex(GO:0072379) |
| 0.0 | 0.1 | GO:0042612 | MHC class I protein complex(GO:0042612) |
| 0.0 | 0.2 | GO:0008278 | cohesin complex(GO:0008278) |
| 0.0 | 0.3 | GO:0005786 | signal recognition particle, endoplasmic reticulum targeting(GO:0005786) |
| 0.0 | 2.0 | GO:0005913 | cell-cell adherens junction(GO:0005913) |
| 0.0 | 0.2 | GO:0005663 | DNA replication factor C complex(GO:0005663) |
| 0.0 | 0.2 | GO:0034388 | Pwp2p-containing subcomplex of 90S preribosome(GO:0034388) |
| 0.0 | 0.2 | GO:0005732 | small nucleolar ribonucleoprotein complex(GO:0005732) |
| 0.0 | 0.1 | GO:0031262 | Ndc80 complex(GO:0031262) |
| 0.0 | 0.5 | GO:0030686 | 90S preribosome(GO:0030686) |
| 0.0 | 0.1 | GO:0005687 | U4 snRNP(GO:0005687) |
| 0.0 | 0.2 | GO:1990745 | EARP complex(GO:1990745) |
| 0.0 | 0.4 | GO:0000124 | SAGA complex(GO:0000124) |
| 0.0 | 0.8 | GO:0030687 | preribosome, large subunit precursor(GO:0030687) |
| 0.0 | 0.4 | GO:0008385 | IkappaB kinase complex(GO:0008385) |
| 0.0 | 0.1 | GO:0045254 | pyruvate dehydrogenase complex(GO:0045254) |
| 0.0 | 0.1 | GO:0097524 | sperm plasma membrane(GO:0097524) |
| 0.0 | 0.1 | GO:0030688 | preribosome, small subunit precursor(GO:0030688) |
| 0.0 | 1.3 | GO:0005637 | nuclear inner membrane(GO:0005637) |
| 0.0 | 0.1 | GO:0031084 | BLOC-2 complex(GO:0031084) |
| 0.0 | 0.4 | GO:0070971 | endoplasmic reticulum exit site(GO:0070971) |
| 0.0 | 0.1 | GO:0030897 | HOPS complex(GO:0030897) |
| 0.0 | 4.3 | GO:0005578 | proteinaceous extracellular matrix(GO:0005578) |
| 0.0 | 0.0 | GO:0043614 | eukaryotic 48S preinitiation complex(GO:0033290) multi-eIF complex(GO:0043614) translation initiation ternary complex(GO:0044207) |
| 0.0 | 0.0 | GO:0097136 | Bcl-2 family protein complex(GO:0097136) |
| 0.0 | 0.1 | GO:0060091 | kinocilium(GO:0060091) |
| 0.0 | 0.1 | GO:0031616 | spindle pole centrosome(GO:0031616) |
| 0.0 | 0.3 | GO:0005665 | DNA-directed RNA polymerase II, core complex(GO:0005665) |
| 0.0 | 0.2 | GO:0042555 | MCM complex(GO:0042555) |
| 0.0 | 2.3 | GO:0016323 | basolateral plasma membrane(GO:0016323) |
| 0.0 | 1.0 | GO:0042579 | peroxisome(GO:0005777) microbody(GO:0042579) |
| 0.0 | 0.1 | GO:0031417 | NatC complex(GO:0031417) |
Gene overrepresentation in molecular function category:
| Log-likelihood per target | Total log-likelihood | Term | Description |
|---|---|---|---|
| 5.7 | 34.2 | GO:0004965 | G-protein coupled GABA receptor activity(GO:0004965) |
| 3.3 | 13.1 | GO:0031751 | D4 dopamine receptor binding(GO:0031751) |
| 3.1 | 30.6 | GO:0031812 | G-protein coupled nucleotide receptor binding(GO:0031811) P2Y1 nucleotide receptor binding(GO:0031812) |
| 3.1 | 18.3 | GO:0042392 | sphingosine-1-phosphate phosphatase activity(GO:0042392) |
| 3.0 | 12.1 | GO:0005163 | nerve growth factor receptor binding(GO:0005163) |
| 2.5 | 17.4 | GO:0097001 | ceramide binding(GO:0097001) |
| 2.4 | 9.7 | GO:0008427 | calcium-dependent protein kinase inhibitor activity(GO:0008427) |
| 2.3 | 9.3 | GO:0035373 | chondroitin sulfate proteoglycan binding(GO:0035373) |
| 2.3 | 18.1 | GO:0005250 | A-type (transient outward) potassium channel activity(GO:0005250) |
| 2.1 | 12.6 | GO:0060961 | phospholipase D inhibitor activity(GO:0060961) |
| 2.1 | 2.1 | GO:0030156 | benzodiazepine receptor binding(GO:0030156) |
| 2.1 | 6.2 | GO:0086057 | voltage-gated calcium channel activity involved in bundle of His cell action potential(GO:0086057) |
| 2.0 | 34.8 | GO:0022851 | GABA-gated chloride ion channel activity(GO:0022851) |
| 2.0 | 8.1 | GO:0005042 | netrin receptor activity(GO:0005042) |
| 2.0 | 19.8 | GO:0015277 | kainate selective glutamate receptor activity(GO:0015277) |
| 2.0 | 5.9 | GO:0036505 | prosaposin receptor activity(GO:0036505) |
| 2.0 | 3.9 | GO:0031750 | D3 dopamine receptor binding(GO:0031750) |
| 1.9 | 11.6 | GO:0034431 | endopolyphosphatase activity(GO:0000298) diphosphoinositol-polyphosphate diphosphatase activity(GO:0008486) bis(5'-adenosyl)-hexaphosphatase activity(GO:0034431) bis(5'-adenosyl)-pentaphosphatase activity(GO:0034432) inositol diphosphate tetrakisphosphate diphosphatase activity(GO:0052840) inositol bisdiphosphate tetrakisphosphate diphosphatase activity(GO:0052841) inositol diphosphate pentakisphosphate diphosphatase activity(GO:0052842) inositol-1-diphosphate-2,3,4,5,6-pentakisphosphate diphosphatase activity(GO:0052843) inositol-3-diphosphate-1,2,4,5,6-pentakisphosphate diphosphatase activity(GO:0052844) inositol-5-diphosphate-1,2,3,4,6-pentakisphosphate diphosphatase activity(GO:0052845) inositol-1,5-bisdiphosphate-2,3,4,6-tetrakisphosphate 1-diphosphatase activity(GO:0052846) inositol-1,5-bisdiphosphate-2,3,4,6-tetrakisphosphate 5-diphosphatase activity(GO:0052847) inositol-3,5-bisdiphosphate-2,3,4,6-tetrakisphosphate 5-diphosphatase activity(GO:0052848) |
| 1.9 | 15.0 | GO:0004351 | glutamate decarboxylase activity(GO:0004351) |
| 1.8 | 44.0 | GO:0008179 | adenylate cyclase binding(GO:0008179) |
| 1.8 | 5.5 | GO:0098640 | integrin binding involved in cell-matrix adhesion(GO:0098640) |
| 1.8 | 8.9 | GO:1990430 | extracellular matrix protein binding(GO:1990430) |
| 1.8 | 8.8 | GO:0086062 | voltage-gated sodium channel activity involved in Purkinje myocyte action potential(GO:0086062) |
| 1.7 | 37.3 | GO:0097109 | neuroligin family protein binding(GO:0097109) |
| 1.7 | 5.0 | GO:0033842 | N-acetyl-beta-glucosaminyl-glycoprotein 4-beta-N-acetylgalactosaminyltransferase activity(GO:0033842) |
| 1.7 | 34.8 | GO:0005391 | sodium:potassium-exchanging ATPase activity(GO:0005391) |
| 1.6 | 6.5 | GO:0072591 | citrate-L-glutamate ligase activity(GO:0072591) |
| 1.6 | 16.0 | GO:0004117 | calmodulin-dependent cyclic-nucleotide phosphodiesterase activity(GO:0004117) |
| 1.6 | 6.4 | GO:0000309 | nicotinamide-nucleotide adenylyltransferase activity(GO:0000309) |
| 1.6 | 23.8 | GO:0015501 | glutamate:sodium symporter activity(GO:0015501) |
| 1.6 | 4.7 | GO:0015275 | stretch-activated, cation-selective, calcium channel activity(GO:0015275) |
| 1.5 | 15.4 | GO:0005332 | gamma-aminobutyric acid:sodium symporter activity(GO:0005332) |
| 1.5 | 15.3 | GO:0060072 | large conductance calcium-activated potassium channel activity(GO:0060072) |
| 1.5 | 10.4 | GO:0016215 | stearoyl-CoA 9-desaturase activity(GO:0004768) acyl-CoA desaturase activity(GO:0016215) |
| 1.4 | 2.9 | GO:0031696 | alpha-2C adrenergic receptor binding(GO:0031696) |
| 1.4 | 28.0 | GO:0005432 | calcium:sodium antiporter activity(GO:0005432) |
| 1.4 | 5.5 | GO:0099609 | microtubule lateral binding(GO:0099609) |
| 1.4 | 12.2 | GO:0003872 | 6-phosphofructokinase activity(GO:0003872) |
| 1.3 | 4.0 | GO:0005308 | creatine transmembrane transporter activity(GO:0005308) |
| 1.3 | 21.1 | GO:0004971 | AMPA glutamate receptor activity(GO:0004971) |
| 1.3 | 10.3 | GO:0004111 | creatine kinase activity(GO:0004111) |
| 1.3 | 11.6 | GO:0035727 | lysophosphatidic acid binding(GO:0035727) |
| 1.3 | 5.1 | GO:0004698 | calcium-dependent protein kinase C activity(GO:0004698) |
| 1.3 | 12.5 | GO:0030160 | GKAP/Homer scaffold activity(GO:0030160) |
| 1.2 | 19.8 | GO:0005234 | extracellular-glutamate-gated ion channel activity(GO:0005234) |
| 1.2 | 39.5 | GO:0004890 | GABA-A receptor activity(GO:0004890) |
| 1.2 | 8.5 | GO:0001640 | adenylate cyclase inhibiting G-protein coupled glutamate receptor activity(GO:0001640) G-protein coupled glutamate receptor activity(GO:0098988) |
| 1.2 | 8.5 | GO:0097108 | hedgehog family protein binding(GO:0097108) |
| 1.2 | 3.6 | GO:1990175 | EH domain binding(GO:1990175) |
| 1.2 | 11.9 | GO:0042835 | BRE binding(GO:0042835) |
| 1.2 | 10.6 | GO:0016907 | G-protein coupled acetylcholine receptor activity(GO:0016907) |
| 1.2 | 9.3 | GO:0031849 | olfactory receptor binding(GO:0031849) |
| 1.1 | 11.3 | GO:0000155 | phosphorelay sensor kinase activity(GO:0000155) |
| 1.1 | 5.5 | GO:0004994 | somatostatin receptor activity(GO:0004994) |
| 1.1 | 5.3 | GO:0038025 | reelin receptor activity(GO:0038025) |
| 1.0 | 8.3 | GO:0004095 | carnitine O-palmitoyltransferase activity(GO:0004095) |
| 1.0 | 3.1 | GO:0035379 | carbon dioxide transmembrane transporter activity(GO:0035379) |
| 1.0 | 3.1 | GO:1990259 | protein-glutamine N-methyltransferase activity(GO:0036009) histone-glutamine methyltransferase activity(GO:1990259) |
| 1.0 | 5.1 | GO:0086006 | voltage-gated sodium channel activity involved in cardiac muscle cell action potential(GO:0086006) |
| 1.0 | 5.0 | GO:0032795 | heterotrimeric G-protein binding(GO:0032795) |
| 1.0 | 3.0 | GO:0060175 | brain-derived neurotrophic factor-activated receptor activity(GO:0060175) |
| 1.0 | 9.9 | GO:0030250 | cyclase activator activity(GO:0010853) guanylate cyclase activator activity(GO:0030250) |
| 1.0 | 4.0 | GO:0005019 | platelet-derived growth factor beta-receptor activity(GO:0005019) |
| 1.0 | 4.9 | GO:0047179 | platelet-activating factor acetyltransferase activity(GO:0047179) |
| 1.0 | 4.9 | GO:0004157 | dihydropyrimidinase activity(GO:0004157) |
| 1.0 | 36.7 | GO:0030506 | ankyrin binding(GO:0030506) |
| 1.0 | 3.9 | GO:0003947 | (N-acetylneuraminyl)-galactosylglucosylceramide N-acetylgalactosaminyltransferase activity(GO:0003947) |
| 1.0 | 36.2 | GO:0008331 | high voltage-gated calcium channel activity(GO:0008331) |
| 0.9 | 15.6 | GO:0005004 | GPI-linked ephrin receptor activity(GO:0005004) |
| 0.9 | 53.7 | GO:0017075 | syntaxin-1 binding(GO:0017075) |
| 0.9 | 5.4 | GO:0034714 | type III transforming growth factor beta receptor binding(GO:0034714) |
| 0.9 | 8.1 | GO:0001517 | N-acetylglucosamine 6-O-sulfotransferase activity(GO:0001517) |
| 0.9 | 11.6 | GO:0070097 | delta-catenin binding(GO:0070097) |
| 0.9 | 27.4 | GO:0042043 | neurexin family protein binding(GO:0042043) |
| 0.9 | 4.4 | GO:0044736 | acid-sensing ion channel activity(GO:0044736) |
| 0.9 | 4.4 | GO:0005006 | epidermal growth factor-activated receptor activity(GO:0005006) |
| 0.9 | 4.3 | GO:0019797 | procollagen-proline 3-dioxygenase activity(GO:0019797) |
| 0.9 | 3.4 | GO:0035939 | microsatellite binding(GO:0035939) |
| 0.8 | 14.4 | GO:0032051 | clathrin light chain binding(GO:0032051) |
| 0.8 | 3.3 | GO:0072320 | volume-sensitive chloride channel activity(GO:0072320) |
| 0.8 | 7.3 | GO:0003828 | alpha-N-acetylneuraminate alpha-2,8-sialyltransferase activity(GO:0003828) |
| 0.8 | 3.2 | GO:0016838 | carbon-oxygen lyase activity, acting on phosphates(GO:0016838) |
| 0.8 | 6.4 | GO:0005157 | macrophage colony-stimulating factor receptor binding(GO:0005157) |
| 0.8 | 14.2 | GO:0070679 | inositol 1,4,5 trisphosphate binding(GO:0070679) |
| 0.8 | 6.2 | GO:0033691 | sialic acid binding(GO:0033691) |
| 0.8 | 15.4 | GO:0004089 | carbonate dehydratase activity(GO:0004089) |
| 0.8 | 5.4 | GO:0098960 | postsynaptic neurotransmitter receptor activity(GO:0098960) |
| 0.8 | 10.7 | GO:0031995 | insulin-like growth factor II binding(GO:0031995) |
| 0.8 | 3.1 | GO:0035241 | protein-arginine omega-N monomethyltransferase activity(GO:0035241) |
| 0.8 | 8.4 | GO:0042731 | PH domain binding(GO:0042731) |
| 0.8 | 15.1 | GO:0019911 | structural constituent of myelin sheath(GO:0019911) |
| 0.7 | 4.5 | GO:0005105 | type 1 fibroblast growth factor receptor binding(GO:0005105) |
| 0.7 | 11.7 | GO:0031681 | G-protein beta-subunit binding(GO:0031681) |
| 0.7 | 5.1 | GO:0004122 | cystathionine beta-synthase activity(GO:0004122) |
| 0.7 | 2.9 | GO:0005169 | neurotrophin TRKB receptor binding(GO:0005169) |
| 0.7 | 23.3 | GO:0031005 | filamin binding(GO:0031005) |
| 0.7 | 0.7 | GO:1990698 | palmitoleoyltransferase activity(GO:1990698) |
| 0.7 | 2.1 | GO:0015218 | pyrimidine nucleotide transmembrane transporter activity(GO:0015218) |
| 0.7 | 16.7 | GO:0034596 | phosphatidylinositol phosphate 4-phosphatase activity(GO:0034596) |
| 0.7 | 5.6 | GO:0036042 | long-chain fatty acyl-CoA binding(GO:0036042) |
| 0.7 | 12.5 | GO:0031821 | G-protein coupled serotonin receptor binding(GO:0031821) |
| 0.7 | 2.1 | GO:0016309 | 1-phosphatidylinositol-5-phosphate 4-kinase activity(GO:0016309) |
| 0.7 | 6.9 | GO:0043533 | inositol 1,3,4,5 tetrakisphosphate binding(GO:0043533) |
| 0.7 | 1.4 | GO:0004720 | protein-lysine 6-oxidase activity(GO:0004720) |
| 0.7 | 6.1 | GO:0034711 | inhibin binding(GO:0034711) |
| 0.7 | 17.3 | GO:0008191 | metalloendopeptidase inhibitor activity(GO:0008191) |
| 0.7 | 6.6 | GO:0005314 | high-affinity glutamate transmembrane transporter activity(GO:0005314) |
| 0.7 | 27.8 | GO:0019198 | transmembrane receptor protein tyrosine phosphatase activity(GO:0005001) transmembrane receptor protein phosphatase activity(GO:0019198) |
| 0.7 | 8.6 | GO:0016909 | JUN kinase activity(GO:0004705) SAP kinase activity(GO:0016909) |
| 0.7 | 3.3 | GO:0008401 | retinoic acid 4-hydroxylase activity(GO:0008401) |
| 0.7 | 3.9 | GO:0015018 | galactosylgalactosylxylosylprotein 3-beta-glucuronosyltransferase activity(GO:0015018) |
| 0.6 | 9.7 | GO:0005003 | ephrin receptor activity(GO:0005003) |
| 0.6 | 2.6 | GO:0008336 | gamma-butyrobetaine dioxygenase activity(GO:0008336) |
| 0.6 | 7.0 | GO:0008046 | axon guidance receptor activity(GO:0008046) |
| 0.6 | 8.9 | GO:0030274 | LIM domain binding(GO:0030274) |
| 0.6 | 14.7 | GO:0008603 | cAMP-dependent protein kinase regulator activity(GO:0008603) |
| 0.6 | 1.9 | GO:0016497 | substance K receptor activity(GO:0016497) |
| 0.6 | 3.8 | GO:0005298 | proline:sodium symporter activity(GO:0005298) |
| 0.6 | 1.3 | GO:0005017 | platelet-derived growth factor-activated receptor activity(GO:0005017) |
| 0.6 | 1.9 | GO:0004342 | glucosamine-6-phosphate deaminase activity(GO:0004342) |
| 0.6 | 0.6 | GO:0070538 | oleic acid binding(GO:0070538) |
| 0.6 | 2.4 | GO:0030550 | acetylcholine receptor inhibitor activity(GO:0030550) |
| 0.6 | 9.0 | GO:0048407 | platelet-derived growth factor binding(GO:0048407) |
| 0.6 | 1.8 | GO:0031737 | CX3C chemokine receptor binding(GO:0031737) |
| 0.6 | 2.3 | GO:0050698 | proteoglycan sulfotransferase activity(GO:0050698) |
| 0.6 | 32.9 | GO:0043015 | gamma-tubulin binding(GO:0043015) |
| 0.6 | 2.3 | GO:0015375 | glycine:sodium symporter activity(GO:0015375) |
| 0.6 | 12.0 | GO:0004017 | adenylate kinase activity(GO:0004017) |
| 0.6 | 1.7 | GO:0070506 | high-density lipoprotein particle receptor activity(GO:0070506) |
| 0.6 | 2.3 | GO:0008184 | glycogen phosphorylase activity(GO:0008184) |
| 0.6 | 2.3 | GO:0004605 | phosphatidate cytidylyltransferase activity(GO:0004605) |
| 0.6 | 2.2 | GO:0061628 | H3K27me3 modified histone binding(GO:0061628) |
| 0.6 | 17.9 | GO:0005212 | structural constituent of eye lens(GO:0005212) |
| 0.6 | 1.7 | GO:0086039 | lutropin-choriogonadotropic hormone receptor binding(GO:0031775) calcium-transporting ATPase activity involved in regulation of cardiac muscle cell membrane potential(GO:0086039) |
| 0.6 | 5.5 | GO:1903763 | gap junction channel activity involved in cell communication by electrical coupling(GO:1903763) |
| 0.5 | 18.1 | GO:0031489 | myosin V binding(GO:0031489) |
| 0.5 | 1.6 | GO:0031783 | corticotropin hormone receptor binding(GO:0031780) type 5 melanocortin receptor binding(GO:0031783) |
| 0.5 | 4.3 | GO:0031994 | insulin-like growth factor I binding(GO:0031994) |
| 0.5 | 3.3 | GO:0004522 | ribonuclease A activity(GO:0004522) |
| 0.5 | 13.5 | GO:0005248 | voltage-gated sodium channel activity(GO:0005248) voltage-gated ion channel activity involved in regulation of postsynaptic membrane potential(GO:1905030) |
| 0.5 | 7.6 | GO:0036310 | annealing helicase activity(GO:0036310) |
| 0.5 | 5.9 | GO:0016286 | small conductance calcium-activated potassium channel activity(GO:0016286) |
| 0.5 | 10.1 | GO:0086080 | protein binding involved in heterotypic cell-cell adhesion(GO:0086080) |
| 0.5 | 14.8 | GO:0005251 | delayed rectifier potassium channel activity(GO:0005251) |
| 0.5 | 1.6 | GO:0015633 | zinc transporting ATPase activity(GO:0015633) |
| 0.5 | 5.8 | GO:0004897 | ciliary neurotrophic factor receptor activity(GO:0004897) |
| 0.5 | 3.1 | GO:0052851 | cupric reductase activity(GO:0008823) ferric-chelate reductase (NADPH) activity(GO:0052851) |
| 0.5 | 2.6 | GO:0004105 | choline-phosphate cytidylyltransferase activity(GO:0004105) |
| 0.5 | 3.1 | GO:0005219 | ryanodine-sensitive calcium-release channel activity(GO:0005219) |
| 0.5 | 19.6 | GO:0008239 | dipeptidyl-peptidase activity(GO:0008239) |
| 0.5 | 4.6 | GO:1903136 | cuprous ion binding(GO:1903136) |
| 0.5 | 4.1 | GO:0004614 | phosphoglucomutase activity(GO:0004614) |
| 0.5 | 9.1 | GO:0005078 | MAP-kinase scaffold activity(GO:0005078) |
| 0.5 | 34.7 | GO:0050699 | WW domain binding(GO:0050699) |
| 0.5 | 7.0 | GO:0017034 | Rap guanyl-nucleotide exchange factor activity(GO:0017034) |
| 0.5 | 2.5 | GO:0070051 | fibrinogen binding(GO:0070051) |
| 0.5 | 2.0 | GO:0004949 | cannabinoid receptor activity(GO:0004949) |
| 0.5 | 6.8 | GO:0102337 | fatty acid elongase activity(GO:0009922) 3-oxo-arachidoyl-CoA synthase activity(GO:0102336) 3-oxo-cerotoyl-CoA synthase activity(GO:0102337) 3-oxo-lignoceronyl-CoA synthase activity(GO:0102338) |
| 0.5 | 1.9 | GO:1902379 | receptor tyrosine kinase-like orphan receptor binding(GO:0005115) chemoattractant activity involved in axon guidance(GO:1902379) |
| 0.5 | 2.4 | GO:0015166 | polyol transmembrane transporter activity(GO:0015166) |
| 0.5 | 1.0 | GO:0043891 | glyceraldehyde-3-phosphate dehydrogenase (NAD+) (phosphorylating) activity(GO:0004365) glyceraldehyde-3-phosphate dehydrogenase (NAD(P)+) (phosphorylating) activity(GO:0043891) |
| 0.5 | 6.2 | GO:0030911 | TPR domain binding(GO:0030911) |
| 0.5 | 5.7 | GO:0043176 | amine binding(GO:0043176) serotonin binding(GO:0051378) |
| 0.5 | 2.9 | GO:0004104 | cholinesterase activity(GO:0004104) |
| 0.5 | 8.1 | GO:0004723 | calcium-dependent protein serine/threonine phosphatase activity(GO:0004723) |
| 0.5 | 9.4 | GO:0008195 | phosphatidate phosphatase activity(GO:0008195) |
| 0.5 | 4.7 | GO:0015349 | thyroid hormone transmembrane transporter activity(GO:0015349) |
| 0.5 | 1.8 | GO:0005010 | insulin-like growth factor-activated receptor activity(GO:0005010) |
| 0.5 | 1.8 | GO:0016176 | superoxide-generating NADPH oxidase activator activity(GO:0016176) |
| 0.5 | 1.8 | GO:0034041 | sterol-transporting ATPase activity(GO:0034041) |
| 0.5 | 1.4 | GO:0003941 | L-serine ammonia-lyase activity(GO:0003941) |
| 0.5 | 3.2 | GO:0086089 | voltage-gated potassium channel activity involved in atrial cardiac muscle cell action potential repolarization(GO:0086089) |
| 0.5 | 3.2 | GO:0008467 | [heparan sulfate]-glucosamine 3-sulfotransferase 1 activity(GO:0008467) |
| 0.4 | 1.8 | GO:0050431 | transforming growth factor beta binding(GO:0050431) |
| 0.4 | 15.8 | GO:0005245 | voltage-gated calcium channel activity(GO:0005245) |
| 0.4 | 0.4 | GO:0031544 | peptidyl-proline 3-dioxygenase activity(GO:0031544) |
| 0.4 | 2.2 | GO:0016524 | latrotoxin receptor activity(GO:0016524) |
| 0.4 | 1.7 | GO:0005483 | soluble NSF attachment protein activity(GO:0005483) |
| 0.4 | 12.5 | GO:0005523 | tropomyosin binding(GO:0005523) |
| 0.4 | 4.3 | GO:0048495 | Roundabout binding(GO:0048495) |
| 0.4 | 2.6 | GO:0004066 | asparagine synthase (glutamine-hydrolyzing) activity(GO:0004066) |
| 0.4 | 5.5 | GO:0044323 | retinoic acid-responsive element binding(GO:0044323) |
| 0.4 | 1.7 | GO:0004341 | gluconolactonase activity(GO:0004341) |
| 0.4 | 7.5 | GO:0038062 | protein tyrosine kinase collagen receptor activity(GO:0038062) |
| 0.4 | 9.9 | GO:0015269 | calcium-activated potassium channel activity(GO:0015269) |
| 0.4 | 0.8 | GO:0004999 | vasoactive intestinal polypeptide receptor activity(GO:0004999) |
| 0.4 | 2.1 | GO:0004667 | prostaglandin-D synthase activity(GO:0004667) |
| 0.4 | 1.6 | GO:0052810 | 1-phosphatidylinositol-5-kinase activity(GO:0052810) |
| 0.4 | 2.5 | GO:0019828 | aspartic-type endopeptidase inhibitor activity(GO:0019828) |
| 0.4 | 2.9 | GO:0022897 | peptide:proton symporter activity(GO:0015333) proton-dependent peptide secondary active transmembrane transporter activity(GO:0022897) |
| 0.4 | 1.2 | GO:0015183 | L-aspartate transmembrane transporter activity(GO:0015183) |
| 0.4 | 7.7 | GO:0003688 | DNA replication origin binding(GO:0003688) |
| 0.4 | 3.1 | GO:0034513 | box H/ACA snoRNA binding(GO:0034513) |
| 0.4 | 5.4 | GO:0005347 | ATP transmembrane transporter activity(GO:0005347) ADP transmembrane transporter activity(GO:0015217) |
| 0.4 | 4.2 | GO:1904929 | coreceptor activity involved in Wnt signaling pathway, planar cell polarity pathway(GO:1904929) |
| 0.4 | 5.8 | GO:0004716 | receptor signaling protein tyrosine kinase activity(GO:0004716) |
| 0.4 | 12.7 | GO:0008574 | ATP-dependent microtubule motor activity, plus-end-directed(GO:0008574) |
| 0.4 | 7.6 | GO:0010314 | phosphatidylinositol-5-phosphate binding(GO:0010314) |
| 0.4 | 1.9 | GO:0045485 | omega-6 fatty acid desaturase activity(GO:0045485) |
| 0.4 | 4.4 | GO:0039706 | co-receptor binding(GO:0039706) |
| 0.4 | 0.4 | GO:0035529 | NADH pyrophosphatase activity(GO:0035529) |
| 0.4 | 11.6 | GO:0005104 | fibroblast growth factor receptor binding(GO:0005104) |
| 0.4 | 7.6 | GO:0070324 | thyroid hormone binding(GO:0070324) |
| 0.4 | 14.8 | GO:0030507 | spectrin binding(GO:0030507) |
| 0.4 | 1.8 | GO:0050816 | phosphothreonine binding(GO:0050816) |
| 0.4 | 1.4 | GO:0008158 | hedgehog receptor activity(GO:0008158) |
| 0.4 | 3.2 | GO:0015186 | L-glutamine transmembrane transporter activity(GO:0015186) |
| 0.3 | 0.7 | GO:0004924 | oncostatin-M receptor activity(GO:0004924) |
| 0.3 | 10.0 | GO:0008510 | sodium:bicarbonate symporter activity(GO:0008510) |
| 0.3 | 1.0 | GO:0001716 | L-amino-acid oxidase activity(GO:0001716) |
| 0.3 | 1.0 | GO:2001069 | glycogen binding(GO:2001069) |
| 0.3 | 1.4 | GO:0047888 | fatty acid peroxidase activity(GO:0047888) |
| 0.3 | 1.0 | GO:0043849 | Ras palmitoyltransferase activity(GO:0043849) |
| 0.3 | 1.0 | GO:0005026 | transforming growth factor beta receptor activity, type II(GO:0005026) |
| 0.3 | 1.7 | GO:0050510 | N-acetylgalactosaminyl-proteoglycan 3-beta-glucuronosyltransferase activity(GO:0050510) |
| 0.3 | 1.0 | GO:0004047 | aminomethyltransferase activity(GO:0004047) |
| 0.3 | 1.0 | GO:0016534 | cyclin-dependent protein kinase 5 activator activity(GO:0016534) |
| 0.3 | 3.3 | GO:0031697 | beta-1 adrenergic receptor binding(GO:0031697) |
| 0.3 | 1.6 | GO:0005173 | stem cell factor receptor binding(GO:0005173) |
| 0.3 | 4.2 | GO:0097100 | supercoiled DNA binding(GO:0097100) |
| 0.3 | 1.0 | GO:0072545 | tyrosine binding(GO:0072545) |
| 0.3 | 1.6 | GO:0033906 | hyaluronoglucuronidase activity(GO:0033906) |
| 0.3 | 0.9 | GO:0043515 | kinetochore binding(GO:0043515) |
| 0.3 | 2.8 | GO:0005052 | peroxisome matrix targeting signal-1 binding(GO:0005052) |
| 0.3 | 5.9 | GO:0099604 | calcium-release channel activity(GO:0015278) ligand-gated calcium channel activity(GO:0099604) |
| 0.3 | 0.6 | GO:0042289 | MHC class II protein binding(GO:0042289) |
| 0.3 | 6.8 | GO:0002162 | dystroglycan binding(GO:0002162) |
| 0.3 | 1.9 | GO:0004692 | cGMP-dependent protein kinase activity(GO:0004692) |
| 0.3 | 4.6 | GO:0005007 | fibroblast growth factor-activated receptor activity(GO:0005007) |
| 0.3 | 4.6 | GO:0008526 | phosphatidylinositol transporter activity(GO:0008526) |
| 0.3 | 1.2 | GO:0031687 | A2A adenosine receptor binding(GO:0031687) |
| 0.3 | 1.8 | GO:0008281 | sulfonylurea receptor activity(GO:0008281) |
| 0.3 | 1.5 | GO:0033592 | RNA strand annealing activity(GO:0033592) |
| 0.3 | 1.5 | GO:0047391 | alkylglycerophosphoethanolamine phosphodiesterase activity(GO:0047391) |
| 0.3 | 2.1 | GO:0051373 | FATZ binding(GO:0051373) |
| 0.3 | 2.1 | GO:0050998 | nitric-oxide synthase binding(GO:0050998) |
| 0.3 | 0.9 | GO:0017129 | triglyceride binding(GO:0017129) |
| 0.3 | 2.6 | GO:0033743 | peptide-methionine (R)-S-oxide reductase activity(GO:0033743) |
| 0.3 | 4.1 | GO:0070700 | BMP receptor binding(GO:0070700) |
| 0.3 | 1.2 | GO:0004113 | 2',3'-cyclic-nucleotide 3'-phosphodiesterase activity(GO:0004113) |
| 0.3 | 3.8 | GO:0097322 | 7SK snRNA binding(GO:0097322) |
| 0.3 | 2.0 | GO:0015189 | L-lysine transmembrane transporter activity(GO:0015189) |
| 0.3 | 2.3 | GO:0050733 | RS domain binding(GO:0050733) |
| 0.3 | 11.4 | GO:0005184 | neuropeptide hormone activity(GO:0005184) |
| 0.3 | 3.1 | GO:0004459 | L-lactate dehydrogenase activity(GO:0004459) |
| 0.3 | 1.1 | GO:0047192 | 1-alkylglycerophosphocholine O-acetyltransferase activity(GO:0047192) |
| 0.3 | 1.4 | GO:0097016 | L27 domain binding(GO:0097016) |
| 0.3 | 1.4 | GO:0070326 | very-low-density lipoprotein particle receptor binding(GO:0070326) |
| 0.3 | 2.2 | GO:0008481 | sphinganine kinase activity(GO:0008481) D-erythro-sphingosine kinase activity(GO:0017050) |
| 0.3 | 1.4 | GO:0052591 | sn-glycerol-3-phosphate:ubiquinone oxidoreductase activity(GO:0052590) sn-glycerol-3-phosphate:ubiquinone-8 oxidoreductase activity(GO:0052591) |
| 0.3 | 2.7 | GO:0046974 | histone methyltransferase activity (H3-K9 specific)(GO:0046974) |
| 0.3 | 9.4 | GO:0001972 | retinoic acid binding(GO:0001972) |
| 0.3 | 1.6 | GO:0005353 | fructose transmembrane transporter activity(GO:0005353) |
| 0.3 | 1.6 | GO:1902444 | riboflavin binding(GO:1902444) |
| 0.3 | 7.7 | GO:0102391 | decanoate--CoA ligase activity(GO:0102391) |
| 0.3 | 5.3 | GO:0008140 | cAMP response element binding protein binding(GO:0008140) |
| 0.3 | 1.3 | GO:0004084 | branched-chain-amino-acid transaminase activity(GO:0004084) L-leucine transaminase activity(GO:0052654) L-valine transaminase activity(GO:0052655) L-isoleucine transaminase activity(GO:0052656) |
| 0.3 | 9.0 | GO:0005388 | calcium-transporting ATPase activity(GO:0005388) |
| 0.3 | 1.5 | GO:0061649 | ubiquitinated histone binding(GO:0061649) |
| 0.3 | 11.7 | GO:0016881 | acid-amino acid ligase activity(GO:0016881) |
| 0.3 | 8.4 | GO:0017147 | Wnt-protein binding(GO:0017147) |
| 0.3 | 1.3 | GO:0044020 | histone methyltransferase activity (H4-R3 specific)(GO:0044020) |
| 0.3 | 9.6 | GO:0004385 | guanylate kinase activity(GO:0004385) |
| 0.3 | 4.6 | GO:0004383 | guanylate cyclase activity(GO:0004383) |
| 0.3 | 0.8 | GO:0008511 | sodium:potassium:chloride symporter activity(GO:0008511) |
| 0.2 | 1.7 | GO:0004962 | endothelin receptor activity(GO:0004962) |
| 0.2 | 50.4 | GO:0005200 | structural constituent of cytoskeleton(GO:0005200) |
| 0.2 | 27.7 | GO:0015459 | potassium channel regulator activity(GO:0015459) |
| 0.2 | 11.4 | GO:0008093 | cytoskeletal adaptor activity(GO:0008093) |
| 0.2 | 12.1 | GO:0005086 | ARF guanyl-nucleotide exchange factor activity(GO:0005086) |
| 0.2 | 1.7 | GO:0047288 | monosialoganglioside sialyltransferase activity(GO:0047288) |
| 0.2 | 1.7 | GO:0004800 | thyroxine 5'-deiodinase activity(GO:0004800) |
| 0.2 | 7.5 | GO:0005545 | 1-phosphatidylinositol binding(GO:0005545) |
| 0.2 | 1.4 | GO:0035614 | snRNA stem-loop binding(GO:0035614) |
| 0.2 | 1.0 | GO:0046921 | glycoprotein 6-alpha-L-fucosyltransferase activity(GO:0008424) alpha-(1->6)-fucosyltransferase activity(GO:0046921) |
| 0.2 | 1.2 | GO:0070411 | I-SMAD binding(GO:0070411) |
| 0.2 | 2.2 | GO:0008889 | glycerophosphodiester phosphodiesterase activity(GO:0008889) |
| 0.2 | 0.5 | GO:0038064 | collagen receptor activity(GO:0038064) |
| 0.2 | 0.7 | GO:0034057 | RNA strand-exchange activity(GO:0034057) |
| 0.2 | 0.7 | GO:0004500 | dopamine beta-monooxygenase activity(GO:0004500) |
| 0.2 | 13.3 | GO:0001786 | phosphatidylserine binding(GO:0001786) |
| 0.2 | 0.9 | GO:0034584 | piRNA binding(GO:0034584) |
| 0.2 | 2.1 | GO:0034235 | GPI anchor binding(GO:0034235) |
| 0.2 | 0.5 | GO:0019912 | cyclin-dependent protein kinase activating kinase activity(GO:0019912) |
| 0.2 | 11.5 | GO:0017080 | sodium channel regulator activity(GO:0017080) |
| 0.2 | 0.9 | GO:0004040 | amidase activity(GO:0004040) |
| 0.2 | 0.7 | GO:0003845 | 11-beta-hydroxysteroid dehydrogenase [NAD(P)] activity(GO:0003845) |
| 0.2 | 0.7 | GO:0004750 | ribulose-phosphate 3-epimerase activity(GO:0004750) |
| 0.2 | 3.1 | GO:0030020 | extracellular matrix structural constituent conferring tensile strength(GO:0030020) |
| 0.2 | 2.2 | GO:0001025 | RNA polymerase III transcription factor binding(GO:0001025) |
| 0.2 | 1.3 | GO:0035402 | histone kinase activity (H3-T11 specific)(GO:0035402) |
| 0.2 | 1.3 | GO:0003998 | acylphosphatase activity(GO:0003998) |
| 0.2 | 6.3 | GO:0045505 | dynein intermediate chain binding(GO:0045505) |
| 0.2 | 1.1 | GO:0004161 | dimethylallyltranstransferase activity(GO:0004161) geranyltranstransferase activity(GO:0004337) |
| 0.2 | 0.9 | GO:0061714 | folic acid receptor activity(GO:0061714) |
| 0.2 | 7.6 | GO:0030742 | GTP-dependent protein binding(GO:0030742) |
| 0.2 | 0.9 | GO:0038132 | neuregulin binding(GO:0038132) |
| 0.2 | 5.6 | GO:0070008 | serine-type exopeptidase activity(GO:0070008) |
| 0.2 | 28.6 | GO:0004860 | protein kinase inhibitor activity(GO:0004860) |
| 0.2 | 3.4 | GO:0017134 | fibroblast growth factor binding(GO:0017134) |
| 0.2 | 3.6 | GO:1990459 | transferrin receptor binding(GO:1990459) |
| 0.2 | 1.1 | GO:0004619 | bisphosphoglycerate mutase activity(GO:0004082) phosphoglycerate mutase activity(GO:0004619) 2,3-bisphosphoglycerate-dependent phosphoglycerate mutase activity(GO:0046538) |
| 0.2 | 2.5 | GO:0000182 | rDNA binding(GO:0000182) |
| 0.2 | 6.5 | GO:0004653 | polypeptide N-acetylgalactosaminyltransferase activity(GO:0004653) |
| 0.2 | 9.9 | GO:0019894 | kinesin binding(GO:0019894) |
| 0.2 | 0.6 | GO:0031862 | prostanoid receptor binding(GO:0031862) |
| 0.2 | 7.9 | GO:0051010 | microtubule plus-end binding(GO:0051010) |
| 0.2 | 0.8 | GO:0047708 | biotinidase activity(GO:0047708) |
| 0.2 | 3.5 | GO:0015250 | water channel activity(GO:0015250) |
| 0.2 | 2.0 | GO:0036402 | proteasome-activating ATPase activity(GO:0036402) |
| 0.2 | 6.1 | GO:0000900 | translation repressor activity, nucleic acid binding(GO:0000900) |
| 0.2 | 1.4 | GO:0015319 | sodium:inorganic phosphate symporter activity(GO:0015319) |
| 0.2 | 0.8 | GO:0060001 | minus-end directed microfilament motor activity(GO:0060001) |
| 0.2 | 0.6 | GO:0015616 | DNA translocase activity(GO:0015616) |
| 0.2 | 2.6 | GO:0097157 | pre-mRNA intronic binding(GO:0097157) |
| 0.2 | 1.0 | GO:0008466 | glycogenin glucosyltransferase activity(GO:0008466) |
| 0.2 | 0.8 | GO:0008260 | 3-oxoacid CoA-transferase activity(GO:0008260) |
| 0.2 | 0.4 | GO:0050567 | glutaminyl-tRNA synthase (glutamine-hydrolyzing) activity(GO:0050567) |
| 0.2 | 2.7 | GO:0070840 | dynein complex binding(GO:0070840) |
| 0.2 | 13.1 | GO:0003755 | peptidyl-prolyl cis-trans isomerase activity(GO:0003755) |
| 0.2 | 1.3 | GO:0043141 | ATP-dependent 5'-3' DNA helicase activity(GO:0043141) |
| 0.2 | 3.3 | GO:0045159 | myosin II binding(GO:0045159) |
| 0.2 | 0.4 | GO:0035184 | histone threonine kinase activity(GO:0035184) |
| 0.2 | 9.2 | GO:0008157 | protein phosphatase 1 binding(GO:0008157) |
| 0.2 | 88.3 | GO:0015631 | tubulin binding(GO:0015631) |
| 0.2 | 1.5 | GO:0032184 | SUMO polymer binding(GO:0032184) |
| 0.2 | 3.4 | GO:0043295 | glutathione binding(GO:0043295) |
| 0.2 | 4.3 | GO:0004707 | MAP kinase activity(GO:0004707) |
| 0.2 | 0.6 | GO:0016868 | intramolecular transferase activity, phosphotransferases(GO:0016868) |
| 0.2 | 3.5 | GO:0048156 | tau protein binding(GO:0048156) |
| 0.2 | 0.4 | GO:0032551 | pyrimidine nucleoside binding(GO:0001884) UTP binding(GO:0002134) pyrimidine ribonucleoside binding(GO:0032551) |
| 0.2 | 1.7 | GO:0016206 | catechol O-methyltransferase activity(GO:0016206) |
| 0.2 | 0.9 | GO:0052595 | tryptamine:oxygen oxidoreductase (deaminating) activity(GO:0052593) aminoacetone:oxygen oxidoreductase(deaminating) activity(GO:0052594) aliphatic-amine oxidase activity(GO:0052595) phenethylamine:oxygen oxidoreductase (deaminating) activity(GO:0052596) |
| 0.2 | 1.4 | GO:0004735 | pyrroline-5-carboxylate reductase activity(GO:0004735) |
| 0.2 | 1.8 | GO:0005094 | Rho GDP-dissociation inhibitor activity(GO:0005094) |
| 0.2 | 1.1 | GO:0004740 | pyruvate dehydrogenase (acetyl-transferring) kinase activity(GO:0004740) |
| 0.2 | 1.8 | GO:0008429 | phosphatidylethanolamine binding(GO:0008429) |
| 0.2 | 5.2 | GO:0022840 | leak channel activity(GO:0022840) narrow pore channel activity(GO:0022842) |
| 0.2 | 2.4 | GO:0046870 | cadmium ion binding(GO:0046870) |
| 0.2 | 0.9 | GO:0008969 | phosphohistidine phosphatase activity(GO:0008969) |
| 0.2 | 1.2 | GO:0035662 | Toll-like receptor 4 binding(GO:0035662) |
| 0.2 | 1.6 | GO:0089720 | caspase binding(GO:0089720) |
| 0.2 | 0.5 | GO:0033862 | UMP kinase activity(GO:0033862) |
| 0.2 | 0.5 | GO:0019948 | SUMO activating enzyme activity(GO:0019948) |
| 0.2 | 1.7 | GO:0047134 | protein-disulfide reductase activity(GO:0047134) |
| 0.2 | 1.0 | GO:0004741 | [pyruvate dehydrogenase (lipoamide)] phosphatase activity(GO:0004741) |
| 0.2 | 0.9 | GO:0042015 | interleukin-20 binding(GO:0042015) |
| 0.2 | 0.7 | GO:0001601 | peptide YY receptor activity(GO:0001601) |
| 0.2 | 0.7 | GO:0004852 | uroporphyrinogen-III synthase activity(GO:0004852) |
| 0.2 | 0.3 | GO:0051380 | beta-adrenergic receptor activity(GO:0004939) norepinephrine binding(GO:0051380) |
| 0.2 | 0.8 | GO:0052836 | inositol 5-diphosphate pentakisphosphate 5-kinase activity(GO:0052836) inositol diphosphate tetrakisphosphate kinase activity(GO:0052839) |
| 0.2 | 2.6 | GO:0052629 | phosphatidylinositol-3,5-bisphosphate 3-phosphatase activity(GO:0052629) |
| 0.2 | 1.9 | GO:0004634 | phosphopyruvate hydratase activity(GO:0004634) |
| 0.2 | 1.5 | GO:0070891 | lipoteichoic acid binding(GO:0070891) |
| 0.2 | 1.3 | GO:0097643 | amylin receptor activity(GO:0097643) |
| 0.2 | 7.9 | GO:0004712 | protein serine/threonine/tyrosine kinase activity(GO:0004712) |
| 0.2 | 1.0 | GO:0035673 | oligopeptide transporter activity(GO:0015198) oligopeptide transmembrane transporter activity(GO:0035673) |
| 0.2 | 2.6 | GO:0071855 | neuropeptide receptor binding(GO:0071855) |
| 0.2 | 5.4 | GO:0032266 | phosphatidylinositol-3-phosphate binding(GO:0032266) |
| 0.2 | 3.2 | GO:0004062 | aryl sulfotransferase activity(GO:0004062) |
| 0.2 | 1.3 | GO:0005534 | galactose binding(GO:0005534) |
| 0.2 | 3.3 | GO:0005246 | calcium channel regulator activity(GO:0005246) |
| 0.2 | 0.2 | GO:0004016 | adenylate cyclase activity(GO:0004016) |
| 0.2 | 0.9 | GO:0008131 | primary amine oxidase activity(GO:0008131) |
| 0.1 | 0.3 | GO:1904047 | S-adenosyl-L-methionine binding(GO:1904047) |
| 0.1 | 1.0 | GO:0003883 | CTP synthase activity(GO:0003883) |
| 0.1 | 1.2 | GO:0004198 | calcium-dependent cysteine-type endopeptidase activity(GO:0004198) |
| 0.1 | 0.9 | GO:0004597 | peptide-aspartate beta-dioxygenase activity(GO:0004597) |
| 0.1 | 1.0 | GO:0050145 | nucleoside phosphate kinase activity(GO:0050145) |
| 0.1 | 0.4 | GO:0015489 | polyamine transmembrane transporter activity(GO:0015203) putrescine transmembrane transporter activity(GO:0015489) |
| 0.1 | 0.3 | GO:0030172 | troponin C binding(GO:0030172) |
| 0.1 | 2.3 | GO:0005326 | neurotransmitter transporter activity(GO:0005326) |
| 0.1 | 1.2 | GO:0016403 | dimethylargininase activity(GO:0016403) |
| 0.1 | 1.4 | GO:0016724 | ferroxidase activity(GO:0004322) oxidoreductase activity, oxidizing metal ions, oxygen as acceptor(GO:0016724) |
| 0.1 | 0.9 | GO:0004882 | androgen receptor activity(GO:0004882) |
| 0.1 | 0.6 | GO:0015172 | L-glutamate transmembrane transporter activity(GO:0005313) acidic amino acid transmembrane transporter activity(GO:0015172) |
| 0.1 | 1.1 | GO:0004758 | serine C-palmitoyltransferase activity(GO:0004758) C-palmitoyltransferase activity(GO:0016454) |
| 0.1 | 5.8 | GO:0019706 | protein-cysteine S-palmitoyltransferase activity(GO:0019706) protein-cysteine S-acyltransferase activity(GO:0019707) |
| 0.1 | 5.8 | GO:0036002 | pre-mRNA binding(GO:0036002) |
| 0.1 | 0.8 | GO:0032557 | pyrimidine ribonucleotide binding(GO:0032557) |
| 0.1 | 1.5 | GO:0043199 | sulfate binding(GO:0043199) |
| 0.1 | 1.4 | GO:0008310 | single-stranded DNA 3'-5' exodeoxyribonuclease activity(GO:0008310) |
| 0.1 | 0.3 | GO:0043237 | laminin-1 binding(GO:0043237) |
| 0.1 | 0.4 | GO:0046848 | hydroxyapatite binding(GO:0046848) |
| 0.1 | 1.1 | GO:0008853 | exodeoxyribonuclease III activity(GO:0008853) |
| 0.1 | 0.4 | GO:0015265 | urea channel activity(GO:0015265) |
| 0.1 | 0.7 | GO:0032143 | single thymine insertion binding(GO:0032143) |
| 0.1 | 0.4 | GO:0080130 | L-aspartate:2-oxoglutarate aminotransferase activity(GO:0004069) L-phenylalanine:2-oxoglutarate aminotransferase activity(GO:0080130) |
| 0.1 | 2.9 | GO:0034237 | protein kinase A regulatory subunit binding(GO:0034237) |
| 0.1 | 0.4 | GO:0038100 | nodal binding(GO:0038100) |
| 0.1 | 5.8 | GO:0005540 | hyaluronic acid binding(GO:0005540) |
| 0.1 | 0.4 | GO:0052831 | inositol tetrakisphosphate 1-kinase activity(GO:0047325) inositol-1,3,4-trisphosphate 6-kinase activity(GO:0052725) inositol-1,3,4-trisphosphate 5-kinase activity(GO:0052726) inositol-1,3,4,5,6-pentakisphosphate 1-phosphatase activity(GO:0052825) inositol pentakisphosphate phosphatase activity(GO:0052827) inositol-1,3,4,6-tetrakisphosphate 6-phosphatase activity(GO:0052830) inositol-1,3,4,6-tetrakisphosphate 1-phosphatase activity(GO:0052831) inositol-3,4,6-trisphosphate 1-kinase activity(GO:0052835) |
| 0.1 | 0.8 | GO:0004706 | JUN kinase kinase kinase activity(GO:0004706) |
| 0.1 | 0.5 | GO:0004937 | alpha1-adrenergic receptor activity(GO:0004937) |
| 0.1 | 0.3 | GO:0071253 | connexin binding(GO:0071253) |
| 0.1 | 0.4 | GO:0045322 | unmethylated CpG binding(GO:0045322) |
| 0.1 | 5.2 | GO:0005160 | transforming growth factor beta receptor binding(GO:0005160) |
| 0.1 | 2.1 | GO:0022820 | potassium:chloride symporter activity(GO:0015379) potassium ion symporter activity(GO:0022820) |
| 0.1 | 0.7 | GO:0004677 | DNA-dependent protein kinase activity(GO:0004677) |
| 0.1 | 4.2 | GO:0070182 | DNA polymerase binding(GO:0070182) |
| 0.1 | 0.2 | GO:0000386 | second spliceosomal transesterification activity(GO:0000386) |
| 0.1 | 0.9 | GO:0008479 | queuine tRNA-ribosyltransferase activity(GO:0008479) |
| 0.1 | 1.1 | GO:0015280 | ligand-gated sodium channel activity(GO:0015280) |
| 0.1 | 0.6 | GO:0070137 | ubiquitin-like protein-specific endopeptidase activity(GO:0070137) SUMO-specific endopeptidase activity(GO:0070139) |
| 0.1 | 0.6 | GO:0016647 | oxidoreductase activity, acting on the CH-NH group of donors, oxygen as acceptor(GO:0016647) |
| 0.1 | 6.2 | GO:0005484 | SNAP receptor activity(GO:0005484) |
| 0.1 | 10.9 | GO:0048365 | Rac GTPase binding(GO:0048365) |
| 0.1 | 0.6 | GO:0004441 | inositol-1,4-bisphosphate 1-phosphatase activity(GO:0004441) inositol-1,3,4-trisphosphate 1-phosphatase activity(GO:0052829) |
| 0.1 | 4.7 | GO:0043539 | protein serine/threonine kinase activator activity(GO:0043539) |
| 0.1 | 0.9 | GO:0044547 | DNA topoisomerase binding(GO:0044547) |
| 0.1 | 0.5 | GO:0015056 | corticotrophin-releasing factor receptor activity(GO:0015056) |
| 0.1 | 2.7 | GO:0017049 | GTP-Rho binding(GO:0017049) |
| 0.1 | 1.2 | GO:0099602 | acetylcholine receptor regulator activity(GO:0030548) neurotransmitter receptor regulator activity(GO:0099602) |
| 0.1 | 23.8 | GO:0005089 | Rho guanyl-nucleotide exchange factor activity(GO:0005089) |
| 0.1 | 4.2 | GO:0008188 | neuropeptide receptor activity(GO:0008188) |
| 0.1 | 0.6 | GO:0016429 | tRNA (adenine-N1-)-methyltransferase activity(GO:0016429) |
| 0.1 | 1.5 | GO:0005225 | volume-sensitive anion channel activity(GO:0005225) |
| 0.1 | 0.8 | GO:0016929 | SUMO-specific protease activity(GO:0016929) |
| 0.1 | 0.6 | GO:0004468 | lysine N-acetyltransferase activity, acting on acetyl phosphate as donor(GO:0004468) |
| 0.1 | 1.1 | GO:0005243 | gap junction channel activity(GO:0005243) |
| 0.1 | 3.0 | GO:0008307 | structural constituent of muscle(GO:0008307) |
| 0.1 | 2.1 | GO:0097602 | cullin family protein binding(GO:0097602) |
| 0.1 | 3.9 | GO:0003746 | translation elongation factor activity(GO:0003746) |
| 0.1 | 0.2 | GO:0031782 | melanocortin receptor binding(GO:0031779) type 3 melanocortin receptor binding(GO:0031781) type 4 melanocortin receptor binding(GO:0031782) |
| 0.1 | 0.3 | GO:0004958 | prostaglandin F receptor activity(GO:0004958) |
| 0.1 | 0.3 | GO:0003880 | protein C-terminal carboxyl O-methyltransferase activity(GO:0003880) |
| 0.1 | 1.6 | GO:0046935 | 1-phosphatidylinositol-3-kinase regulator activity(GO:0046935) |
| 0.1 | 0.5 | GO:0005502 | 11-cis retinal binding(GO:0005502) |
| 0.1 | 1.0 | GO:0008449 | N-acetylglucosamine-6-sulfatase activity(GO:0008449) |
| 0.1 | 0.6 | GO:0016453 | C-acetyltransferase activity(GO:0016453) |
| 0.1 | 4.4 | GO:0004364 | glutathione transferase activity(GO:0004364) |
| 0.1 | 0.3 | GO:0030346 | protein phosphatase 2B binding(GO:0030346) |
| 0.1 | 0.2 | GO:0017099 | very-long-chain-acyl-CoA dehydrogenase activity(GO:0017099) |
| 0.1 | 2.6 | GO:0045294 | alpha-catenin binding(GO:0045294) |
| 0.1 | 1.0 | GO:0001665 | alpha-N-acetylgalactosaminide alpha-2,6-sialyltransferase activity(GO:0001665) |
| 0.1 | 0.1 | GO:0061752 | telomeric repeat-containing RNA binding(GO:0061752) |
| 0.1 | 22.7 | GO:0005516 | calmodulin binding(GO:0005516) |
| 0.1 | 1.2 | GO:0005041 | low-density lipoprotein receptor activity(GO:0005041) |
| 0.1 | 0.4 | GO:0033677 | DNA/RNA helicase activity(GO:0033677) |
| 0.1 | 0.6 | GO:0004749 | ribose phosphate diphosphokinase activity(GO:0004749) |
| 0.1 | 0.3 | GO:0008193 | tRNA guanylyltransferase activity(GO:0008193) |
| 0.1 | 1.3 | GO:0046920 | alpha-(1->3)-fucosyltransferase activity(GO:0046920) |
| 0.1 | 3.5 | GO:0005521 | lamin binding(GO:0005521) |
| 0.1 | 1.1 | GO:0015288 | porin activity(GO:0015288) |
| 0.1 | 0.2 | GO:0004938 | alpha2-adrenergic receptor activity(GO:0004938) |
| 0.1 | 0.3 | GO:0033878 | hormone-sensitive lipase activity(GO:0033878) |
| 0.1 | 0.3 | GO:0071987 | WD40-repeat domain binding(GO:0071987) |
| 0.1 | 1.1 | GO:0070290 | N-acylphosphatidylethanolamine-specific phospholipase D activity(GO:0070290) |
| 0.1 | 0.7 | GO:0047045 | testosterone 17-beta-dehydrogenase (NADP+) activity(GO:0047045) |
| 0.1 | 0.8 | GO:0008430 | selenium binding(GO:0008430) |
| 0.1 | 1.3 | GO:0000400 | four-way junction DNA binding(GO:0000400) |
| 0.1 | 0.7 | GO:0001849 | complement component C1q binding(GO:0001849) |
| 0.1 | 0.3 | GO:0070053 | thrombospondin receptor activity(GO:0070053) |
| 0.1 | 8.1 | GO:0005201 | extracellular matrix structural constituent(GO:0005201) |
| 0.1 | 0.4 | GO:0001026 | TFIIIB-type transcription factor activity(GO:0001026) |
| 0.1 | 1.3 | GO:0030552 | cAMP binding(GO:0030552) |
| 0.1 | 0.6 | GO:0003917 | DNA topoisomerase type I activity(GO:0003917) |
| 0.1 | 0.9 | GO:0016167 | glial cell-derived neurotrophic factor receptor activity(GO:0016167) |
| 0.1 | 3.0 | GO:0005355 | glucose transmembrane transporter activity(GO:0005355) |
| 0.1 | 4.1 | GO:0042162 | telomeric DNA binding(GO:0042162) |
| 0.1 | 0.2 | GO:0042813 | Wnt-activated receptor activity(GO:0042813) |
| 0.1 | 2.0 | GO:0048306 | calcium-dependent protein binding(GO:0048306) |
| 0.1 | 0.7 | GO:0019784 | NEDD8-specific protease activity(GO:0019784) |
| 0.1 | 0.5 | GO:0008273 | calcium, potassium:sodium antiporter activity(GO:0008273) |
| 0.1 | 0.4 | GO:0003839 | gamma-glutamylcyclotransferase activity(GO:0003839) |
| 0.1 | 0.7 | GO:0015272 | ATP-activated inward rectifier potassium channel activity(GO:0015272) |
| 0.1 | 0.5 | GO:0032050 | clathrin heavy chain binding(GO:0032050) |
| 0.1 | 0.4 | GO:0003747 | translation release factor activity(GO:0003747) translation termination factor activity(GO:0008079) |
| 0.1 | 1.6 | GO:0030618 | transforming growth factor beta receptor, pathway-specific cytoplasmic mediator activity(GO:0030618) |
| 0.1 | 0.8 | GO:0036122 | BMP binding(GO:0036122) |
| 0.1 | 1.7 | GO:0017110 | nucleoside-diphosphatase activity(GO:0017110) |
| 0.1 | 6.2 | GO:0005044 | scavenger receptor activity(GO:0005044) |
| 0.1 | 0.8 | GO:0004859 | phospholipase inhibitor activity(GO:0004859) |
| 0.1 | 0.3 | GO:0008417 | fucosyltransferase activity(GO:0008417) |
| 0.1 | 0.7 | GO:0001733 | galactosylceramide sulfotransferase activity(GO:0001733) galactose 3-O-sulfotransferase activity(GO:0050694) |
| 0.1 | 0.5 | GO:0003989 | acetyl-CoA carboxylase activity(GO:0003989) |
| 0.1 | 0.9 | GO:0004435 | phosphatidylinositol phospholipase C activity(GO:0004435) |
| 0.1 | 0.4 | GO:0098519 | nucleotide phosphatase activity, acting on free nucleotides(GO:0098519) |
| 0.1 | 0.2 | GO:0004421 | hydroxymethylglutaryl-CoA synthase activity(GO:0004421) |
| 0.1 | 0.3 | GO:0008476 | protein-tyrosine sulfotransferase activity(GO:0008476) |
| 0.1 | 1.4 | GO:0015095 | magnesium ion transmembrane transporter activity(GO:0015095) |
| 0.1 | 2.4 | GO:0046875 | ephrin receptor binding(GO:0046875) |
| 0.1 | 0.5 | GO:0004035 | alkaline phosphatase activity(GO:0004035) |
| 0.1 | 0.4 | GO:0032190 | acrosin binding(GO:0032190) |
| 0.1 | 0.1 | GO:0008534 | oxidized purine nucleobase lesion DNA N-glycosylase activity(GO:0008534) |
| 0.1 | 22.8 | GO:0003924 | GTPase activity(GO:0003924) |
| 0.1 | 1.6 | GO:0004675 | transmembrane receptor protein serine/threonine kinase activity(GO:0004675) |
| 0.1 | 1.9 | GO:0042166 | acetylcholine binding(GO:0042166) |
| 0.1 | 1.4 | GO:0051787 | misfolded protein binding(GO:0051787) |
| 0.1 | 0.4 | GO:0015106 | bicarbonate transmembrane transporter activity(GO:0015106) |
| 0.1 | 0.3 | GO:0035514 | DNA demethylase activity(GO:0035514) |
| 0.1 | 0.6 | GO:0051525 | NFAT protein binding(GO:0051525) |
| 0.1 | 0.3 | GO:0070991 | medium-chain-acyl-CoA dehydrogenase activity(GO:0070991) |
| 0.1 | 0.2 | GO:0004021 | L-alanine:2-oxoglutarate aminotransferase activity(GO:0004021) alanine-oxo-acid transaminase activity(GO:0047635) |
| 0.1 | 0.2 | GO:0004360 | glutamine-fructose-6-phosphate transaminase (isomerizing) activity(GO:0004360) |
| 0.1 | 2.2 | GO:0044183 | protein binding involved in protein folding(GO:0044183) |
| 0.1 | 0.4 | GO:0000293 | ferric-chelate reductase activity(GO:0000293) |
| 0.1 | 0.2 | GO:0005093 | Rab GDP-dissociation inhibitor activity(GO:0005093) |
| 0.1 | 1.9 | GO:0051537 | 2 iron, 2 sulfur cluster binding(GO:0051537) |
| 0.1 | 1.6 | GO:0001671 | ATPase activator activity(GO:0001671) |
| 0.1 | 0.2 | GO:0016652 | NAD(P)+ transhydrogenase activity(GO:0008746) oxidoreductase activity, acting on NAD(P)H, NAD(P) as acceptor(GO:0016652) |
| 0.1 | 0.3 | GO:0030942 | endoplasmic reticulum signal peptide binding(GO:0030942) |
| 0.1 | 0.1 | GO:0043682 | copper-exporting ATPase activity(GO:0004008) copper-transporting ATPase activity(GO:0043682) |
| 0.1 | 0.3 | GO:0004668 | protein-arginine deiminase activity(GO:0004668) |
| 0.1 | 0.1 | GO:0048408 | epidermal growth factor binding(GO:0048408) |
| 0.1 | 0.2 | GO:0090555 | phosphatidylethanolamine-translocating ATPase activity(GO:0090555) |
| 0.1 | 5.7 | GO:0019888 | protein phosphatase regulator activity(GO:0019888) |
| 0.1 | 1.5 | GO:0016805 | dipeptidase activity(GO:0016805) |
| 0.1 | 0.2 | GO:0071885 | N-terminal protein N-methyltransferase activity(GO:0071885) |
| 0.0 | 0.2 | GO:0008478 | pyridoxal kinase activity(GO:0008478) |
| 0.0 | 0.5 | GO:0047429 | nucleoside-triphosphate diphosphatase activity(GO:0047429) |
| 0.0 | 0.4 | GO:0061665 | SUMO ligase activity(GO:0061665) |
| 0.0 | 0.4 | GO:0005520 | insulin-like growth factor binding(GO:0005520) |
| 0.0 | 0.1 | GO:1990599 | 3' overhang single-stranded DNA endodeoxyribonuclease activity(GO:1990599) |
| 0.0 | 0.3 | GO:0070567 | cytidylyltransferase activity(GO:0070567) |
| 0.0 | 0.7 | GO:0019531 | oxalate transmembrane transporter activity(GO:0019531) |
| 0.0 | 0.3 | GO:0004473 | malate dehydrogenase (decarboxylating) (NAD+) activity(GO:0004471) malate dehydrogenase (decarboxylating) (NADP+) activity(GO:0004473) |
| 0.0 | 0.1 | GO:0000035 | acyl binding(GO:0000035) |
| 0.0 | 0.3 | GO:0036132 | 13-prostaglandin reductase activity(GO:0036132) 15-oxoprostaglandin 13-oxidase activity(GO:0047522) |
| 0.0 | 0.6 | GO:0004993 | G-protein coupled serotonin receptor activity(GO:0004993) |
| 0.0 | 0.6 | GO:0005132 | type I interferon receptor binding(GO:0005132) |
| 0.0 | 0.0 | GO:0008556 | potassium-transporting ATPase activity(GO:0008556) |
| 0.0 | 0.6 | GO:0043395 | heparan sulfate proteoglycan binding(GO:0043395) |
| 0.0 | 0.1 | GO:0032090 | Pyrin domain binding(GO:0032090) |
| 0.0 | 0.6 | GO:0004550 | nucleoside diphosphate kinase activity(GO:0004550) |
| 0.0 | 0.2 | GO:0004814 | arginine-tRNA ligase activity(GO:0004814) |
| 0.0 | 0.9 | GO:0051371 | muscle alpha-actinin binding(GO:0051371) |
| 0.0 | 33.1 | GO:0005509 | calcium ion binding(GO:0005509) |
| 0.0 | 3.8 | GO:0044325 | ion channel binding(GO:0044325) |
| 0.0 | 0.3 | GO:0043138 | 3'-5' DNA helicase activity(GO:0043138) |
| 0.0 | 0.4 | GO:0003689 | DNA clamp loader activity(GO:0003689) protein-DNA loading ATPase activity(GO:0033170) |
| 0.0 | 0.4 | GO:0070181 | small ribosomal subunit rRNA binding(GO:0070181) |
| 0.0 | 0.1 | GO:0047225 | acetylgalactosaminyl-O-glycosyl-glycoprotein beta-1,6-N-acetylglucosaminyltransferase activity(GO:0047225) |
| 0.0 | 0.7 | GO:0030515 | snoRNA binding(GO:0030515) |
| 0.0 | 1.5 | GO:0005154 | epidermal growth factor receptor binding(GO:0005154) |
| 0.0 | 1.1 | GO:0004029 | aldehyde dehydrogenase (NAD) activity(GO:0004029) |
| 0.0 | 0.2 | GO:0019534 | toxin transporter activity(GO:0019534) |
| 0.0 | 0.3 | GO:0050750 | low-density lipoprotein particle receptor binding(GO:0050750) |
| 0.0 | 0.1 | GO:0004119 | cGMP-inhibited cyclic-nucleotide phosphodiesterase activity(GO:0004119) |
| 0.0 | 0.1 | GO:0034353 | RNA pyrophosphohydrolase activity(GO:0034353) |
| 0.0 | 0.2 | GO:0015562 | efflux transmembrane transporter activity(GO:0015562) |
| 0.0 | 0.3 | GO:0001094 | TFIID-class transcription factor binding(GO:0001094) |
| 0.0 | 0.3 | GO:0045029 | UDP-activated nucleotide receptor activity(GO:0045029) |
| 0.0 | 0.1 | GO:0004452 | isopentenyl-diphosphate delta-isomerase activity(GO:0004452) |
| 0.0 | 0.2 | GO:0016900 | oxidoreductase activity, acting on the CH-OH group of donors, disulfide as acceptor(GO:0016900) vitamin-K-epoxide reductase (warfarin-sensitive) activity(GO:0047057) |
| 0.0 | 0.3 | GO:0003777 | microtubule motor activity(GO:0003777) |
| 0.0 | 0.2 | GO:0031748 | D1 dopamine receptor binding(GO:0031748) |
| 0.0 | 0.2 | GO:0004430 | 1-phosphatidylinositol 4-kinase activity(GO:0004430) |
| 0.0 | 0.1 | GO:0004090 | carbonyl reductase (NADPH) activity(GO:0004090) |
| 0.0 | 0.1 | GO:0005222 | intracellular cAMP activated cation channel activity(GO:0005222) |
| 0.0 | 0.0 | GO:0000822 | inositol hexakisphosphate binding(GO:0000822) |
| 0.0 | 0.4 | GO:0004321 | fatty-acyl-CoA synthase activity(GO:0004321) |
| 0.0 | 0.4 | GO:0003796 | lysozyme activity(GO:0003796) |
| 0.0 | 0.1 | GO:0035276 | ethanol binding(GO:0035276) |
| 0.0 | 0.1 | GO:0061599 | nitrate reductase activity(GO:0008940) molybdopterin adenylyltransferase activity(GO:0061598) molybdopterin molybdotransferase activity(GO:0061599) |
| 0.0 | 0.5 | GO:0030983 | mismatched DNA binding(GO:0030983) |
| 0.0 | 0.1 | GO:0008422 | beta-glucosidase activity(GO:0008422) |
| 0.0 | 0.1 | GO:0050333 | thiamin-triphosphatase activity(GO:0050333) |
| 0.0 | 0.7 | GO:0001011 | transcription factor activity, sequence-specific DNA binding, RNA polymerase recruiting(GO:0001011) transcription factor activity, TFIIB-class binding(GO:0001087) |
| 0.0 | 0.1 | GO:0004730 | pseudouridylate synthase activity(GO:0004730) |
| 0.0 | 0.2 | GO:0004656 | procollagen-proline 4-dioxygenase activity(GO:0004656) |
| 0.0 | 0.1 | GO:0003875 | ADP-ribosylarginine hydrolase activity(GO:0003875) |
| 0.0 | 0.3 | GO:0001162 | RNA polymerase II intronic transcription regulatory region sequence-specific DNA binding(GO:0001162) |
| 0.0 | 0.2 | GO:0003854 | 3-beta-hydroxy-delta5-steroid dehydrogenase activity(GO:0003854) |
| 0.0 | 0.1 | GO:0003918 | DNA topoisomerase type II (ATP-hydrolyzing) activity(GO:0003918) DNA topoisomerase II activity(GO:0061505) |
| 0.0 | 0.1 | GO:0008607 | phosphorylase kinase regulator activity(GO:0008607) |
| 0.0 | 0.9 | GO:0031624 | ubiquitin conjugating enzyme binding(GO:0031624) |
| 0.0 | 0.1 | GO:0001132 | RNA polymerase II transcription factor activity, TBP-class protein binding, involved in preinitiation complex assembly(GO:0001129) RNA polymerase II transcription factor activity, TBP-class protein binding(GO:0001132) |
| 0.0 | 0.2 | GO:0043422 | protein kinase B binding(GO:0043422) |
| 0.0 | 0.3 | GO:0032052 | bile acid binding(GO:0032052) |
| 0.0 | 0.1 | GO:0004844 | uracil DNA N-glycosylase activity(GO:0004844) deaminated base DNA N-glycosylase activity(GO:0097506) |
| 0.0 | 0.1 | GO:0019237 | centromeric DNA binding(GO:0019237) |
| 0.0 | 0.7 | GO:0001540 | beta-amyloid binding(GO:0001540) |
| 0.0 | 0.4 | GO:0005109 | frizzled binding(GO:0005109) |
| 0.0 | 0.1 | GO:0016418 | S-acetyltransferase activity(GO:0016418) |
| 0.0 | 0.3 | GO:0016423 | tRNA (guanine) methyltransferase activity(GO:0016423) |
| 0.0 | 0.2 | GO:0015386 | potassium:proton antiporter activity(GO:0015386) |
| 0.0 | 0.1 | GO:0030144 | alpha-1,6-mannosylglycoprotein 6-beta-N-acetylglucosaminyltransferase activity(GO:0030144) |
| 0.0 | 0.1 | GO:0004169 | dolichyl-phosphate-mannose-protein mannosyltransferase activity(GO:0004169) |
| 0.0 | 0.3 | GO:0005092 | GDP-dissociation inhibitor activity(GO:0005092) |
| 0.0 | 0.1 | GO:0017108 | 5'-flap endonuclease activity(GO:0017108) |
| 0.0 | 0.0 | GO:0019781 | NEDD8 activating enzyme activity(GO:0019781) |
| 0.0 | 0.2 | GO:0004526 | ribonuclease P activity(GO:0004526) |
| 0.0 | 0.3 | GO:0047555 | 3',5'-cyclic-GMP phosphodiesterase activity(GO:0047555) |
| 0.0 | 0.1 | GO:0004305 | ethanolamine kinase activity(GO:0004305) |
| 0.0 | 0.0 | GO:0004766 | spermidine synthase activity(GO:0004766) |
| 0.0 | 0.1 | GO:0008200 | ion channel inhibitor activity(GO:0008200) |
| 0.0 | 0.0 | GO:0004660 | protein farnesyltransferase activity(GO:0004660) |
| 0.0 | 0.2 | GO:0003680 | AT DNA binding(GO:0003680) |
Gene overrepresentation in curated gene sets: canonical pathways category:
| Log-likelihood per target | Total log-likelihood | Term | Description |
|---|---|---|---|
| 1.3 | 2.7 | PID ER NONGENOMIC PATHWAY | Plasma membrane estrogen receptor signaling |
| 1.0 | 25.8 | PID P38 GAMMA DELTA PATHWAY | Signaling mediated by p38-gamma and p38-delta |
| 0.6 | 36.9 | NABA PROTEOGLYCANS | Genes encoding proteoglycans |
| 0.6 | 14.8 | PID S1P S1P4 PATHWAY | S1P4 pathway |
| 0.6 | 34.2 | ST MYOCYTE AD PATHWAY | Myocyte Adrenergic Pathway is a specific case of the generalized Adrenergic Pathway. |
| 0.5 | 2.0 | PID PDGFRA PATHWAY | PDGFR-alpha signaling pathway |
| 0.5 | 9.0 | PID PI3K PLC TRK PATHWAY | Trk receptor signaling mediated by PI3K and PLC-gamma |
| 0.4 | 1.3 | ST PAC1 RECEPTOR PATHWAY | PAC1 Receptor Pathway |
| 0.4 | 33.6 | PID NCADHERIN PATHWAY | N-cadherin signaling events |
| 0.4 | 22.9 | PID LIS1 PATHWAY | Lissencephaly gene (LIS1) in neuronal migration and development |
| 0.4 | 21.0 | SIG CD40PATHWAYMAP | Genes related to CD40 signaling |
| 0.3 | 4.0 | PID ERBB2 ERBB3 PATHWAY | ErbB2/ErbB3 signaling events |
| 0.3 | 7.1 | PID MAPK TRK PATHWAY | Trk receptor signaling mediated by the MAPK pathway |
| 0.3 | 9.4 | NABA BASEMENT MEMBRANES | Genes encoding structural components of basement membranes |
| 0.3 | 3.7 | ST G ALPHA I PATHWAY | G alpha i Pathway |
| 0.3 | 4.8 | PID REELIN PATHWAY | Reelin signaling pathway |
| 0.3 | 30.4 | PID INTEGRIN A4B1 PATHWAY | Alpha4 beta1 integrin signaling events |
| 0.3 | 13.1 | PID EPHB FWD PATHWAY | EPHB forward signaling |
| 0.3 | 11.0 | PID NETRIN PATHWAY | Netrin-mediated signaling events |
| 0.3 | 19.6 | SIG REGULATION OF THE ACTIN CYTOSKELETON BY RHO GTPASES | Genes related to regulation of the actin cytoskeleton |
| 0.3 | 5.9 | PID NECTIN PATHWAY | Nectin adhesion pathway |
| 0.3 | 5.9 | PID INTEGRIN4 PATHWAY | Alpha6 beta4 integrin-ligand interactions |
| 0.3 | 7.8 | PID SYNDECAN 3 PATHWAY | Syndecan-3-mediated signaling events |
| 0.2 | 21.5 | PID CDC42 REG PATHWAY | Regulation of CDC42 activity |
| 0.2 | 7.3 | PID NEPHRIN NEPH1 PATHWAY | Nephrin/Neph1 signaling in the kidney podocyte |
| 0.2 | 4.6 | PID IL8 CXCR1 PATHWAY | IL8- and CXCR1-mediated signaling events |
| 0.2 | 1.1 | PID ERBB NETWORK PATHWAY | ErbB receptor signaling network |
| 0.2 | 4.2 | PID ANTHRAX PATHWAY | Cellular roles of Anthrax toxin |
| 0.2 | 65.0 | NABA ECM GLYCOPROTEINS | Genes encoding structural ECM glycoproteins |
| 0.2 | 4.0 | SA REG CASCADE OF CYCLIN EXPR | Expression of cyclins regulates progression through the cell cycle by activating cyclin-dependent kinases. |
| 0.2 | 4.0 | PID INTEGRIN3 PATHWAY | Beta3 integrin cell surface interactions |
| 0.2 | 6.5 | PID HEDGEHOG 2PATHWAY | Signaling events mediated by the Hedgehog family |
| 0.2 | 6.8 | PID CDC42 PATHWAY | CDC42 signaling events |
| 0.2 | 0.2 | PID FAS PATHWAY | FAS (CD95) signaling pathway |
| 0.2 | 4.9 | ST GA12 PATHWAY | G alpha 12 Pathway |
| 0.2 | 5.2 | PID ALK1 PATHWAY | ALK1 signaling events |
| 0.2 | 3.8 | PID ALK2 PATHWAY | ALK2 signaling events |
| 0.2 | 12.5 | ST FAS SIGNALING PATHWAY | Fas Signaling Pathway |
| 0.2 | 13.1 | PID P75 NTR PATHWAY | p75(NTR)-mediated signaling |
| 0.2 | 0.6 | PID RETINOIC ACID PATHWAY | Retinoic acid receptors-mediated signaling |
| 0.1 | 8.0 | NABA COLLAGENS | Genes encoding collagen proteins |
| 0.1 | 3.2 | PID LPA4 PATHWAY | LPA4-mediated signaling events |
| 0.1 | 1.0 | PID ARF6 DOWNSTREAM PATHWAY | Arf6 downstream pathway |
| 0.1 | 9.1 | PID TRKR PATHWAY | Neurotrophic factor-mediated Trk receptor signaling |
| 0.1 | 3.8 | PID A6B1 A6B4 INTEGRIN PATHWAY | a6b1 and a6b4 Integrin signaling |
| 0.1 | 0.6 | PID WNT CANONICAL PATHWAY | Canonical Wnt signaling pathway |
| 0.1 | 1.1 | ST G ALPHA S PATHWAY | G alpha s Pathway |
| 0.1 | 3.2 | PID ECADHERIN NASCENT AJ PATHWAY | E-cadherin signaling in the nascent adherens junction |
| 0.1 | 3.0 | PID RET PATHWAY | Signaling events regulated by Ret tyrosine kinase |
| 0.1 | 6.5 | PID ATR PATHWAY | ATR signaling pathway |
| 0.1 | 6.3 | ST WNT BETA CATENIN PATHWAY | Wnt/beta-catenin Pathway |
| 0.1 | 1.5 | PID GLYPICAN 1PATHWAY | Glypican 1 network |
| 0.1 | 7.9 | PID LKB1 PATHWAY | LKB1 signaling events |
| 0.1 | 0.4 | SA TRKA RECEPTOR | The TrkA receptor binds nerve growth factor to activate MAP kinase pathways and promote cell growth. |
| 0.1 | 4.7 | PID AURORA B PATHWAY | Aurora B signaling |
| 0.1 | 2.4 | PID ALPHA SYNUCLEIN PATHWAY | Alpha-synuclein signaling |
| 0.1 | 1.7 | PID HES HEY PATHWAY | Notch-mediated HES/HEY network |
| 0.1 | 1.2 | SA FAS SIGNALING | The TNF-type receptor Fas induces apoptosis on ligand binding. |
| 0.1 | 0.9 | PID ERB GENOMIC PATHWAY | Validated nuclear estrogen receptor beta network |
| 0.1 | 1.7 | PID RAC1 REG PATHWAY | Regulation of RAC1 activity |
| 0.1 | 1.4 | ST GA13 PATHWAY | G alpha 13 Pathway |
| 0.1 | 0.4 | ST TYPE I INTERFERON PATHWAY | Type I Interferon (alpha/beta IFN) Pathway |
| 0.1 | 1.3 | PID FOXM1 PATHWAY | FOXM1 transcription factor network |
| 0.1 | 1.1 | PID WNT SIGNALING PATHWAY | Wnt signaling network |
| 0.1 | 1.3 | PID LYSOPHOSPHOLIPID PATHWAY | LPA receptor mediated events |
| 0.1 | 2.5 | PID RAC1 PATHWAY | RAC1 signaling pathway |
| 0.1 | 1.6 | PID ECADHERIN STABILIZATION PATHWAY | Stabilization and expansion of the E-cadherin adherens junction |
| 0.1 | 1.2 | PID INSULIN GLUCOSE PATHWAY | Insulin-mediated glucose transport |
| 0.0 | 1.1 | ST WNT CA2 CYCLIC GMP PATHWAY | Wnt/Ca2+/cyclic GMP signaling. |
| 0.0 | 0.2 | PID SYNDECAN 1 PATHWAY | Syndecan-1-mediated signaling events |
| 0.0 | 0.3 | PID ECADHERIN KERATINOCYTE PATHWAY | E-cadherin signaling in keratinocytes |
| 0.0 | 0.6 | ST JNK MAPK PATHWAY | JNK MAPK Pathway |
| 0.0 | 4.4 | PID ERA GENOMIC PATHWAY | Validated nuclear estrogen receptor alpha network |
| 0.0 | 0.9 | PID EPHA FWDPATHWAY | EPHA forward signaling |
| 0.0 | 0.5 | PID BETA CATENIN DEG PATHWAY | Degradation of beta catenin |
| 0.0 | 0.7 | PID BARD1 PATHWAY | BARD1 signaling events |
| 0.0 | 0.1 | ST ADRENERGIC | Adrenergic Pathway |
| 0.0 | 0.7 | PID RHODOPSIN PATHWAY | Visual signal transduction: Rods |
| 0.0 | 0.1 | PID S1P S1P2 PATHWAY | S1P2 pathway |
| 0.0 | 0.1 | PID FAK PATHWAY | Signaling events mediated by focal adhesion kinase |
| 0.0 | 0.7 | PID ERBB1 INTERNALIZATION PATHWAY | Internalization of ErbB1 |
| 0.0 | 6.3 | NABA SECRETED FACTORS | Genes encoding secreted soluble factors |
| 0.0 | 0.2 | PID RANBP2 PATHWAY | Sumoylation by RanBP2 regulates transcriptional repression |
Gene overrepresentation in curated gene sets: REACTOME pathways category:
| Log-likelihood per target | Total log-likelihood | Term | Description |
|---|---|---|---|
| 1.8 | 82.4 | REACTOME GABA A RECEPTOR ACTIVATION | Genes involved in GABA A receptor activation |
| 1.8 | 46.4 | REACTOME CLASS C 3 METABOTROPIC GLUTAMATE PHEROMONE RECEPTORS | Genes involved in Class C/3 (Metabotropic glutamate/pheromone receptors) |
| 1.3 | 39.7 | REACTOME DOPAMINE NEUROTRANSMITTER RELEASE CYCLE | Genes involved in Dopamine Neurotransmitter Release Cycle |
| 1.0 | 61.2 | REACTOME INTERACTION BETWEEN L1 AND ANKYRINS | Genes involved in Interaction between L1 and Ankyrins |
| 1.0 | 35.2 | REACTOME PLATELET CALCIUM HOMEOSTASIS | Genes involved in Platelet calcium homeostasis |
| 0.9 | 27.4 | REACTOME GABA SYNTHESIS RELEASE REUPTAKE AND DEGRADATION | Genes involved in GABA synthesis, release, reuptake and degradation |
| 0.9 | 53.9 | REACTOME INHIBITION OF INSULIN SECRETION BY ADRENALINE NORADRENALINE | Genes involved in Inhibition of Insulin Secretion by Adrenaline/Noradrenaline |
| 0.9 | 3.5 | REACTOME RAS ACTIVATION UOPN CA2 INFUX THROUGH NMDA RECEPTOR | Genes involved in Ras activation uopn Ca2+ infux through NMDA receptor |
| 0.8 | 32.0 | REACTOME IONOTROPIC ACTIVITY OF KAINATE RECEPTORS | Genes involved in Ionotropic activity of Kainate Receptors |
| 0.8 | 39.2 | REACTOME UNBLOCKING OF NMDA RECEPTOR GLUTAMATE BINDING AND ACTIVATION | Genes involved in Unblocking of NMDA receptor, glutamate binding and activation |
| 0.7 | 0.7 | REACTOME SIGNALING BY FGFR IN DISEASE | Genes involved in Signaling by FGFR in disease |
| 0.7 | 21.4 | REACTOME REGULATION OF INSULIN LIKE GROWTH FACTOR IGF ACTIVITY BY INSULIN LIKE GROWTH FACTOR BINDING PROTEINS IGFBPS | Genes involved in Regulation of Insulin-like Growth Factor (IGF) Activity by Insulin-like Growth Factor Binding Proteins (IGFBPs) |
| 0.7 | 38.0 | REACTOME ION TRANSPORT BY P TYPE ATPASES | Genes involved in Ion transport by P-type ATPases |
| 0.6 | 26.3 | REACTOME TRAFFICKING OF AMPA RECEPTORS | Genes involved in Trafficking of AMPA receptors |
| 0.5 | 42.4 | REACTOME SIGNALING BY ROBO RECEPTOR | Genes involved in Signaling by Robo receptor |
| 0.5 | 40.6 | REACTOME VOLTAGE GATED POTASSIUM CHANNELS | Genes involved in Voltage gated Potassium channels |
| 0.5 | 8.1 | REACTOME E2F ENABLED INHIBITION OF PRE REPLICATION COMPLEX FORMATION | Genes involved in E2F-enabled inhibition of pre-replication complex formation |
| 0.5 | 20.7 | REACTOME POST CHAPERONIN TUBULIN FOLDING PATHWAY | Genes involved in Post-chaperonin tubulin folding pathway |
| 0.5 | 36.0 | REACTOME DARPP 32 EVENTS | Genes involved in DARPP-32 events |
| 0.5 | 10.1 | REACTOME SIGNALING BY FGFR3 MUTANTS | Genes involved in Signaling by FGFR3 mutants |
| 0.4 | 26.0 | REACTOME ADHERENS JUNCTIONS INTERACTIONS | Genes involved in Adherens junctions interactions |
| 0.4 | 15.6 | REACTOME CRMPS IN SEMA3A SIGNALING | Genes involved in CRMPs in Sema3A signaling |
| 0.4 | 28.8 | REACTOME NETRIN1 SIGNALING | Genes involved in Netrin-1 signaling |
| 0.4 | 5.4 | REACTOME SEROTONIN RECEPTORS | Genes involved in Serotonin receptors |
| 0.4 | 18.5 | REACTOME CGMP EFFECTS | Genes involved in cGMP effects |
| 0.4 | 30.5 | REACTOME NCAM1 INTERACTIONS | Genes involved in NCAM1 interactions |
| 0.3 | 7.3 | REACTOME GAP JUNCTION DEGRADATION | Genes involved in Gap junction degradation |
| 0.3 | 1.0 | REACTOME SEMA3A PAK DEPENDENT AXON REPULSION | Genes involved in Sema3A PAK dependent Axon repulsion |
| 0.3 | 2.4 | REACTOME FGFR2C LIGAND BINDING AND ACTIVATION | Genes involved in FGFR2c ligand binding and activation |
| 0.3 | 4.8 | REACTOME DSCAM INTERACTIONS | Genes involved in DSCAM interactions |
| 0.3 | 13.5 | REACTOME SYNTHESIS OF VERY LONG CHAIN FATTY ACYL COAS | Genes involved in Synthesis of very long-chain fatty acyl-CoAs |
| 0.3 | 4.4 | REACTOME CREATION OF C4 AND C2 ACTIVATORS | Genes involved in Creation of C4 and C2 activators |
| 0.3 | 1.2 | REACTOME SCF BETA TRCP MEDIATED DEGRADATION OF EMI1 | Genes involved in SCF-beta-TrCP mediated degradation of Emi1 |
| 0.3 | 7.4 | REACTOME BOTULINUM NEUROTOXICITY | Genes involved in Botulinum neurotoxicity |
| 0.3 | 5.2 | REACTOME GLUTAMATE NEUROTRANSMITTER RELEASE CYCLE | Genes involved in Glutamate Neurotransmitter Release Cycle |
| 0.3 | 10.9 | REACTOME AMINE LIGAND BINDING RECEPTORS | Genes involved in Amine ligand-binding receptors |
| 0.3 | 0.6 | REACTOME VIF MEDIATED DEGRADATION OF APOBEC3G | Genes involved in Vif-mediated degradation of APOBEC3G |
| 0.3 | 1.8 | REACTOME CROSS PRESENTATION OF SOLUBLE EXOGENOUS ANTIGENS ENDOSOMES | Genes involved in Cross-presentation of soluble exogenous antigens (endosomes) |
| 0.2 | 2.2 | REACTOME REGULATION OF INSULIN SECRETION BY GLUCAGON LIKE PEPTIDE1 | Genes involved in Regulation of Insulin Secretion by Glucagon-like Peptide-1 |
| 0.2 | 0.5 | REACTOME TRANSPORT OF MATURE MRNA DERIVED FROM AN INTRONLESS TRANSCRIPT | Genes involved in Transport of Mature mRNA Derived from an Intronless Transcript |
| 0.2 | 7.0 | REACTOME INSULIN SYNTHESIS AND PROCESSING | Genes involved in Insulin Synthesis and Processing |
| 0.2 | 2.4 | REACTOME KERATAN SULFATE KERATIN METABOLISM | Genes involved in Keratan sulfate/keratin metabolism |
| 0.2 | 9.4 | REACTOME A TETRASACCHARIDE LINKER SEQUENCE IS REQUIRED FOR GAG SYNTHESIS | Genes involved in A tetrasaccharide linker sequence is required for GAG synthesis |
| 0.2 | 3.0 | REACTOME BASIGIN INTERACTIONS | Genes involved in Basigin interactions |
| 0.2 | 0.6 | REACTOME SIGNALING BY ACTIVATED POINT MUTANTS OF FGFR1 | Genes involved in Signaling by activated point mutants of FGFR1 |
| 0.2 | 3.8 | REACTOME SYNTHESIS OF PIPS AT THE LATE ENDOSOME MEMBRANE | Genes involved in Synthesis of PIPs at the late endosome membrane |
| 0.2 | 5.5 | REACTOME NA CL DEPENDENT NEUROTRANSMITTER TRANSPORTERS | Genes involved in Na+/Cl- dependent neurotransmitter transporters |
| 0.2 | 3.5 | REACTOME PASSIVE TRANSPORT BY AQUAPORINS | Genes involved in Passive Transport by Aquaporins |
| 0.2 | 11.6 | REACTOME SMOOTH MUSCLE CONTRACTION | Genes involved in Smooth Muscle Contraction |
| 0.2 | 5.3 | REACTOME G1 S SPECIFIC TRANSCRIPTION | Genes involved in G1/S-Specific Transcription |
| 0.2 | 3.7 | REACTOME KERATAN SULFATE DEGRADATION | Genes involved in Keratan sulfate degradation |
| 0.2 | 3.9 | REACTOME ALPHA LINOLENIC ACID ALA METABOLISM | Genes involved in alpha-linolenic acid (ALA) metabolism |
| 0.2 | 6.0 | REACTOME TGF BETA RECEPTOR SIGNALING IN EMT EPITHELIAL TO MESENCHYMAL TRANSITION | Genes involved in TGF-beta receptor signaling in EMT (epithelial to mesenchymal transition) |
| 0.2 | 7.7 | REACTOME SYNTHESIS AND INTERCONVERSION OF NUCLEOTIDE DI AND TRIPHOSPHATES | Genes involved in Synthesis and interconversion of nucleotide di- and triphosphates |
| 0.2 | 8.0 | REACTOME ACTIVATION OF GENES BY ATF4 | Genes involved in Activation of Genes by ATF4 |
| 0.2 | 8.1 | REACTOME SIGNALING BY NODAL | Genes involved in Signaling by NODAL |
| 0.2 | 10.8 | REACTOME GLYCOLYSIS | Genes involved in Glycolysis |
| 0.2 | 15.5 | REACTOME AMINO ACID AND OLIGOPEPTIDE SLC TRANSPORTERS | Genes involved in Amino acid and oligopeptide SLC transporters |
| 0.2 | 3.2 | REACTOME N GLYCAN ANTENNAE ELONGATION | Genes involved in N-Glycan antennae elongation |
| 0.2 | 1.9 | REACTOME APOBEC3G MEDIATED RESISTANCE TO HIV1 INFECTION | Genes involved in APOBEC3G mediated resistance to HIV-1 infection |
| 0.2 | 1.6 | REACTOME NITRIC OXIDE STIMULATES GUANYLATE CYCLASE | Genes involved in Nitric oxide stimulates guanylate cyclase |
| 0.2 | 4.0 | REACTOME BMAL1 CLOCK NPAS2 ACTIVATES CIRCADIAN EXPRESSION | Genes involved in BMAL1:CLOCK/NPAS2 Activates Circadian Expression |
| 0.2 | 7.4 | REACTOME KINESINS | Genes involved in Kinesins |
| 0.2 | 4.1 | REACTOME GAP JUNCTION TRAFFICKING | Genes involved in Gap junction trafficking |
| 0.2 | 5.6 | REACTOME CELL EXTRACELLULAR MATRIX INTERACTIONS | Genes involved in Cell-extracellular matrix interactions |
| 0.1 | 1.0 | REACTOME RETROGRADE NEUROTROPHIN SIGNALLING | Genes involved in Retrograde neurotrophin signalling |
| 0.1 | 6.1 | REACTOME CASPASE MEDIATED CLEAVAGE OF CYTOSKELETAL PROTEINS | Genes involved in Caspase-mediated cleavage of cytoskeletal proteins |
| 0.1 | 2.3 | REACTOME ADENYLATE CYCLASE ACTIVATING PATHWAY | Genes involved in Adenylate cyclase activating pathway |
| 0.1 | 2.8 | REACTOME RECRUITMENT OF NUMA TO MITOTIC CENTROSOMES | Genes involved in Recruitment of NuMA to mitotic centrosomes |
| 0.1 | 0.4 | REACTOME FGFR1 LIGAND BINDING AND ACTIVATION | Genes involved in FGFR1 ligand binding and activation |
| 0.1 | 0.5 | REACTOME PLC BETA MEDIATED EVENTS | Genes involved in PLC beta mediated events |
| 0.1 | 2.4 | REACTOME ACYL CHAIN REMODELLING OF PS | Genes involved in Acyl chain remodelling of PS |
| 0.1 | 5.0 | REACTOME PYRUVATE METABOLISM | Genes involved in Pyruvate metabolism |
| 0.1 | 3.6 | REACTOME FACILITATIVE NA INDEPENDENT GLUCOSE TRANSPORTERS | Genes involved in Facilitative Na+-independent glucose transporters |
| 0.1 | 0.6 | REACTOME SEMA3A PLEXIN REPULSION SIGNALING BY INHIBITING INTEGRIN ADHESION | Genes involved in SEMA3A-Plexin repulsion signaling by inhibiting Integrin adhesion |
| 0.1 | 0.4 | REACTOME REGULATION OF KIT SIGNALING | Genes involved in Regulation of KIT signaling |
| 0.1 | 6.9 | REACTOME ASSOCIATION OF TRIC CCT WITH TARGET PROTEINS DURING BIOSYNTHESIS | Genes involved in Association of TriC/CCT with target proteins during biosynthesis |
| 0.1 | 2.6 | REACTOME P130CAS LINKAGE TO MAPK SIGNALING FOR INTEGRINS | Genes involved in p130Cas linkage to MAPK signaling for integrins |
| 0.1 | 2.8 | REACTOME GLYCOGEN BREAKDOWN GLYCOGENOLYSIS | Genes involved in Glycogen breakdown (glycogenolysis) |
| 0.1 | 1.5 | REACTOME ACYL CHAIN REMODELLING OF PE | Genes involved in Acyl chain remodelling of PE |
| 0.1 | 0.4 | REACTOME UNWINDING OF DNA | Genes involved in Unwinding of DNA |
| 0.1 | 9.6 | REACTOME TRANSPORT OF INORGANIC CATIONS ANIONS AND AMINO ACIDS OLIGOPEPTIDES | Genes involved in Transport of inorganic cations/anions and amino acids/oligopeptides |
| 0.1 | 2.4 | REACTOME PRESYNAPTIC NICOTINIC ACETYLCHOLINE RECEPTORS | Genes involved in Presynaptic nicotinic acetylcholine receptors |
| 0.1 | 0.2 | REACTOME NOREPINEPHRINE NEUROTRANSMITTER RELEASE CYCLE | Genes involved in Norepinephrine Neurotransmitter Release Cycle |
| 0.1 | 2.2 | REACTOME SYNTHESIS OF PIPS AT THE GOLGI MEMBRANE | Genes involved in Synthesis of PIPs at the Golgi membrane |
| 0.1 | 8.6 | REACTOME RECRUITMENT OF MITOTIC CENTROSOME PROTEINS AND COMPLEXES | Genes involved in Recruitment of mitotic centrosome proteins and complexes |
| 0.1 | 3.5 | REACTOME NEPHRIN INTERACTIONS | Genes involved in Nephrin interactions |
| 0.1 | 2.4 | REACTOME ACTIVATION OF THE AP1 FAMILY OF TRANSCRIPTION FACTORS | Genes involved in Activation of the AP-1 family of transcription factors |
| 0.1 | 3.8 | REACTOME SYNTHESIS SECRETION AND INACTIVATION OF GIP | Genes involved in Synthesis, Secretion, and Inactivation of Glucose-dependent Insulinotropic Polypeptide (GIP) |
| 0.1 | 0.3 | REACTOME RORA ACTIVATES CIRCADIAN EXPRESSION | Genes involved in RORA Activates Circadian Expression |
| 0.1 | 0.7 | REACTOME CS DS DEGRADATION | Genes involved in CS/DS degradation |
| 0.1 | 0.3 | REACTOME CDT1 ASSOCIATION WITH THE CDC6 ORC ORIGIN COMPLEX | Genes involved in CDT1 association with the CDC6:ORC:origin complex |
| 0.1 | 0.1 | REACTOME INTERACTIONS OF VPR WITH HOST CELLULAR PROTEINS | Genes involved in Interactions of Vpr with host cellular proteins |
| 0.1 | 0.3 | REACTOME DESTABILIZATION OF MRNA BY AUF1 HNRNP D0 | Genes involved in Destabilization of mRNA by AUF1 (hnRNP D0) |
| 0.1 | 3.0 | REACTOME ENDOSOMAL SORTING COMPLEX REQUIRED FOR TRANSPORT ESCRT | Genes involved in Endosomal Sorting Complex Required For Transport (ESCRT) |
| 0.1 | 2.6 | REACTOME LYSOSOME VESICLE BIOGENESIS | Genes involved in Lysosome Vesicle Biogenesis |
| 0.1 | 1.9 | REACTOME ENDOGENOUS STEROLS | Genes involved in Endogenous sterols |
| 0.1 | 3.3 | REACTOME ACTIVATION OF ATR IN RESPONSE TO REPLICATION STRESS | Genes involved in Activation of ATR in response to replication stress |
| 0.1 | 2.5 | REACTOME STEROID HORMONES | Genes involved in Steroid hormones |
| 0.1 | 3.0 | REACTOME SIGNALING BY HIPPO | Genes involved in Signaling by Hippo |
| 0.1 | 1.6 | REACTOME AMINO ACID SYNTHESIS AND INTERCONVERSION TRANSAMINATION | Genes involved in Amino acid synthesis and interconversion (transamination) |
| 0.1 | 1.8 | REACTOME CHONDROITIN SULFATE BIOSYNTHESIS | Genes involved in Chondroitin sulfate biosynthesis |
| 0.1 | 0.4 | REACTOME SYNTHESIS SECRETION AND INACTIVATION OF GLP1 | Genes involved in Synthesis, Secretion, and Inactivation of Glucagon-like Peptide-1 (GLP-1) |
| 0.1 | 2.1 | REACTOME DEPOSITION OF NEW CENPA CONTAINING NUCLEOSOMES AT THE CENTROMERE | Genes involved in Deposition of New CENPA-containing Nucleosomes at the Centromere |
| 0.1 | 1.5 | REACTOME AMINE DERIVED HORMONES | Genes involved in Amine-derived hormones |
| 0.1 | 1.6 | REACTOME SIGNALING BY CONSTITUTIVELY ACTIVE EGFR | Genes involved in Signaling by constitutively active EGFR |
| 0.1 | 3.1 | REACTOME GLUTATHIONE CONJUGATION | Genes involved in Glutathione conjugation |
| 0.1 | 1.4 | REACTOME TANDEM PORE DOMAIN POTASSIUM CHANNELS | Genes involved in Tandem pore domain potassium channels |
| 0.1 | 6.3 | REACTOME PEPTIDE LIGAND BINDING RECEPTORS | Genes involved in Peptide ligand-binding receptors |
| 0.1 | 2.0 | REACTOME ERK MAPK TARGETS | Genes involved in ERK/MAPK targets |
| 0.1 | 0.9 | REACTOME SYNTHESIS OF SUBSTRATES IN N GLYCAN BIOSYTHESIS | Genes involved in Synthesis of substrates in N-glycan biosythesis |
| 0.1 | 0.5 | REACTOME INTEGRATION OF PROVIRUS | Genes involved in Integration of provirus |
| 0.1 | 2.2 | REACTOME SYNTHESIS OF PC | Genes involved in Synthesis of PC |
| 0.1 | 1.6 | REACTOME SYNTHESIS OF GLYCOSYLPHOSPHATIDYLINOSITOL GPI | Genes involved in Synthesis of glycosylphosphatidylinositol (GPI) |
| 0.1 | 10.0 | REACTOME METABOLISM OF AMINO ACIDS AND DERIVATIVES | Genes involved in Metabolism of amino acids and derivatives |
| 0.1 | 0.3 | REACTOME SHC MEDIATED SIGNALLING | Genes involved in SHC-mediated signalling |
| 0.0 | 0.6 | REACTOME G ALPHA1213 SIGNALLING EVENTS | Genes involved in G alpha (12/13) signalling events |
| 0.0 | 0.4 | REACTOME N GLYCAN ANTENNAE ELONGATION IN THE MEDIAL TRANS GOLGI | Genes involved in N-glycan antennae elongation in the medial/trans-Golgi |
| 0.0 | 1.3 | REACTOME CYTOSOLIC SULFONATION OF SMALL MOLECULES | Genes involved in Cytosolic sulfonation of small molecules |
| 0.0 | 1.6 | REACTOME RNA POL III TRANSCRIPTION TERMINATION | Genes involved in RNA Polymerase III Transcription Termination |
| 0.0 | 0.3 | REACTOME RAP1 SIGNALLING | Genes involved in Rap1 signalling |
| 0.0 | 0.2 | REACTOME APC CDC20 MEDIATED DEGRADATION OF NEK2A | Genes involved in APC-Cdc20 mediated degradation of Nek2A |
| 0.0 | 1.1 | REACTOME SYNTHESIS OF PA | Genes involved in Synthesis of PA |
| 0.0 | 3.1 | REACTOME SCFSKP2 MEDIATED DEGRADATION OF P27 P21 | Genes involved in SCF(Skp2)-mediated degradation of p27/p21 |
| 0.0 | 0.2 | REACTOME INFLUENZA VIRAL RNA TRANSCRIPTION AND REPLICATION | Genes involved in Influenza Viral RNA Transcription and Replication |
| 0.0 | 1.4 | REACTOME AMYLOIDS | Genes involved in Amyloids |
| 0.0 | 0.8 | REACTOME ABORTIVE ELONGATION OF HIV1 TRANSCRIPT IN THE ABSENCE OF TAT | Genes involved in Abortive elongation of HIV-1 transcript in the absence of Tat |
| 0.0 | 0.8 | REACTOME HYALURONAN METABOLISM | Genes involved in Hyaluronan metabolism |
| 0.0 | 0.1 | REACTOME ARMS MEDIATED ACTIVATION | Genes involved in ARMS-mediated activation |
| 0.0 | 0.2 | REACTOME ACTIVATION OF THE PRE REPLICATIVE COMPLEX | Genes involved in Activation of the pre-replicative complex |
| 0.0 | 0.2 | REACTOME AMINE COMPOUND SLC TRANSPORTERS | Genes involved in Amine compound SLC transporters |
| 0.0 | 1.3 | REACTOME L1CAM INTERACTIONS | Genes involved in L1CAM interactions |
| 0.0 | 1.4 | REACTOME POTASSIUM CHANNELS | Genes involved in Potassium Channels |
| 0.0 | 0.2 | REACTOME FORMATION OF THE HIV1 EARLY ELONGATION COMPLEX | Genes involved in Formation of the HIV-1 Early Elongation Complex |
| 0.0 | 0.2 | REACTOME REGULATION OF THE FANCONI ANEMIA PATHWAY | Genes involved in Regulation of the Fanconi anemia pathway |
| 0.0 | 0.3 | REACTOME REVERSIBLE HYDRATION OF CARBON DIOXIDE | Genes involved in Reversible Hydration of Carbon Dioxide |
| 0.0 | 0.1 | REACTOME CONVERSION FROM APC C CDC20 TO APC C CDH1 IN LATE ANAPHASE | Genes involved in Conversion from APC/C:Cdc20 to APC/C:Cdh1 in late anaphase |
| 0.0 | 0.7 | REACTOME SIGNALING BY BMP | Genes involved in Signaling by BMP |
| 0.0 | 0.7 | REACTOME CYTOCHROME P450 ARRANGED BY SUBSTRATE TYPE | Genes involved in Cytochrome P450 - arranged by substrate type |
| 0.0 | 0.4 | REACTOME HOMOLOGOUS RECOMBINATION REPAIR OF REPLICATION INDEPENDENT DOUBLE STRAND BREAKS | Genes involved in Homologous recombination repair of replication-independent double-strand breaks |
| 0.0 | 0.1 | REACTOME AQUAPORIN MEDIATED TRANSPORT | Genes involved in Aquaporin-mediated transport |