Project
avrg: young vs old, Illumina Body Map 2 (GSE30611)
Navigation
Downloads
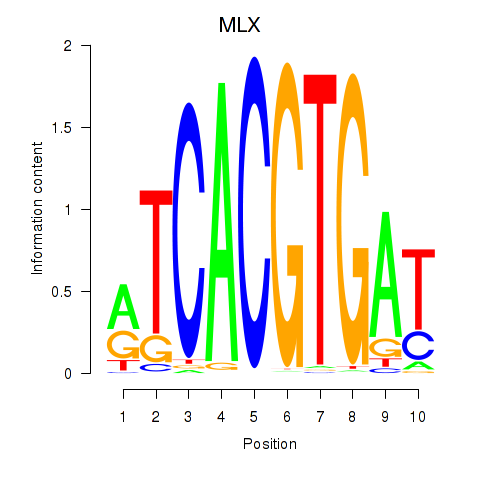
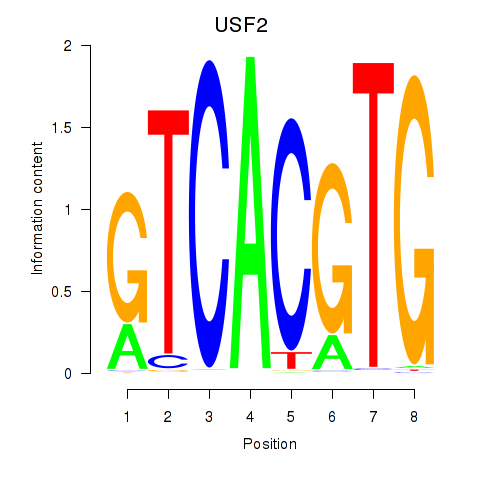
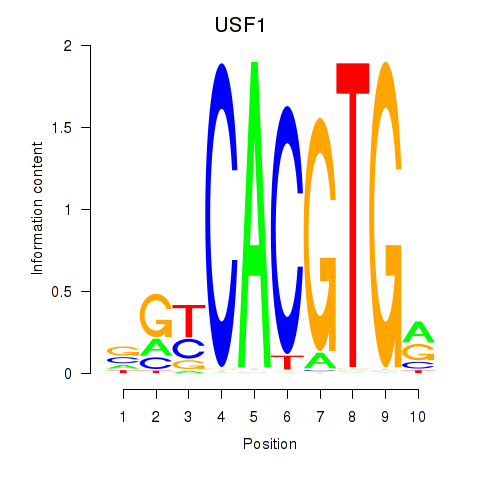
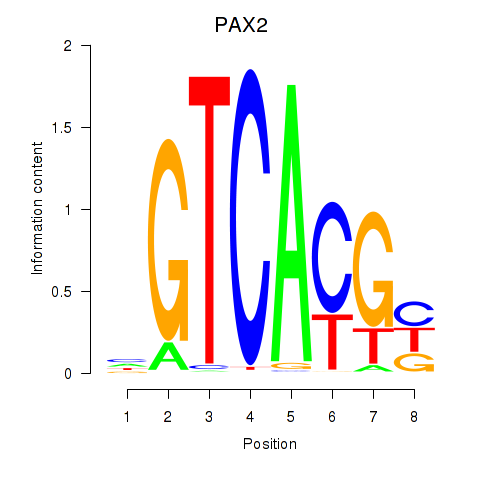
Results for MLX_USF2_USF1_PAX2
Z-value: 2.11
Motif logo
Transcription factors associated with MLX_USF2_USF1_PAX2
| Gene Symbol | Gene ID | Gene Info |
|---|---|---|
|
MLX
|
ENSG00000108788.12 | MLX |
|
USF2
|
ENSG00000105698.16 | USF2 |
|
USF1
|
ENSG00000158773.14 | USF1 |
|
PAX2
|
ENSG00000075891.23 | PAX2 |
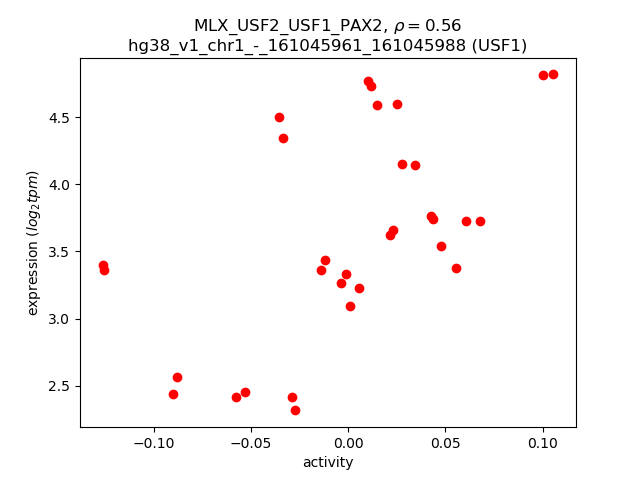
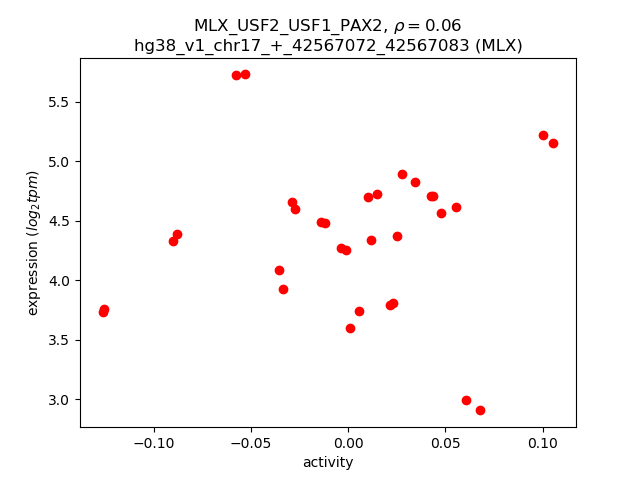
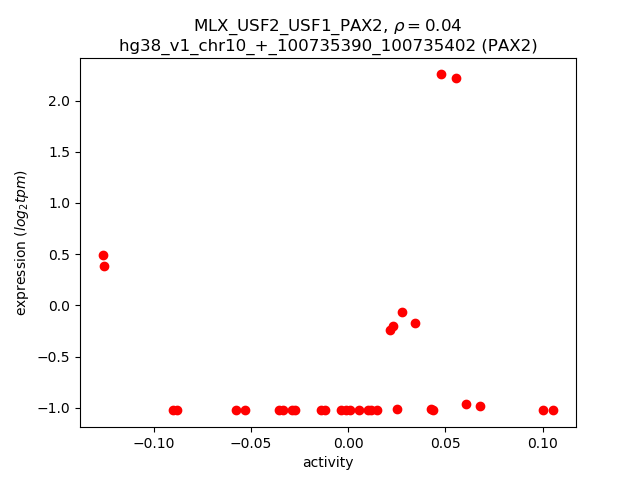
Activity-expression correlation:
| Gene | Promoter | Pearson corr. coef. | P-value | Plot |
|---|---|---|---|---|
| USF1 | hg38_v1_chr1_-_161045961_161045988 | 0.56 | 9.5e-04 | Click! |
| USF2 | hg38_v1_chr19_+_35269065_35269140 | 0.29 | 1.1e-01 | Click! |
| MLX | hg38_v1_chr17_+_42567072_42567083 | 0.06 | 7.6e-01 | Click! |
| PAX2 | hg38_v1_chr10_+_100735390_100735402 | 0.04 | 8.1e-01 | Click! |
Activity profile of MLX_USF2_USF1_PAX2 motif
Sorted Z-values of MLX_USF2_USF1_PAX2 motif
Network of associatons between targets according to the STRING database.

First level regulatory network of MLX_USF2_USF1_PAX2
Gene Ontology Analysis
Gene overrepresentation in biological process category:
| Log-likelihood per target | Total log-likelihood | Term | Description |
|---|---|---|---|
| 2.1 | 6.2 | GO:0097698 | telomere maintenance via base-excision repair(GO:0097698) |
| 1.7 | 12.1 | GO:1902963 | regulation of metalloendopeptidase activity involved in amyloid precursor protein catabolic process(GO:1902962) negative regulation of metalloendopeptidase activity involved in amyloid precursor protein catabolic process(GO:1902963) |
| 1.7 | 5.1 | GO:1902512 | B cell selection(GO:0002339) positive regulation of apoptotic DNA fragmentation(GO:1902512) |
| 1.7 | 5.0 | GO:0002949 | tRNA threonylcarbamoyladenosine modification(GO:0002949) |
| 1.5 | 3.0 | GO:0032227 | negative regulation of synaptic transmission, dopaminergic(GO:0032227) |
| 1.5 | 4.4 | GO:0060730 | regulation of intestinal epithelial structure maintenance(GO:0060730) |
| 1.5 | 5.8 | GO:0022007 | neural plate elongation(GO:0014022) convergent extension involved in neural plate elongation(GO:0022007) |
| 1.3 | 17.5 | GO:1904715 | negative regulation of chaperone-mediated autophagy(GO:1904715) |
| 1.3 | 5.1 | GO:1902544 | regulation of DNA N-glycosylase activity(GO:1902544) |
| 1.2 | 3.6 | GO:0043323 | regulation of natural killer cell degranulation(GO:0043321) positive regulation of natural killer cell degranulation(GO:0043323) |
| 1.1 | 6.6 | GO:1900369 | negative regulation of RNA interference(GO:1900369) |
| 1.0 | 7.2 | GO:0051581 | negative regulation of neurotransmitter uptake(GO:0051581) serotonin uptake(GO:0051610) regulation of serotonin uptake(GO:0051611) negative regulation of serotonin uptake(GO:0051612) |
| 1.0 | 8.1 | GO:0070494 | regulation of thrombin receptor signaling pathway(GO:0070494) negative regulation of thrombin receptor signaling pathway(GO:0070495) |
| 1.0 | 9.9 | GO:1990253 | cellular response to leucine starvation(GO:1990253) |
| 0.9 | 2.8 | GO:1902905 | positive regulation of fibril organization(GO:1902905) |
| 0.8 | 7.5 | GO:0034316 | negative regulation of Arp2/3 complex-mediated actin nucleation(GO:0034316) |
| 0.8 | 2.5 | GO:1903774 | positive regulation of viral budding via host ESCRT complex(GO:1903774) |
| 0.8 | 2.5 | GO:0010932 | macrophage tolerance induction(GO:0010931) regulation of macrophage tolerance induction(GO:0010932) positive regulation of macrophage tolerance induction(GO:0010933) |
| 0.8 | 4.0 | GO:1902568 | positive regulation of eosinophil degranulation(GO:0043311) positive regulation of eosinophil activation(GO:1902568) |
| 0.7 | 8.8 | GO:1900113 | negative regulation of histone H3-K9 trimethylation(GO:1900113) |
| 0.7 | 7.9 | GO:0033299 | secretion of lysosomal enzymes(GO:0033299) |
| 0.7 | 2.1 | GO:0006043 | glucosamine catabolic process(GO:0006043) |
| 0.7 | 2.1 | GO:0070318 | positive regulation of G0 to G1 transition(GO:0070318) |
| 0.7 | 9.5 | GO:0021769 | orbitofrontal cortex development(GO:0021769) |
| 0.7 | 3.4 | GO:2000176 | regulation of pro-T cell differentiation(GO:2000174) positive regulation of pro-T cell differentiation(GO:2000176) |
| 0.7 | 3.3 | GO:2000813 | negative regulation of barbed-end actin filament capping(GO:2000813) |
| 0.7 | 1.3 | GO:0046732 | induction by symbiont of host defense response(GO:0044416) induction of host immune response by virus(GO:0046730) active induction of host immune response by virus(GO:0046732) modulation by symbiont of host defense response(GO:0052031) induction by organism of defense response of other organism involved in symbiotic interaction(GO:0052251) modulation by organism of defense response of other organism involved in symbiotic interaction(GO:0052255) positive regulation by symbiont of host defense response(GO:0052509) positive regulation by organism of defense response of other organism involved in symbiotic interaction(GO:0052510) modulation by organism of immune response of other organism involved in symbiotic interaction(GO:0052552) modulation by symbiont of host immune response(GO:0052553) modulation by virus of host immune response(GO:0075528) |
| 0.6 | 2.6 | GO:0016256 | N-glycan processing to lysosome(GO:0016256) |
| 0.6 | 1.9 | GO:0042144 | vacuole fusion, non-autophagic(GO:0042144) |
| 0.6 | 1.9 | GO:0002316 | follicular B cell differentiation(GO:0002316) |
| 0.6 | 4.4 | GO:0051511 | regulation of unidimensional cell growth(GO:0051510) negative regulation of unidimensional cell growth(GO:0051511) establishment of cell polarity regulating cell shape(GO:0071964) regulation of establishment or maintenance of cell polarity regulating cell shape(GO:2000769) positive regulation of establishment or maintenance of cell polarity regulating cell shape(GO:2000771) regulation of establishment of cell polarity regulating cell shape(GO:2000782) positive regulation of establishment of cell polarity regulating cell shape(GO:2000784) positive regulation of barbed-end actin filament capping(GO:2000814) |
| 0.6 | 1.9 | GO:0034769 | basement membrane disassembly(GO:0034769) |
| 0.6 | 1.9 | GO:1903033 | regulation of microtubule plus-end binding(GO:1903031) positive regulation of microtubule plus-end binding(GO:1903033) |
| 0.6 | 3.0 | GO:0050902 | leukocyte adhesive activation(GO:0050902) |
| 0.6 | 3.6 | GO:0070829 | response to vitamin B2(GO:0033274) heterochromatin maintenance(GO:0070829) |
| 0.6 | 2.9 | GO:1901254 | modulation by host of viral RNA genome replication(GO:0044830) positive regulation of intracellular transport of viral material(GO:1901254) |
| 0.6 | 2.9 | GO:0060335 | positive regulation of response to interferon-gamma(GO:0060332) positive regulation of interferon-gamma-mediated signaling pathway(GO:0060335) |
| 0.6 | 1.7 | GO:0035752 | lysosomal lumen pH elevation(GO:0035752) |
| 0.5 | 1.6 | GO:1903697 | negative regulation of microvillus assembly(GO:1903697) |
| 0.5 | 1.6 | GO:0060003 | copper ion export(GO:0060003) |
| 0.5 | 1.0 | GO:0002368 | B cell cytokine production(GO:0002368) |
| 0.5 | 8.1 | GO:0035751 | regulation of lysosomal lumen pH(GO:0035751) |
| 0.5 | 20.6 | GO:0015991 | ATP hydrolysis coupled proton transport(GO:0015991) |
| 0.5 | 3.0 | GO:0061762 | CAMKK-AMPK signaling cascade(GO:0061762) |
| 0.5 | 2.0 | GO:1902683 | regulation of receptor localization to synapse(GO:1902683) |
| 0.5 | 2.0 | GO:0040040 | thermosensory behavior(GO:0040040) |
| 0.5 | 0.5 | GO:0001732 | formation of cytoplasmic translation initiation complex(GO:0001732) |
| 0.5 | 2.4 | GO:0051140 | regulation of NK T cell proliferation(GO:0051140) positive regulation of NK T cell proliferation(GO:0051142) |
| 0.5 | 4.8 | GO:1904637 | response to ionomycin(GO:1904636) cellular response to ionomycin(GO:1904637) |
| 0.5 | 1.4 | GO:2000619 | negative regulation of histone H4-K16 acetylation(GO:2000619) |
| 0.5 | 3.3 | GO:0032439 | endosome localization(GO:0032439) |
| 0.5 | 1.4 | GO:1990519 | pyrimidine nucleotide transport(GO:0006864) mitochondrial pyrimidine nucleotide import(GO:1990519) |
| 0.4 | 2.7 | GO:2000173 | regulation of neuron remodeling(GO:1904799) negative regulation of neuron remodeling(GO:1904800) negative regulation of branching morphogenesis of a nerve(GO:2000173) |
| 0.4 | 4.3 | GO:0016139 | glycoside catabolic process(GO:0016139) |
| 0.4 | 4.3 | GO:0045716 | positive regulation of low-density lipoprotein particle receptor biosynthetic process(GO:0045716) |
| 0.4 | 3.8 | GO:0019262 | N-acetylneuraminate catabolic process(GO:0019262) |
| 0.4 | 5.0 | GO:0090204 | protein localization to nuclear pore(GO:0090204) |
| 0.4 | 2.0 | GO:1901857 | positive regulation of cellular respiration(GO:1901857) |
| 0.4 | 1.6 | GO:0051413 | response to cortisone(GO:0051413) |
| 0.4 | 1.5 | GO:0090149 | mitochondrial membrane fission(GO:0090149) |
| 0.4 | 2.6 | GO:0033133 | positive regulation of glucokinase activity(GO:0033133) |
| 0.4 | 3.0 | GO:1900126 | negative regulation of hyaluronan biosynthetic process(GO:1900126) |
| 0.4 | 1.5 | GO:1903751 | regulation of intrinsic apoptotic signaling pathway in response to hydrogen peroxide(GO:1903750) negative regulation of intrinsic apoptotic signaling pathway in response to hydrogen peroxide(GO:1903751) |
| 0.4 | 4.5 | GO:1904885 | beta-catenin destruction complex assembly(GO:1904885) |
| 0.4 | 1.8 | GO:1905000 | regulation of membrane repolarization during atrial cardiac muscle cell action potential(GO:1905000) |
| 0.4 | 1.8 | GO:0046878 | positive regulation of saliva secretion(GO:0046878) |
| 0.4 | 1.1 | GO:0033364 | mast cell secretory granule organization(GO:0033364) |
| 0.4 | 1.8 | GO:0046671 | negative regulation of cellular pH reduction(GO:0032848) CD8-positive, alpha-beta T cell lineage commitment(GO:0043375) negative regulation of retinal cell programmed cell death(GO:0046671) |
| 0.4 | 2.1 | GO:0030037 | actin filament reorganization involved in cell cycle(GO:0030037) |
| 0.4 | 1.4 | GO:0046833 | positive regulation of RNA export from nucleus(GO:0046833) |
| 0.3 | 1.0 | GO:2000657 | regulation of apolipoprotein binding(GO:2000656) negative regulation of apolipoprotein binding(GO:2000657) |
| 0.3 | 4.1 | GO:0016554 | cytidine to uridine editing(GO:0016554) |
| 0.3 | 3.0 | GO:0071386 | cellular response to corticosterone stimulus(GO:0071386) |
| 0.3 | 1.3 | GO:0000738 | DNA catabolic process, exonucleolytic(GO:0000738) |
| 0.3 | 1.7 | GO:1902903 | regulation of fibril organization(GO:1902903) |
| 0.3 | 1.0 | GO:0044205 | 'de novo' UMP biosynthetic process(GO:0044205) |
| 0.3 | 1.0 | GO:0032707 | negative regulation of interleukin-23 production(GO:0032707) |
| 0.3 | 4.6 | GO:1900625 | regulation of monocyte aggregation(GO:1900623) positive regulation of monocyte aggregation(GO:1900625) |
| 0.3 | 1.9 | GO:1904383 | response to sodium phosphate(GO:1904383) |
| 0.3 | 2.9 | GO:0015760 | hexose phosphate transport(GO:0015712) glucose-6-phosphate transport(GO:0015760) |
| 0.3 | 0.9 | GO:0036451 | cap mRNA methylation(GO:0036451) |
| 0.3 | 0.9 | GO:0002752 | cell surface pattern recognition receptor signaling pathway(GO:0002752) |
| 0.3 | 3.9 | GO:0006824 | cobalt ion transport(GO:0006824) |
| 0.3 | 5.1 | GO:0060155 | platelet dense granule organization(GO:0060155) |
| 0.3 | 1.8 | GO:0019509 | L-methionine biosynthetic process from methylthioadenosine(GO:0019509) |
| 0.3 | 0.9 | GO:0051066 | dihydrobiopterin metabolic process(GO:0051066) |
| 0.3 | 0.9 | GO:0070902 | mitochondrial tRNA pseudouridine synthesis(GO:0070902) |
| 0.3 | 3.9 | GO:0035524 | proline transmembrane transport(GO:0035524) |
| 0.3 | 0.6 | GO:2000182 | regulation of progesterone biosynthetic process(GO:2000182) |
| 0.3 | 3.6 | GO:0090306 | spindle assembly involved in meiosis(GO:0090306) |
| 0.3 | 2.2 | GO:0051533 | positive regulation of NFAT protein import into nucleus(GO:0051533) |
| 0.3 | 1.1 | GO:0061763 | multivesicular body-lysosome fusion(GO:0061763) |
| 0.3 | 1.4 | GO:1902559 | 3'-phosphoadenosine 5'-phosphosulfate transport(GO:0046963) 3'-phospho-5'-adenylyl sulfate transmembrane transport(GO:1902559) |
| 0.3 | 1.4 | GO:0051088 | PMA-inducible membrane protein ectodomain proteolysis(GO:0051088) |
| 0.3 | 0.8 | GO:0006059 | hexitol metabolic process(GO:0006059) |
| 0.3 | 1.9 | GO:0008626 | granzyme-mediated apoptotic signaling pathway(GO:0008626) |
| 0.3 | 1.9 | GO:1902952 | positive regulation of dendritic spine maintenance(GO:1902952) regulation of transcription from RNA polymerase II promoter by histone modification(GO:1903756) negative regulation of transcription from RNA polymerase II promoter by histone modification(GO:1903758) |
| 0.3 | 1.8 | GO:1903435 | positive regulation of constitutive secretory pathway(GO:1903435) |
| 0.3 | 3.9 | GO:0097116 | gephyrin clustering involved in postsynaptic density assembly(GO:0097116) |
| 0.3 | 1.3 | GO:0034395 | heme oxidation(GO:0006788) regulation of transcription from RNA polymerase II promoter in response to iron(GO:0034395) |
| 0.3 | 2.3 | GO:1901098 | positive regulation of autophagosome maturation(GO:1901098) |
| 0.3 | 3.8 | GO:2000271 | positive regulation of fibroblast apoptotic process(GO:2000271) |
| 0.3 | 4.1 | GO:0042340 | keratan sulfate catabolic process(GO:0042340) |
| 0.3 | 1.8 | GO:0061152 | trachea submucosa development(GO:0061152) trachea gland development(GO:0061153) |
| 0.2 | 1.5 | GO:0038161 | prolactin signaling pathway(GO:0038161) |
| 0.2 | 2.5 | GO:2000286 | receptor internalization involved in canonical Wnt signaling pathway(GO:2000286) |
| 0.2 | 0.7 | GO:1901069 | guanosine-containing compound catabolic process(GO:1901069) |
| 0.2 | 1.0 | GO:0000961 | negative regulation of mitochondrial RNA catabolic process(GO:0000961) |
| 0.2 | 0.7 | GO:0007174 | epidermal growth factor catabolic process(GO:0007174) |
| 0.2 | 0.7 | GO:0016340 | calcium-dependent cell-matrix adhesion(GO:0016340) |
| 0.2 | 6.2 | GO:0003376 | sphingosine-1-phosphate signaling pathway(GO:0003376) |
| 0.2 | 1.0 | GO:0002636 | positive regulation of germinal center formation(GO:0002636) |
| 0.2 | 5.0 | GO:0010510 | regulation of acetyl-CoA biosynthetic process from pyruvate(GO:0010510) regulation of acyl-CoA biosynthetic process(GO:0050812) |
| 0.2 | 1.4 | GO:0060800 | regulation of cell differentiation involved in embryonic placenta development(GO:0060800) |
| 0.2 | 2.6 | GO:1904327 | protein localization to cytosolic proteasome complex(GO:1904327) protein localization to cytosolic proteasome complex involved in ERAD pathway(GO:1904379) |
| 0.2 | 1.2 | GO:1903232 | melanosome assembly(GO:1903232) |
| 0.2 | 4.7 | GO:0033148 | positive regulation of intracellular estrogen receptor signaling pathway(GO:0033148) |
| 0.2 | 0.9 | GO:0021882 | regulation of transcription from RNA polymerase II promoter involved in forebrain neuron fate commitment(GO:0021882) cerebral cortex GABAergic interneuron fate commitment(GO:0021893) commitment of multipotent stem cells to neuronal lineage in forebrain(GO:0021898) positive regulation of neural retina development(GO:0061075) positive regulation of retina development in camera-type eye(GO:1902868) positive regulation of amacrine cell differentiation(GO:1902871) |
| 0.2 | 0.9 | GO:0035434 | copper ion transmembrane transport(GO:0035434) |
| 0.2 | 3.2 | GO:0034626 | fatty acid elongation, saturated fatty acid(GO:0019367) fatty acid elongation, unsaturated fatty acid(GO:0019368) fatty acid elongation, monounsaturated fatty acid(GO:0034625) fatty acid elongation, polyunsaturated fatty acid(GO:0034626) |
| 0.2 | 0.2 | GO:0021847 | ventricular zone neuroblast division(GO:0021847) |
| 0.2 | 0.7 | GO:1901388 | regulation of transforming growth factor beta activation(GO:1901388) negative regulation of transforming growth factor beta activation(GO:1901389) |
| 0.2 | 2.2 | GO:0097338 | response to clozapine(GO:0097338) |
| 0.2 | 0.9 | GO:0061357 | positive regulation of Wnt protein secretion(GO:0061357) |
| 0.2 | 3.5 | GO:1903753 | negative regulation of p38MAPK cascade(GO:1903753) |
| 0.2 | 0.9 | GO:1990168 | protein K33-linked deubiquitination(GO:1990168) |
| 0.2 | 8.1 | GO:0006884 | cell volume homeostasis(GO:0006884) |
| 0.2 | 2.1 | GO:0032264 | IMP salvage(GO:0032264) |
| 0.2 | 2.1 | GO:0019064 | fusion of virus membrane with host plasma membrane(GO:0019064) membrane fusion involved in viral entry into host cell(GO:0039663) multi-organism membrane fusion(GO:0044800) |
| 0.2 | 0.2 | GO:1903094 | regulation of protein K48-linked deubiquitination(GO:1903093) negative regulation of protein K48-linked deubiquitination(GO:1903094) negative regulation of ubiquitin-specific protease activity(GO:2000157) |
| 0.2 | 1.0 | GO:1900738 | positive regulation of phospholipase C-activating G-protein coupled receptor signaling pathway(GO:1900738) |
| 0.2 | 3.8 | GO:1903441 | protein localization to ciliary membrane(GO:1903441) |
| 0.2 | 2.4 | GO:1902902 | negative regulation of autophagosome assembly(GO:1902902) |
| 0.2 | 0.6 | GO:0000349 | generation of catalytic spliceosome for first transesterification step(GO:0000349) |
| 0.2 | 0.4 | GO:0032915 | positive regulation of transforming growth factor beta2 production(GO:0032915) |
| 0.2 | 0.4 | GO:0071816 | tail-anchored membrane protein insertion into ER membrane(GO:0071816) |
| 0.2 | 1.3 | GO:0045629 | negative regulation of T-helper 2 cell differentiation(GO:0045629) |
| 0.2 | 1.0 | GO:0050428 | purine ribonucleoside bisphosphate biosynthetic process(GO:0034036) 3'-phosphoadenosine 5'-phosphosulfate biosynthetic process(GO:0050428) |
| 0.2 | 5.9 | GO:0002115 | store-operated calcium entry(GO:0002115) |
| 0.2 | 0.6 | GO:0002904 | positive regulation of B cell apoptotic process(GO:0002904) |
| 0.2 | 0.9 | GO:0045347 | negative regulation of MHC class II biosynthetic process(GO:0045347) |
| 0.2 | 1.9 | GO:0034058 | endosomal vesicle fusion(GO:0034058) |
| 0.2 | 5.6 | GO:0002726 | positive regulation of T cell cytokine production(GO:0002726) |
| 0.2 | 0.9 | GO:0048254 | snoRNA localization(GO:0048254) |
| 0.2 | 1.2 | GO:0031627 | telomeric loop formation(GO:0031627) |
| 0.2 | 1.2 | GO:0099558 | maintenance of synapse structure(GO:0099558) |
| 0.2 | 0.5 | GO:0032053 | ciliary basal body organization(GO:0032053) |
| 0.2 | 2.8 | GO:0090168 | Golgi reassembly(GO:0090168) |
| 0.2 | 3.1 | GO:0044341 | sodium-dependent phosphate transport(GO:0044341) |
| 0.2 | 0.7 | GO:0003430 | growth plate cartilage chondrocyte growth(GO:0003430) |
| 0.2 | 0.5 | GO:0070487 | monocyte aggregation(GO:0070487) |
| 0.2 | 2.9 | GO:0043983 | histone H4-K12 acetylation(GO:0043983) |
| 0.2 | 0.2 | GO:0060266 | negative regulation of respiratory burst involved in inflammatory response(GO:0060266) |
| 0.2 | 0.2 | GO:0099553 | trans-synaptic signaling by lipid, modulating synaptic transmission(GO:0099552) trans-synaptic signaling by endocannabinoid, modulating synaptic transmission(GO:0099553) |
| 0.2 | 0.3 | GO:1990166 | protein localization to site of double-strand break(GO:1990166) |
| 0.2 | 0.7 | GO:0002384 | hepatic immune response(GO:0002384) |
| 0.2 | 0.8 | GO:2000312 | regulation of kainate selective glutamate receptor activity(GO:2000312) |
| 0.2 | 1.8 | GO:0021859 | pyramidal neuron differentiation(GO:0021859) |
| 0.2 | 1.4 | GO:0070164 | negative regulation of adiponectin secretion(GO:0070164) |
| 0.2 | 1.1 | GO:0038195 | urokinase plasminogen activator signaling pathway(GO:0038195) |
| 0.2 | 1.6 | GO:0070995 | NADPH oxidation(GO:0070995) |
| 0.2 | 0.5 | GO:0071962 | mitotic sister chromatid cohesion, centromeric(GO:0071962) |
| 0.2 | 4.5 | GO:0033866 | coenzyme A biosynthetic process(GO:0015937) nucleoside bisphosphate biosynthetic process(GO:0033866) ribonucleoside bisphosphate biosynthetic process(GO:0034030) purine nucleoside bisphosphate biosynthetic process(GO:0034033) |
| 0.2 | 1.8 | GO:0048570 | notochord morphogenesis(GO:0048570) |
| 0.2 | 1.8 | GO:2000049 | positive regulation of cell-cell adhesion mediated by cadherin(GO:2000049) |
| 0.1 | 0.6 | GO:0033634 | positive regulation of cell-cell adhesion mediated by integrin(GO:0033634) |
| 0.1 | 1.3 | GO:0000395 | mRNA 5'-splice site recognition(GO:0000395) |
| 0.1 | 0.4 | GO:0051877 | pigment granule aggregation in cell center(GO:0051877) |
| 0.1 | 3.2 | GO:0036010 | protein localization to endosome(GO:0036010) |
| 0.1 | 2.3 | GO:1902746 | regulation of lens fiber cell differentiation(GO:1902746) |
| 0.1 | 0.9 | GO:0007386 | compartment pattern specification(GO:0007386) |
| 0.1 | 4.9 | GO:0000185 | activation of MAPKKK activity(GO:0000185) |
| 0.1 | 0.3 | GO:1901526 | positive regulation of macromitophagy(GO:1901526) positive regulation of mitophagy in response to mitochondrial depolarization(GO:1904925) |
| 0.1 | 1.7 | GO:2000074 | regulation of type B pancreatic cell development(GO:2000074) |
| 0.1 | 0.7 | GO:0000415 | negative regulation of histone H3-K36 methylation(GO:0000415) |
| 0.1 | 1.2 | GO:0007197 | adenylate cyclase-inhibiting G-protein coupled acetylcholine receptor signaling pathway(GO:0007197) |
| 0.1 | 1.1 | GO:0071651 | positive regulation of chemokine (C-C motif) ligand 5 production(GO:0071651) |
| 0.1 | 0.4 | GO:0002101 | tRNA wobble cytosine modification(GO:0002101) |
| 0.1 | 5.0 | GO:0043011 | myeloid dendritic cell differentiation(GO:0043011) |
| 0.1 | 0.3 | GO:0090310 | negative regulation of methylation-dependent chromatin silencing(GO:0090310) |
| 0.1 | 0.7 | GO:0090170 | regulation of Golgi inheritance(GO:0090170) |
| 0.1 | 1.1 | GO:0030885 | regulation of myeloid dendritic cell activation(GO:0030885) |
| 0.1 | 2.6 | GO:2000615 | regulation of histone H3-K9 acetylation(GO:2000615) |
| 0.1 | 2.5 | GO:0043374 | CD8-positive, alpha-beta T cell differentiation(GO:0043374) |
| 0.1 | 0.7 | GO:0060399 | positive regulation of growth hormone receptor signaling pathway(GO:0060399) |
| 0.1 | 1.8 | GO:1901838 | positive regulation of transcription of nuclear large rRNA transcript from RNA polymerase I promoter(GO:1901838) |
| 0.1 | 0.4 | GO:0100057 | regulation of phenotypic switching by transcription from RNA polymerase II promoter(GO:0100057) regulation of hydrogen sulfide biosynthetic process(GO:1904826) positive regulation of hydrogen sulfide biosynthetic process(GO:1904828) |
| 0.1 | 0.5 | GO:0009405 | pathogenesis(GO:0009405) |
| 0.1 | 0.4 | GO:0007206 | phospholipase C-activating G-protein coupled glutamate receptor signaling pathway(GO:0007206) |
| 0.1 | 1.2 | GO:0032929 | negative regulation of superoxide anion generation(GO:0032929) |
| 0.1 | 1.0 | GO:1902416 | positive regulation of mRNA binding(GO:1902416) |
| 0.1 | 0.8 | GO:0035407 | histone H3-T11 phosphorylation(GO:0035407) |
| 0.1 | 0.4 | GO:0006683 | galactosylceramide catabolic process(GO:0006683) |
| 0.1 | 0.6 | GO:0034184 | positive regulation of maintenance of sister chromatid cohesion(GO:0034093) positive regulation of maintenance of mitotic sister chromatid cohesion(GO:0034184) |
| 0.1 | 0.5 | GO:0043335 | protein unfolding(GO:0043335) |
| 0.1 | 2.6 | GO:0014029 | neural crest formation(GO:0014029) |
| 0.1 | 0.5 | GO:0033693 | neurofilament bundle assembly(GO:0033693) |
| 0.1 | 3.7 | GO:0006491 | N-glycan processing(GO:0006491) |
| 0.1 | 0.7 | GO:0006740 | NADPH regeneration(GO:0006740) |
| 0.1 | 0.5 | GO:0006556 | S-adenosylmethionine biosynthetic process(GO:0006556) |
| 0.1 | 0.4 | GO:0034164 | negative regulation of toll-like receptor 9 signaling pathway(GO:0034164) |
| 0.1 | 1.2 | GO:0032914 | positive regulation of transforming growth factor beta1 production(GO:0032914) |
| 0.1 | 0.6 | GO:0039516 | modulation by virus of host molecular function(GO:0039506) suppression by virus of host molecular function(GO:0039507) suppression by virus of host catalytic activity(GO:0039513) modulation by virus of host catalytic activity(GO:0039516) suppression by virus of host cysteine-type endopeptidase activity involved in apoptotic process(GO:0039650) negative regulation by symbiont of host catalytic activity(GO:0052053) negative regulation by symbiont of host molecular function(GO:0052056) modulation by symbiont of host catalytic activity(GO:0052148) |
| 0.1 | 0.1 | GO:0060648 | mammary gland bud morphogenesis(GO:0060648) |
| 0.1 | 0.8 | GO:0090038 | negative regulation of protein kinase C signaling(GO:0090038) |
| 0.1 | 0.5 | GO:0060734 | regulation of endoplasmic reticulum stress-induced eIF2 alpha phosphorylation(GO:0060734) |
| 0.1 | 1.5 | GO:0043981 | histone H4-K5 acetylation(GO:0043981) histone H4-K8 acetylation(GO:0043982) |
| 0.1 | 0.2 | GO:0032241 | positive regulation of nucleobase-containing compound transport(GO:0032241) |
| 0.1 | 2.2 | GO:0006610 | ribosomal protein import into nucleus(GO:0006610) |
| 0.1 | 0.5 | GO:0021502 | neural fold elevation formation(GO:0021502) |
| 0.1 | 2.9 | GO:0090382 | phagosome maturation(GO:0090382) |
| 0.1 | 0.5 | GO:1903626 | positive regulation of DNA catabolic process(GO:1903626) |
| 0.1 | 0.5 | GO:0009436 | glyoxylate catabolic process(GO:0009436) |
| 0.1 | 0.3 | GO:2000301 | negative regulation of synaptic vesicle exocytosis(GO:2000301) |
| 0.1 | 1.0 | GO:2000320 | negative regulation of T-helper 17 type immune response(GO:2000317) negative regulation of T-helper 17 cell differentiation(GO:2000320) |
| 0.1 | 1.8 | GO:0044351 | macropinocytosis(GO:0044351) |
| 0.1 | 1.4 | GO:1902412 | regulation of mitotic cytokinesis(GO:1902412) |
| 0.1 | 2.9 | GO:0006068 | ethanol catabolic process(GO:0006068) |
| 0.1 | 0.8 | GO:2000676 | positive regulation of type B pancreatic cell apoptotic process(GO:2000676) |
| 0.1 | 1.4 | GO:0001731 | formation of translation preinitiation complex(GO:0001731) |
| 0.1 | 0.2 | GO:1903336 | negative regulation of vacuolar transport(GO:1903336) negative regulation of early endosome to late endosome transport(GO:2000642) |
| 0.1 | 6.9 | GO:0030490 | maturation of SSU-rRNA(GO:0030490) |
| 0.1 | 1.3 | GO:0000244 | spliceosomal tri-snRNP complex assembly(GO:0000244) |
| 0.1 | 1.7 | GO:0032876 | negative regulation of DNA endoreduplication(GO:0032876) |
| 0.1 | 0.9 | GO:0044375 | regulation of peroxisome size(GO:0044375) |
| 0.1 | 0.3 | GO:0015917 | aminophospholipid transport(GO:0015917) |
| 0.1 | 0.6 | GO:0060478 | acrosomal vesicle exocytosis(GO:0060478) |
| 0.1 | 2.5 | GO:0006677 | glycosylceramide metabolic process(GO:0006677) |
| 0.1 | 0.4 | GO:1903935 | response to sodium arsenite(GO:1903935) cellular response to sodium arsenite(GO:1903936) |
| 0.1 | 1.1 | GO:0098881 | exocytic insertion of neurotransmitter receptor to plasma membrane(GO:0098881) exocytic insertion of neurotransmitter receptor to postsynaptic membrane(GO:0098967) |
| 0.1 | 0.5 | GO:0051892 | negative regulation of cardioblast differentiation(GO:0051892) regulation of cardiac muscle cell myoblast differentiation(GO:2000690) negative regulation of cardiac muscle cell myoblast differentiation(GO:2000691) |
| 0.1 | 4.1 | GO:1901985 | positive regulation of protein acetylation(GO:1901985) |
| 0.1 | 0.9 | GO:0090160 | Golgi to lysosome transport(GO:0090160) |
| 0.1 | 0.5 | GO:1903593 | regulation of histamine secretion by mast cell(GO:1903593) |
| 0.1 | 0.3 | GO:2001170 | negative regulation of energy homeostasis(GO:2000506) negative regulation of ATP biosynthetic process(GO:2001170) |
| 0.1 | 0.3 | GO:0019878 | lysine biosynthetic process(GO:0009085) lysine biosynthetic process via aminoadipic acid(GO:0019878) |
| 0.1 | 1.6 | GO:2000628 | regulation of miRNA metabolic process(GO:2000628) |
| 0.1 | 1.2 | GO:0033572 | transferrin transport(GO:0033572) |
| 0.1 | 0.1 | GO:0033484 | nitric oxide homeostasis(GO:0033484) |
| 0.1 | 0.3 | GO:0071344 | diphosphate metabolic process(GO:0071344) |
| 0.1 | 1.8 | GO:0034498 | early endosome to Golgi transport(GO:0034498) |
| 0.1 | 0.4 | GO:0061083 | regulation of protein refolding(GO:0061083) negative regulation of protein refolding(GO:0061084) |
| 0.1 | 10.3 | GO:0042147 | retrograde transport, endosome to Golgi(GO:0042147) |
| 0.1 | 1.2 | GO:1902570 | protein localization to nucleolus(GO:1902570) |
| 0.1 | 1.4 | GO:0009125 | nucleoside monophosphate catabolic process(GO:0009125) |
| 0.1 | 0.6 | GO:0016078 | tRNA catabolic process(GO:0016078) |
| 0.1 | 0.9 | GO:0055129 | L-proline biosynthetic process(GO:0055129) |
| 0.1 | 0.1 | GO:0045658 | regulation of neutrophil differentiation(GO:0045658) negative regulation of neutrophil differentiation(GO:0045659) |
| 0.1 | 0.7 | GO:0010825 | positive regulation of centrosome duplication(GO:0010825) |
| 0.1 | 3.2 | GO:0009303 | rRNA transcription(GO:0009303) |
| 0.1 | 0.4 | GO:0060023 | soft palate development(GO:0060023) |
| 0.1 | 0.5 | GO:1903575 | cornified envelope assembly(GO:1903575) |
| 0.1 | 0.8 | GO:0034128 | negative regulation of MyD88-independent toll-like receptor signaling pathway(GO:0034128) |
| 0.1 | 4.2 | GO:0032012 | regulation of ARF protein signal transduction(GO:0032012) |
| 0.1 | 1.3 | GO:2000622 | regulation of nuclear-transcribed mRNA catabolic process, nonsense-mediated decay(GO:2000622) negative regulation of nuclear-transcribed mRNA catabolic process, nonsense-mediated decay(GO:2000623) |
| 0.1 | 1.9 | GO:0006474 | N-terminal protein amino acid acetylation(GO:0006474) |
| 0.1 | 1.8 | GO:0050765 | negative regulation of phagocytosis(GO:0050765) |
| 0.1 | 0.2 | GO:0044803 | multi-organism membrane organization(GO:0044803) |
| 0.1 | 0.7 | GO:0035694 | mitochondrial protein catabolic process(GO:0035694) |
| 0.1 | 0.6 | GO:0032100 | positive regulation of response to food(GO:0032097) positive regulation of appetite(GO:0032100) |
| 0.1 | 0.3 | GO:2001204 | regulation of osteoclast development(GO:2001204) |
| 0.1 | 2.0 | GO:0021796 | cerebral cortex regionalization(GO:0021796) |
| 0.1 | 0.3 | GO:0045113 | regulation of integrin biosynthetic process(GO:0045113) |
| 0.1 | 1.9 | GO:0032836 | glomerular basement membrane development(GO:0032836) |
| 0.1 | 0.2 | GO:0090611 | ubiquitin-independent protein catabolic process via the multivesicular body sorting pathway(GO:0090611) |
| 0.1 | 1.1 | GO:0036444 | calcium ion transmembrane import into mitochondrion(GO:0036444) |
| 0.1 | 0.5 | GO:0099590 | neurotransmitter receptor internalization(GO:0099590) |
| 0.1 | 1.7 | GO:0033617 | mitochondrial respiratory chain complex IV assembly(GO:0033617) mitochondrial respiratory chain complex IV biogenesis(GO:0097034) |
| 0.1 | 0.3 | GO:0002416 | IgG immunoglobulin transcytosis in epithelial cells mediated by FcRn immunoglobulin receptor(GO:0002416) |
| 0.1 | 0.7 | GO:0000066 | mitochondrial ornithine transport(GO:0000066) |
| 0.1 | 0.1 | GO:0046668 | regulation of retinal cell programmed cell death(GO:0046668) |
| 0.1 | 2.6 | GO:0032460 | negative regulation of protein oligomerization(GO:0032460) |
| 0.1 | 0.6 | GO:0042670 | retinal cone cell differentiation(GO:0042670) retinal cone cell development(GO:0046549) |
| 0.1 | 1.4 | GO:0060742 | epithelial cell differentiation involved in prostate gland development(GO:0060742) |
| 0.1 | 0.5 | GO:0072752 | cellular response to rapamycin(GO:0072752) |
| 0.1 | 1.4 | GO:0005981 | regulation of glycogen catabolic process(GO:0005981) |
| 0.1 | 1.5 | GO:0090073 | positive regulation of protein homodimerization activity(GO:0090073) |
| 0.1 | 1.0 | GO:2000786 | positive regulation of autophagosome assembly(GO:2000786) |
| 0.1 | 0.2 | GO:1901979 | regulation of inward rectifier potassium channel activity(GO:1901979) |
| 0.1 | 0.3 | GO:0006014 | D-ribose metabolic process(GO:0006014) |
| 0.1 | 0.3 | GO:1904017 | cellular response to Thyroglobulin triiodothyronine(GO:1904017) |
| 0.1 | 3.8 | GO:0043252 | sodium-independent organic anion transport(GO:0043252) |
| 0.1 | 0.3 | GO:0098971 | anterograde dendritic transport of neurotransmitter receptor complex(GO:0098971) |
| 0.1 | 1.4 | GO:0001833 | inner cell mass cell proliferation(GO:0001833) |
| 0.1 | 0.2 | GO:0021658 | rhombomere morphogenesis(GO:0021593) rhombomere 3 morphogenesis(GO:0021658) |
| 0.1 | 1.4 | GO:0002566 | somatic diversification of immune receptors via somatic mutation(GO:0002566) somatic hypermutation of immunoglobulin genes(GO:0016446) |
| 0.1 | 0.4 | GO:1903070 | negative regulation of ER-associated ubiquitin-dependent protein catabolic process(GO:1903070) |
| 0.1 | 1.0 | GO:0090662 | ATP hydrolysis coupled transmembrane transport(GO:0090662) |
| 0.1 | 0.4 | GO:0045007 | depurination(GO:0045007) |
| 0.1 | 2.4 | GO:0001504 | neurotransmitter uptake(GO:0001504) |
| 0.1 | 0.5 | GO:0040030 | regulation of molecular function, epigenetic(GO:0040030) |
| 0.1 | 0.6 | GO:0021940 | positive regulation of cerebellar granule cell precursor proliferation(GO:0021940) |
| 0.1 | 0.3 | GO:0036369 | transcription factor catabolic process(GO:0036369) |
| 0.1 | 2.6 | GO:0030488 | tRNA methylation(GO:0030488) |
| 0.1 | 0.4 | GO:0060052 | neurofilament cytoskeleton organization(GO:0060052) |
| 0.1 | 0.2 | GO:0075522 | IRES-dependent viral translational initiation(GO:0075522) |
| 0.1 | 0.1 | GO:2001268 | negative regulation of cysteine-type endopeptidase activity involved in apoptotic signaling pathway(GO:2001268) |
| 0.1 | 0.7 | GO:0072553 | terminal button organization(GO:0072553) |
| 0.1 | 3.2 | GO:0007094 | mitotic spindle assembly checkpoint(GO:0007094) |
| 0.1 | 2.5 | GO:0002021 | response to dietary excess(GO:0002021) |
| 0.1 | 0.2 | GO:2000276 | negative regulation of oxidative phosphorylation uncoupler activity(GO:2000276) |
| 0.1 | 0.5 | GO:1904450 | gamma-aminobutyric acid catabolic process(GO:0009450) negative regulation of gamma-aminobutyric acid secretion(GO:0014053) aspartate secretion(GO:0061528) regulation of aspartate secretion(GO:1904448) positive regulation of aspartate secretion(GO:1904450) |
| 0.1 | 0.3 | GO:0000454 | snoRNA guided rRNA pseudouridine synthesis(GO:0000454) |
| 0.1 | 5.4 | GO:0042771 | intrinsic apoptotic signaling pathway in response to DNA damage by p53 class mediator(GO:0042771) |
| 0.1 | 0.6 | GO:0090116 | C-5 methylation of cytosine(GO:0090116) |
| 0.1 | 0.2 | GO:0036353 | histone H2A-K119 monoubiquitination(GO:0036353) |
| 0.1 | 0.2 | GO:1904247 | positive regulation of polynucleotide adenylyltransferase activity(GO:1904247) |
| 0.1 | 3.0 | GO:0022400 | regulation of rhodopsin mediated signaling pathway(GO:0022400) |
| 0.1 | 1.0 | GO:0010499 | proteasomal ubiquitin-independent protein catabolic process(GO:0010499) |
| 0.1 | 0.4 | GO:0002318 | myeloid progenitor cell differentiation(GO:0002318) |
| 0.1 | 1.8 | GO:0018027 | peptidyl-lysine dimethylation(GO:0018027) |
| 0.1 | 0.4 | GO:0006003 | fructose 2,6-bisphosphate metabolic process(GO:0006003) |
| 0.1 | 0.5 | GO:0071802 | negative regulation of podosome assembly(GO:0071802) |
| 0.1 | 0.8 | GO:0051151 | negative regulation of smooth muscle cell differentiation(GO:0051151) |
| 0.1 | 1.1 | GO:0006451 | selenocysteine incorporation(GO:0001514) translational readthrough(GO:0006451) |
| 0.1 | 0.3 | GO:0042631 | cellular response to water deprivation(GO:0042631) |
| 0.1 | 0.6 | GO:0060056 | mammary gland involution(GO:0060056) |
| 0.1 | 1.5 | GO:0001844 | protein insertion into mitochondrial membrane involved in apoptotic signaling pathway(GO:0001844) |
| 0.1 | 0.6 | GO:0010571 | positive regulation of nuclear cell cycle DNA replication(GO:0010571) |
| 0.1 | 0.9 | GO:0007258 | JUN phosphorylation(GO:0007258) |
| 0.1 | 0.3 | GO:0061055 | myotome development(GO:0061055) |
| 0.1 | 0.3 | GO:1902269 | positive regulation of polyamine transmembrane transport(GO:1902269) |
| 0.1 | 0.6 | GO:0006572 | tyrosine catabolic process(GO:0006572) |
| 0.1 | 0.6 | GO:0050872 | white fat cell differentiation(GO:0050872) |
| 0.1 | 2.1 | GO:0009268 | response to pH(GO:0009268) |
| 0.1 | 0.8 | GO:0070072 | proton-transporting V-type ATPase complex assembly(GO:0070070) vacuolar proton-transporting V-type ATPase complex assembly(GO:0070072) |
| 0.1 | 4.0 | GO:0071377 | cellular response to glucagon stimulus(GO:0071377) |
| 0.1 | 0.2 | GO:1903527 | positive regulation of membrane tubulation(GO:1903527) |
| 0.1 | 0.2 | GO:1903674 | regulation of cap-dependent translational initiation(GO:1903674) positive regulation of cap-dependent translational initiation(GO:1903676) |
| 0.1 | 0.2 | GO:0097501 | stress response to metal ion(GO:0097501) |
| 0.1 | 0.5 | GO:0036260 | 7-methylguanosine mRNA capping(GO:0006370) 7-methylguanosine RNA capping(GO:0009452) RNA capping(GO:0036260) |
| 0.1 | 0.7 | GO:0061314 | Notch signaling involved in heart development(GO:0061314) |
| 0.1 | 0.2 | GO:0071109 | superior temporal gyrus development(GO:0071109) |
| 0.1 | 0.1 | GO:0070309 | lens fiber cell morphogenesis(GO:0070309) |
| 0.1 | 0.2 | GO:0045903 | positive regulation of translational fidelity(GO:0045903) |
| 0.1 | 0.7 | GO:0033227 | dsRNA transport(GO:0033227) |
| 0.1 | 0.2 | GO:0007066 | female meiosis sister chromatid cohesion(GO:0007066) |
| 0.1 | 0.7 | GO:0002315 | marginal zone B cell differentiation(GO:0002315) |
| 0.1 | 3.5 | GO:0043392 | negative regulation of DNA binding(GO:0043392) |
| 0.1 | 1.4 | GO:0070987 | error-free translesion synthesis(GO:0070987) |
| 0.1 | 0.1 | GO:0006258 | UDP-glucose catabolic process(GO:0006258) |
| 0.1 | 0.1 | GO:1902728 | positive regulation of skeletal muscle cell proliferation(GO:0014858) positive regulation of skeletal muscle satellite cell proliferation(GO:1902724) positive regulation of growth factor dependent skeletal muscle satellite cell proliferation(GO:1902728) |
| 0.1 | 2.3 | GO:0032786 | positive regulation of DNA-templated transcription, elongation(GO:0032786) |
| 0.1 | 0.6 | GO:2000643 | positive regulation of early endosome to late endosome transport(GO:2000643) |
| 0.1 | 8.0 | GO:0015992 | proton transport(GO:0015992) |
| 0.1 | 0.3 | GO:0045345 | positive regulation of MHC class I biosynthetic process(GO:0045345) |
| 0.1 | 1.6 | GO:0042554 | superoxide anion generation(GO:0042554) |
| 0.1 | 0.4 | GO:0015888 | thiamine transport(GO:0015888) |
| 0.1 | 8.2 | GO:0035308 | negative regulation of protein dephosphorylation(GO:0035308) |
| 0.1 | 1.2 | GO:2000574 | regulation of microtubule motor activity(GO:2000574) |
| 0.1 | 6.5 | GO:0006919 | activation of cysteine-type endopeptidase activity involved in apoptotic process(GO:0006919) |
| 0.1 | 2.6 | GO:0002279 | mast cell activation involved in immune response(GO:0002279) mast cell degranulation(GO:0043303) |
| 0.1 | 0.2 | GO:0060876 | semicircular canal formation(GO:0060876) |
| 0.1 | 0.8 | GO:0042501 | serine phosphorylation of STAT protein(GO:0042501) |
| 0.1 | 1.1 | GO:0043306 | positive regulation of mast cell activation involved in immune response(GO:0033008) positive regulation of mast cell degranulation(GO:0043306) |
| 0.1 | 0.7 | GO:2000042 | negative regulation of double-strand break repair via homologous recombination(GO:2000042) |
| 0.1 | 0.4 | GO:0070236 | negative regulation of activation-induced cell death of T cells(GO:0070236) |
| 0.1 | 0.2 | GO:0090666 | scaRNA localization to Cajal body(GO:0090666) |
| 0.1 | 0.8 | GO:0006265 | DNA topological change(GO:0006265) |
| 0.1 | 0.4 | GO:0009838 | abscission(GO:0009838) |
| 0.1 | 2.8 | GO:1901186 | positive regulation of epidermal growth factor receptor signaling pathway(GO:0045742) positive regulation of ERBB signaling pathway(GO:1901186) |
| 0.1 | 0.6 | GO:0036149 | phosphatidylinositol acyl-chain remodeling(GO:0036149) |
| 0.1 | 0.6 | GO:0030388 | fructose 1,6-bisphosphate metabolic process(GO:0030388) |
| 0.1 | 0.9 | GO:0010839 | negative regulation of keratinocyte proliferation(GO:0010839) |
| 0.1 | 23.4 | GO:0010038 | response to metal ion(GO:0010038) |
| 0.1 | 0.5 | GO:0016191 | synaptic vesicle uncoating(GO:0016191) |
| 0.1 | 0.8 | GO:0040032 | parathyroid hormone secretion(GO:0035898) post-embryonic body morphogenesis(GO:0040032) regulation of parathyroid hormone secretion(GO:2000828) |
| 0.1 | 0.2 | GO:0016267 | O-glycan processing, core 1(GO:0016267) |
| 0.1 | 1.2 | GO:0007638 | mechanosensory behavior(GO:0007638) |
| 0.1 | 1.1 | GO:0036148 | phosphatidylglycerol acyl-chain remodeling(GO:0036148) |
| 0.1 | 2.1 | GO:1901224 | positive regulation of NIK/NF-kappaB signaling(GO:1901224) |
| 0.1 | 0.6 | GO:0005984 | disaccharide metabolic process(GO:0005984) |
| 0.1 | 1.5 | GO:0006646 | phosphatidylethanolamine biosynthetic process(GO:0006646) |
| 0.1 | 0.5 | GO:0045898 | regulation of RNA polymerase II transcriptional preinitiation complex assembly(GO:0045898) |
| 0.1 | 0.9 | GO:0097352 | autophagosome maturation(GO:0097352) |
| 0.1 | 0.2 | GO:0051083 | 'de novo' cotranslational protein folding(GO:0051083) |
| 0.0 | 0.1 | GO:0019287 | isopentenyl diphosphate biosynthetic process, mevalonate pathway(GO:0019287) |
| 0.0 | 0.5 | GO:0071569 | protein ufmylation(GO:0071569) |
| 0.0 | 0.2 | GO:0045872 | positive regulation of rhodopsin gene expression(GO:0045872) |
| 0.0 | 0.8 | GO:0051923 | sulfation(GO:0051923) |
| 0.0 | 0.3 | GO:0045628 | regulation of T-helper 2 cell differentiation(GO:0045628) positive regulation of T-helper 2 cell differentiation(GO:0045630) |
| 0.0 | 0.2 | GO:0051835 | positive regulation of synapse structural plasticity(GO:0051835) |
| 0.0 | 1.9 | GO:0071526 | semaphorin-plexin signaling pathway(GO:0071526) |
| 0.0 | 0.2 | GO:0071409 | cellular response to cycloheximide(GO:0071409) |
| 0.0 | 1.0 | GO:0044030 | regulation of DNA methylation(GO:0044030) |
| 0.0 | 2.5 | GO:0030641 | regulation of cellular pH(GO:0030641) |
| 0.0 | 0.2 | GO:0008588 | release of cytoplasmic sequestered NF-kappaB(GO:0008588) |
| 0.0 | 1.1 | GO:0006488 | dolichol-linked oligosaccharide biosynthetic process(GO:0006488) |
| 0.0 | 0.7 | GO:0080111 | DNA demethylation(GO:0080111) |
| 0.0 | 0.5 | GO:0018231 | peptidyl-L-cysteine S-palmitoylation(GO:0018230) peptidyl-S-diacylglycerol-L-cysteine biosynthetic process from peptidyl-cysteine(GO:0018231) |
| 0.0 | 0.4 | GO:0006549 | isoleucine metabolic process(GO:0006549) |
| 0.0 | 1.4 | GO:1904778 | regulation of protein localization to cell cortex(GO:1904776) positive regulation of protein localization to cell cortex(GO:1904778) |
| 0.0 | 6.6 | GO:0006613 | cotranslational protein targeting to membrane(GO:0006613) |
| 0.0 | 0.1 | GO:0006288 | base-excision repair, DNA ligation(GO:0006288) |
| 0.0 | 1.7 | GO:0061718 | NADH regeneration(GO:0006735) glycolytic process through fructose-6-phosphate(GO:0061615) glycolytic process through glucose-6-phosphate(GO:0061620) canonical glycolysis(GO:0061621) glucose catabolic process to pyruvate(GO:0061718) |
| 0.0 | 0.1 | GO:1990579 | protein trans-autophosphorylation(GO:0036290) peptidyl-serine trans-autophosphorylation(GO:1990579) |
| 0.0 | 0.3 | GO:0051342 | regulation of cyclic-nucleotide phosphodiesterase activity(GO:0051342) negative regulation of cyclic-nucleotide phosphodiesterase activity(GO:0051344) |
| 0.0 | 2.4 | GO:0045776 | negative regulation of blood pressure(GO:0045776) |
| 0.0 | 2.3 | GO:0043966 | histone H3 acetylation(GO:0043966) |
| 0.0 | 1.9 | GO:1904031 | positive regulation of cyclin-dependent protein kinase activity(GO:1904031) |
| 0.0 | 1.9 | GO:0061641 | CENP-A containing nucleosome assembly(GO:0034080) CENP-A containing chromatin organization(GO:0061641) |
| 0.0 | 3.8 | GO:0006687 | glycosphingolipid metabolic process(GO:0006687) |
| 0.0 | 0.7 | GO:0006995 | cellular response to nitrogen starvation(GO:0006995) cellular response to nitrogen levels(GO:0043562) |
| 0.0 | 0.7 | GO:0000920 | cell separation after cytokinesis(GO:0000920) |
| 0.0 | 0.5 | GO:0039536 | negative regulation of RIG-I signaling pathway(GO:0039536) |
| 0.0 | 1.1 | GO:0035518 | histone H2A monoubiquitination(GO:0035518) |
| 0.0 | 0.4 | GO:0035965 | cardiolipin acyl-chain remodeling(GO:0035965) |
| 0.0 | 0.4 | GO:0034724 | DNA replication-independent nucleosome assembly(GO:0006336) DNA replication-independent nucleosome organization(GO:0034724) |
| 0.0 | 0.2 | GO:0015015 | heparan sulfate proteoglycan biosynthetic process, enzymatic modification(GO:0015015) |
| 0.0 | 0.4 | GO:0045793 | positive regulation of cell size(GO:0045793) |
| 0.0 | 0.2 | GO:0032286 | central nervous system myelin maintenance(GO:0032286) |
| 0.0 | 1.3 | GO:0015701 | bicarbonate transport(GO:0015701) |
| 0.0 | 0.1 | GO:0015882 | L-ascorbic acid transport(GO:0015882) transepithelial L-ascorbic acid transport(GO:0070904) |
| 0.0 | 0.8 | GO:0099514 | anterograde synaptic vesicle transport(GO:0048490) synaptic vesicle cytoskeletal transport(GO:0099514) synaptic vesicle transport along microtubule(GO:0099517) |
| 0.0 | 1.4 | GO:0080171 | lysosome organization(GO:0007040) lytic vacuole organization(GO:0080171) |
| 0.0 | 0.3 | GO:0043569 | negative regulation of insulin-like growth factor receptor signaling pathway(GO:0043569) |
| 0.0 | 0.3 | GO:0006013 | mannose metabolic process(GO:0006013) |
| 0.0 | 1.2 | GO:0006465 | signal peptide processing(GO:0006465) |
| 0.0 | 0.3 | GO:0001915 | negative regulation of T cell mediated cytotoxicity(GO:0001915) |
| 0.0 | 0.2 | GO:0060523 | prostate epithelial cord elongation(GO:0060523) |
| 0.0 | 0.4 | GO:0019919 | peptidyl-arginine methylation, to asymmetrical-dimethyl arginine(GO:0019919) |
| 0.0 | 0.2 | GO:0060075 | regulation of resting membrane potential(GO:0060075) |
| 0.0 | 0.2 | GO:0036229 | glutamine secretion(GO:0010585) L-glutamine import(GO:0036229) L-glutamine import into cell(GO:1903803) |
| 0.0 | 1.6 | GO:0031113 | regulation of microtubule polymerization(GO:0031113) |
| 0.0 | 0.2 | GO:1900224 | positive regulation of nodal signaling pathway involved in determination of lateral mesoderm left/right asymmetry(GO:1900224) |
| 0.0 | 0.6 | GO:0046040 | IMP metabolic process(GO:0046040) |
| 0.0 | 0.0 | GO:0048619 | embryonic hindgut morphogenesis(GO:0048619) |
| 0.0 | 0.2 | GO:0035617 | stress granule disassembly(GO:0035617) |
| 0.0 | 1.1 | GO:0050860 | negative regulation of T cell receptor signaling pathway(GO:0050860) |
| 0.0 | 1.8 | GO:0007602 | phototransduction(GO:0007602) |
| 0.0 | 2.5 | GO:0045815 | positive regulation of gene expression, epigenetic(GO:0045815) |
| 0.0 | 0.3 | GO:0010816 | neuropeptide catabolic process(GO:0010813) substance P catabolic process(GO:0010814) calcitonin catabolic process(GO:0010816) endothelin maturation(GO:0034959) |
| 0.0 | 4.0 | GO:0006369 | termination of RNA polymerase II transcription(GO:0006369) |
| 0.0 | 0.3 | GO:0035067 | negative regulation of histone acetylation(GO:0035067) |
| 0.0 | 0.1 | GO:0043504 | mitochondrial DNA repair(GO:0043504) |
| 0.0 | 0.1 | GO:1901842 | negative regulation of high voltage-gated calcium channel activity(GO:1901842) |
| 0.0 | 0.2 | GO:0018344 | protein geranylgeranylation(GO:0018344) |
| 0.0 | 0.9 | GO:0007097 | nuclear migration(GO:0007097) |
| 0.0 | 0.7 | GO:2000369 | regulation of clathrin-mediated endocytosis(GO:2000369) |
| 0.0 | 0.5 | GO:1900028 | negative regulation of ruffle assembly(GO:1900028) |
| 0.0 | 0.2 | GO:0032462 | regulation of protein homooligomerization(GO:0032462) |
| 0.0 | 1.6 | GO:0043928 | exonucleolytic nuclear-transcribed mRNA catabolic process involved in deadenylation-dependent decay(GO:0043928) |
| 0.0 | 0.5 | GO:0001682 | tRNA 5'-leader removal(GO:0001682) |
| 0.0 | 0.5 | GO:0051601 | exocyst localization(GO:0051601) |
| 0.0 | 0.9 | GO:0006896 | Golgi to vacuole transport(GO:0006896) |
| 0.0 | 0.2 | GO:0008582 | regulation of synaptic growth at neuromuscular junction(GO:0008582) |
| 0.0 | 0.3 | GO:0032483 | regulation of Rab protein signal transduction(GO:0032483) |
| 0.0 | 0.4 | GO:0006621 | protein retention in ER lumen(GO:0006621) maintenance of protein localization in endoplasmic reticulum(GO:0035437) |
| 0.0 | 0.4 | GO:0015812 | gamma-aminobutyric acid transport(GO:0015812) |
| 0.0 | 0.1 | GO:1903551 | regulation of extracellular exosome assembly(GO:1903551) |
| 0.0 | 0.6 | GO:0035414 | negative regulation of catenin import into nucleus(GO:0035414) |
| 0.0 | 0.2 | GO:0071477 | hypotonic salinity response(GO:0042539) cellular hypotonic salinity response(GO:0071477) |
| 0.0 | 0.7 | GO:0045839 | negative regulation of mitotic nuclear division(GO:0045839) |
| 0.0 | 1.5 | GO:1904837 | beta-catenin-TCF complex assembly(GO:1904837) |
| 0.0 | 1.1 | GO:0006099 | tricarboxylic acid cycle(GO:0006099) |
| 0.0 | 0.4 | GO:0038044 | transforming growth factor-beta secretion(GO:0038044) |
| 0.0 | 0.4 | GO:0016188 | synaptic vesicle maturation(GO:0016188) |
| 0.0 | 0.3 | GO:1903069 | regulation of ER-associated ubiquitin-dependent protein catabolic process(GO:1903069) positive regulation of ER-associated ubiquitin-dependent protein catabolic process(GO:1903071) |
| 0.0 | 2.1 | GO:0006368 | transcription elongation from RNA polymerase II promoter(GO:0006368) |
| 0.0 | 0.2 | GO:1904491 | protein localization to ciliary transition zone(GO:1904491) |
| 0.0 | 0.4 | GO:0090527 | actin filament reorganization(GO:0090527) |
| 0.0 | 0.3 | GO:0060260 | regulation of transcription initiation from RNA polymerase II promoter(GO:0060260) |
| 0.0 | 0.9 | GO:1903432 | regulation of TORC1 signaling(GO:1903432) |
| 0.0 | 0.7 | GO:0007096 | regulation of exit from mitosis(GO:0007096) |
| 0.0 | 0.6 | GO:0038180 | nerve growth factor signaling pathway(GO:0038180) |
| 0.0 | 0.1 | GO:0070257 | positive regulation of mucus secretion(GO:0070257) |
| 0.0 | 0.5 | GO:0042759 | long-chain fatty acid biosynthetic process(GO:0042759) |
| 0.0 | 1.0 | GO:0072600 | establishment of protein localization to Golgi(GO:0072600) |
| 0.0 | 0.1 | GO:0000921 | septin ring assembly(GO:0000921) septin ring organization(GO:0031106) regulation of bleb assembly(GO:1904170) positive regulation of bleb assembly(GO:1904172) |
| 0.0 | 0.1 | GO:0032771 | regulation of monophenol monooxygenase activity(GO:0032771) positive regulation of monophenol monooxygenase activity(GO:0032773) negative regulation of hair follicle maturation(GO:0048817) negative regulation of catagen(GO:0051796) regulation of hair cycle by canonical Wnt signaling pathway(GO:0060901) positive regulation of melanosome transport(GO:1902910) |
| 0.0 | 1.2 | GO:0015012 | heparan sulfate proteoglycan biosynthetic process(GO:0015012) |
| 0.0 | 0.2 | GO:0040016 | embryonic cleavage(GO:0040016) |
| 0.0 | 0.2 | GO:0038165 | oncostatin-M-mediated signaling pathway(GO:0038165) |
| 0.0 | 0.3 | GO:1902564 | negative regulation of neutrophil degranulation(GO:0043314) negative regulation of neutrophil activation(GO:1902564) |
| 0.0 | 1.7 | GO:0070936 | protein K48-linked ubiquitination(GO:0070936) |
| 0.0 | 2.3 | GO:0051865 | protein autoubiquitination(GO:0051865) |
| 0.0 | 2.9 | GO:0031146 | SCF-dependent proteasomal ubiquitin-dependent protein catabolic process(GO:0031146) |
| 0.0 | 0.2 | GO:0006177 | GMP biosynthetic process(GO:0006177) |
| 0.0 | 0.2 | GO:0048539 | bone marrow development(GO:0048539) |
| 0.0 | 1.4 | GO:0035690 | cellular response to drug(GO:0035690) |
| 0.0 | 2.5 | GO:0048678 | response to axon injury(GO:0048678) |
| 0.0 | 3.7 | GO:0030183 | B cell differentiation(GO:0030183) |
| 0.0 | 0.3 | GO:0032287 | peripheral nervous system myelin maintenance(GO:0032287) |
| 0.0 | 1.3 | GO:0070536 | protein K63-linked deubiquitination(GO:0070536) |
| 0.0 | 0.1 | GO:1901029 | negative regulation of mitochondrial outer membrane permeabilization involved in apoptotic signaling pathway(GO:1901029) |
| 0.0 | 0.1 | GO:0002084 | protein depalmitoylation(GO:0002084) |
| 0.0 | 0.4 | GO:0000338 | protein deneddylation(GO:0000338) |
| 0.0 | 0.1 | GO:0035544 | negative regulation of SNARE complex assembly(GO:0035544) |
| 0.0 | 0.6 | GO:0010800 | positive regulation of peptidyl-threonine phosphorylation(GO:0010800) |
| 0.0 | 2.2 | GO:0045071 | negative regulation of viral genome replication(GO:0045071) |
| 0.0 | 1.2 | GO:0006198 | cAMP catabolic process(GO:0006198) |
| 0.0 | 0.4 | GO:0043029 | T cell homeostasis(GO:0043029) |
| 0.0 | 1.2 | GO:0016339 | calcium-dependent cell-cell adhesion via plasma membrane cell adhesion molecules(GO:0016339) |
| 0.0 | 1.6 | GO:0007032 | endosome organization(GO:0007032) |
| 0.0 | 2.2 | GO:0035722 | interleukin-12-mediated signaling pathway(GO:0035722) cellular response to interleukin-12(GO:0071349) |
| 0.0 | 0.1 | GO:0048205 | COPI-coated vesicle budding(GO:0035964) Golgi transport vesicle coating(GO:0048200) COPI coating of Golgi vesicle(GO:0048205) |
| 0.0 | 0.2 | GO:0006659 | phosphatidylserine biosynthetic process(GO:0006659) |
| 0.0 | 1.0 | GO:0006801 | superoxide metabolic process(GO:0006801) |
| 0.0 | 0.1 | GO:1901978 | positive regulation of cell cycle checkpoint(GO:1901978) |
| 0.0 | 0.1 | GO:0000451 | rRNA 2'-O-methylation(GO:0000451) |
| 0.0 | 0.6 | GO:0000076 | DNA replication checkpoint(GO:0000076) |
| 0.0 | 1.7 | GO:0060337 | type I interferon signaling pathway(GO:0060337) cellular response to type I interferon(GO:0071357) |
| 0.0 | 0.1 | GO:1903348 | positive regulation of bicellular tight junction assembly(GO:1903348) |
| 0.0 | 0.2 | GO:1904354 | negative regulation of telomere capping(GO:1904354) |
| 0.0 | 0.9 | GO:0010107 | potassium ion import(GO:0010107) |
| 0.0 | 0.4 | GO:0098828 | positive regulation of inhibitory postsynaptic potential(GO:0097151) modulation of inhibitory postsynaptic potential(GO:0098828) |
| 0.0 | 1.6 | GO:0006892 | post-Golgi vesicle-mediated transport(GO:0006892) |
| 0.0 | 0.1 | GO:0052651 | monoacylglycerol metabolic process(GO:0046462) monoacylglycerol catabolic process(GO:0052651) |
| 0.0 | 0.3 | GO:0002517 | T cell tolerance induction(GO:0002517) |
| 0.0 | 0.5 | GO:0035020 | regulation of Rac protein signal transduction(GO:0035020) |
| 0.0 | 15.7 | GO:0002283 | neutrophil activation involved in immune response(GO:0002283) neutrophil degranulation(GO:0043312) |
| 0.0 | 0.5 | GO:0045671 | negative regulation of osteoclast differentiation(GO:0045671) |
| 0.0 | 0.1 | GO:2000348 | regulation of CD40 signaling pathway(GO:2000348) |
| 0.0 | 0.1 | GO:0044245 | polysaccharide digestion(GO:0044245) |
| 0.0 | 0.5 | GO:0032211 | negative regulation of telomere maintenance via telomerase(GO:0032211) |
| 0.0 | 0.5 | GO:0032625 | interleukin-21 production(GO:0032625) T follicular helper cell differentiation(GO:0061470) interleukin-21 secretion(GO:0072619) |
| 0.0 | 1.2 | GO:0031640 | killing of cells of other organism(GO:0031640) disruption of cells of other organism(GO:0044364) |
| 0.0 | 0.3 | GO:0032780 | negative regulation of ATPase activity(GO:0032780) |
| 0.0 | 0.9 | GO:0090162 | establishment of epithelial cell polarity(GO:0090162) |
| 0.0 | 0.6 | GO:0042921 | corticosteroid receptor signaling pathway(GO:0031958) glucocorticoid receptor signaling pathway(GO:0042921) |
| 0.0 | 1.0 | GO:0060325 | face morphogenesis(GO:0060325) |
| 0.0 | 0.3 | GO:0098907 | protein localization to T-tubule(GO:0036371) regulation of SA node cell action potential(GO:0098907) |
| 0.0 | 0.2 | GO:0032815 | negative regulation of natural killer cell activation(GO:0032815) |
| 0.0 | 0.2 | GO:0043162 | ubiquitin-dependent protein catabolic process via the multivesicular body sorting pathway(GO:0043162) |
| 0.0 | 0.4 | GO:0006054 | N-acetylneuraminate metabolic process(GO:0006054) |
| 0.0 | 0.2 | GO:0061684 | chaperone-mediated autophagy(GO:0061684) regulation of chaperone-mediated autophagy(GO:1904714) |
| 0.0 | 0.1 | GO:0001510 | RNA methylation(GO:0001510) |
| 0.0 | 0.2 | GO:0051694 | pointed-end actin filament capping(GO:0051694) |
| 0.0 | 0.2 | GO:0007619 | courtship behavior(GO:0007619) negative regulation of female receptivity(GO:0007621) female courtship behavior(GO:0008050) regulation of female receptivity(GO:0045924) |
| 0.0 | 0.3 | GO:0034035 | purine ribonucleoside bisphosphate metabolic process(GO:0034035) 3'-phosphoadenosine 5'-phosphosulfate metabolic process(GO:0050427) |
| 0.0 | 1.1 | GO:0000079 | regulation of cyclin-dependent protein serine/threonine kinase activity(GO:0000079) regulation of cyclin-dependent protein kinase activity(GO:1904029) |
| 0.0 | 0.1 | GO:0035562 | negative regulation of chromatin binding(GO:0035562) |
| 0.0 | 0.2 | GO:1990126 | retrograde transport, endosome to plasma membrane(GO:1990126) |
| 0.0 | 0.2 | GO:0017182 | peptidyl-diphthamide metabolic process(GO:0017182) peptidyl-diphthamide biosynthetic process from peptidyl-histidine(GO:0017183) |
| 0.0 | 0.7 | GO:0050690 | regulation of defense response to virus by virus(GO:0050690) |
| 0.0 | 0.2 | GO:0051415 | interphase microtubule nucleation by interphase microtubule organizing center(GO:0051415) microtubule nucleation by microtubule organizing center(GO:0051418) |
| 0.0 | 0.2 | GO:0001705 | ectoderm formation(GO:0001705) ectodermal cell fate commitment(GO:0001712) |
| 0.0 | 0.2 | GO:0007185 | transmembrane receptor protein tyrosine phosphatase signaling pathway(GO:0007185) |
| 0.0 | 0.6 | GO:0000154 | rRNA modification(GO:0000154) |
| 0.0 | 0.2 | GO:0060267 | regulation of respiratory burst(GO:0060263) positive regulation of respiratory burst(GO:0060267) |
| 0.0 | 0.3 | GO:0021842 | directional guidance of interneurons involved in migration from the subpallium to the cortex(GO:0021840) chemorepulsion involved in interneuron migration from the subpallium to the cortex(GO:0021842) |
| 0.0 | 6.8 | GO:0000375 | RNA splicing, via transesterification reactions(GO:0000375) |
| 0.0 | 0.2 | GO:0035855 | megakaryocyte development(GO:0035855) |
| 0.0 | 0.1 | GO:0008063 | Toll signaling pathway(GO:0008063) |
| 0.0 | 0.5 | GO:0003338 | metanephros morphogenesis(GO:0003338) |
| 0.0 | 0.5 | GO:0001961 | positive regulation of cytokine-mediated signaling pathway(GO:0001961) |
| 0.0 | 0.5 | GO:0032728 | positive regulation of interferon-beta production(GO:0032728) |
| 0.0 | 0.7 | GO:0048701 | embryonic cranial skeleton morphogenesis(GO:0048701) |
| 0.0 | 0.2 | GO:0046125 | thymidine metabolic process(GO:0046104) pyrimidine deoxyribonucleoside metabolic process(GO:0046125) |
| 0.0 | 1.5 | GO:1903955 | positive regulation of protein targeting to mitochondrion(GO:1903955) |
| 0.0 | 0.3 | GO:0010867 | positive regulation of triglyceride biosynthetic process(GO:0010867) |
| 0.0 | 0.3 | GO:0008089 | anterograde axonal transport(GO:0008089) |
| 0.0 | 0.0 | GO:0042754 | negative regulation of circadian rhythm(GO:0042754) |
| 0.0 | 0.7 | GO:0032467 | positive regulation of cytokinesis(GO:0032467) |
| 0.0 | 1.6 | GO:0016575 | histone deacetylation(GO:0016575) |
| 0.0 | 0.1 | GO:0001714 | endodermal cell fate specification(GO:0001714) |
| 0.0 | 0.0 | GO:1902949 | positive regulation of tau-protein kinase activity(GO:1902949) |
| 0.0 | 0.2 | GO:0016576 | histone dephosphorylation(GO:0016576) |
| 0.0 | 0.1 | GO:0051013 | microtubule severing(GO:0051013) |
| 0.0 | 0.4 | GO:0007257 | activation of JUN kinase activity(GO:0007257) |
| 0.0 | 0.1 | GO:0000056 | ribosomal large subunit export from nucleus(GO:0000055) ribosomal small subunit export from nucleus(GO:0000056) |
| 0.0 | 0.2 | GO:0006388 | tRNA splicing, via endonucleolytic cleavage and ligation(GO:0006388) |
| 0.0 | 1.3 | GO:0000724 | double-strand break repair via homologous recombination(GO:0000724) |
| 0.0 | 0.4 | GO:0048246 | macrophage chemotaxis(GO:0048246) |
| 0.0 | 0.5 | GO:0072431 | DNA damage response, signal transduction by p53 class mediator resulting in cell cycle arrest(GO:0006977) signal transduction involved in mitotic G1 DNA damage checkpoint(GO:0072431) intracellular signal transduction involved in G1 DNA damage checkpoint(GO:1902400) |
| 0.0 | 0.1 | GO:0010668 | ectodermal cell differentiation(GO:0010668) |
| 0.0 | 0.5 | GO:0006270 | DNA replication initiation(GO:0006270) |
| 0.0 | 1.0 | GO:0030500 | regulation of bone mineralization(GO:0030500) |
| 0.0 | 0.2 | GO:0003322 | pancreatic A cell development(GO:0003322) |
| 0.0 | 0.2 | GO:0051654 | establishment of mitochondrion localization, microtubule-mediated(GO:0034643) mitochondrion transport along microtubule(GO:0047497) establishment of mitochondrion localization(GO:0051654) |
| 0.0 | 0.4 | GO:2000114 | regulation of establishment of cell polarity(GO:2000114) |
| 0.0 | 0.8 | GO:0001892 | embryonic placenta development(GO:0001892) |
| 0.0 | 0.0 | GO:0098789 | pre-mRNA cleavage required for polyadenylation(GO:0098789) |
| 0.0 | 0.5 | GO:0046039 | GTP metabolic process(GO:0046039) |
| 0.0 | 0.2 | GO:0032986 | nucleosome disassembly(GO:0006337) chromatin disassembly(GO:0031498) protein-DNA complex disassembly(GO:0032986) |
| 0.0 | 0.2 | GO:0006703 | estrogen biosynthetic process(GO:0006703) |
| 0.0 | 0.1 | GO:0051451 | myoblast migration(GO:0051451) |
| 0.0 | 0.2 | GO:0003416 | endochondral bone growth(GO:0003416) |
Gene overrepresentation in cellular component category:
| Log-likelihood per target | Total log-likelihood | Term | Description |
|---|---|---|---|
| 2.1 | 18.8 | GO:0098575 | lumenal side of lysosomal membrane(GO:0098575) |
| 1.9 | 9.7 | GO:0070381 | endosome to plasma membrane transport vesicle(GO:0070381) |
| 1.8 | 10.7 | GO:1990131 | Gtr1-Gtr2 GTPase complex(GO:1990131) |
| 1.6 | 9.9 | GO:0000221 | vacuolar proton-transporting V-type ATPase, V1 domain(GO:0000221) |
| 0.8 | 6.6 | GO:0044530 | supraspliceosomal complex(GO:0044530) |
| 0.7 | 5.8 | GO:0033180 | proton-transporting V-type ATPase, V1 domain(GO:0033180) |
| 0.7 | 5.0 | GO:0000408 | EKC/KEOPS complex(GO:0000408) |
| 0.7 | 5.6 | GO:0030121 | AP-1 adaptor complex(GO:0030121) |
| 0.7 | 11.8 | GO:0071203 | WASH complex(GO:0071203) |
| 0.6 | 3.2 | GO:0020003 | symbiont-containing vacuole(GO:0020003) |
| 0.6 | 3.0 | GO:1990498 | mitotic spindle microtubule(GO:1990498) |
| 0.6 | 2.9 | GO:1902737 | dendritic filopodium(GO:1902737) |
| 0.6 | 10.5 | GO:0030897 | HOPS complex(GO:0030897) |
| 0.6 | 4.5 | GO:0097129 | cyclin D2-CDK4 complex(GO:0097129) |
| 0.5 | 3.9 | GO:0032279 | asymmetric synapse(GO:0032279) |
| 0.5 | 5.1 | GO:0032010 | phagolysosome(GO:0032010) |
| 0.4 | 7.1 | GO:0010009 | cytoplasmic side of endosome membrane(GO:0010009) |
| 0.4 | 4.7 | GO:0071986 | Ragulator complex(GO:0071986) |
| 0.4 | 2.4 | GO:0090571 | RNA polymerase II transcription repressor complex(GO:0090571) |
| 0.4 | 5.1 | GO:0097136 | Bcl-2 family protein complex(GO:0097136) |
| 0.4 | 3.4 | GO:0032777 | Piccolo NuA4 histone acetyltransferase complex(GO:0032777) |
| 0.4 | 4.6 | GO:0035692 | macrophage migration inhibitory factor receptor complex(GO:0035692) |
| 0.4 | 3.4 | GO:0030905 | retromer, tubulation complex(GO:0030905) |
| 0.4 | 1.1 | GO:1990298 | mitotic checkpoint complex(GO:0033597) bub1-bub3 complex(GO:1990298) |
| 0.3 | 1.8 | GO:0097441 | basilar dendrite(GO:0097441) |
| 0.3 | 7.6 | GO:0043219 | lateral loop(GO:0043219) |
| 0.3 | 2.3 | GO:1990111 | spermatoproteasome complex(GO:1990111) |
| 0.3 | 1.4 | GO:0034274 | Atg12-Atg5-Atg16 complex(GO:0034274) |
| 0.3 | 3.2 | GO:0016589 | NURF complex(GO:0016589) |
| 0.3 | 1.9 | GO:0036021 | endolysosome lumen(GO:0036021) |
| 0.3 | 5.1 | GO:0033179 | proton-transporting V-type ATPase, V0 domain(GO:0033179) |
| 0.3 | 0.8 | GO:0012507 | ER to Golgi transport vesicle membrane(GO:0012507) |
| 0.3 | 1.8 | GO:0031523 | Myb complex(GO:0031523) |
| 0.3 | 5.9 | GO:0005885 | Arp2/3 protein complex(GO:0005885) |
| 0.3 | 0.8 | GO:0055087 | Ski complex(GO:0055087) |
| 0.2 | 0.7 | GO:0032419 | extrinsic component of lysosome membrane(GO:0032419) |
| 0.2 | 1.2 | GO:0031510 | SUMO activating enzyme complex(GO:0031510) |
| 0.2 | 2.8 | GO:0000808 | origin recognition complex(GO:0000808) nuclear origin of replication recognition complex(GO:0005664) |
| 0.2 | 1.1 | GO:1990796 | photoreceptor cell terminal bouton(GO:1990796) |
| 0.2 | 8.4 | GO:0005721 | pericentric heterochromatin(GO:0005721) |
| 0.2 | 1.4 | GO:0071458 | integral component of cytoplasmic side of endoplasmic reticulum membrane(GO:0071458) |
| 0.2 | 0.9 | GO:0098592 | cytoplasmic side of apical plasma membrane(GO:0098592) |
| 0.2 | 1.6 | GO:1990031 | pinceau fiber(GO:1990031) |
| 0.2 | 0.7 | GO:1990917 | sperm head plasma membrane(GO:1990913) ooplasm(GO:1990917) |
| 0.2 | 1.5 | GO:0070761 | pre-snoRNP complex(GO:0070761) |
| 0.2 | 0.6 | GO:0097422 | tubular endosome(GO:0097422) |
| 0.2 | 2.4 | GO:0046696 | lipopolysaccharide receptor complex(GO:0046696) |
| 0.2 | 1.8 | GO:0044666 | MLL3/4 complex(GO:0044666) |
| 0.2 | 1.6 | GO:0005797 | Golgi medial cisterna(GO:0005797) |
| 0.2 | 4.4 | GO:0005671 | Ada2/Gcn5/Ada3 transcription activator complex(GO:0005671) |
| 0.2 | 9.0 | GO:0044665 | MLL1/2 complex(GO:0044665) MLL1 complex(GO:0071339) |
| 0.2 | 2.7 | GO:0097413 | Lewy body(GO:0097413) |
| 0.2 | 0.5 | GO:0000229 | cytoplasmic chromosome(GO:0000229) |
| 0.2 | 2.5 | GO:0005853 | eukaryotic translation elongation factor 1 complex(GO:0005853) |
| 0.2 | 1.2 | GO:1990246 | uniplex complex(GO:1990246) |
| 0.2 | 1.9 | GO:0000243 | commitment complex(GO:0000243) |
| 0.2 | 4.1 | GO:1990909 | Wnt signalosome(GO:1990909) |
| 0.2 | 2.0 | GO:1990316 | ATG1/ULK1 kinase complex(GO:1990316) |
| 0.2 | 2.2 | GO:0005672 | transcription factor TFIIA complex(GO:0005672) |
| 0.2 | 0.8 | GO:0070032 | synaptobrevin 2-SNAP-25-syntaxin-1a-complexin I complex(GO:0070032) |
| 0.2 | 5.3 | GO:0031083 | BLOC-1 complex(GO:0031083) |
| 0.2 | 0.5 | GO:0048269 | methionine adenosyltransferase complex(GO:0048269) |
| 0.2 | 1.5 | GO:0042582 | primary lysosome(GO:0005766) azurophil granule(GO:0042582) |
| 0.2 | 2.7 | GO:0000813 | ESCRT I complex(GO:0000813) |
| 0.2 | 2.6 | GO:0005641 | nuclear envelope lumen(GO:0005641) |
| 0.2 | 1.4 | GO:0030119 | AP-type membrane coat adaptor complex(GO:0030119) |
| 0.1 | 3.9 | GO:0000786 | nucleosome(GO:0000786) |
| 0.1 | 0.4 | GO:0031085 | BLOC-3 complex(GO:0031085) |
| 0.1 | 1.9 | GO:0030981 | cortical microtubule cytoskeleton(GO:0030981) |
| 0.1 | 0.3 | GO:1990590 | ATF1-ATF4 transcription factor complex(GO:1990590) |
| 0.1 | 2.0 | GO:0097451 | glial limiting end-foot(GO:0097451) |
| 0.1 | 1.5 | GO:0045252 | oxoglutarate dehydrogenase complex(GO:0045252) |
| 0.1 | 1.4 | GO:0032389 | MutLalpha complex(GO:0032389) |
| 0.1 | 1.4 | GO:0000235 | astral microtubule(GO:0000235) aster(GO:0005818) |
| 0.1 | 1.8 | GO:1990907 | beta-catenin-TCF complex(GO:1990907) |
| 0.1 | 2.8 | GO:0030127 | COPII vesicle coat(GO:0030127) |
| 0.1 | 0.3 | GO:0030123 | AP-3 adaptor complex(GO:0030123) |
| 0.1 | 2.1 | GO:0033093 | Weibel-Palade body(GO:0033093) |
| 0.1 | 2.6 | GO:0000815 | ESCRT III complex(GO:0000815) |
| 0.1 | 3.3 | GO:0032591 | dendritic spine membrane(GO:0032591) |
| 0.1 | 0.5 | GO:0043614 | multi-eIF complex(GO:0043614) |
| 0.1 | 1.2 | GO:0005787 | signal peptidase complex(GO:0005787) |
| 0.1 | 0.4 | GO:0034685 | integrin alphav-beta6 complex(GO:0034685) |
| 0.1 | 3.0 | GO:0001931 | uropod(GO:0001931) cell trailing edge(GO:0031254) |
| 0.1 | 0.8 | GO:0009331 | glycerol-3-phosphate dehydrogenase complex(GO:0009331) |
| 0.1 | 0.6 | GO:0071006 | U2-type catalytic step 1 spliceosome(GO:0071006) |
| 0.1 | 1.3 | GO:0042382 | paraspeckles(GO:0042382) |
| 0.1 | 1.0 | GO:0016471 | vacuolar proton-transporting V-type ATPase complex(GO:0016471) |
| 0.1 | 5.3 | GO:0031258 | lamellipodium membrane(GO:0031258) |
| 0.1 | 18.0 | GO:0035578 | azurophil granule lumen(GO:0035578) |
| 0.1 | 1.4 | GO:0097197 | tetraspanin-enriched microdomain(GO:0097197) |
| 0.1 | 1.3 | GO:0000015 | phosphopyruvate hydratase complex(GO:0000015) |
| 0.1 | 0.7 | GO:0005896 | interleukin-6 receptor complex(GO:0005896) |
| 0.1 | 0.7 | GO:0000172 | ribonuclease MRP complex(GO:0000172) |
| 0.1 | 4.6 | GO:0035371 | microtubule plus-end(GO:0035371) |
| 0.1 | 0.9 | GO:1990745 | EARP complex(GO:1990745) |
| 0.1 | 0.7 | GO:0034751 | aryl hydrocarbon receptor complex(GO:0034751) |
| 0.1 | 2.5 | GO:0042405 | nuclear inclusion body(GO:0042405) |
| 0.1 | 0.8 | GO:0071595 | Nem1-Spo7 phosphatase complex(GO:0071595) |
| 0.1 | 1.4 | GO:0005744 | mitochondrial inner membrane presequence translocase complex(GO:0005744) |
| 0.1 | 0.7 | GO:0031464 | Cul4A-RING E3 ubiquitin ligase complex(GO:0031464) |
| 0.1 | 3.4 | GO:0071437 | invadopodium(GO:0071437) |
| 0.1 | 2.9 | GO:0005852 | eukaryotic translation initiation factor 3 complex(GO:0005852) |
| 0.1 | 2.4 | GO:0060077 | inhibitory synapse(GO:0060077) |
| 0.1 | 3.1 | GO:0071141 | SMAD protein complex(GO:0071141) |
| 0.1 | 1.4 | GO:0042587 | glycogen granule(GO:0042587) |
| 0.1 | 0.4 | GO:0098855 | HCN channel complex(GO:0098855) |
| 0.1 | 13.6 | GO:0070821 | tertiary granule membrane(GO:0070821) |
| 0.1 | 0.9 | GO:0030896 | checkpoint clamp complex(GO:0030896) |
| 0.1 | 0.2 | GO:0019034 | viral replication complex(GO:0019034) |
| 0.1 | 2.4 | GO:0005952 | cAMP-dependent protein kinase complex(GO:0005952) |
| 0.1 | 1.7 | GO:0032045 | guanyl-nucleotide exchange factor complex(GO:0032045) |
| 0.1 | 3.6 | GO:0032040 | small-subunit processome(GO:0032040) |
| 0.1 | 1.4 | GO:0005686 | U2 snRNP(GO:0005686) |
| 0.1 | 0.5 | GO:1990769 | proximal neuron projection(GO:1990769) |
| 0.1 | 3.0 | GO:0097381 | photoreceptor disc membrane(GO:0097381) |
| 0.1 | 2.5 | GO:0046540 | U4/U6 x U5 tri-snRNP complex(GO:0046540) |
| 0.1 | 0.8 | GO:0030915 | Smc5-Smc6 complex(GO:0030915) |
| 0.1 | 0.2 | GO:1990843 | subsarcolemmal mitochondrion(GO:1990843) interfibrillar mitochondrion(GO:1990844) |
| 0.1 | 2.5 | GO:0090545 | NuRD complex(GO:0016581) CHD-type complex(GO:0090545) |
| 0.1 | 1.2 | GO:0098839 | postsynaptic density membrane(GO:0098839) |
| 0.1 | 0.2 | GO:0035061 | interchromatin granule(GO:0035061) |
| 0.1 | 1.8 | GO:0005868 | cytoplasmic dynein complex(GO:0005868) |
| 0.1 | 6.7 | GO:0031519 | PcG protein complex(GO:0031519) |
| 0.1 | 1.0 | GO:0030870 | Mre11 complex(GO:0030870) |
| 0.1 | 0.8 | GO:0005638 | lamin filament(GO:0005638) |
| 0.1 | 5.2 | GO:0016235 | aggresome(GO:0016235) |
| 0.1 | 0.5 | GO:0032144 | 4-aminobutyrate transaminase complex(GO:0032144) |
| 0.1 | 2.1 | GO:0032590 | dendrite membrane(GO:0032590) |
| 0.1 | 0.9 | GO:0031465 | Cul4B-RING E3 ubiquitin ligase complex(GO:0031465) |
| 0.1 | 0.3 | GO:1990879 | CST complex(GO:1990879) |
| 0.1 | 0.7 | GO:0097504 | Gemini of coiled bodies(GO:0097504) |
| 0.1 | 0.1 | GO:0070765 | gamma-secretase complex(GO:0070765) |
| 0.1 | 1.2 | GO:0031616 | spindle pole centrosome(GO:0031616) |
| 0.1 | 1.3 | GO:0000153 | cytoplasmic ubiquitin ligase complex(GO:0000153) |
| 0.1 | 0.8 | GO:0035253 | ciliary rootlet(GO:0035253) |
| 0.1 | 0.2 | GO:0045323 | interleukin-1 receptor complex(GO:0045323) |
| 0.1 | 3.7 | GO:0008180 | COP9 signalosome(GO:0008180) |
| 0.1 | 2.0 | GO:0030140 | trans-Golgi network transport vesicle(GO:0030140) |
| 0.1 | 8.3 | GO:0032580 | Golgi cisterna membrane(GO:0032580) |
| 0.1 | 1.3 | GO:0005845 | mRNA cap binding complex(GO:0005845) |
| 0.1 | 0.5 | GO:0031415 | NatA complex(GO:0031415) |
| 0.1 | 1.8 | GO:0031235 | intrinsic component of the cytoplasmic side of the plasma membrane(GO:0031235) |
| 0.1 | 2.2 | GO:0000178 | exosome (RNase complex)(GO:0000178) |
| 0.1 | 1.3 | GO:0097038 | perinuclear endoplasmic reticulum(GO:0097038) |
| 0.1 | 1.4 | GO:0030122 | AP-2 adaptor complex(GO:0030122) |
| 0.1 | 4.5 | GO:0043198 | dendritic shaft(GO:0043198) |
| 0.1 | 0.9 | GO:0005883 | neurofilament(GO:0005883) |
| 0.1 | 0.9 | GO:0043083 | synaptic cleft(GO:0043083) |
| 0.1 | 0.2 | GO:0005753 | mitochondrial proton-transporting ATP synthase complex(GO:0005753) proton-transporting ATP synthase complex(GO:0045259) |
| 0.1 | 1.3 | GO:0005669 | transcription factor TFIID complex(GO:0005669) |
| 0.1 | 0.7 | GO:0097470 | ribbon synapse(GO:0097470) |
| 0.1 | 3.2 | GO:0001917 | photoreceptor inner segment(GO:0001917) |
| 0.1 | 25.0 | GO:0098852 | lysosomal membrane(GO:0005765) lytic vacuole membrane(GO:0098852) |
| 0.1 | 0.3 | GO:0033263 | CORVET complex(GO:0033263) |
| 0.0 | 0.7 | GO:0033256 | I-kappaB/NF-kappaB complex(GO:0033256) |
| 0.0 | 3.1 | GO:0005798 | Golgi-associated vesicle(GO:0005798) |
| 0.0 | 0.2 | GO:0038039 | G-protein coupled receptor heterodimeric complex(GO:0038039) |
| 0.0 | 4.0 | GO:0048770 | melanosome(GO:0042470) pigment granule(GO:0048770) |
| 0.0 | 1.0 | GO:0035327 | transcriptionally active chromatin(GO:0035327) |
| 0.0 | 2.9 | GO:0035579 | specific granule membrane(GO:0035579) |
| 0.0 | 1.7 | GO:0005697 | telomerase holoenzyme complex(GO:0005697) |
| 0.0 | 0.1 | GO:1990332 | Ire1 complex(GO:1990332) |
| 0.0 | 1.3 | GO:0014731 | spectrin-associated cytoskeleton(GO:0014731) |
| 0.0 | 0.4 | GO:0005879 | axonemal microtubule(GO:0005879) |
| 0.0 | 1.4 | GO:0031307 | integral component of mitochondrial outer membrane(GO:0031307) |
| 0.0 | 0.5 | GO:0008091 | spectrin(GO:0008091) |
| 0.0 | 2.9 | GO:0030670 | phagocytic vesicle membrane(GO:0030670) |
| 0.0 | 0.4 | GO:0005827 | polar microtubule(GO:0005827) |
| 0.0 | 0.2 | GO:0033063 | Rad51B-Rad51C-Rad51D-XRCC2 complex(GO:0033063) |
| 0.0 | 3.1 | GO:0005776 | autophagosome(GO:0005776) |
| 0.0 | 5.8 | GO:0016605 | PML body(GO:0016605) |
| 0.0 | 0.2 | GO:0008275 | gamma-tubulin small complex(GO:0008275) |
| 0.0 | 0.4 | GO:0034464 | BBSome(GO:0034464) |
| 0.0 | 0.5 | GO:0005955 | calcineurin complex(GO:0005955) |
| 0.0 | 2.5 | GO:0005834 | heterotrimeric G-protein complex(GO:0005834) |
| 0.0 | 0.6 | GO:0005662 | DNA replication factor A complex(GO:0005662) |
| 0.0 | 1.5 | GO:0045335 | phagocytic vesicle(GO:0045335) |
| 0.0 | 2.4 | GO:0016592 | mediator complex(GO:0016592) |
| 0.0 | 1.2 | GO:0035861 | site of double-strand break(GO:0035861) |
| 0.0 | 0.5 | GO:0031931 | TORC1 complex(GO:0031931) |
| 0.0 | 3.0 | GO:0097610 | cleavage furrow(GO:0032154) cell surface furrow(GO:0097610) |
| 0.0 | 0.4 | GO:0008024 | cyclin/CDK positive transcription elongation factor complex(GO:0008024) |
| 0.0 | 0.2 | GO:0005968 | Rab-protein geranylgeranyltransferase complex(GO:0005968) |
| 0.0 | 0.2 | GO:0045009 | melanosome membrane(GO:0033162) chitosome(GO:0045009) |
| 0.0 | 4.7 | GO:0042734 | presynaptic membrane(GO:0042734) |
| 0.0 | 0.2 | GO:0031074 | nucleocytoplasmic shuttling complex(GO:0031074) |
| 0.0 | 0.4 | GO:0072379 | BAT3 complex(GO:0071818) ER membrane insertion complex(GO:0072379) |
| 0.0 | 1.0 | GO:0005666 | DNA-directed RNA polymerase III complex(GO:0005666) |
| 0.0 | 30.7 | GO:0000139 | Golgi membrane(GO:0000139) |
| 0.0 | 0.9 | GO:0005890 | sodium:potassium-exchanging ATPase complex(GO:0005890) |
| 0.0 | 0.8 | GO:0071682 | endocytic vesicle lumen(GO:0071682) |
| 0.0 | 2.5 | GO:1904724 | tertiary granule lumen(GO:1904724) |
| 0.0 | 4.0 | GO:0000784 | nuclear chromosome, telomeric region(GO:0000784) |
| 0.0 | 0.4 | GO:0044232 | organelle membrane contact site(GO:0044232) |
| 0.0 | 0.3 | GO:0005689 | U12-type spliceosomal complex(GO:0005689) |
| 0.0 | 0.4 | GO:0016461 | unconventional myosin complex(GO:0016461) |
| 0.0 | 0.5 | GO:0031588 | nucleotide-activated protein kinase complex(GO:0031588) |
| 0.0 | 0.6 | GO:0031011 | Ino80 complex(GO:0031011) DNA helicase complex(GO:0033202) |
| 0.0 | 1.7 | GO:0031526 | brush border membrane(GO:0031526) |
| 0.0 | 3.1 | GO:0022625 | cytosolic large ribosomal subunit(GO:0022625) |
| 0.0 | 0.1 | GO:0033553 | rDNA heterochromatin(GO:0033553) |
| 0.0 | 0.4 | GO:0035748 | myelin sheath abaxonal region(GO:0035748) |
| 0.0 | 0.5 | GO:0016342 | catenin complex(GO:0016342) |
| 0.0 | 1.0 | GO:0046658 | anchored component of plasma membrane(GO:0046658) |
| 0.0 | 0.9 | GO:0031231 | integral component of peroxisomal membrane(GO:0005779) intrinsic component of peroxisomal membrane(GO:0031231) |
| 0.0 | 0.6 | GO:0031089 | platelet dense granule lumen(GO:0031089) |
| 0.0 | 0.1 | GO:0008537 | proteasome activator complex(GO:0008537) |
| 0.0 | 0.2 | GO:0097433 | dense body(GO:0097433) |
| 0.0 | 2.6 | GO:0031463 | Cul3-RING ubiquitin ligase complex(GO:0031463) |
| 0.0 | 4.1 | GO:0005604 | basement membrane(GO:0005604) |
| 0.0 | 10.1 | GO:0045121 | membrane raft(GO:0045121) membrane microdomain(GO:0098857) |
| 0.0 | 0.1 | GO:0044305 | calyx of Held(GO:0044305) |
| 0.0 | 12.3 | GO:0031965 | nuclear membrane(GO:0031965) |
| 0.0 | 0.4 | GO:0043186 | P granule(GO:0043186) pole plasm(GO:0045495) germ plasm(GO:0060293) |
| 0.0 | 2.4 | GO:0000123 | histone acetyltransferase complex(GO:0000123) |
| 0.0 | 0.4 | GO:0001741 | XY body(GO:0001741) |
| 0.0 | 2.7 | GO:0071013 | catalytic step 2 spliceosome(GO:0071013) |
| 0.0 | 0.4 | GO:0031201 | SNARE complex(GO:0031201) |
| 0.0 | 0.1 | GO:0033565 | ESCRT-0 complex(GO:0033565) |
| 0.0 | 0.2 | GO:0072669 | tRNA-splicing ligase complex(GO:0072669) |
| 0.0 | 10.6 | GO:0016607 | nuclear speck(GO:0016607) |
| 0.0 | 0.3 | GO:0042622 | photoreceptor outer segment membrane(GO:0042622) |
| 0.0 | 0.2 | GO:0090543 | Flemming body(GO:0090543) |
| 0.0 | 0.5 | GO:0035580 | specific granule lumen(GO:0035580) |
| 0.0 | 2.3 | GO:0055037 | recycling endosome(GO:0055037) |
| 0.0 | 5.1 | GO:0005788 | endoplasmic reticulum lumen(GO:0005788) |
| 0.0 | 0.5 | GO:0044322 | endoplasmic reticulum quality control compartment(GO:0044322) |
| 0.0 | 0.1 | GO:0005745 | m-AAA complex(GO:0005745) |
| 0.0 | 1.1 | GO:0005881 | cytoplasmic microtubule(GO:0005881) |
| 0.0 | 0.2 | GO:0032541 | cortical endoplasmic reticulum(GO:0032541) |
| 0.0 | 1.0 | GO:0045171 | intercellular bridge(GO:0045171) |
| 0.0 | 2.3 | GO:0005741 | mitochondrial outer membrane(GO:0005741) |
| 0.0 | 0.3 | GO:0030991 | intraciliary transport particle A(GO:0030991) |
| 0.0 | 1.0 | GO:0043195 | terminal bouton(GO:0043195) |
| 0.0 | 2.6 | GO:0030176 | integral component of endoplasmic reticulum membrane(GO:0030176) |
| 0.0 | 0.1 | GO:0044609 | DBIRD complex(GO:0044609) |
| 0.0 | 0.1 | GO:0030688 | preribosome, small subunit precursor(GO:0030688) |
| 0.0 | 0.2 | GO:0031209 | SCAR complex(GO:0031209) |
| 0.0 | 0.3 | GO:0035097 | histone methyltransferase complex(GO:0035097) |
| 0.0 | 0.1 | GO:0000126 | transcription factor TFIIIB complex(GO:0000126) |
| 0.0 | 0.1 | GO:0097058 | CRLF-CLCF1 complex(GO:0097058) |
| 0.0 | 0.1 | GO:0048500 | signal recognition particle, endoplasmic reticulum targeting(GO:0005786) signal recognition particle(GO:0048500) |
| 0.0 | 1.2 | GO:0005802 | trans-Golgi network(GO:0005802) |
| 0.0 | 0.3 | GO:0048786 | presynaptic active zone(GO:0048786) |
| 0.0 | 0.1 | GO:0005826 | actomyosin contractile ring(GO:0005826) |
| 0.0 | 0.9 | GO:0090544 | BAF-type complex(GO:0090544) |
| 0.0 | 1.6 | GO:0031234 | extrinsic component of cytoplasmic side of plasma membrane(GO:0031234) |
| 0.0 | 0.2 | GO:0030056 | hemidesmosome(GO:0030056) |
| 0.0 | 2.0 | GO:0005777 | peroxisome(GO:0005777) microbody(GO:0042579) |
| 0.0 | 0.3 | GO:0019897 | extrinsic component of plasma membrane(GO:0019897) |
| 0.0 | 0.2 | GO:0000164 | protein phosphatase type 1 complex(GO:0000164) |
| 0.0 | 1.2 | GO:0030135 | coated vesicle(GO:0030135) |
| 0.0 | 0.5 | GO:0030673 | axolemma(GO:0030673) |
| 0.0 | 0.1 | GO:0043541 | UDP-N-acetylglucosamine transferase complex(GO:0043541) |
| 0.0 | 32.8 | GO:1903561 | extracellular vesicle(GO:1903561) |
Gene overrepresentation in molecular function category:
| Log-likelihood per target | Total log-likelihood | Term | Description |
|---|---|---|---|
| 1.7 | 5.1 | GO:0043739 | G/U mismatch-specific uracil-DNA glycosylase activity(GO:0043739) |
| 1.6 | 6.6 | GO:0005163 | nerve growth factor receptor binding(GO:0005163) |
| 1.5 | 6.2 | GO:0008311 | double-stranded DNA 3'-5' exodeoxyribonuclease activity(GO:0008311) |
| 1.3 | 3.8 | GO:0016936 | galactoside binding(GO:0016936) |
| 1.2 | 18.8 | GO:0016997 | exo-alpha-sialidase activity(GO:0004308) alpha-sialidase activity(GO:0016997) |
| 0.9 | 5.6 | GO:0004741 | [pyruvate dehydrogenase (lipoamide)] phosphatase activity(GO:0004741) |
| 0.8 | 4.0 | GO:0016230 | sphingomyelin phosphodiesterase activator activity(GO:0016230) |
| 0.7 | 6.6 | GO:0003726 | double-stranded RNA adenosine deaminase activity(GO:0003726) |
| 0.7 | 2.2 | GO:0050309 | glucose-6-phosphatase activity(GO:0004346) sugar-terminal-phosphatase activity(GO:0050309) |
| 0.7 | 2.1 | GO:0004342 | glucosamine-6-phosphate deaminase activity(GO:0004342) |
| 0.7 | 4.9 | GO:0046624 | sphingolipid transporter activity(GO:0046624) |
| 0.7 | 3.3 | GO:0019776 | Atg8 ligase activity(GO:0019776) |
| 0.6 | 1.9 | GO:0004618 | phosphoglycerate kinase activity(GO:0004618) |
| 0.6 | 20.8 | GO:0044769 | ATPase activity, coupled to transmembrane movement of ions, rotational mechanism(GO:0044769) proton-transporting ATPase activity, rotational mechanism(GO:0046961) |
| 0.6 | 3.0 | GO:0004666 | prostaglandin-endoperoxide synthase activity(GO:0004666) arachidonate 15-lipoxygenase activity(GO:0050473) |
| 0.6 | 3.6 | GO:0004489 | methylenetetrahydrofolate reductase (NAD(P)H) activity(GO:0004489) |
| 0.6 | 2.9 | GO:0004616 | phosphogluconate dehydrogenase (decarboxylating) activity(GO:0004616) |
| 0.6 | 9.7 | GO:0032050 | clathrin heavy chain binding(GO:0032050) |
| 0.5 | 2.7 | GO:0003976 | UDP-N-acetylglucosamine-lysosomal-enzyme N-acetylglucosaminephosphotransferase activity(GO:0003976) |
| 0.5 | 3.6 | GO:0001595 | angiotensin receptor activity(GO:0001595) angiotensin type II receptor activity(GO:0004945) |
| 0.5 | 2.5 | GO:1990460 | leptin receptor binding(GO:1990460) |
| 0.5 | 2.0 | GO:1990189 | peptide-serine-N-acetyltransferase activity(GO:1990189) |
| 0.5 | 6.5 | GO:0015279 | store-operated calcium channel activity(GO:0015279) |
| 0.5 | 6.9 | GO:0051434 | BH3 domain binding(GO:0051434) |
| 0.5 | 1.4 | GO:0008859 | exoribonuclease II activity(GO:0008859) |
| 0.5 | 1.4 | GO:0015218 | pyrimidine nucleotide transmembrane transporter activity(GO:0015218) |
| 0.4 | 0.9 | GO:0016774 | phosphotransferase activity, carboxyl group as acceptor(GO:0016774) |
| 0.4 | 7.4 | GO:0071933 | Arp2/3 complex binding(GO:0071933) |
| 0.4 | 8.8 | GO:0015929 | hexosaminidase activity(GO:0015929) |
| 0.4 | 2.5 | GO:0016426 | tRNA (adenine) methyltransferase activity(GO:0016426) |
| 0.4 | 1.2 | GO:0019948 | SUMO activating enzyme activity(GO:0019948) |
| 0.4 | 11.0 | GO:0005247 | voltage-gated chloride channel activity(GO:0005247) |
| 0.4 | 1.8 | GO:0052836 | inositol 5-diphosphate pentakisphosphate 5-kinase activity(GO:0052836) inositol diphosphate tetrakisphosphate kinase activity(GO:0052839) |
| 0.3 | 8.7 | GO:0051864 | histone demethylase activity (H3-K36 specific)(GO:0051864) |
| 0.3 | 1.0 | GO:0016309 | 1-phosphatidylinositol-5-phosphate 4-kinase activity(GO:0016309) |
| 0.3 | 3.0 | GO:0003873 | 6-phosphofructo-2-kinase activity(GO:0003873) |
| 0.3 | 4.7 | GO:0004630 | phospholipase D activity(GO:0004630) |
| 0.3 | 0.7 | GO:0008553 | hydrogen-exporting ATPase activity, phosphorylative mechanism(GO:0008553) |
| 0.3 | 1.3 | GO:0005471 | ATP:ADP antiporter activity(GO:0005471) adenine transmembrane transporter activity(GO:0015207) |
| 0.3 | 2.0 | GO:0005105 | type 1 fibroblast growth factor receptor binding(GO:0005105) |
| 0.3 | 3.0 | GO:0034988 | Fc-gamma receptor I complex binding(GO:0034988) |
| 0.3 | 1.6 | GO:0019912 | cyclin-dependent protein kinase activating kinase activity(GO:0019912) |
| 0.3 | 8.6 | GO:0005402 | sugar:proton symporter activity(GO:0005351) cation:sugar symporter activity(GO:0005402) |
| 0.3 | 2.2 | GO:0042500 | aspartic endopeptidase activity, intramembrane cleaving(GO:0042500) |
| 0.3 | 0.9 | GO:0004483 | mRNA (nucleoside-2'-O-)-methyltransferase activity(GO:0004483) |
| 0.3 | 2.7 | GO:0044547 | DNA topoisomerase binding(GO:0044547) |
| 0.3 | 1.8 | GO:0072345 | NAADP-sensitive calcium-release channel activity(GO:0072345) |
| 0.3 | 2.9 | GO:0034046 | poly(G) binding(GO:0034046) |
| 0.3 | 0.9 | GO:0004730 | pseudouridylate synthase activity(GO:0004730) |
| 0.3 | 2.0 | GO:1990050 | phosphatidic acid transporter activity(GO:1990050) |
| 0.3 | 2.6 | GO:0008449 | N-acetylglucosamine-6-sulfatase activity(GO:0008449) |
| 0.3 | 2.5 | GO:0015319 | sodium:inorganic phosphate symporter activity(GO:0015319) |
| 0.3 | 3.9 | GO:0015193 | L-proline transmembrane transporter activity(GO:0015193) |
| 0.3 | 3.9 | GO:0031419 | cobalamin binding(GO:0031419) |
| 0.3 | 1.1 | GO:0043273 | CTPase activity(GO:0043273) |
| 0.3 | 1.4 | GO:0046964 | 3'-phosphoadenosine 5'-phosphosulfate transmembrane transporter activity(GO:0046964) |
| 0.3 | 29.6 | GO:0005507 | copper ion binding(GO:0005507) |
| 0.3 | 18.4 | GO:0050699 | WW domain binding(GO:0050699) |
| 0.3 | 1.1 | GO:0047192 | 1-alkylglycerophosphocholine O-acetyltransferase activity(GO:0047192) |
| 0.3 | 2.4 | GO:0035500 | MH2 domain binding(GO:0035500) |
| 0.3 | 1.6 | GO:0008240 | tripeptidyl-peptidase activity(GO:0008240) |
| 0.3 | 1.0 | GO:0034186 | apolipoprotein A-I binding(GO:0034186) |
| 0.3 | 3.6 | GO:0031386 | protein tag(GO:0031386) |
| 0.2 | 1.0 | GO:0004088 | carbamoyl-phosphate synthase (ammonia) activity(GO:0004087) carbamoyl-phosphate synthase (glutamine-hydrolyzing) activity(GO:0004088) |
| 0.2 | 0.7 | GO:0016652 | NAD(P)+ transhydrogenase activity(GO:0008746) oxidoreductase activity, acting on NAD(P)H, NAD(P) as acceptor(GO:0016652) |
| 0.2 | 4.5 | GO:0046625 | sphingolipid binding(GO:0046625) |
| 0.2 | 5.1 | GO:1990380 | Lys48-specific deubiquitinase activity(GO:1990380) |
| 0.2 | 3.2 | GO:0102336 | fatty acid elongase activity(GO:0009922) 3-oxo-arachidoyl-CoA synthase activity(GO:0102336) 3-oxo-cerotoyl-CoA synthase activity(GO:0102337) 3-oxo-lignoceronyl-CoA synthase activity(GO:0102338) |
| 0.2 | 3.4 | GO:0005007 | fibroblast growth factor-activated receptor activity(GO:0005007) |
| 0.2 | 0.7 | GO:0002135 | CTP binding(GO:0002135) |
| 0.2 | 2.2 | GO:0001665 | alpha-N-acetylgalactosaminide alpha-2,6-sialyltransferase activity(GO:0001665) |
| 0.2 | 1.5 | GO:0004591 | oxoglutarate dehydrogenase (succinyl-transferring) activity(GO:0004591) |
| 0.2 | 2.1 | GO:0003876 | AMP deaminase activity(GO:0003876) adenosine-phosphate deaminase activity(GO:0047623) |
| 0.2 | 2.1 | GO:0046974 | histone methyltransferase activity (H3-K9 specific)(GO:0046974) |
| 0.2 | 5.1 | GO:0008349 | MAP kinase kinase kinase kinase activity(GO:0008349) |
| 0.2 | 0.4 | GO:0032564 | adenyl deoxyribonucleotide binding(GO:0032558) dATP binding(GO:0032564) |
| 0.2 | 1.0 | GO:0033829 | O-fucosylpeptide 3-beta-N-acetylglucosaminyltransferase activity(GO:0033829) |
| 0.2 | 0.6 | GO:0036505 | prosaposin receptor activity(GO:0036505) |
| 0.2 | 0.9 | GO:0070579 | methylcytosine dioxygenase activity(GO:0070579) |
| 0.2 | 3.5 | GO:0097016 | L27 domain binding(GO:0097016) |
| 0.2 | 1.1 | GO:0030377 | urokinase plasminogen activator receptor activity(GO:0030377) |
| 0.2 | 7.9 | GO:0070273 | phosphatidylinositol-4-phosphate binding(GO:0070273) |
| 0.2 | 0.5 | GO:0050146 | nucleoside phosphotransferase activity(GO:0050146) |
| 0.2 | 1.4 | GO:0001875 | lipopolysaccharide receptor activity(GO:0001875) |
| 0.2 | 3.0 | GO:0032051 | clathrin light chain binding(GO:0032051) |
| 0.2 | 0.5 | GO:0031821 | G-protein coupled serotonin receptor binding(GO:0031821) |
| 0.2 | 5.3 | GO:0045295 | gamma-catenin binding(GO:0045295) |
| 0.2 | 2.9 | GO:0004028 | 3-chloroallyl aldehyde dehydrogenase activity(GO:0004028) |
| 0.2 | 0.5 | GO:0044715 | 8-oxo-dGDP phosphatase activity(GO:0044715) |
| 0.2 | 0.5 | GO:0004939 | beta-adrenergic receptor activity(GO:0004939) |
| 0.2 | 0.7 | GO:0070119 | ciliary neurotrophic factor binding(GO:0070119) |
| 0.2 | 2.1 | GO:0098599 | palmitoyl-(protein) hydrolase activity(GO:0008474) palmitoyl hydrolase activity(GO:0098599) |
| 0.2 | 0.5 | GO:0030617 | transforming growth factor beta receptor, inhibitory cytoplasmic mediator activity(GO:0030617) |
| 0.2 | 0.5 | GO:0052858 | peptidyl-lysine N-acetyltransferase activity, acting on acetyl phosphate as donor(GO:0052858) |
| 0.2 | 1.6 | GO:0010340 | carboxyl-O-methyltransferase activity(GO:0010340) protein carboxyl O-methyltransferase activity(GO:0051998) |
| 0.2 | 1.7 | GO:0055131 | C3HC4-type RING finger domain binding(GO:0055131) |
| 0.2 | 1.5 | GO:0001025 | RNA polymerase III transcription factor binding(GO:0001025) |
| 0.1 | 0.6 | GO:0004711 | ribosomal protein S6 kinase activity(GO:0004711) |
| 0.1 | 1.0 | GO:0008479 | queuine tRNA-ribosyltransferase activity(GO:0008479) |
| 0.1 | 2.2 | GO:0035612 | AP-2 adaptor complex binding(GO:0035612) |
| 0.1 | 1.4 | GO:1990825 | sequence-specific mRNA binding(GO:1990825) |
| 0.1 | 0.8 | GO:0030976 | thiamine pyrophosphate binding(GO:0030976) |
| 0.1 | 0.4 | GO:0090541 | MIT domain binding(GO:0090541) |
| 0.1 | 1.2 | GO:0016907 | G-protein coupled acetylcholine receptor activity(GO:0016907) |
| 0.1 | 0.7 | GO:0070404 | NADH binding(GO:0070404) |
| 0.1 | 2.9 | GO:0030306 | ADP-ribosylation factor binding(GO:0030306) |
| 0.1 | 1.4 | GO:0032138 | single base insertion or deletion binding(GO:0032138) |
| 0.1 | 0.5 | GO:0008174 | mRNA methyltransferase activity(GO:0008174) |
| 0.1 | 0.4 | GO:0004874 | aryl hydrocarbon receptor activity(GO:0004874) |
| 0.1 | 2.3 | GO:0003688 | DNA replication origin binding(GO:0003688) |
| 0.1 | 4.3 | GO:0005283 | sodium:amino acid symporter activity(GO:0005283) |
| 0.1 | 4.2 | GO:0097109 | neuroligin family protein binding(GO:0097109) |
| 0.1 | 7.5 | GO:0031492 | nucleosomal DNA binding(GO:0031492) |
| 0.1 | 3.9 | GO:0008510 | sodium:bicarbonate symporter activity(GO:0008510) |
| 0.1 | 1.6 | GO:0016176 | superoxide-generating NADPH oxidase activator activity(GO:0016176) |
| 0.1 | 0.4 | GO:0099530 | G-protein coupled receptor activity involved in regulation of postsynaptic membrane potential(GO:0099530) |
| 0.1 | 1.3 | GO:0015349 | thyroid hormone transmembrane transporter activity(GO:0015349) |
| 0.1 | 0.4 | GO:0047184 | 1-acylglycerophosphocholine O-acyltransferase activity(GO:0047184) |
| 0.1 | 0.8 | GO:0035402 | histone kinase activity (H3-T11 specific)(GO:0035402) |
| 0.1 | 1.5 | GO:0043995 | histone acetyltransferase activity (H4-K5 specific)(GO:0043995) histone acetyltransferase activity (H4-K8 specific)(GO:0043996) histone acetyltransferase activity (H4-K16 specific)(GO:0046972) |
| 0.1 | 0.4 | GO:0004336 | galactosylceramidase activity(GO:0004336) |
| 0.1 | 2.9 | GO:0008603 | cAMP-dependent protein kinase regulator activity(GO:0008603) |
| 0.1 | 2.1 | GO:0019957 | C-X-C chemokine receptor activity(GO:0016494) C-C chemokine binding(GO:0019957) |
| 0.1 | 0.9 | GO:0004800 | thyroxine 5'-deiodinase activity(GO:0004800) |
| 0.1 | 0.7 | GO:0036033 | mediator complex binding(GO:0036033) |
| 0.1 | 0.7 | GO:0015315 | hexose phosphate transmembrane transporter activity(GO:0015119) organophosphate:inorganic phosphate antiporter activity(GO:0015315) hexose-phosphate:inorganic phosphate antiporter activity(GO:0015526) glucose 6-phosphate:inorganic phosphate antiporter activity(GO:0061513) |
| 0.1 | 0.5 | GO:0008568 | microtubule-severing ATPase activity(GO:0008568) |
| 0.1 | 1.9 | GO:0022820 | potassium:chloride symporter activity(GO:0015379) potassium ion symporter activity(GO:0022820) |
| 0.1 | 0.9 | GO:0005375 | copper ion transmembrane transporter activity(GO:0005375) |
| 0.1 | 2.2 | GO:0003680 | AT DNA binding(GO:0003680) |
| 0.1 | 3.6 | GO:0050811 | GABA receptor binding(GO:0050811) |
| 0.1 | 1.3 | GO:0004634 | phosphopyruvate hydratase activity(GO:0004634) |
| 0.1 | 4.8 | GO:0016881 | acid-amino acid ligase activity(GO:0016881) |
| 0.1 | 11.3 | GO:0019003 | GDP binding(GO:0019003) |
| 0.1 | 0.7 | GO:0061649 | ubiquitinated histone binding(GO:0061649) |
| 0.1 | 3.4 | GO:0070003 | threonine-type endopeptidase activity(GO:0004298) threonine-type peptidase activity(GO:0070003) |
| 0.1 | 0.9 | GO:0008853 | exodeoxyribonuclease III activity(GO:0008853) |
| 0.1 | 3.6 | GO:0016805 | dipeptidase activity(GO:0016805) |
| 0.1 | 2.6 | GO:0004185 | serine-type carboxypeptidase activity(GO:0004185) |
| 0.1 | 3.2 | GO:0008266 | poly(U) RNA binding(GO:0008266) |
| 0.1 | 0.8 | GO:0016833 | oxo-acid-lyase activity(GO:0016833) |
| 0.1 | 4.7 | GO:0004708 | MAP kinase kinase activity(GO:0004708) |
| 0.1 | 2.5 | GO:0034450 | ubiquitin-ubiquitin ligase activity(GO:0034450) |
| 0.1 | 4.6 | GO:0005540 | hyaluronic acid binding(GO:0005540) |
| 0.1 | 0.6 | GO:0032422 | purine-rich negative regulatory element binding(GO:0032422) |
| 0.1 | 0.4 | GO:0061752 | telomeric repeat-containing RNA binding(GO:0061752) |
| 0.1 | 0.5 | GO:0043035 | chromatin insulator sequence binding(GO:0043035) |
| 0.1 | 3.8 | GO:0005388 | calcium-transporting ATPase activity(GO:0005388) |
| 0.1 | 0.3 | GO:0034057 | RNA strand-exchange activity(GO:0034057) |
| 0.1 | 0.3 | GO:0046969 | histone deacetylase activity (H3-K9 specific)(GO:0032129) NAD-dependent histone deacetylase activity (H3-K9 specific)(GO:0046969) |
| 0.1 | 0.5 | GO:0004348 | glucosylceramidase activity(GO:0004348) |
| 0.1 | 0.7 | GO:0050119 | N-acetylglucosamine deacetylase activity(GO:0050119) |
| 0.1 | 4.5 | GO:0016538 | cyclin-dependent protein serine/threonine kinase regulator activity(GO:0016538) |
| 0.1 | 8.3 | GO:0004402 | histone acetyltransferase activity(GO:0004402) |
| 0.1 | 2.6 | GO:0080025 | phosphatidylinositol-3,5-bisphosphate binding(GO:0080025) |
| 0.1 | 0.8 | GO:0003917 | DNA topoisomerase type I activity(GO:0003917) |
| 0.1 | 0.6 | GO:0042030 | ATPase inhibitor activity(GO:0042030) |
| 0.1 | 0.6 | GO:0097322 | 7SK snRNA binding(GO:0097322) |
| 0.1 | 0.4 | GO:0032406 | MutLbeta complex binding(GO:0032406) MutSbeta complex binding(GO:0032408) |
| 0.1 | 0.3 | GO:0004917 | interleukin-7 receptor activity(GO:0004917) |
| 0.1 | 0.3 | GO:0008193 | tRNA guanylyltransferase activity(GO:0008193) |
| 0.1 | 0.5 | GO:0008321 | Ral guanyl-nucleotide exchange factor activity(GO:0008321) |
| 0.1 | 2.2 | GO:0030215 | semaphorin receptor binding(GO:0030215) |
| 0.1 | 0.3 | GO:0004583 | dolichyl-phosphate-glucose-glycolipid alpha-glucosyltransferase activity(GO:0004583) |
| 0.1 | 1.8 | GO:0001206 | transcriptional repressor activity, RNA polymerase II distal enhancer sequence-specific binding(GO:0001206) |
| 0.1 | 0.6 | GO:0097199 | cysteine-type endopeptidase activity involved in apoptotic signaling pathway(GO:0097199) |
| 0.1 | 0.7 | GO:0051032 | nucleic acid transmembrane transporter activity(GO:0051032) RNA transmembrane transporter activity(GO:0051033) |
| 0.1 | 1.1 | GO:0070181 | small ribosomal subunit rRNA binding(GO:0070181) |
| 0.1 | 4.2 | GO:0005109 | frizzled binding(GO:0005109) |
| 0.1 | 1.1 | GO:0017034 | Rap guanyl-nucleotide exchange factor activity(GO:0017034) |
| 0.1 | 0.6 | GO:0015321 | sodium-dependent phosphate transmembrane transporter activity(GO:0015321) |
| 0.1 | 0.4 | GO:0016822 | hydrolase activity, acting on acid carbon-carbon bonds(GO:0016822) hydrolase activity, acting on acid carbon-carbon bonds, in ketonic substances(GO:0016823) |
| 0.1 | 0.6 | GO:0044729 | hemi-methylated DNA-binding(GO:0044729) |
| 0.1 | 1.9 | GO:0031701 | angiotensin receptor binding(GO:0031701) type 1 angiotensin receptor binding(GO:0031702) |
| 0.1 | 2.9 | GO:0047555 | 3',5'-cyclic-GMP phosphodiesterase activity(GO:0047555) |
| 0.1 | 0.6 | GO:1990226 | histone methyltransferase binding(GO:1990226) |
| 0.1 | 0.6 | GO:0008454 | alpha-1,3-mannosylglycoprotein 4-beta-N-acetylglucosaminyltransferase activity(GO:0008454) |
| 0.1 | 1.9 | GO:0031852 | mu-type opioid receptor binding(GO:0031852) |
| 0.1 | 0.5 | GO:0004677 | DNA-dependent protein kinase activity(GO:0004677) |
| 0.1 | 1.5 | GO:0004089 | carbonate dehydratase activity(GO:0004089) |
| 0.1 | 3.2 | GO:0000983 | transcription factor activity, RNA polymerase II core promoter sequence-specific(GO:0000983) |
| 0.1 | 1.1 | GO:0005225 | volume-sensitive anion channel activity(GO:0005225) |
| 0.1 | 3.2 | GO:0005164 | tumor necrosis factor receptor binding(GO:0005164) |
| 0.1 | 0.5 | GO:0043426 | MRF binding(GO:0043426) |
| 0.1 | 0.3 | GO:0043813 | phosphatidylinositol-3,5-bisphosphate 5-phosphatase activity(GO:0043813) |
| 0.1 | 1.2 | GO:0003996 | acyl-CoA ligase activity(GO:0003996) |
| 0.1 | 1.3 | GO:0034236 | protein kinase A catalytic subunit binding(GO:0034236) |
| 0.1 | 0.5 | GO:0047298 | 4-aminobutyrate transaminase activity(GO:0003867) succinate-semialdehyde dehydrogenase binding(GO:0032145) (S)-3-amino-2-methylpropionate transaminase activity(GO:0047298) |
| 0.1 | 2.0 | GO:0008499 | UDP-galactose:beta-N-acetylglucosamine beta-1,3-galactosyltransferase activity(GO:0008499) |
| 0.1 | 0.8 | GO:0019534 | toxin transporter activity(GO:0019534) |
| 0.1 | 0.6 | GO:0003886 | DNA (cytosine-5-)-methyltransferase activity(GO:0003886) |
| 0.1 | 2.7 | GO:0017025 | TBP-class protein binding(GO:0017025) |
| 0.1 | 0.6 | GO:0016618 | hydroxypyruvate reductase activity(GO:0016618) glyoxylate reductase (NADP) activity(GO:0030267) |
| 0.1 | 1.5 | GO:0016857 | racemase and epimerase activity, acting on carbohydrates and derivatives(GO:0016857) |
| 0.1 | 1.2 | GO:0003746 | translation elongation factor activity(GO:0003746) |
| 0.1 | 0.5 | GO:0008172 | S-methyltransferase activity(GO:0008172) |
| 0.1 | 1.1 | GO:0050544 | arachidonic acid binding(GO:0050544) |
| 0.1 | 0.8 | GO:0035312 | 5'-3' exodeoxyribonuclease activity(GO:0035312) |
| 0.1 | 0.5 | GO:0015925 | galactosidase activity(GO:0015925) |
| 0.1 | 1.5 | GO:0005522 | profilin binding(GO:0005522) |
| 0.1 | 3.3 | GO:0008157 | protein phosphatase 1 binding(GO:0008157) |
| 0.1 | 0.3 | GO:0016812 | hydrolase activity, acting on carbon-nitrogen (but not peptide) bonds, in cyclic amides(GO:0016812) |
| 0.1 | 1.5 | GO:0032266 | phosphatidylinositol-3-phosphate binding(GO:0032266) |
| 0.1 | 0.3 | GO:0019770 | IgG receptor activity(GO:0019770) |
| 0.1 | 0.9 | GO:0001094 | TFIID-class transcription factor binding(GO:0001094) |
| 0.1 | 0.4 | GO:1904288 | BAT3 complex binding(GO:1904288) |
| 0.1 | 0.7 | GO:0015143 | urate transmembrane transporter activity(GO:0015143) salt transmembrane transporter activity(GO:1901702) |
| 0.1 | 0.2 | GO:0004615 | phosphomannomutase activity(GO:0004615) |
| 0.1 | 0.2 | GO:0071074 | eukaryotic initiation factor eIF2 binding(GO:0071074) |
| 0.1 | 2.1 | GO:0004602 | glutathione peroxidase activity(GO:0004602) |
| 0.1 | 0.5 | GO:0004694 | eukaryotic translation initiation factor 2alpha kinase activity(GO:0004694) |
| 0.1 | 0.7 | GO:0004332 | fructose-bisphosphate aldolase activity(GO:0004332) |
| 0.1 | 0.9 | GO:0005537 | mannose binding(GO:0005537) |
| 0.1 | 0.5 | GO:0008312 | 7S RNA binding(GO:0008312) |
| 0.1 | 21.0 | GO:0003924 | GTPase activity(GO:0003924) |
| 0.1 | 1.0 | GO:0019531 | oxalate transmembrane transporter activity(GO:0019531) |
| 0.1 | 0.1 | GO:0019144 | ADP-sugar diphosphatase activity(GO:0019144) |
| 0.1 | 0.9 | GO:0038036 | sphingosine-1-phosphate receptor activity(GO:0038036) |
| 0.1 | 0.6 | GO:0097371 | MDM2/MDM4 family protein binding(GO:0097371) |
| 0.1 | 0.7 | GO:0004526 | ribonuclease P activity(GO:0004526) |
| 0.1 | 0.2 | GO:0004663 | Rab geranylgeranyltransferase activity(GO:0004663) |
| 0.1 | 2.0 | GO:0004697 | protein kinase C activity(GO:0004697) |
| 0.1 | 0.3 | GO:1990932 | 5.8S rRNA binding(GO:1990932) |
| 0.1 | 1.0 | GO:0031681 | G-protein beta-subunit binding(GO:0031681) |
| 0.1 | 0.2 | GO:0048531 | beta-1,3-galactosyltransferase activity(GO:0048531) |
| 0.1 | 0.1 | GO:0008422 | beta-glucosidase activity(GO:0008422) |
| 0.1 | 1.7 | GO:0000030 | mannosyltransferase activity(GO:0000030) |
| 0.0 | 0.3 | GO:0004427 | inorganic diphosphatase activity(GO:0004427) |
| 0.0 | 0.9 | GO:0017134 | fibroblast growth factor binding(GO:0017134) |
| 0.0 | 0.4 | GO:0005222 | intracellular cAMP activated cation channel activity(GO:0005222) |
| 0.0 | 1.7 | GO:0000339 | RNA cap binding(GO:0000339) |
| 0.0 | 6.5 | GO:0051219 | phosphoprotein binding(GO:0051219) |
| 0.0 | 5.1 | GO:0048306 | calcium-dependent protein binding(GO:0048306) |
| 0.0 | 0.5 | GO:0003910 | DNA ligase (ATP) activity(GO:0003910) |
| 0.0 | 0.2 | GO:0031683 | G-protein beta/gamma-subunit complex binding(GO:0031683) |
| 0.0 | 1.7 | GO:0071855 | neuropeptide receptor binding(GO:0071855) |
| 0.0 | 0.7 | GO:0036312 | phosphatidylinositol 3-kinase regulatory subunit binding(GO:0036312) |
| 0.0 | 0.8 | GO:0034452 | dynactin binding(GO:0034452) |
| 0.0 | 4.2 | GO:0070491 | repressing transcription factor binding(GO:0070491) |
| 0.0 | 5.9 | GO:0001618 | virus receptor activity(GO:0001618) |
| 0.0 | 1.6 | GO:0001968 | fibronectin binding(GO:0001968) |
| 0.0 | 1.0 | GO:0052629 | phosphatidylinositol-3,5-bisphosphate 3-phosphatase activity(GO:0052629) |
| 0.0 | 1.3 | GO:0004115 | 3',5'-cyclic-AMP phosphodiesterase activity(GO:0004115) |
| 0.0 | 0.6 | GO:0017162 | aryl hydrocarbon receptor binding(GO:0017162) |
| 0.0 | 1.9 | GO:0051010 | microtubule plus-end binding(GO:0051010) |
| 0.0 | 1.0 | GO:0003708 | retinoic acid receptor activity(GO:0003708) |
| 0.0 | 0.6 | GO:0000774 | adenyl-nucleotide exchange factor activity(GO:0000774) |
| 0.0 | 0.2 | GO:0017095 | heparan sulfate 6-O-sulfotransferase activity(GO:0017095) |
| 0.0 | 0.2 | GO:0004949 | cannabinoid receptor activity(GO:0004949) |
| 0.0 | 0.2 | GO:0036435 | K48-linked polyubiquitin binding(GO:0036435) |
| 0.0 | 0.9 | GO:0005391 | sodium:potassium-exchanging ATPase activity(GO:0005391) |
| 0.0 | 0.4 | GO:0008160 | protein tyrosine phosphatase activator activity(GO:0008160) |
| 0.0 | 2.8 | GO:0004683 | calmodulin-dependent protein kinase activity(GO:0004683) |
| 0.0 | 0.2 | GO:0004965 | G-protein coupled GABA receptor activity(GO:0004965) |
| 0.0 | 0.1 | GO:0070890 | L-ascorbate:sodium symporter activity(GO:0008520) L-ascorbic acid transporter activity(GO:0015229) sodium-dependent L-ascorbate transmembrane transporter activity(GO:0070890) |
| 0.0 | 0.9 | GO:0015347 | sodium-independent organic anion transmembrane transporter activity(GO:0015347) |
| 0.0 | 2.4 | GO:0001205 | transcriptional activator activity, RNA polymerase II distal enhancer sequence-specific binding(GO:0001205) |
| 0.0 | 1.7 | GO:0005484 | SNAP receptor activity(GO:0005484) |
| 0.0 | 0.4 | GO:0001042 | RNA polymerase I core binding(GO:0001042) |
| 0.0 | 0.2 | GO:0003960 | NADPH:quinone reductase activity(GO:0003960) |
| 0.0 | 0.4 | GO:0035242 | protein-arginine omega-N asymmetric methyltransferase activity(GO:0035242) |
| 0.0 | 20.1 | GO:0015631 | tubulin binding(GO:0015631) |
| 0.0 | 1.0 | GO:0001056 | RNA polymerase III activity(GO:0001056) |
| 0.0 | 3.8 | GO:0019213 | deacetylase activity(GO:0019213) |
| 0.0 | 0.7 | GO:0043522 | leucine zipper domain binding(GO:0043522) |
| 0.0 | 0.8 | GO:0015271 | outward rectifier potassium channel activity(GO:0015271) |
| 0.0 | 1.5 | GO:0070530 | K63-linked polyubiquitin binding(GO:0070530) |
| 0.0 | 0.1 | GO:0000253 | 3-keto sterol reductase activity(GO:0000253) |
| 0.0 | 0.4 | GO:0003964 | telomerase activity(GO:0003720) RNA-directed DNA polymerase activity(GO:0003964) |
| 0.0 | 1.1 | GO:0051537 | 2 iron, 2 sulfur cluster binding(GO:0051537) |
| 0.0 | 0.3 | GO:0035368 | selenocysteine insertion sequence binding(GO:0035368) |
| 0.0 | 0.3 | GO:0070097 | delta-catenin binding(GO:0070097) |
| 0.0 | 1.1 | GO:0003756 | protein disulfide isomerase activity(GO:0003756) intramolecular oxidoreductase activity, transposing S-S bonds(GO:0016864) |
| 0.0 | 0.4 | GO:0038049 | transcription factor activity, ligand-activated RNA polymerase II transcription factor binding(GO:0038049) |
| 0.0 | 0.3 | GO:0034513 | box H/ACA snoRNA binding(GO:0034513) |
| 0.0 | 0.2 | GO:0003938 | IMP dehydrogenase activity(GO:0003938) |
| 0.0 | 1.6 | GO:0004033 | aldo-keto reductase (NADP) activity(GO:0004033) |
| 0.0 | 1.5 | GO:0048365 | Rac GTPase binding(GO:0048365) |
| 0.0 | 0.3 | GO:0005347 | ATP transmembrane transporter activity(GO:0005347) ADP transmembrane transporter activity(GO:0015217) |
| 0.0 | 0.7 | GO:0016018 | cyclosporin A binding(GO:0016018) |
| 0.0 | 0.9 | GO:0019992 | diacylglycerol binding(GO:0019992) |
| 0.0 | 0.2 | GO:0008187 | poly-pyrimidine tract binding(GO:0008187) |
| 0.0 | 0.7 | GO:0043274 | phospholipase binding(GO:0043274) |
| 0.0 | 0.5 | GO:0017049 | GTP-Rho binding(GO:0017049) |
| 0.0 | 6.5 | GO:0005200 | structural constituent of cytoskeleton(GO:0005200) |
| 0.0 | 0.4 | GO:0005078 | MAP-kinase scaffold activity(GO:0005078) |
| 0.0 | 3.2 | GO:0004722 | protein serine/threonine phosphatase activity(GO:0004722) |
| 0.0 | 0.2 | GO:0050510 | N-acetylgalactosaminyl-proteoglycan 3-beta-glucuronosyltransferase activity(GO:0050510) |
| 0.0 | 0.3 | GO:0042978 | ornithine decarboxylase activator activity(GO:0042978) |
| 0.0 | 4.2 | GO:0000149 | SNARE binding(GO:0000149) |
| 0.0 | 1.4 | GO:0005154 | epidermal growth factor receptor binding(GO:0005154) |
| 0.0 | 1.5 | GO:0036002 | pre-mRNA binding(GO:0036002) |
| 0.0 | 0.4 | GO:0022833 | mechanically-gated ion channel activity(GO:0008381) mechanically gated channel activity(GO:0022833) |
| 0.0 | 0.4 | GO:0030618 | transforming growth factor beta receptor, pathway-specific cytoplasmic mediator activity(GO:0030618) |
| 0.0 | 1.4 | GO:0030296 | protein tyrosine kinase activator activity(GO:0030296) |
| 0.0 | 1.3 | GO:0005086 | ARF guanyl-nucleotide exchange factor activity(GO:0005086) |
| 0.0 | 0.2 | GO:0000155 | phosphorelay sensor kinase activity(GO:0000155) |
| 0.0 | 0.3 | GO:0004396 | glucokinase activity(GO:0004340) hexokinase activity(GO:0004396) fructokinase activity(GO:0008865) mannokinase activity(GO:0019158) |
| 0.0 | 0.5 | GO:0019870 | potassium channel inhibitor activity(GO:0019870) |
| 0.0 | 0.6 | GO:0015467 | G-protein activated inward rectifier potassium channel activity(GO:0015467) |
| 0.0 | 0.4 | GO:0035374 | chondroitin sulfate binding(GO:0035374) |
| 0.0 | 0.3 | GO:0015272 | ATP-activated inward rectifier potassium channel activity(GO:0015272) |
| 0.0 | 0.5 | GO:0098748 | clathrin adaptor activity(GO:0035615) endocytic adaptor activity(GO:0098748) |
| 0.0 | 0.1 | GO:0070039 | rRNA (guanosine-2'-O-)-methyltransferase activity(GO:0070039) |
| 0.0 | 1.6 | GO:0008536 | Ran GTPase binding(GO:0008536) |
| 0.0 | 0.1 | GO:0030550 | acetylcholine receptor inhibitor activity(GO:0030550) |
| 0.0 | 1.7 | GO:0016763 | transferase activity, transferring pentosyl groups(GO:0016763) |
| 0.0 | 0.2 | GO:0004797 | thymidine kinase activity(GO:0004797) |
| 0.0 | 1.5 | GO:0017080 | sodium channel regulator activity(GO:0017080) |
| 0.0 | 1.6 | GO:0031490 | chromatin DNA binding(GO:0031490) |
| 0.0 | 11.8 | GO:0005096 | GTPase activator activity(GO:0005096) |
| 0.0 | 2.2 | GO:0005070 | SH3/SH2 adaptor activity(GO:0005070) |
| 0.0 | 0.4 | GO:0005021 | vascular endothelial growth factor-activated receptor activity(GO:0005021) |
| 0.0 | 1.9 | GO:0017112 | Rab guanyl-nucleotide exchange factor activity(GO:0017112) |
| 0.0 | 0.9 | GO:0043539 | protein serine/threonine kinase activator activity(GO:0043539) |
| 0.0 | 0.0 | GO:0005168 | neurotrophin TRKA receptor binding(GO:0005168) |
| 0.0 | 0.2 | GO:0046976 | histone methyltransferase activity (H3-K27 specific)(GO:0046976) |
| 0.0 | 0.1 | GO:0047391 | alkylglycerophosphoethanolamine phosphodiesterase activity(GO:0047391) |
| 0.0 | 0.2 | GO:0034648 | histone demethylase activity (H3-dimethyl-K4 specific)(GO:0034648) |
| 0.0 | 5.1 | GO:0005089 | Rho guanyl-nucleotide exchange factor activity(GO:0005089) |
| 0.0 | 0.2 | GO:1990247 | N6-methyladenosine-containing RNA binding(GO:1990247) |
| 0.0 | 0.7 | GO:0008080 | N-acetyltransferase activity(GO:0008080) |
| 0.0 | 1.2 | GO:0001102 | RNA polymerase II activating transcription factor binding(GO:0001102) |
| 0.0 | 0.2 | GO:0004430 | 1-phosphatidylinositol 4-kinase activity(GO:0004430) |
| 0.0 | 0.3 | GO:0016861 | intramolecular oxidoreductase activity, interconverting aldoses and ketoses(GO:0016861) |
| 0.0 | 0.2 | GO:0004726 | non-membrane spanning protein tyrosine phosphatase activity(GO:0004726) |
| 0.0 | 0.4 | GO:1990381 | ubiquitin-specific protease binding(GO:1990381) |
| 0.0 | 0.7 | GO:0008327 | methyl-CpG binding(GO:0008327) |
| 0.0 | 0.8 | GO:0005158 | insulin receptor binding(GO:0005158) |
| 0.0 | 0.2 | GO:0031434 | mitogen-activated protein kinase kinase binding(GO:0031434) |
| 0.0 | 1.4 | GO:0017137 | Rab GTPase binding(GO:0017137) |
| 0.0 | 4.4 | GO:0001078 | transcriptional repressor activity, RNA polymerase II core promoter proximal region sequence-specific binding(GO:0001078) |
| 0.0 | 0.7 | GO:0004622 | lysophospholipase activity(GO:0004622) |
| 0.0 | 0.7 | GO:0019894 | kinesin binding(GO:0019894) |
| 0.0 | 0.3 | GO:0008199 | ferric iron binding(GO:0008199) |
| 0.0 | 0.2 | GO:0000150 | recombinase activity(GO:0000150) |
| 0.0 | 3.8 | GO:0016747 | transferase activity, transferring acyl groups other than amino-acyl groups(GO:0016747) |
| 0.0 | 1.6 | GO:0002039 | p53 binding(GO:0002039) |
| 0.0 | 0.2 | GO:0004727 | prenylated protein tyrosine phosphatase activity(GO:0004727) |
| 0.0 | 1.3 | GO:0098811 | transcriptional activator activity, RNA polymerase II transcription factor binding(GO:0001190) transcriptional repressor activity, RNA polymerase II activating transcription factor binding(GO:0098811) |
| 0.0 | 0.1 | GO:0035198 | miRNA binding(GO:0035198) |
| 0.0 | 0.3 | GO:0016780 | phosphotransferase activity, for other substituted phosphate groups(GO:0016780) |
| 0.0 | 0.1 | GO:0004577 | N-acetylglucosaminyldiphosphodolichol N-acetylglucosaminyltransferase activity(GO:0004577) |
| 0.0 | 0.6 | GO:0004198 | calcium-dependent cysteine-type endopeptidase activity(GO:0004198) |
| 0.0 | 1.8 | GO:0003725 | double-stranded RNA binding(GO:0003725) |
| 0.0 | 0.9 | GO:0017022 | myosin binding(GO:0017022) |
| 0.0 | 0.4 | GO:0003836 | beta-galactoside (CMP) alpha-2,3-sialyltransferase activity(GO:0003836) |
| 0.0 | 0.6 | GO:0016701 | oxidoreductase activity, acting on single donors with incorporation of molecular oxygen(GO:0016701) oxidoreductase activity, acting on single donors with incorporation of molecular oxygen, incorporation of two atoms of oxygen(GO:0016702) |
| 0.0 | 0.3 | GO:0015643 | toxic substance binding(GO:0015643) |
| 0.0 | 0.0 | GO:0001133 | RNA polymerase II transcription factor activity, sequence-specific transcription regulatory region DNA binding(GO:0001133) |
| 0.0 | 0.1 | GO:0004673 | protein histidine kinase activity(GO:0004673) |
| 0.0 | 0.1 | GO:0004305 | ethanolamine kinase activity(GO:0004305) |
| 0.0 | 0.0 | GO:0000995 | transcription factor activity, core RNA polymerase III binding(GO:0000995) |
| 0.0 | 0.3 | GO:0001223 | transcription coactivator binding(GO:0001223) |
| 0.0 | 0.5 | GO:0030971 | receptor tyrosine kinase binding(GO:0030971) |
| 0.0 | 0.1 | GO:0022897 | peptide:proton symporter activity(GO:0015333) proton-dependent peptide secondary active transmembrane transporter activity(GO:0022897) |
| 0.0 | 0.1 | GO:1904264 | ubiquitin protein ligase activity involved in ERAD pathway(GO:1904264) |
| 0.0 | 0.1 | GO:0005138 | interleukin-6 receptor binding(GO:0005138) |
| 0.0 | 1.4 | GO:0019903 | protein phosphatase binding(GO:0019903) |
| 0.0 | 0.4 | GO:0070034 | telomerase RNA binding(GO:0070034) |
| 0.0 | 1.0 | GO:0001104 | RNA polymerase II transcription cofactor activity(GO:0001104) |
| 0.0 | 0.0 | GO:0034512 | box C/D snoRNA binding(GO:0034512) |
| 0.0 | 0.2 | GO:0035256 | G-protein coupled glutamate receptor binding(GO:0035256) |
| 0.0 | 0.4 | GO:0008175 | tRNA methyltransferase activity(GO:0008175) |
| 0.0 | 0.0 | GO:0004980 | melanocyte-stimulating hormone receptor activity(GO:0004980) |
| 0.0 | 0.3 | GO:0050750 | low-density lipoprotein particle receptor binding(GO:0050750) |
| 0.0 | 0.2 | GO:0005523 | tropomyosin binding(GO:0005523) |
| 0.0 | 0.1 | GO:0000014 | single-stranded DNA endodeoxyribonuclease activity(GO:0000014) |
| 0.0 | 0.1 | GO:0031013 | troponin I binding(GO:0031013) |
| 0.0 | 0.2 | GO:0005149 | interleukin-1 receptor binding(GO:0005149) |
| 0.0 | 0.0 | GO:0008294 | calcium- and calmodulin-responsive adenylate cyclase activity(GO:0008294) |
| 0.0 | 0.4 | GO:0005521 | lamin binding(GO:0005521) |
| 0.0 | 0.1 | GO:0052723 | inositol-1,3,4,5,6-pentakisphosphate kinase activity(GO:0000827) inositol hexakisphosphate kinase activity(GO:0000828) inositol heptakisphosphate kinase activity(GO:0000829) inositol hexakisphosphate 5-kinase activity(GO:0000832) inositol hexakisphosphate 1-kinase activity(GO:0052723) inositol hexakisphosphate 3-kinase activity(GO:0052724) |
| 0.0 | 0.0 | GO:0004449 | isocitrate dehydrogenase (NAD+) activity(GO:0004449) |
| 0.0 | 0.3 | GO:0042923 | neuropeptide binding(GO:0042923) |
| 0.0 | 0.3 | GO:0004062 | aryl sulfotransferase activity(GO:0004062) |
| 0.0 | 0.3 | GO:0031491 | nucleosome binding(GO:0031491) |
| 0.0 | 0.7 | GO:0042826 | histone deacetylase binding(GO:0042826) |
| 0.0 | 0.3 | GO:0004012 | phospholipid-translocating ATPase activity(GO:0004012) |
| 0.0 | 0.1 | GO:0008297 | single-stranded DNA exodeoxyribonuclease activity(GO:0008297) |
| 0.0 | 0.4 | GO:0042162 | telomeric DNA binding(GO:0042162) |
| 0.0 | 0.0 | GO:0035877 | death effector domain binding(GO:0035877) |
| 0.0 | 0.1 | GO:0038132 | neuregulin binding(GO:0038132) |
| 0.0 | 0.2 | GO:0019855 | calcium channel inhibitor activity(GO:0019855) |
Gene overrepresentation in curated gene sets: canonical pathways category:
| Log-likelihood per target | Total log-likelihood | Term | Description |
|---|---|---|---|
| 0.3 | 9.7 | SA G1 AND S PHASES | Cdk2, 4, and 6 bind cyclin D in G1, while cdk2/cyclin E promotes the G1/S transition. |
| 0.3 | 6.7 | PID P38 GAMMA DELTA PATHWAY | Signaling mediated by p38-gamma and p38-delta |
| 0.2 | 6.7 | SA PROGRAMMED CELL DEATH | Programmed cell death, or apoptosis, eliminates damaged or unneeded cells. |
| 0.2 | 11.3 | PID WNT CANONICAL PATHWAY | Canonical Wnt signaling pathway |
| 0.2 | 6.8 | SA MMP CYTOKINE CONNECTION | Cytokines can induce activation of matrix metalloproteinases, which degrade extracellular matrix. |
| 0.1 | 0.9 | PID S1P S1P4 PATHWAY | S1P4 pathway |
| 0.1 | 17.8 | PID MTOR 4PATHWAY | mTOR signaling pathway |
| 0.1 | 5.9 | PID MYC PATHWAY | C-MYC pathway |
| 0.1 | 2.3 | PID S1P S1P3 PATHWAY | S1P3 pathway |
| 0.1 | 8.4 | PID HIF2PATHWAY | HIF-2-alpha transcription factor network |
| 0.1 | 2.4 | PID TCR JNK PATHWAY | JNK signaling in the CD4+ TCR pathway |
| 0.1 | 3.8 | ST G ALPHA S PATHWAY | G alpha s Pathway |
| 0.1 | 5.1 | PID INSULIN GLUCOSE PATHWAY | Insulin-mediated glucose transport |
| 0.1 | 3.5 | PID S1P S1P1 PATHWAY | S1P1 pathway |
| 0.1 | 4.3 | ST ERK1 ERK2 MAPK PATHWAY | ERK1/ERK2 MAPK Pathway |
| 0.1 | 1.5 | ST TYPE I INTERFERON PATHWAY | Type I Interferon (alpha/beta IFN) Pathway |
| 0.1 | 3.5 | PID IL8 CXCR1 PATHWAY | IL8- and CXCR1-mediated signaling events |
| 0.1 | 9.8 | PID RAC1 PATHWAY | RAC1 signaling pathway |
| 0.1 | 1.8 | PID AR NONGENOMIC PATHWAY | Nongenotropic Androgen signaling |
| 0.1 | 3.8 | ST GA12 PATHWAY | G alpha 12 Pathway |
| 0.1 | 2.1 | PID P38 MK2 PATHWAY | p38 signaling mediated by MAPKAP kinases |
| 0.1 | 2.4 | PID TOLL ENDOGENOUS PATHWAY | Endogenous TLR signaling |
| 0.1 | 4.9 | PID FAS PATHWAY | FAS (CD95) signaling pathway |
| 0.1 | 3.0 | PID RHODOPSIN PATHWAY | Visual signal transduction: Rods |
| 0.1 | 2.5 | PID THROMBIN PAR1 PATHWAY | PAR1-mediated thrombin signaling events |
| 0.1 | 3.8 | PID ECADHERIN NASCENT AJ PATHWAY | E-cadherin signaling in the nascent adherens junction |
| 0.1 | 3.8 | PID ATM PATHWAY | ATM pathway |
| 0.1 | 2.3 | PID MAPK TRK PATHWAY | Trk receptor signaling mediated by the MAPK pathway |
| 0.1 | 0.8 | PID FRA PATHWAY | Validated transcriptional targets of AP1 family members Fra1 and Fra2 |
| 0.1 | 0.5 | PID IL2 PI3K PATHWAY | IL2 signaling events mediated by PI3K |
| 0.1 | 3.8 | PID AMB2 NEUTROPHILS PATHWAY | amb2 Integrin signaling |
| 0.1 | 2.5 | PID IL1 PATHWAY | IL1-mediated signaling events |
| 0.1 | 2.1 | PID NCADHERIN PATHWAY | N-cadherin signaling events |
| 0.1 | 1.7 | PID WNT NONCANONICAL PATHWAY | Noncanonical Wnt signaling pathway |
| 0.1 | 1.2 | PID WNT SIGNALING PATHWAY | Wnt signaling network |
| 0.1 | 2.5 | PID FCER1 PATHWAY | Fc-epsilon receptor I signaling in mast cells |
| 0.1 | 7.7 | PID HDAC CLASSI PATHWAY | Signaling events mediated by HDAC Class I |
| 0.1 | 20.0 | NABA ECM REGULATORS | Genes encoding enzymes and their regulators involved in the remodeling of the extracellular matrix |
| 0.1 | 4.0 | PID AR TF PATHWAY | Regulation of Androgen receptor activity |
| 0.1 | 5.8 | PID CMYB PATHWAY | C-MYB transcription factor network |
| 0.1 | 3.0 | PID FGF PATHWAY | FGF signaling pathway |
| 0.1 | 1.3 | PID IL8 CXCR2 PATHWAY | IL8- and CXCR2-mediated signaling events |
| 0.0 | 1.7 | PID UPA UPAR PATHWAY | Urokinase-type plasminogen activator (uPA) and uPAR-mediated signaling |
| 0.0 | 1.7 | PID SMAD2 3PATHWAY | Regulation of cytoplasmic and nuclear SMAD2/3 signaling |
| 0.0 | 1.3 | PID SYNDECAN 2 PATHWAY | Syndecan-2-mediated signaling events |
| 0.0 | 1.4 | PID ERBB1 DOWNSTREAM PATHWAY | ErbB1 downstream signaling |
| 0.0 | 3.4 | PID ARF6 PATHWAY | Arf6 signaling events |
| 0.0 | 0.7 | PID HDAC CLASSII PATHWAY | Signaling events mediated by HDAC Class II |
| 0.0 | 1.3 | PID RHOA PATHWAY | RhoA signaling pathway |
| 0.0 | 4.9 | PID AR PATHWAY | Coregulation of Androgen receptor activity |
| 0.0 | 1.1 | PID IL2 STAT5 PATHWAY | IL2 signaling events mediated by STAT5 |
| 0.0 | 1.6 | PID TCR CALCIUM PATHWAY | Calcium signaling in the CD4+ TCR pathway |
| 0.0 | 0.6 | PID INTEGRIN5 PATHWAY | Beta5 beta6 beta7 and beta8 integrin cell surface interactions |
| 0.0 | 0.6 | PID ALK2 PATHWAY | ALK2 signaling events |
| 0.0 | 1.5 | PID FAK PATHWAY | Signaling events mediated by focal adhesion kinase |
| 0.0 | 0.6 | PID RETINOIC ACID PATHWAY | Retinoic acid receptors-mediated signaling |
| 0.0 | 0.9 | PID VEGFR1 2 PATHWAY | Signaling events mediated by VEGFR1 and VEGFR2 |
| 0.0 | 2.0 | PID PDGFRB PATHWAY | PDGFR-beta signaling pathway |
| 0.0 | 1.7 | PID LKB1 PATHWAY | LKB1 signaling events |
| 0.0 | 0.9 | PID BARD1 PATHWAY | BARD1 signaling events |
| 0.0 | 1.0 | PID ERBB1 INTERNALIZATION PATHWAY | Internalization of ErbB1 |
| 0.0 | 4.8 | PID P53 DOWNSTREAM PATHWAY | Direct p53 effectors |
| 0.0 | 0.6 | PID LPA4 PATHWAY | LPA4-mediated signaling events |
| 0.0 | 1.6 | PID RB 1PATHWAY | Regulation of retinoblastoma protein |
| 0.0 | 0.7 | PID CDC42 PATHWAY | CDC42 signaling events |
| 0.0 | 0.5 | PID INSULIN PATHWAY | Insulin Pathway |
| 0.0 | 1.9 | PID HIF1 TFPATHWAY | HIF-1-alpha transcription factor network |
| 0.0 | 0.5 | PID HIV NEF PATHWAY | HIV-1 Nef: Negative effector of Fas and TNF-alpha |
| 0.0 | 0.5 | PID PI3KCI PATHWAY | Class I PI3K signaling events |
| 0.0 | 1.6 | PID P75 NTR PATHWAY | p75(NTR)-mediated signaling |
| 0.0 | 1.3 | PID TRKR PATHWAY | Neurotrophic factor-mediated Trk receptor signaling |
| 0.0 | 0.2 | PID IL3 PATHWAY | IL3-mediated signaling events |
| 0.0 | 0.9 | PID TAP63 PATHWAY | Validated transcriptional targets of TAp63 isoforms |
| 0.0 | 0.4 | PID CDC42 REG PATHWAY | Regulation of CDC42 activity |
| 0.0 | 0.9 | ST T CELL SIGNAL TRANSDUCTION | T Cell Signal Transduction |
| 0.0 | 0.7 | PID IL12 2PATHWAY | IL12-mediated signaling events |
| 0.0 | 0.2 | PID AVB3 INTEGRIN PATHWAY | Integrins in angiogenesis |
| 0.0 | 1.0 | PID RAC1 REG PATHWAY | Regulation of RAC1 activity |
| 0.0 | 0.2 | PID LYSOPHOSPHOLIPID PATHWAY | LPA receptor mediated events |
| 0.0 | 0.2 | PID CD8 TCR PATHWAY | TCR signaling in naïve CD8+ T cells |
| 0.0 | 0.3 | PID ERBB2 ERBB3 PATHWAY | ErbB2/ErbB3 signaling events |
Gene overrepresentation in curated gene sets: REACTOME pathways category:
| Log-likelihood per target | Total log-likelihood | Term | Description |
|---|---|---|---|
| 0.6 | 21.1 | REACTOME INSULIN RECEPTOR RECYCLING | Genes involved in Insulin receptor recycling |
| 0.5 | 10.8 | REACTOME BASE FREE SUGAR PHOSPHATE REMOVAL VIA THE SINGLE NUCLEOTIDE REPLACEMENT PATHWAY | Genes involved in Base-free sugar-phosphate removal via the single-nucleotide replacement pathway |
| 0.4 | 29.8 | REACTOME GLYCOSPHINGOLIPID METABOLISM | Genes involved in Glycosphingolipid metabolism |
| 0.4 | 2.1 | REACTOME BINDING AND ENTRY OF HIV VIRION | Genes involved in Binding and entry of HIV virion |
| 0.3 | 7.5 | REACTOME PROTEOLYTIC CLEAVAGE OF SNARE COMPLEX PROTEINS | Genes involved in Proteolytic cleavage of SNARE complex proteins |
| 0.2 | 5.0 | REACTOME REGULATION OF PYRUVATE DEHYDROGENASE PDH COMPLEX | Genes involved in Regulation of pyruvate dehydrogenase (PDH) complex |
| 0.2 | 1.0 | REACTOME TRANSFERRIN ENDOCYTOSIS AND RECYCLING | Genes involved in Transferrin endocytosis and recycling |
| 0.2 | 4.8 | REACTOME VITAMIN B5 PANTOTHENATE METABOLISM | Genes involved in Vitamin B5 (pantothenate) metabolism |
| 0.2 | 11.4 | REACTOME LYSOSOME VESICLE BIOGENESIS | Genes involved in Lysosome Vesicle Biogenesis |
| 0.2 | 3.2 | REACTOME MEMBRANE BINDING AND TARGETTING OF GAG PROTEINS | Genes involved in Membrane binding and targetting of GAG proteins |
| 0.2 | 13.8 | REACTOME GOLGI ASSOCIATED VESICLE BIOGENESIS | Genes involved in Golgi Associated Vesicle Biogenesis |
| 0.2 | 4.6 | REACTOME HYALURONAN UPTAKE AND DEGRADATION | Genes involved in Hyaluronan uptake and degradation |
| 0.2 | 2.7 | REACTOME RAF MAP KINASE CASCADE | Genes involved in RAF/MAP kinase cascade |
| 0.2 | 1.9 | REACTOME ENDOSOMAL VACUOLAR PATHWAY | Genes involved in Endosomal/Vacuolar pathway |
| 0.2 | 7.0 | REACTOME SEMA3A PAK DEPENDENT AXON REPULSION | Genes involved in Sema3A PAK dependent Axon repulsion |
| 0.2 | 3.3 | REACTOME PURINE CATABOLISM | Genes involved in Purine catabolism |
| 0.2 | 2.0 | REACTOME E2F ENABLED INHIBITION OF PRE REPLICATION COMPLEX FORMATION | Genes involved in E2F-enabled inhibition of pre-replication complex formation |
| 0.1 | 3.6 | REACTOME FGFR2C LIGAND BINDING AND ACTIVATION | Genes involved in FGFR2c ligand binding and activation |
| 0.1 | 4.8 | REACTOME DESTABILIZATION OF MRNA BY KSRP | Genes involved in Destabilization of mRNA by KSRP |
| 0.1 | 1.6 | REACTOME RECEPTOR LIGAND BINDING INITIATES THE SECOND PROTEOLYTIC CLEAVAGE OF NOTCH RECEPTOR | Genes involved in Receptor-ligand binding initiates the second proteolytic cleavage of Notch receptor |
| 0.1 | 2.2 | REACTOME CALNEXIN CALRETICULIN CYCLE | Genes involved in Calnexin/calreticulin cycle |
| 0.1 | 1.9 | REACTOME RAP1 SIGNALLING | Genes involved in Rap1 signalling |
| 0.1 | 4.6 | REACTOME IONOTROPIC ACTIVITY OF KAINATE RECEPTORS | Genes involved in Ionotropic activity of Kainate Receptors |
| 0.1 | 5.8 | REACTOME MEIOTIC RECOMBINATION | Genes involved in Meiotic Recombination |
| 0.1 | 6.8 | REACTOME INTRINSIC PATHWAY FOR APOPTOSIS | Genes involved in Intrinsic Pathway for Apoptosis |
| 0.1 | 1.0 | REACTOME REGULATION OF INSULIN SECRETION BY ACETYLCHOLINE | Genes involved in Regulation of Insulin Secretion by Acetylcholine |
| 0.1 | 3.8 | REACTOME G0 AND EARLY G1 | Genes involved in G0 and Early G1 |
| 0.1 | 2.7 | REACTOME ENDOSOMAL SORTING COMPLEX REQUIRED FOR TRANSPORT ESCRT | Genes involved in Endosomal Sorting Complex Required For Transport (ESCRT) |
| 0.1 | 6.2 | REACTOME GLYCOLYSIS | Genes involved in Glycolysis |
| 0.1 | 3.5 | REACTOME CTNNB1 PHOSPHORYLATION CASCADE | Genes involved in Beta-catenin phosphorylation cascade |
| 0.1 | 4.9 | REACTOME REGULATION OF GENE EXPRESSION IN BETA CELLS | Genes involved in Regulation of gene expression in beta cells |
| 0.1 | 11.2 | REACTOME INTERFERON ALPHA BETA SIGNALING | Genes involved in Interferon alpha/beta signaling |
| 0.1 | 2.2 | REACTOME TRANSPORT OF ORGANIC ANIONS | Genes involved in Transport of organic anions |
| 0.1 | 1.2 | REACTOME PLATELET SENSITIZATION BY LDL | Genes involved in Platelet sensitization by LDL |
| 0.1 | 3.3 | REACTOME ACTIVATION OF KAINATE RECEPTORS UPON GLUTAMATE BINDING | Genes involved in Activation of Kainate Receptors upon glutamate binding |
| 0.1 | 16.8 | REACTOME MRNA SPLICING | Genes involved in mRNA Splicing |
| 0.1 | 2.1 | REACTOME ACTIVATED TAK1 MEDIATES P38 MAPK ACTIVATION | Genes involved in activated TAK1 mediates p38 MAPK activation |
| 0.1 | 1.5 | REACTOME REVERSIBLE HYDRATION OF CARBON DIOXIDE | Genes involved in Reversible Hydration of Carbon Dioxide |
| 0.1 | 2.3 | REACTOME INSULIN SYNTHESIS AND PROCESSING | Genes involved in Insulin Synthesis and Processing |
| 0.1 | 4.9 | REACTOME GPVI MEDIATED ACTIVATION CASCADE | Genes involved in GPVI-mediated activation cascade |
| 0.1 | 1.4 | REACTOME TRAF6 MEDIATED INDUCTION OF TAK1 COMPLEX | Genes involved in TRAF6 mediated induction of TAK1 complex |
| 0.1 | 1.0 | REACTOME ARMS MEDIATED ACTIVATION | Genes involved in ARMS-mediated activation |
| 0.1 | 1.6 | REACTOME LATENT INFECTION OF HOMO SAPIENS WITH MYCOBACTERIUM TUBERCULOSIS | Genes involved in Latent infection of Homo sapiens with Mycobacterium tuberculosis |
| 0.1 | 1.3 | REACTOME ACTIVATION OF THE AP1 FAMILY OF TRANSCRIPTION FACTORS | Genes involved in Activation of the AP-1 family of transcription factors |
| 0.1 | 4.1 | REACTOME ASSOCIATION OF TRIC CCT WITH TARGET PROTEINS DURING BIOSYNTHESIS | Genes involved in Association of TriC/CCT with target proteins during biosynthesis |
| 0.1 | 0.8 | REACTOME IL 6 SIGNALING | Genes involved in Interleukin-6 signaling |
| 0.1 | 2.7 | REACTOME SULFUR AMINO ACID METABOLISM | Genes involved in Sulfur amino acid metabolism |
| 0.1 | 2.2 | REACTOME OTHER SEMAPHORIN INTERACTIONS | Genes involved in Other semaphorin interactions |
| 0.1 | 1.3 | REACTOME SIGNAL ATTENUATION | Genes involved in Signal attenuation |
| 0.1 | 1.1 | REACTOME SYNTHESIS OF PIPS AT THE LATE ENDOSOME MEMBRANE | Genes involved in Synthesis of PIPs at the late endosome membrane |
| 0.1 | 1.3 | REACTOME IRON UPTAKE AND TRANSPORT | Genes involved in Iron uptake and transport |
| 0.1 | 0.7 | REACTOME AKT PHOSPHORYLATES TARGETS IN THE CYTOSOL | Genes involved in AKT phosphorylates targets in the cytosol |
| 0.1 | 4.4 | REACTOME BMAL1 CLOCK NPAS2 ACTIVATES CIRCADIAN EXPRESSION | Genes involved in BMAL1:CLOCK/NPAS2 Activates Circadian Expression |
| 0.1 | 1.1 | REACTOME ACYL CHAIN REMODELLING OF PS | Genes involved in Acyl chain remodelling of PS |
| 0.1 | 3.8 | REACTOME GLUCAGON SIGNALING IN METABOLIC REGULATION | Genes involved in Glucagon signaling in metabolic regulation |
| 0.1 | 4.7 | REACTOME FORMATION OF THE TERNARY COMPLEX AND SUBSEQUENTLY THE 43S COMPLEX | Genes involved in Formation of the ternary complex, and subsequently, the 43S complex |
| 0.1 | 2.5 | REACTOME SYNTHESIS OF VERY LONG CHAIN FATTY ACYL COAS | Genes involved in Synthesis of very long-chain fatty acyl-CoAs |
| 0.1 | 0.6 | REACTOME ACYL CHAIN REMODELLING OF PI | Genes involved in Acyl chain remodelling of PI |
| 0.1 | 1.5 | REACTOME SYNTHESIS OF PE | Genes involved in Synthesis of PE |
| 0.1 | 6.5 | REACTOME NRAGE SIGNALS DEATH THROUGH JNK | Genes involved in NRAGE signals death through JNK |
| 0.1 | 11.3 | REACTOME TRANSPORT OF INORGANIC CATIONS ANIONS AND AMINO ACIDS OLIGOPEPTIDES | Genes involved in Transport of inorganic cations/anions and amino acids/oligopeptides |
| 0.1 | 7.3 | REACTOME SRP DEPENDENT COTRANSLATIONAL PROTEIN TARGETING TO MEMBRANE | Genes involved in SRP-dependent cotranslational protein targeting to membrane |
| 0.1 | 2.6 | REACTOME IL1 SIGNALING | Genes involved in Interleukin-1 signaling |
| 0.1 | 0.7 | REACTOME HOMOLOGOUS RECOMBINATION REPAIR OF REPLICATION INDEPENDENT DOUBLE STRAND BREAKS | Genes involved in Homologous recombination repair of replication-independent double-strand breaks |
| 0.0 | 0.1 | REACTOME RESOLUTION OF AP SITES VIA THE SINGLE NUCLEOTIDE REPLACEMENT PATHWAY | Genes involved in Resolution of AP sites via the single-nucleotide replacement pathway |
| 0.0 | 4.2 | REACTOME NOTCH1 INTRACELLULAR DOMAIN REGULATES TRANSCRIPTION | Genes involved in NOTCH1 Intracellular Domain Regulates Transcription |
| 0.0 | 1.2 | REACTOME SYNTHESIS OF PA | Genes involved in Synthesis of PA |
| 0.0 | 0.7 | REACTOME RNA POL III CHAIN ELONGATION | Genes involved in RNA Polymerase III Chain Elongation |
| 0.0 | 1.1 | REACTOME REGULATION OF INSULIN SECRETION BY GLUCAGON LIKE PEPTIDE1 | Genes involved in Regulation of Insulin Secretion by Glucagon-like Peptide-1 |
| 0.0 | 2.4 | REACTOME NEGATIVE REGULATORS OF RIG I MDA5 SIGNALING | Genes involved in Negative regulators of RIG-I/MDA5 signaling |
| 0.0 | 2.6 | REACTOME VOLTAGE GATED POTASSIUM CHANNELS | Genes involved in Voltage gated Potassium channels |
| 0.0 | 2.4 | REACTOME MITOCHONDRIAL PROTEIN IMPORT | Genes involved in Mitochondrial Protein Import |
| 0.0 | 0.8 | REACTOME CITRIC ACID CYCLE TCA CYCLE | Genes involved in Citric acid cycle (TCA cycle) |
| 0.0 | 0.9 | REACTOME AMINE DERIVED HORMONES | Genes involved in Amine-derived hormones |
| 0.0 | 1.0 | REACTOME PRE NOTCH PROCESSING IN GOLGI | Genes involved in Pre-NOTCH Processing in Golgi |
| 0.0 | 1.1 | REACTOME THE ROLE OF NEF IN HIV1 REPLICATION AND DISEASE PATHOGENESIS | Genes involved in The role of Nef in HIV-1 replication and disease pathogenesis |
| 0.0 | 0.4 | REACTOME PACKAGING OF TELOMERE ENDS | Genes involved in Packaging Of Telomere Ends |
| 0.0 | 0.7 | REACTOME NONSENSE MEDIATED DECAY ENHANCED BY THE EXON JUNCTION COMPLEX | Genes involved in Nonsense Mediated Decay Enhanced by the Exon Junction Complex |
| 0.0 | 1.0 | REACTOME G ALPHA Z SIGNALLING EVENTS | Genes involved in G alpha (z) signalling events |
| 0.0 | 2.7 | REACTOME O LINKED GLYCOSYLATION OF MUCINS | Genes involved in O-linked glycosylation of mucins |
| 0.0 | 0.9 | REACTOME INHIBITION OF VOLTAGE GATED CA2 CHANNELS VIA GBETA GAMMA SUBUNITS | Genes involved in Inhibition of voltage gated Ca2+ channels via Gbeta/gamma subunits |
| 0.0 | 3.9 | REACTOME MITOTIC PROMETAPHASE | Genes involved in Mitotic Prometaphase |
| 0.0 | 0.9 | REACTOME AMINO ACID SYNTHESIS AND INTERCONVERSION TRANSAMINATION | Genes involved in Amino acid synthesis and interconversion (transamination) |
| 0.0 | 0.7 | REACTOME ORGANIC CATION ANION ZWITTERION TRANSPORT | Genes involved in Organic cation/anion/zwitterion transport |
| 0.0 | 0.2 | REACTOME TETRAHYDROBIOPTERIN BH4 SYNTHESIS RECYCLING SALVAGE AND REGULATION | Genes involved in Tetrahydrobiopterin (BH4) synthesis, recycling, salvage and regulation |
| 0.0 | 1.0 | REACTOME RECYCLING PATHWAY OF L1 | Genes involved in Recycling pathway of L1 |
| 0.0 | 1.1 | REACTOME DOWNREGULATION OF TGF BETA RECEPTOR SIGNALING | Genes involved in Downregulation of TGF-beta receptor signaling |
| 0.0 | 0.8 | REACTOME TRANSPORT OF VITAMINS NUCLEOSIDES AND RELATED MOLECULES | Genes involved in Transport of vitamins, nucleosides, and related molecules |
| 0.0 | 0.8 | REACTOME BIOSYNTHESIS OF THE N GLYCAN PRECURSOR DOLICHOL LIPID LINKED OLIGOSACCHARIDE LLO AND TRANSFER TO A NASCENT PROTEIN | Genes involved in Biosynthesis of the N-glycan precursor (dolichol lipid-linked oligosaccharide, LLO) and transfer to a nascent protein |
| 0.0 | 0.9 | REACTOME PYRIMIDINE METABOLISM | Genes involved in Pyrimidine metabolism |
| 0.0 | 0.6 | REACTOME PURINE SALVAGE | Genes involved in Purine salvage |
| 0.0 | 0.2 | REACTOME ELEVATION OF CYTOSOLIC CA2 LEVELS | Genes involved in Elevation of cytosolic Ca2+ levels |
| 0.0 | 0.4 | REACTOME MRNA DECAY BY 5 TO 3 EXORIBONUCLEASE | Genes involved in mRNA Decay by 5' to 3' Exoribonuclease |
| 0.0 | 0.5 | REACTOME REGULATION OF RHEB GTPASE ACTIVITY BY AMPK | Genes involved in Regulation of Rheb GTPase activity by AMPK |
| 0.0 | 0.0 | REACTOME MRNA DECAY BY 3 TO 5 EXORIBONUCLEASE | Genes involved in mRNA Decay by 3' to 5' Exoribonuclease |
| 0.0 | 1.2 | REACTOME ION TRANSPORT BY P TYPE ATPASES | Genes involved in Ion transport by P-type ATPases |
| 0.0 | 0.3 | REACTOME INWARDLY RECTIFYING K CHANNELS | Genes involved in Inwardly rectifying K+ channels |
| 0.0 | 0.7 | REACTOME GENERATION OF SECOND MESSENGER MOLECULES | Genes involved in Generation of second messenger molecules |
| 0.0 | 0.7 | REACTOME COSTIMULATION BY THE CD28 FAMILY | Genes involved in Costimulation by the CD28 family |
| 0.0 | 0.6 | REACTOME CELL EXTRACELLULAR MATRIX INTERACTIONS | Genes involved in Cell-extracellular matrix interactions |
| 0.0 | 0.2 | REACTOME SIGNALING BY CONSTITUTIVELY ACTIVE EGFR | Genes involved in Signaling by constitutively active EGFR |
| 0.0 | 0.4 | REACTOME PERK REGULATED GENE EXPRESSION | Genes involved in PERK regulated gene expression |
| 0.0 | 1.6 | REACTOME APOPTOTIC CLEAVAGE OF CELLULAR PROTEINS | Genes involved in Apoptotic cleavage of cellular proteins |
| 0.0 | 0.2 | REACTOME COPI MEDIATED TRANSPORT | Genes involved in COPI Mediated Transport |
| 0.0 | 0.7 | REACTOME AMINE LIGAND BINDING RECEPTORS | Genes involved in Amine ligand-binding receptors |
| 0.0 | 0.2 | REACTOME NUCLEOTIDE LIKE PURINERGIC RECEPTORS | Genes involved in Nucleotide-like (purinergic) receptors |
| 0.0 | 0.7 | REACTOME CGMP EFFECTS | Genes involved in cGMP effects |
| 0.0 | 1.0 | REACTOME GLYCEROPHOSPHOLIPID BIOSYNTHESIS | Genes involved in Glycerophospholipid biosynthesis |
| 0.0 | 0.3 | REACTOME PURINE RIBONUCLEOSIDE MONOPHOSPHATE BIOSYNTHESIS | Genes involved in Purine ribonucleoside monophosphate biosynthesis |
| 0.0 | 0.5 | REACTOME POTASSIUM CHANNELS | Genes involved in Potassium Channels |
| 0.0 | 0.1 | REACTOME REGULATION OF THE FANCONI ANEMIA PATHWAY | Genes involved in Regulation of the Fanconi anemia pathway |
| 0.0 | 1.0 | REACTOME CYCLIN E ASSOCIATED EVENTS DURING G1 S TRANSITION | Genes involved in Cyclin E associated events during G1/S transition |
| 0.0 | 0.3 | REACTOME SIGNALING BY HIPPO | Genes involved in Signaling by Hippo |
| 0.0 | 2.3 | REACTOME G ALPHA Q SIGNALLING EVENTS | Genes involved in G alpha (q) signalling events |
| 0.0 | 1.5 | REACTOME TRANSCRIPTION | Genes involved in Transcription |
| 0.0 | 0.3 | REACTOME PROLACTIN RECEPTOR SIGNALING | Genes involved in Prolactin receptor signaling |
| 0.0 | 2.0 | REACTOME SIGNALING BY RHO GTPASES | Genes involved in Signaling by Rho GTPases |
| 0.0 | 0.3 | REACTOME DOWNREGULATION OF ERBB2 ERBB3 SIGNALING | Genes involved in Downregulation of ERBB2:ERBB3 signaling |