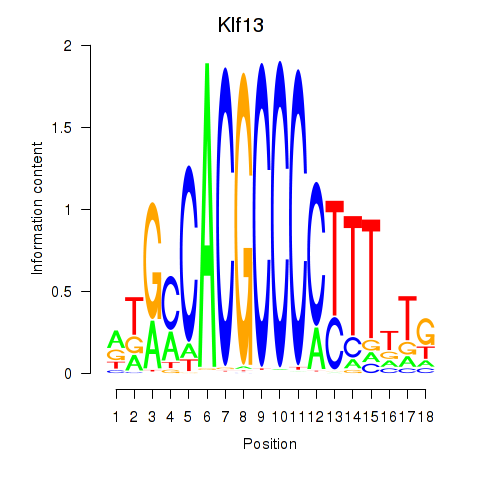
Motif ID: Klf13
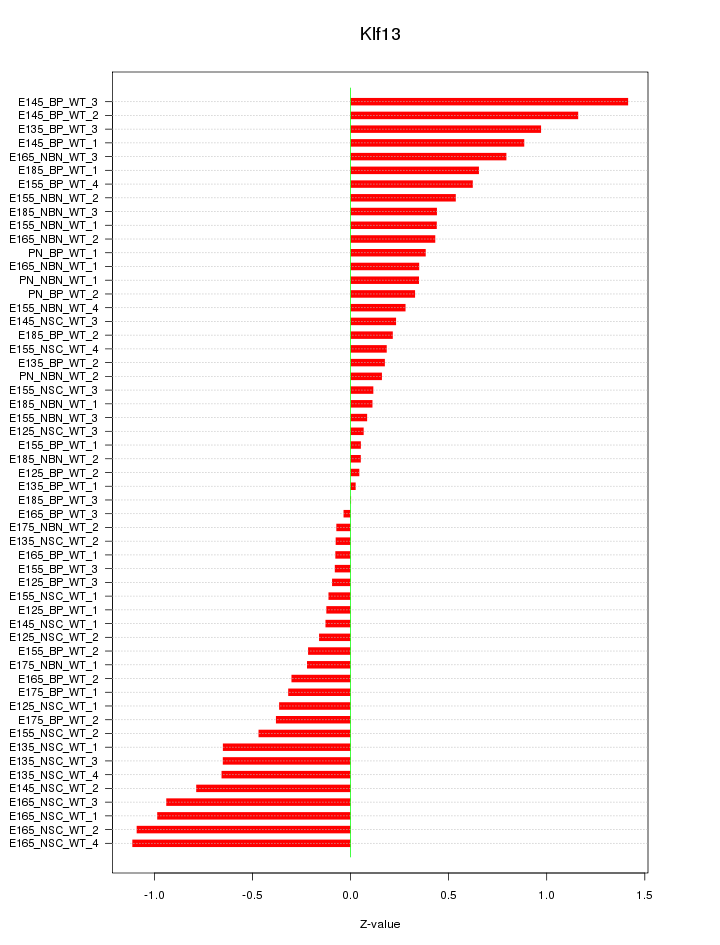
Z-value: 0.527
Transcription factors associated with Klf13:
| Gene Symbol | Entrez ID | Gene Name |
|---|---|---|
| Klf13 | ENSMUSG00000052040.9 | Klf13 |
Activity-expression correlation:
| Gene Symbol | Promoter | Pearson corr. coef. | P-value | Plot |
|---|---|---|---|---|
| Klf13 | mm10_v2_chr7_-_63938862_63938933 | -0.31 | 2.3e-02 | Click! |


Top targets:
Gene overrepresentation in biological_process category:
| Log-likelihood per target | Total log-likelihood | Term | Description |
|---|---|---|---|
| 0.8 | 2.5 | GO:0032915 | positive regulation of transforming growth factor beta2 production(GO:0032915) |
| 0.8 | 2.4 | GO:1900133 | renin secretion into blood stream(GO:0002001) regulation of renin secretion into blood stream(GO:1900133) |
| 0.6 | 1.8 | GO:0071929 | alpha-tubulin acetylation(GO:0071929) |
| 0.4 | 2.8 | GO:0019262 | N-acetylneuraminate catabolic process(GO:0019262) |
| 0.2 | 1.6 | GO:0061718 | NADH regeneration(GO:0006735) canonical glycolysis(GO:0061621) glucose catabolic process to pyruvate(GO:0061718) |
| 0.2 | 0.7 | GO:0010890 | positive regulation of sequestering of triglyceride(GO:0010890) |
| 0.2 | 0.5 | GO:1902174 | positive regulation of keratinocyte apoptotic process(GO:1902174) |
| 0.2 | 0.6 | GO:0010957 | negative regulation of vitamin D biosynthetic process(GO:0010957) negative regulation of vitamin metabolic process(GO:0046137) regulation of cell differentiation involved in embryonic placenta development(GO:0060800) |
| 0.1 | 0.4 | GO:0009826 | unidimensional cell growth(GO:0009826) |
| 0.1 | 1.8 | GO:0099628 | receptor diffusion trapping(GO:0098953) postsynaptic neurotransmitter receptor diffusion trapping(GO:0098970) neurotransmitter receptor diffusion trapping(GO:0099628) |
| 0.1 | 0.5 | GO:0006788 | heme oxidation(GO:0006788) |
| 0.1 | 1.4 | GO:0048280 | vesicle fusion with Golgi apparatus(GO:0048280) |
| 0.1 | 1.0 | GO:0046512 | sphingosine biosynthetic process(GO:0046512) sphingoid biosynthetic process(GO:0046520) |
| 0.1 | 0.6 | GO:0010968 | regulation of microtubule nucleation(GO:0010968) |
| 0.1 | 0.4 | GO:0070294 | renal sodium ion absorption(GO:0070294) |
| 0.1 | 0.4 | GO:0090166 | Golgi disassembly(GO:0090166) |
| 0.1 | 1.0 | GO:0035414 | negative regulation of catenin import into nucleus(GO:0035414) |
| 0.1 | 0.6 | GO:0001682 | tRNA 5'-leader removal(GO:0001682) |
| 0.0 | 0.6 | GO:0045899 | positive regulation of RNA polymerase II transcriptional preinitiation complex assembly(GO:0045899) |
| 0.0 | 0.2 | GO:0060261 | positive regulation of transcription initiation from RNA polymerase II promoter(GO:0060261) |
| 0.0 | 0.5 | GO:0090084 | negative regulation of inclusion body assembly(GO:0090084) |
| 0.0 | 0.3 | GO:0006685 | sphingomyelin catabolic process(GO:0006685) |
| 0.0 | 0.5 | GO:0033008 | positive regulation of mast cell activation involved in immune response(GO:0033008) positive regulation of mast cell degranulation(GO:0043306) |
| 0.0 | 1.7 | GO:0032456 | endocytic recycling(GO:0032456) |
| 0.0 | 1.2 | GO:0007189 | adenylate cyclase-activating G-protein coupled receptor signaling pathway(GO:0007189) |
| 0.0 | 0.5 | GO:0007220 | Notch receptor processing(GO:0007220) |
| 0.0 | 0.4 | GO:0043982 | histone H4-K5 acetylation(GO:0043981) histone H4-K8 acetylation(GO:0043982) |
| 0.0 | 0.3 | GO:1904668 | positive regulation of ubiquitin protein ligase activity(GO:1904668) |
| 0.0 | 0.2 | GO:0008611 | ether lipid biosynthetic process(GO:0008611) neutrophil differentiation(GO:0030223) glycerol ether biosynthetic process(GO:0046504) ether biosynthetic process(GO:1901503) |
| 0.0 | 0.5 | GO:0015693 | magnesium ion transport(GO:0015693) |
| 0.0 | 3.3 | GO:0010811 | positive regulation of cell-substrate adhesion(GO:0010811) |
| 0.0 | 0.2 | GO:1903847 | regulation of aorta morphogenesis(GO:1903847) positive regulation of aorta morphogenesis(GO:1903849) |
| 0.0 | 1.2 | GO:0006879 | cellular iron ion homeostasis(GO:0006879) |
| 0.0 | 0.1 | GO:0046600 | negative regulation of centriole replication(GO:0046600) |
| 0.0 | 0.2 | GO:0061042 | vascular wound healing(GO:0061042) |
| 0.0 | 0.3 | GO:0006098 | pentose-phosphate shunt(GO:0006098) |
| 0.0 | 0.2 | GO:0051123 | RNA polymerase II transcriptional preinitiation complex assembly(GO:0051123) |
| 0.0 | 0.1 | GO:0001180 | transcription initiation from RNA polymerase I promoter for nuclear large rRNA transcript(GO:0001180) |
| 0.0 | 0.3 | GO:0071392 | cellular response to estradiol stimulus(GO:0071392) |
| 0.0 | 0.6 | GO:0097031 | NADH dehydrogenase complex assembly(GO:0010257) mitochondrial respiratory chain complex I assembly(GO:0032981) mitochondrial respiratory chain complex I biogenesis(GO:0097031) |
| 0.0 | 0.3 | GO:0006821 | chloride transport(GO:0006821) |
| 0.0 | 1.5 | GO:0014065 | phosphatidylinositol 3-kinase signaling(GO:0014065) |
| 0.0 | 0.2 | GO:0046854 | phosphatidylinositol phosphorylation(GO:0046854) |
| 0.0 | 0.3 | GO:0019884 | antigen processing and presentation of exogenous antigen(GO:0019884) |
Gene overrepresentation in cellular_component category:
| Log-likelihood per target | Total log-likelihood | Term | Description |
|---|---|---|---|
| 0.2 | 1.8 | GO:0097427 | microtubule bundle(GO:0097427) |
| 0.2 | 0.5 | GO:0044194 | cytolytic granule(GO:0044194) |
| 0.1 | 0.6 | GO:0008622 | epsilon DNA polymerase complex(GO:0008622) |
| 0.1 | 0.6 | GO:0000172 | ribonuclease MRP complex(GO:0000172) |
| 0.1 | 0.5 | GO:0099524 | region of cytosol(GO:0099522) postsynaptic cytosol(GO:0099524) |
| 0.1 | 0.6 | GO:0097550 | transcriptional preinitiation complex(GO:0097550) |
| 0.1 | 1.8 | GO:0044224 | juxtaparanode region of axon(GO:0044224) |
| 0.1 | 1.6 | GO:0097228 | sperm principal piece(GO:0097228) |
| 0.1 | 2.5 | GO:0035861 | site of double-strand break(GO:0035861) |
| 0.1 | 1.4 | GO:0012507 | ER to Golgi transport vesicle membrane(GO:0012507) |
| 0.1 | 1.2 | GO:0008074 | guanylate cyclase complex, soluble(GO:0008074) |
| 0.1 | 0.5 | GO:0070765 | gamma-secretase complex(GO:0070765) |
| 0.1 | 0.2 | GO:0005672 | transcription factor TFIIA complex(GO:0005672) |
| 0.1 | 0.3 | GO:0032777 | Piccolo NuA4 histone acetyltransferase complex(GO:0032777) |
| 0.0 | 0.3 | GO:0097208 | alveolar lamellar body(GO:0097208) |
| 0.0 | 0.6 | GO:0032593 | insulin-responsive compartment(GO:0032593) |
| 0.0 | 3.3 | GO:0005604 | basement membrane(GO:0005604) |
| 0.0 | 0.2 | GO:0042587 | glycogen granule(GO:0042587) |
| 0.0 | 0.9 | GO:0032420 | stereocilium(GO:0032420) |
| 0.0 | 0.2 | GO:0035102 | PRC1 complex(GO:0035102) |
| 0.0 | 1.3 | GO:0001725 | stress fiber(GO:0001725) contractile actin filament bundle(GO:0097517) |
| 0.0 | 0.6 | GO:0045271 | mitochondrial respiratory chain complex I(GO:0005747) NADH dehydrogenase complex(GO:0030964) respiratory chain complex I(GO:0045271) |
| 0.0 | 0.3 | GO:0005680 | anaphase-promoting complex(GO:0005680) |
| 0.0 | 0.4 | GO:0071339 | MLL1/2 complex(GO:0044665) MLL1 complex(GO:0071339) |
| 0.0 | 0.2 | GO:0032580 | Golgi cisterna membrane(GO:0032580) |
| 0.0 | 0.7 | GO:0005811 | lipid particle(GO:0005811) |
Gene overrepresentation in molecular_function category:
| Log-likelihood per target | Total log-likelihood | Term | Description |
|---|---|---|---|
| 0.9 | 2.8 | GO:0045127 | N-acetylglucosamine kinase activity(GO:0045127) |
| 0.8 | 2.4 | GO:0051379 | epinephrine binding(GO:0051379) |
| 0.3 | 1.6 | GO:0008865 | fructokinase activity(GO:0008865) mannokinase activity(GO:0019158) |
| 0.3 | 1.8 | GO:0004468 | lysine N-acetyltransferase activity, acting on acetyl phosphate as donor(GO:0004468) |
| 0.2 | 1.0 | GO:0017050 | sphinganine kinase activity(GO:0008481) D-erythro-sphingosine kinase activity(GO:0017050) |
| 0.2 | 1.8 | GO:0031811 | G-protein coupled nucleotide receptor binding(GO:0031811) P2Y1 nucleotide receptor binding(GO:0031812) |
| 0.2 | 2.5 | GO:0008140 | cAMP response element binding protein binding(GO:0008140) |
| 0.2 | 1.2 | GO:0008294 | calcium- and calmodulin-responsive adenylate cyclase activity(GO:0008294) |
| 0.2 | 1.4 | GO:0019869 | chloride channel inhibitor activity(GO:0019869) |
| 0.1 | 0.5 | GO:0030348 | syntaxin-3 binding(GO:0030348) |
| 0.1 | 0.5 | GO:0004392 | heme oxygenase (decyclizing) activity(GO:0004392) |
| 0.1 | 1.3 | GO:0031005 | filamin binding(GO:0031005) |
| 0.1 | 0.3 | GO:0017057 | 6-phosphogluconolactonase activity(GO:0017057) |
| 0.1 | 1.0 | GO:0070097 | delta-catenin binding(GO:0070097) |
| 0.1 | 0.5 | GO:0061665 | SUMO ligase activity(GO:0061665) |
| 0.1 | 0.6 | GO:0000990 | transcription factor activity, core RNA polymerase binding(GO:0000990) |
| 0.1 | 0.6 | GO:0004526 | ribonuclease P activity(GO:0004526) |
| 0.1 | 0.2 | GO:0004315 | 3-oxoacyl-[acyl-carrier-protein] synthase activity(GO:0004315) |
| 0.0 | 0.5 | GO:0097027 | ubiquitin-protein transferase activator activity(GO:0097027) |
| 0.0 | 0.1 | GO:0036361 | racemase and epimerase activity, acting on amino acids and derivatives(GO:0016855) racemase activity, acting on amino acids and derivatives(GO:0036361) amino-acid racemase activity(GO:0047661) |
| 0.0 | 3.3 | GO:0005518 | collagen binding(GO:0005518) |
| 0.0 | 0.4 | GO:0043995 | histone acetyltransferase activity (H4-K5 specific)(GO:0043995) histone acetyltransferase activity (H4-K8 specific)(GO:0043996) histone acetyltransferase activity (H4-K16 specific)(GO:0046972) |
| 0.0 | 0.2 | GO:0097003 | adipokinetic hormone receptor activity(GO:0097003) |
| 0.0 | 0.3 | GO:0043023 | ribosomal large subunit binding(GO:0043023) |
| 0.0 | 0.3 | GO:0004767 | sphingomyelin phosphodiesterase activity(GO:0004767) |
| 0.0 | 0.6 | GO:0016423 | tRNA (guanine) methyltransferase activity(GO:0016423) |
| 0.0 | 0.3 | GO:0061133 | endopeptidase activator activity(GO:0061133) |
| 0.0 | 1.3 | GO:0005158 | insulin receptor binding(GO:0005158) |
| 0.0 | 0.5 | GO:0015095 | magnesium ion transmembrane transporter activity(GO:0015095) |
| 0.0 | 0.3 | GO:0005229 | intracellular calcium activated chloride channel activity(GO:0005229) |
| 0.0 | 0.6 | GO:0003887 | DNA-directed DNA polymerase activity(GO:0003887) |
| 0.0 | 0.1 | GO:0016309 | 1-phosphatidylinositol-5-phosphate 4-kinase activity(GO:0016309) |
| 0.0 | 0.2 | GO:0061676 | importin-alpha family protein binding(GO:0061676) |
| 0.0 | 0.2 | GO:0030306 | ADP-ribosylation factor binding(GO:0030306) |
| 0.0 | 0.7 | GO:0031624 | ubiquitin conjugating enzyme binding(GO:0031624) |
| 0.0 | 0.3 | GO:0031489 | myosin V binding(GO:0031489) |
| 0.0 | 0.5 | GO:0001671 | ATPase activator activity(GO:0001671) |
| 0.0 | 0.3 | GO:0043274 | phospholipase binding(GO:0043274) |
Gene overrepresentation in C2:CP category:
| Log-likelihood per target | Total log-likelihood | Term | Description |
|---|---|---|---|
| 0.1 | 4.5 | ST_MYOCYTE_AD_PATHWAY | Myocyte Adrenergic Pathway is a specific case of the generalized Adrenergic Pathway. |
| 0.1 | 1.2 | PID_LPA4_PATHWAY | LPA4-mediated signaling events |
| 0.1 | 2.5 | SA_B_CELL_RECEPTOR_COMPLEXES | Antigen binding to B cell receptors activates protein tyrosine kinases, such as the Src family, which ultimate activate MAP kinases. |
| 0.1 | 1.0 | PID_S1P_S1P1_PATHWAY | S1P1 pathway |
| 0.0 | 1.3 | PID_RET_PATHWAY | Signaling events regulated by Ret tyrosine kinase |
| 0.0 | 0.5 | PID_SYNDECAN_3_PATHWAY | Syndecan-3-mediated signaling events |
| 0.0 | 1.6 | PID_HIF1_TFPATHWAY | HIF-1-alpha transcription factor network |
| 0.0 | 0.5 | PID_IFNG_PATHWAY | IFN-gamma pathway |
| 0.0 | 0.6 | PID_ILK_PATHWAY | Integrin-linked kinase signaling |
Gene overrepresentation in C2:CP:REACTOME category:
| Log-likelihood per target | Total log-likelihood | Term | Description |
|---|---|---|---|
| 0.2 | 2.4 | REACTOME_AMINE_LIGAND_BINDING_RECEPTORS | Genes involved in Amine ligand-binding receptors |
| 0.1 | 2.5 | REACTOME_ACTIVATION_OF_THE_AP1_FAMILY_OF_TRANSCRIPTION_FACTORS | Genes involved in Activation of the AP-1 family of transcription factors |
| 0.1 | 1.2 | REACTOME_ADENYLATE_CYCLASE_ACTIVATING_PATHWAY | Genes involved in Adenylate cyclase activating pathway |
| 0.0 | 0.6 | REACTOME_VIRAL_MESSENGER_RNA_SYNTHESIS | Genes involved in Viral Messenger RNA Synthesis |
| 0.0 | 1.6 | REACTOME_GLUCOSE_TRANSPORT | Genes involved in Glucose transport |
| 0.0 | 0.5 | REACTOME_REGULATED_PROTEOLYSIS_OF_P75NTR | Genes involved in Regulated proteolysis of p75NTR |
| 0.0 | 0.3 | REACTOME_VITAMIN_B5_PANTOTHENATE_METABOLISM | Genes involved in Vitamin B5 (pantothenate) metabolism |
| 0.0 | 1.0 | REACTOME_SPHINGOLIPID_DE_NOVO_BIOSYNTHESIS | Genes involved in Sphingolipid de novo biosynthesis |
| 0.0 | 0.5 | REACTOME_IRON_UPTAKE_AND_TRANSPORT | Genes involved in Iron uptake and transport |
| 0.0 | 0.2 | REACTOME_NOTCH_HLH_TRANSCRIPTION_PATHWAY | Genes involved in Notch-HLH transcription pathway |