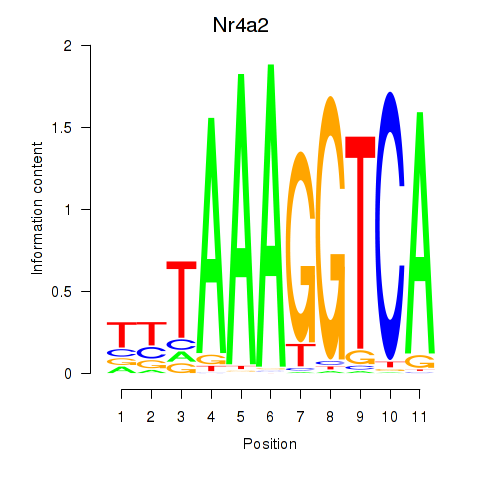
Motif ID: Nr4a2
Z-value: 0.466
Transcription factors associated with Nr4a2:
| Gene Symbol | Entrez ID | Gene Name |
|---|---|---|
| Nr4a2 | ENSMUSG00000026826.7 | Nr4a2 |
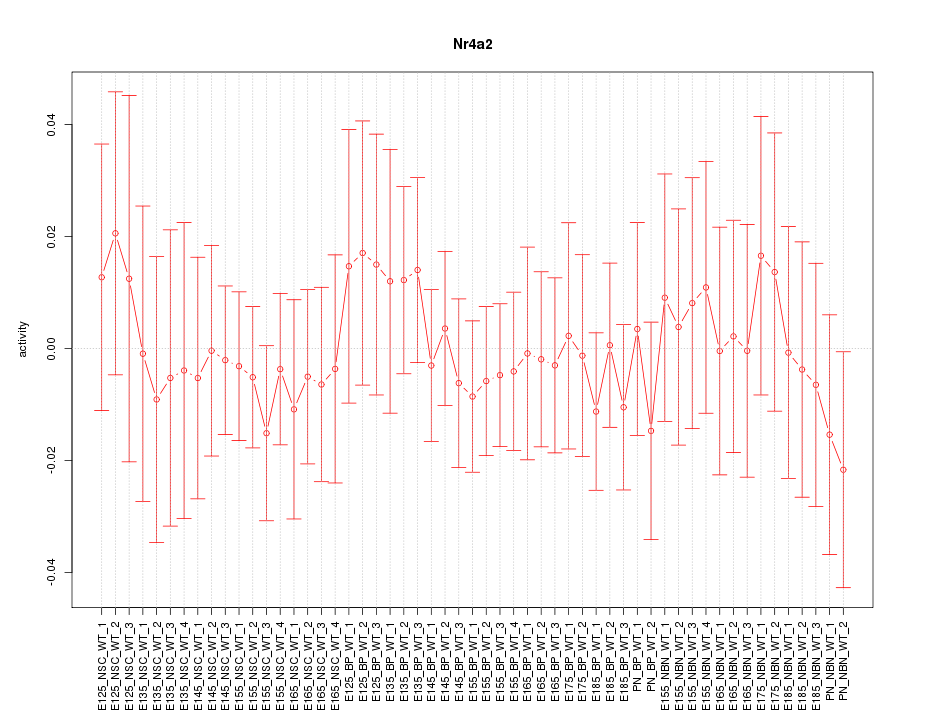
Activity-expression correlation:
| Gene Symbol | Promoter | Pearson corr. coef. | P-value | Plot |
|---|---|---|---|---|
| Nr4a2 | mm10_v2_chr2_-_57124003_57124071 | 0.52 | 4.2e-05 | Click! |


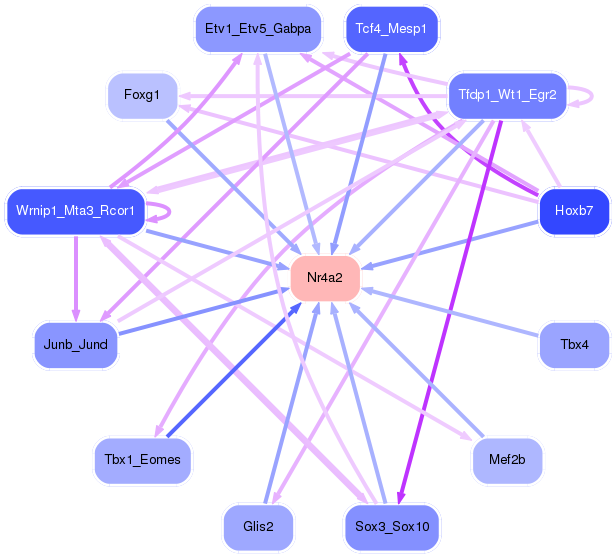
Top targets:
Gene overrepresentation in biological_process category:
| Log-likelihood per target | Total log-likelihood | Term | Description |
|---|---|---|---|
| 0.4 | 1.2 | GO:0032915 | positive regulation of transforming growth factor beta2 production(GO:0032915) |
| 0.4 | 1.9 | GO:0098914 | membrane repolarization during atrial cardiac muscle cell action potential(GO:0098914) |
| 0.3 | 1.3 | GO:0010890 | positive regulation of sequestering of triglyceride(GO:0010890) |
| 0.3 | 0.8 | GO:0006597 | spermine biosynthetic process(GO:0006597) |
| 0.2 | 0.7 | GO:0019405 | alditol catabolic process(GO:0019405) glyceraldehyde-3-phosphate biosynthetic process(GO:0046166) |
| 0.2 | 0.6 | GO:0015866 | ADP transport(GO:0015866) |
| 0.2 | 0.5 | GO:0019046 | release from viral latency(GO:0019046) regulation of DNA strand elongation(GO:0060382) |
| 0.1 | 0.4 | GO:0003104 | positive regulation of glomerular filtration(GO:0003104) negative regulation of protein import into nucleus, translocation(GO:0033159) regulation of oligodendrocyte apoptotic process(GO:1900141) negative regulation of oligodendrocyte apoptotic process(GO:1900142) positive regulation of dendritic cell chemotaxis(GO:2000510) |
| 0.1 | 0.5 | GO:2000158 | positive regulation of ubiquitin-specific protease activity(GO:2000158) |
| 0.1 | 0.4 | GO:0021933 | radial glia guided migration of cerebellar granule cell(GO:0021933) |
| 0.1 | 1.7 | GO:0048875 | chemical homeostasis within a tissue(GO:0048875) |
| 0.1 | 0.4 | GO:0010796 | regulation of multivesicular body size(GO:0010796) |
| 0.1 | 0.3 | GO:0071929 | alpha-tubulin acetylation(GO:0071929) |
| 0.1 | 0.8 | GO:2000253 | positive regulation of feeding behavior(GO:2000253) |
| 0.1 | 1.2 | GO:0021979 | hypothalamus cell differentiation(GO:0021979) |
| 0.1 | 0.7 | GO:0090043 | regulation of tubulin deacetylation(GO:0090043) |
| 0.1 | 0.8 | GO:0061470 | interleukin-21 production(GO:0032625) T follicular helper cell differentiation(GO:0061470) interleukin-21 secretion(GO:0072619) |
| 0.1 | 0.5 | GO:0006003 | fructose 2,6-bisphosphate metabolic process(GO:0006003) |
| 0.1 | 0.8 | GO:1900383 | regulation of synaptic plasticity by receptor localization to synapse(GO:1900383) |
| 0.1 | 0.6 | GO:0032306 | regulation of prostaglandin secretion(GO:0032306) |
| 0.1 | 0.6 | GO:0061002 | negative regulation of dendritic spine morphogenesis(GO:0061002) |
| 0.1 | 0.2 | GO:0030210 | heparin biosynthetic process(GO:0030210) Tie signaling pathway(GO:0048014) |
| 0.1 | 0.4 | GO:1902510 | regulation of apoptotic DNA fragmentation(GO:1902510) |
| 0.1 | 0.4 | GO:0090400 | stress-induced premature senescence(GO:0090400) |
| 0.1 | 0.5 | GO:0048386 | positive regulation of retinoic acid receptor signaling pathway(GO:0048386) |
| 0.0 | 4.6 | GO:0051965 | positive regulation of synapse assembly(GO:0051965) |
| 0.0 | 1.6 | GO:0045494 | photoreceptor cell maintenance(GO:0045494) |
| 0.0 | 1.4 | GO:0014047 | glutamate secretion(GO:0014047) |
| 0.0 | 1.5 | GO:0007218 | neuropeptide signaling pathway(GO:0007218) |
| 0.0 | 0.6 | GO:0050832 | defense response to fungus(GO:0050832) |
| 0.0 | 0.2 | GO:0019388 | galactose catabolic process(GO:0019388) |
| 0.0 | 0.2 | GO:0034720 | histone H3-K4 demethylation(GO:0034720) |
| 0.0 | 0.2 | GO:1900119 | positive regulation of execution phase of apoptosis(GO:1900119) |
| 0.0 | 0.2 | GO:0036158 | outer dynein arm assembly(GO:0036158) |
| 0.0 | 0.4 | GO:0043968 | histone H2A acetylation(GO:0043968) |
| 0.0 | 0.2 | GO:0048096 | chromatin-mediated maintenance of transcription(GO:0048096) |
| 0.0 | 0.0 | GO:0032829 | regulation of CD4-positive, CD25-positive, alpha-beta regulatory T cell differentiation(GO:0032829) |
| 0.0 | 0.8 | GO:0045668 | negative regulation of osteoblast differentiation(GO:0045668) |
| 0.0 | 0.1 | GO:0033601 | positive regulation of mammary gland epithelial cell proliferation(GO:0033601) |
| 0.0 | 0.5 | GO:0035082 | axoneme assembly(GO:0035082) |
| 0.0 | 0.1 | GO:0006627 | protein processing involved in protein targeting to mitochondrion(GO:0006627) |
| 0.0 | 0.3 | GO:0015991 | ATP hydrolysis coupled proton transport(GO:0015991) |
Gene overrepresentation in cellular_component category:
| Log-likelihood per target | Total log-likelihood | Term | Description |
|---|---|---|---|
| 0.2 | 1.3 | GO:0042627 | chylomicron(GO:0042627) |
| 0.2 | 0.5 | GO:0043540 | 6-phosphofructo-2-kinase/fructose-2,6-biphosphatase complex(GO:0043540) |
| 0.1 | 0.6 | GO:0044233 | ER-mitochondrion membrane contact site(GO:0044233) |
| 0.1 | 0.4 | GO:0005828 | kinetochore microtubule(GO:0005828) |
| 0.1 | 0.3 | GO:0034715 | U7 snRNP(GO:0005683) pICln-Sm protein complex(GO:0034715) |
| 0.1 | 0.8 | GO:0030122 | AP-2 adaptor complex(GO:0030122) |
| 0.0 | 0.3 | GO:0097427 | microtubule bundle(GO:0097427) |
| 0.0 | 1.7 | GO:0043034 | costamere(GO:0043034) |
| 0.0 | 1.2 | GO:0035861 | site of double-strand break(GO:0035861) |
| 0.0 | 2.4 | GO:0008076 | voltage-gated potassium channel complex(GO:0008076) |
| 0.0 | 0.4 | GO:0032156 | septin cytoskeleton(GO:0032156) |
| 0.0 | 0.3 | GO:0030057 | desmosome(GO:0030057) |
| 0.0 | 1.4 | GO:0042734 | presynaptic membrane(GO:0042734) |
| 0.0 | 0.8 | GO:0016235 | aggresome(GO:0016235) |
| 0.0 | 0.1 | GO:0033180 | proton-transporting V-type ATPase, V1 domain(GO:0033180) |
| 0.0 | 0.4 | GO:0043189 | NuA4 histone acetyltransferase complex(GO:0035267) H4/H2A histone acetyltransferase complex(GO:0043189) H4 histone acetyltransferase complex(GO:1902562) |
| 0.0 | 0.1 | GO:0005853 | eukaryotic translation elongation factor 1 complex(GO:0005853) |
| 0.0 | 0.7 | GO:0005930 | axoneme(GO:0005930) |
Gene overrepresentation in molecular_function category:
| Log-likelihood per target | Total log-likelihood | Term | Description |
|---|---|---|---|
| 0.4 | 1.9 | GO:0015467 | G-protein activated inward rectifier potassium channel activity(GO:0015467) |
| 0.3 | 1.4 | GO:0001640 | adenylate cyclase inhibiting G-protein coupled glutamate receptor activity(GO:0001640) |
| 0.2 | 0.8 | GO:0019808 | polyamine binding(GO:0019808) |
| 0.2 | 1.3 | GO:0001515 | opioid peptide activity(GO:0001515) |
| 0.2 | 1.7 | GO:0031802 | type 5 metabotropic glutamate receptor binding(GO:0031802) |
| 0.1 | 0.4 | GO:0016174 | NAD(P)H oxidase activity(GO:0016174) |
| 0.1 | 0.5 | GO:0035800 | deubiquitinase activator activity(GO:0035800) |
| 0.1 | 1.2 | GO:0008140 | cAMP response element binding protein binding(GO:0008140) |
| 0.1 | 1.3 | GO:0004806 | triglyceride lipase activity(GO:0004806) |
| 0.1 | 0.5 | GO:0008239 | dipeptidyl-peptidase activity(GO:0008239) |
| 0.1 | 0.5 | GO:0070095 | fructose-6-phosphate binding(GO:0070095) |
| 0.1 | 0.7 | GO:0016861 | intramolecular oxidoreductase activity, interconverting aldoses and ketoses(GO:0016861) |
| 0.1 | 0.6 | GO:0015217 | ATP transmembrane transporter activity(GO:0005347) ADP transmembrane transporter activity(GO:0015217) |
| 0.1 | 0.6 | GO:0031957 | very long-chain fatty acid-CoA ligase activity(GO:0031957) |
| 0.1 | 0.3 | GO:0004468 | lysine N-acetyltransferase activity, acting on acetyl phosphate as donor(GO:0004468) |
| 0.0 | 0.4 | GO:0009931 | calcium-dependent protein serine/threonine kinase activity(GO:0009931) |
| 0.0 | 0.4 | GO:0030296 | protein tyrosine kinase activator activity(GO:0030296) |
| 0.0 | 0.2 | GO:0004614 | phosphoglucomutase activity(GO:0004614) |
| 0.0 | 0.1 | GO:0016971 | flavin-linked sulfhydryl oxidase activity(GO:0016971) |
| 0.0 | 1.4 | GO:0046875 | ephrin receptor binding(GO:0046875) |
| 0.0 | 1.7 | GO:0005518 | collagen binding(GO:0005518) |
| 0.0 | 0.2 | GO:0032453 | histone demethylase activity (H3-K4 specific)(GO:0032453) |
| 0.0 | 0.6 | GO:0043539 | protein serine/threonine kinase activator activity(GO:0043539) |
| 0.0 | 0.4 | GO:0031489 | myosin V binding(GO:0031489) |
| 0.0 | 0.2 | GO:0035173 | histone kinase activity(GO:0035173) |
| 0.0 | 0.2 | GO:0005172 | vascular endothelial growth factor receptor binding(GO:0005172) |
| 0.0 | 0.1 | GO:0042030 | ATPase inhibitor activity(GO:0042030) |
| 0.0 | 0.8 | GO:0016765 | transferase activity, transferring alkyl or aryl (other than methyl) groups(GO:0016765) |
Gene overrepresentation in C2:CP category:
| Log-likelihood per target | Total log-likelihood | Term | Description |
|---|---|---|---|
| 0.0 | 1.9 | ST_MYOCYTE_AD_PATHWAY | Myocyte Adrenergic Pathway is a specific case of the generalized Adrenergic Pathway. |
| 0.0 | 1.2 | SA_B_CELL_RECEPTOR_COMPLEXES | Antigen binding to B cell receptors activates protein tyrosine kinases, such as the Src family, which ultimate activate MAP kinases. |
| 0.0 | 0.4 | PID_ARF6_DOWNSTREAM_PATHWAY | Arf6 downstream pathway |
| 0.0 | 0.6 | PID_EPHA_FWDPATHWAY | EPHA forward signaling |
| 0.0 | 2.4 | NABA_SECRETED_FACTORS | Genes encoding secreted soluble factors |
| 0.0 | 0.7 | PID_ATF2_PATHWAY | ATF-2 transcription factor network |
| 0.0 | 0.4 | PID_P38_ALPHA_BETA_DOWNSTREAM_PATHWAY | Signaling mediated by p38-alpha and p38-beta |
Gene overrepresentation in C2:CP:REACTOME category:
| Log-likelihood per target | Total log-likelihood | Term | Description |
|---|---|---|---|
| 0.1 | 1.5 | REACTOME_G_PROTEIN_ACTIVATION | Genes involved in G-protein activation |
| 0.1 | 1.4 | REACTOME_CLASS_C_3_METABOTROPIC_GLUTAMATE_PHEROMONE_RECEPTORS | Genes involved in Class C/3 (Metabotropic glutamate/pheromone receptors) |
| 0.1 | 1.3 | REACTOME_CHYLOMICRON_MEDIATED_LIPID_TRANSPORT | Genes involved in Chylomicron-mediated lipid transport |
| 0.1 | 1.2 | REACTOME_ACTIVATION_OF_THE_AP1_FAMILY_OF_TRANSCRIPTION_FACTORS | Genes involved in Activation of the AP-1 family of transcription factors |
| 0.1 | 1.9 | REACTOME_INHIBITION_OF_VOLTAGE_GATED_CA2_CHANNELS_VIA_GBETA_GAMMA_SUBUNITS | Genes involved in Inhibition of voltage gated Ca2+ channels via Gbeta/gamma subunits |
| 0.0 | 0.5 | REACTOME_METABOLISM_OF_POLYAMINES | Genes involved in Metabolism of polyamines |
| 0.0 | 0.5 | REACTOME_TRAF6_MEDIATED_IRF7_ACTIVATION | Genes involved in TRAF6 mediated IRF7 activation |
| 0.0 | 0.3 | REACTOME_SLBP_DEPENDENT_PROCESSING_OF_REPLICATION_DEPENDENT_HISTONE_PRE_MRNAS | Genes involved in SLBP Dependent Processing of Replication-Dependent Histone Pre-mRNAs |
| 0.0 | 1.0 | REACTOME_GLUCONEOGENESIS | Genes involved in Gluconeogenesis |
| 0.0 | 0.6 | REACTOME_SYNTHESIS_OF_VERY_LONG_CHAIN_FATTY_ACYL_COAS | Genes involved in Synthesis of very long-chain fatty acyl-CoAs |
| 0.0 | 0.7 | REACTOME_PEROXISOMAL_LIPID_METABOLISM | Genes involved in Peroxisomal lipid metabolism |
| 0.0 | 1.4 | REACTOME_NRAGE_SIGNALS_DEATH_THROUGH_JNK | Genes involved in NRAGE signals death through JNK |
| 0.0 | 0.2 | REACTOME_SYNTHESIS_OF_PE | Genes involved in Synthesis of PE |
| 0.0 | 0.6 | REACTOME_INTERACTIONS_OF_VPR_WITH_HOST_CELLULAR_PROTEINS | Genes involved in Interactions of Vpr with host cellular proteins |
| 0.0 | 1.2 | REACTOME_SIGNALING_BY_RHO_GTPASES | Genes involved in Signaling by Rho GTPases |
| 0.0 | 0.2 | REACTOME_GLYCOGEN_BREAKDOWN_GLYCOGENOLYSIS | Genes involved in Glycogen breakdown (glycogenolysis) |