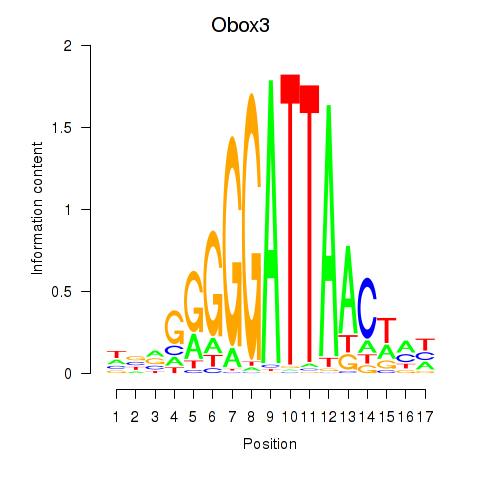
Motif ID: Obox3
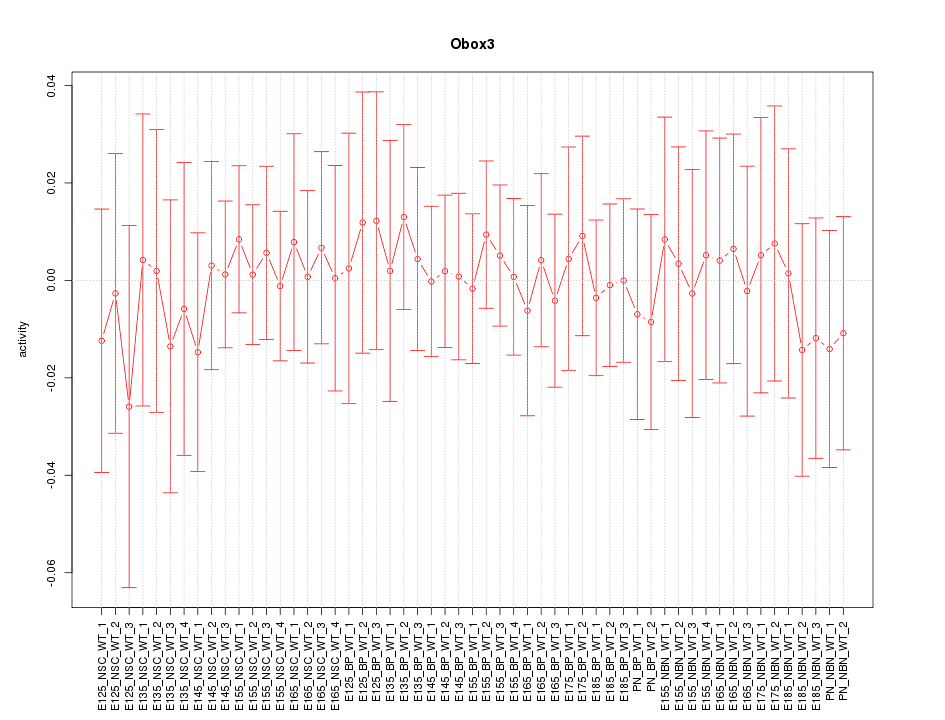
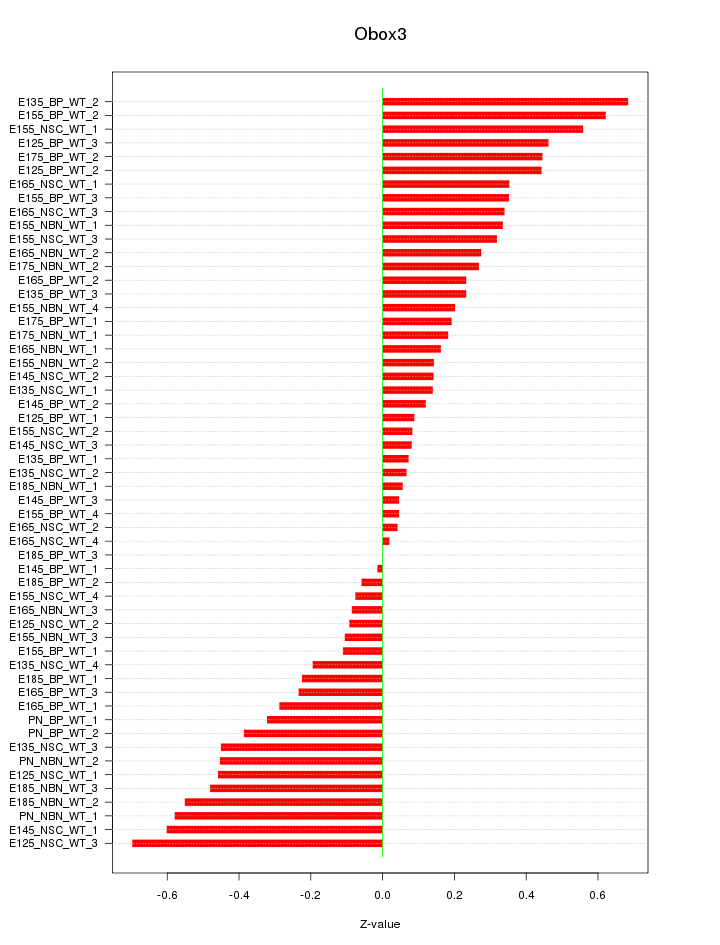
Z-value: 0.323
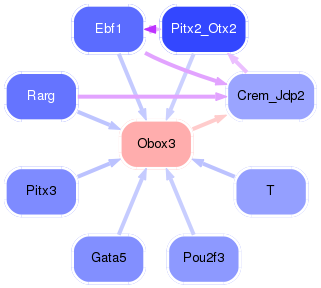
Transcription factors associated with Obox3:
| Gene Symbol | Entrez ID | Gene Name |
|---|---|---|
| Obox3 | ENSMUSG00000066772.6 | Obox3 |
Activity-expression correlation:
| Gene Symbol | Promoter | Pearson corr. coef. | P-value | Plot |
|---|---|---|---|---|
| Obox3 | mm10_v2_chr7_-_15627876_15627876 | 0.06 | 6.4e-01 | Click! |

Top targets:
Gene overrepresentation in biological_process category:
| Log-likelihood per target | Total log-likelihood | Term | Description |
|---|---|---|---|
| 0.4 | 1.1 | GO:1904049 | negative regulation of spontaneous neurotransmitter secretion(GO:1904049) |
| 0.2 | 1.9 | GO:0014824 | artery smooth muscle contraction(GO:0014824) |
| 0.2 | 0.9 | GO:0015671 | oxygen transport(GO:0015671) |
| 0.1 | 0.8 | GO:1903690 | negative regulation of wound healing, spreading of epidermal cells(GO:1903690) |
| 0.1 | 0.5 | GO:0006543 | glutamine catabolic process(GO:0006543) |
| 0.1 | 0.6 | GO:0033504 | floor plate development(GO:0033504) |
| 0.1 | 1.4 | GO:0051764 | actin crosslink formation(GO:0051764) |
| 0.1 | 0.2 | GO:0048698 | negative regulation of collateral sprouting in absence of injury(GO:0048698) |
| 0.0 | 0.7 | GO:0007250 | activation of NF-kappaB-inducing kinase activity(GO:0007250) |
| 0.0 | 0.5 | GO:1900113 | negative regulation of histone H3-K9 trimethylation(GO:1900113) |
| 0.0 | 0.5 | GO:0010818 | T cell chemotaxis(GO:0010818) |
| 0.0 | 0.2 | GO:0046007 | negative regulation of activated T cell proliferation(GO:0046007) |
| 0.0 | 0.2 | GO:0014029 | neural crest formation(GO:0014029) |
Gene overrepresentation in cellular_component category:
| Log-likelihood per target | Total log-likelihood | Term | Description |
|---|---|---|---|
| 0.2 | 1.1 | GO:1990761 | growth cone lamellipodium(GO:1990761) |
| 0.2 | 0.8 | GO:0030981 | cortical microtubule cytoskeleton(GO:0030981) |
| 0.1 | 0.9 | GO:0005833 | hemoglobin complex(GO:0005833) |
| 0.1 | 0.7 | GO:0008385 | IkappaB kinase complex(GO:0008385) |
| 0.0 | 2.3 | GO:0005834 | heterotrimeric G-protein complex(GO:0005834) |
| 0.0 | 0.3 | GO:0001739 | sex chromatin(GO:0001739) |
| 0.0 | 1.4 | GO:0031941 | filamentous actin(GO:0031941) |
| 0.0 | 0.2 | GO:0005952 | cAMP-dependent protein kinase complex(GO:0005952) |
| 0.0 | 1.9 | GO:0043198 | dendritic shaft(GO:0043198) |
| 0.0 | 0.5 | GO:0005721 | pericentric heterochromatin(GO:0005721) |
Gene overrepresentation in molecular_function category:
| Log-likelihood per target | Total log-likelihood | Term | Description |
|---|---|---|---|
| 0.2 | 0.9 | GO:0031721 | hemoglobin alpha binding(GO:0031721) |
| 0.2 | 0.7 | GO:1990450 | linear polyubiquitin binding(GO:1990450) |
| 0.2 | 1.4 | GO:0035374 | chondroitin sulfate binding(GO:0035374) |
| 0.2 | 0.8 | GO:0043515 | kinetochore binding(GO:0043515) |
| 0.1 | 2.3 | GO:0031681 | G-protein beta-subunit binding(GO:0031681) |
| 0.1 | 0.9 | GO:0004726 | non-membrane spanning protein tyrosine phosphatase activity(GO:0004726) |
| 0.1 | 0.5 | GO:0004359 | glutaminase activity(GO:0004359) |
| 0.1 | 0.2 | GO:0001042 | RNA polymerase I core binding(GO:0001042) |
| 0.0 | 0.5 | GO:0005041 | low-density lipoprotein receptor activity(GO:0005041) |
| 0.0 | 1.1 | GO:0008157 | protein phosphatase 1 binding(GO:0008157) |
| 0.0 | 0.9 | GO:0050750 | low-density lipoprotein particle receptor binding(GO:0050750) |
| 0.0 | 0.5 | GO:0032454 | histone demethylase activity (H3-K9 specific)(GO:0032454) histone demethylase activity (H3-K36 specific)(GO:0051864) |
| 0.0 | 0.1 | GO:0051185 | coenzyme transporter activity(GO:0051185) |
| 0.0 | 0.2 | GO:0008603 | cAMP-dependent protein kinase regulator activity(GO:0008603) |
| 0.0 | 1.9 | GO:0035254 | glutamate receptor binding(GO:0035254) |
| 0.0 | 0.3 | GO:0015269 | calcium-activated potassium channel activity(GO:0015269) |
| 0.0 | 0.9 | GO:0005200 | structural constituent of cytoskeleton(GO:0005200) |
Gene overrepresentation in C2:CP category:
| Log-likelihood per target | Total log-likelihood | Term | Description |
|---|---|---|---|
| 0.2 | 2.3 | PID_THROMBIN_PAR4_PATHWAY | PAR4-mediated thrombin signaling events |
| 0.0 | 0.7 | PID_TOLL_ENDOGENOUS_PATHWAY | Endogenous TLR signaling |
| 0.0 | 0.6 | PID_HEDGEHOG_2PATHWAY | Signaling events mediated by the Hedgehog family |
| 0.0 | 1.3 | PID_REG_GR_PATHWAY | Glucocorticoid receptor regulatory network |
Gene overrepresentation in C2:CP:REACTOME category:
| Log-likelihood per target | Total log-likelihood | Term | Description |
|---|---|---|---|
| 0.1 | 1.9 | REACTOME_TRAFFICKING_OF_GLUR2_CONTAINING_AMPA_RECEPTORS | Genes involved in Trafficking of GluR2-containing AMPA receptors |
| 0.1 | 2.3 | REACTOME_G_BETA_GAMMA_SIGNALLING_THROUGH_PLC_BETA | Genes involved in G beta:gamma signalling through PLC beta |
| 0.1 | 1.4 | REACTOME_CRMPS_IN_SEMA3A_SIGNALING | Genes involved in CRMPs in Sema3A signaling |
| 0.1 | 0.7 | REACTOME_IKK_COMPLEX_RECRUITMENT_MEDIATED_BY_RIP1 | Genes involved in IKK complex recruitment mediated by RIP1 |
| 0.0 | 0.5 | REACTOME_GLUTAMATE_NEUROTRANSMITTER_RELEASE_CYCLE | Genes involved in Glutamate Neurotransmitter Release Cycle |
| 0.0 | 0.8 | REACTOME_SIGNALING_BY_ROBO_RECEPTOR | Genes involved in Signaling by Robo receptor |
| 0.0 | 0.5 | REACTOME_CHEMOKINE_RECEPTORS_BIND_CHEMOKINES | Genes involved in Chemokine receptors bind chemokines |