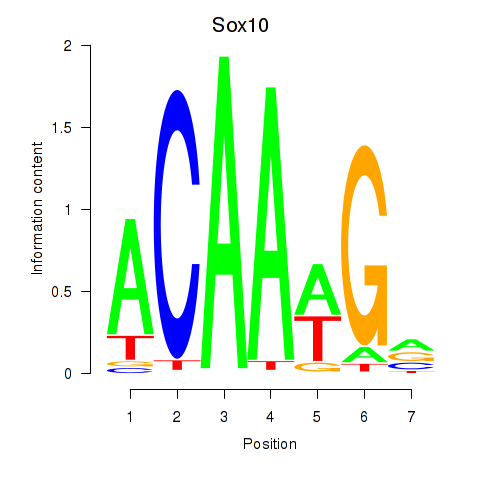
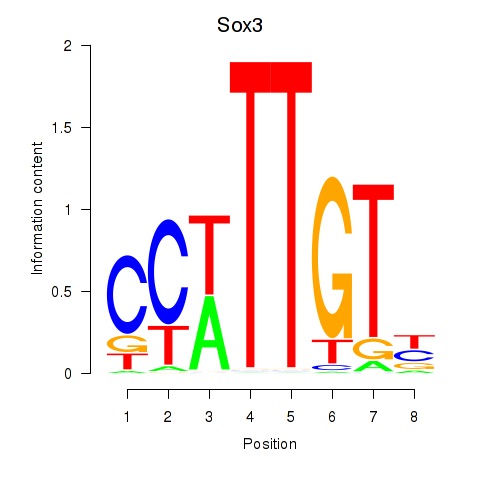
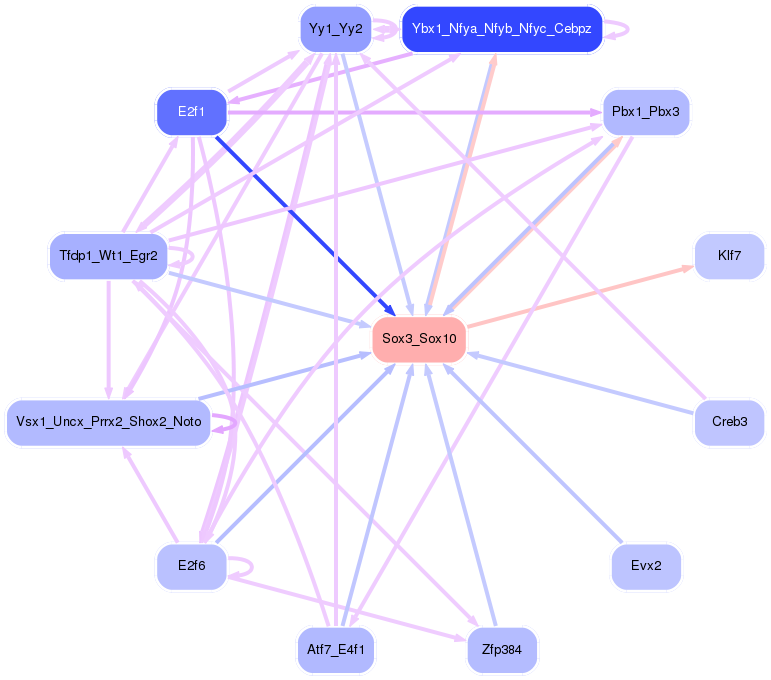
Motif ID: Sox3_Sox10
Z-value: 1.587
Transcription factors associated with Sox3_Sox10:
| Gene Symbol | Entrez ID | Gene Name |
|---|---|---|
| Sox10 | ENSMUSG00000033006.9 | Sox10 |
| Sox3 | ENSMUSG00000045179.8 | Sox3 |
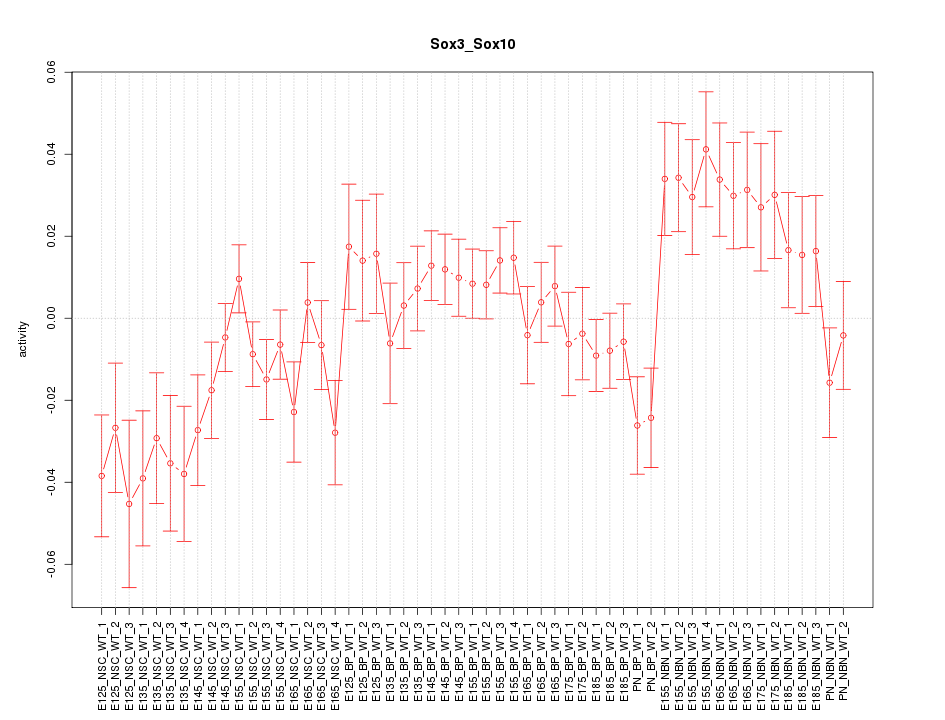
Activity-expression correlation:
| Gene Symbol | Promoter | Pearson corr. coef. | P-value | Plot |
|---|---|---|---|---|
| Sox3 | mm10_v2_chrX_-_60893430_60893440 | -0.64 | 1.1e-07 | Click! |
| Sox10 | mm10_v2_chr15_-_79164477_79164496 | -0.25 | 6.8e-02 | Click! |


Top targets:
Gene overrepresentation in biological_process category:
| Log-likelihood per target | Total log-likelihood | Term | Description |
|---|---|---|---|
| 4.3 | 12.8 | GO:0042560 | 10-formyltetrahydrofolate catabolic process(GO:0009258) folic acid-containing compound catabolic process(GO:0009397) pteridine-containing compound catabolic process(GO:0042560) |
| 3.6 | 32.6 | GO:1900034 | regulation of cellular response to heat(GO:1900034) |
| 3.5 | 14.1 | GO:0099566 | regulation of postsynaptic cytosolic calcium ion concentration(GO:0099566) |
| 3.4 | 10.2 | GO:1903538 | meiotic cell cycle process involved in oocyte maturation(GO:1903537) regulation of meiotic cell cycle process involved in oocyte maturation(GO:1903538) |
| 3.4 | 13.5 | GO:1904425 | negative regulation of GTP binding(GO:1904425) |
| 3.4 | 16.8 | GO:1902309 | negative regulation of peptidyl-serine dephosphorylation(GO:1902309) |
| 3.3 | 9.9 | GO:0032241 | positive regulation of nucleobase-containing compound transport(GO:0032241) |
| 3.1 | 9.4 | GO:0001543 | ovarian follicle rupture(GO:0001543) |
| 3.1 | 9.2 | GO:2000297 | negative regulation of synapse maturation(GO:2000297) |
| 3.0 | 15.2 | GO:0043314 | negative regulation of neutrophil degranulation(GO:0043314) negative regulation of blood vessel remodeling(GO:0060313) |
| 2.7 | 19.2 | GO:0070494 | regulation of thrombin receptor signaling pathway(GO:0070494) negative regulation of thrombin receptor signaling pathway(GO:0070495) |
| 2.7 | 8.1 | GO:1903976 | negative regulation of glial cell migration(GO:1903976) |
| 2.3 | 11.7 | GO:2001025 | positive regulation of response to drug(GO:2001025) |
| 2.3 | 6.8 | GO:0007521 | muscle cell fate determination(GO:0007521) cellular response to parathyroid hormone stimulus(GO:0071374) |
| 2.3 | 6.8 | GO:1900039 | positive regulation of cellular response to hypoxia(GO:1900039) |
| 2.3 | 9.0 | GO:1904529 | regulation of actin filament binding(GO:1904529) regulation of actin binding(GO:1904616) |
| 2.1 | 17.0 | GO:0006003 | fructose 2,6-bisphosphate metabolic process(GO:0006003) |
| 2.0 | 10.1 | GO:0046684 | response to pyrethroid(GO:0046684) |
| 2.0 | 5.9 | GO:0002842 | positive regulation of T cell mediated immune response to tumor cell(GO:0002842) |
| 1.9 | 25.0 | GO:1901898 | negative regulation of relaxation of cardiac muscle(GO:1901898) |
| 1.9 | 15.1 | GO:0005513 | detection of calcium ion(GO:0005513) |
| 1.8 | 5.5 | GO:0060912 | cardiac cell fate specification(GO:0060912) |
| 1.8 | 5.4 | GO:2000344 | positive regulation of acrosome reaction(GO:2000344) |
| 1.8 | 16.0 | GO:0098907 | protein localization to M-band(GO:0036309) protein localization to T-tubule(GO:0036371) regulation of SA node cell action potential(GO:0098907) |
| 1.7 | 11.9 | GO:0086018 | SA node cell action potential(GO:0086015) SA node cell to atrial cardiac muscle cell signalling(GO:0086018) SA node cell to atrial cardiac muscle cell communication(GO:0086070) |
| 1.7 | 5.1 | GO:0098528 | skeletal muscle fiber differentiation(GO:0098528) |
| 1.7 | 5.0 | GO:0014877 | response to inactivity(GO:0014854) response to muscle inactivity(GO:0014870) response to muscle inactivity involved in regulation of muscle adaptation(GO:0014877) response to denervation involved in regulation of muscle adaptation(GO:0014894) |
| 1.7 | 5.0 | GO:0031161 | phosphatidylinositol catabolic process(GO:0031161) |
| 1.6 | 24.4 | GO:0048672 | positive regulation of collateral sprouting(GO:0048672) |
| 1.6 | 4.9 | GO:2000312 | regulation of kainate selective glutamate receptor activity(GO:2000312) |
| 1.6 | 3.1 | GO:0038093 | Fc receptor signaling pathway(GO:0038093) |
| 1.6 | 17.1 | GO:0046543 | development of secondary female sexual characteristics(GO:0046543) |
| 1.5 | 4.6 | GO:0038095 | positive regulation of mast cell cytokine production(GO:0032765) Fc-epsilon receptor signaling pathway(GO:0038095) |
| 1.5 | 6.0 | GO:0003105 | negative regulation of glomerular filtration(GO:0003105) |
| 1.4 | 8.2 | GO:0051694 | pointed-end actin filament capping(GO:0051694) |
| 1.4 | 12.3 | GO:0001574 | ganglioside biosynthetic process(GO:0001574) |
| 1.3 | 5.4 | GO:0046898 | response to cycloheximide(GO:0046898) |
| 1.3 | 3.9 | GO:0016598 | protein arginylation(GO:0016598) |
| 1.3 | 6.6 | GO:1900042 | positive regulation of interleukin-2 secretion(GO:1900042) |
| 1.3 | 2.6 | GO:1904339 | negative regulation of dopaminergic neuron differentiation(GO:1904339) |
| 1.3 | 9.1 | GO:0046103 | inosine biosynthetic process(GO:0046103) |
| 1.3 | 5.2 | GO:0001922 | B-1 B cell homeostasis(GO:0001922) |
| 1.3 | 11.7 | GO:0051152 | positive regulation of smooth muscle cell differentiation(GO:0051152) |
| 1.2 | 3.7 | GO:0030827 | negative regulation of cGMP metabolic process(GO:0030824) negative regulation of cGMP biosynthetic process(GO:0030827) negative regulation of guanylate cyclase activity(GO:0031283) |
| 1.2 | 3.7 | GO:0061030 | epithelial cell differentiation involved in mammary gland alveolus development(GO:0061030) |
| 1.2 | 7.3 | GO:0098909 | regulation of cardiac muscle cell action potential involved in regulation of contraction(GO:0098909) |
| 1.2 | 3.6 | GO:0032650 | regulation of interleukin-1 alpha production(GO:0032650) positive regulation of interleukin-1 alpha production(GO:0032730) interleukin-1 alpha secretion(GO:0050703) |
| 1.2 | 9.6 | GO:0035887 | aortic smooth muscle cell differentiation(GO:0035887) |
| 1.2 | 6.0 | GO:0007197 | adenylate cyclase-inhibiting G-protein coupled acetylcholine receptor signaling pathway(GO:0007197) phospholipase C-activating G-protein coupled acetylcholine receptor signaling pathway(GO:0007207) |
| 1.2 | 4.7 | GO:0021812 | neuronal-glial interaction involved in cerebral cortex radial glia guided migration(GO:0021812) |
| 1.2 | 1.2 | GO:0021940 | regulation of cerebellar granule cell precursor proliferation(GO:0021936) cerebellar Purkinje cell-granule cell precursor cell signaling involved in regulation of granule cell precursor cell proliferation(GO:0021937) positive regulation of cerebellar granule cell precursor proliferation(GO:0021940) |
| 1.1 | 3.4 | GO:2000620 | positive regulation of histone H4-K16 acetylation(GO:2000620) |
| 1.1 | 3.4 | GO:0061588 | calcium activated phospholipid scrambling(GO:0061588) calcium activated phosphatidylserine scrambling(GO:0061589) calcium activated phosphatidylcholine scrambling(GO:0061590) calcium activated galactosylceramide scrambling(GO:0061591) |
| 1.1 | 4.5 | GO:0010808 | positive regulation of synaptic vesicle priming(GO:0010808) |
| 1.1 | 1.1 | GO:1904879 | positive regulation of calcium ion transmembrane transport via high voltage-gated calcium channel(GO:1904879) |
| 1.1 | 9.5 | GO:0019800 | peptide cross-linking via chondroitin 4-sulfate glycosaminoglycan(GO:0019800) |
| 1.0 | 2.1 | GO:0021586 | pons maturation(GO:0021586) |
| 1.0 | 18.5 | GO:0006054 | N-acetylneuraminate metabolic process(GO:0006054) |
| 1.0 | 4.0 | GO:2000795 | negative regulation of epithelial cell proliferation involved in lung morphogenesis(GO:2000795) |
| 1.0 | 7.8 | GO:0045075 | interleukin-12 biosynthetic process(GO:0042090) regulation of interleukin-12 biosynthetic process(GO:0045075) |
| 1.0 | 2.9 | GO:0008594 | photoreceptor cell morphogenesis(GO:0008594) |
| 1.0 | 2.9 | GO:1990416 | cellular response to brain-derived neurotrophic factor stimulus(GO:1990416) |
| 1.0 | 3.8 | GO:1900740 | regulation of protein insertion into mitochondrial membrane involved in apoptotic signaling pathway(GO:1900739) positive regulation of protein insertion into mitochondrial membrane involved in apoptotic signaling pathway(GO:1900740) |
| 1.0 | 3.8 | GO:0071638 | negative regulation of monocyte chemotactic protein-1 production(GO:0071638) |
| 0.9 | 2.8 | GO:0070428 | regulation of nucleotide-binding oligomerization domain containing signaling pathway(GO:0070424) regulation of nucleotide-binding oligomerization domain containing 1 signaling pathway(GO:0070428) regulation of nucleotide-binding oligomerization domain containing 2 signaling pathway(GO:0070432) |
| 0.9 | 6.6 | GO:0019532 | oxalate transport(GO:0019532) |
| 0.9 | 3.6 | GO:2000481 | positive regulation of cAMP-dependent protein kinase activity(GO:2000481) |
| 0.9 | 1.8 | GO:0035507 | regulation of myosin-light-chain-phosphatase activity(GO:0035507) |
| 0.9 | 13.3 | GO:0048875 | chemical homeostasis within a tissue(GO:0048875) |
| 0.9 | 1.8 | GO:0097477 | lateral motor column neuron migration(GO:0097477) |
| 0.9 | 4.4 | GO:0001661 | conditioned taste aversion(GO:0001661) amygdala development(GO:0021764) |
| 0.8 | 1.7 | GO:0060025 | regulation of synaptic activity(GO:0060025) |
| 0.8 | 2.5 | GO:0070086 | ubiquitin-dependent endocytosis(GO:0070086) |
| 0.8 | 8.1 | GO:0061470 | interleukin-21 production(GO:0032625) T follicular helper cell differentiation(GO:0061470) interleukin-21 secretion(GO:0072619) |
| 0.8 | 3.2 | GO:2000830 | vacuolar phosphate transport(GO:0007037) vitamin D3 metabolic process(GO:0070640) positive regulation of parathyroid hormone secretion(GO:2000830) |
| 0.8 | 6.4 | GO:0097118 | neuroligin clustering involved in postsynaptic membrane assembly(GO:0097118) |
| 0.8 | 2.4 | GO:0050883 | regulation of sulfur amino acid metabolic process(GO:0031335) musculoskeletal movement, spinal reflex action(GO:0050883) |
| 0.8 | 30.4 | GO:0007026 | negative regulation of microtubule depolymerization(GO:0007026) |
| 0.8 | 11.7 | GO:1902260 | negative regulation of delayed rectifier potassium channel activity(GO:1902260) |
| 0.8 | 2.3 | GO:2001180 | negative regulation of interleukin-10 secretion(GO:2001180) |
| 0.8 | 0.8 | GO:0045652 | regulation of megakaryocyte differentiation(GO:0045652) |
| 0.8 | 3.8 | GO:1901843 | positive regulation of high voltage-gated calcium channel activity(GO:1901843) |
| 0.8 | 5.3 | GO:0032511 | late endosome to vacuole transport via multivesicular body sorting pathway(GO:0032511) |
| 0.8 | 6.8 | GO:0071420 | cellular response to histamine(GO:0071420) |
| 0.7 | 4.4 | GO:0007258 | JUN phosphorylation(GO:0007258) |
| 0.7 | 4.4 | GO:0042276 | error-prone translesion synthesis(GO:0042276) |
| 0.7 | 4.4 | GO:1902669 | positive regulation of axon guidance(GO:1902669) |
| 0.7 | 2.2 | GO:2000616 | negative regulation of histone H3-K9 acetylation(GO:2000616) |
| 0.7 | 4.3 | GO:0000160 | phosphorelay signal transduction system(GO:0000160) |
| 0.7 | 2.2 | GO:0021649 | vestibulocochlear nerve structural organization(GO:0021649) ganglion morphogenesis(GO:0061552) dorsal root ganglion morphogenesis(GO:1904835) |
| 0.7 | 9.2 | GO:0016191 | synaptic vesicle uncoating(GO:0016191) |
| 0.7 | 2.1 | GO:0070649 | formin-nucleated actin cable assembly(GO:0070649) |
| 0.7 | 2.8 | GO:1904694 | negative regulation of vascular smooth muscle contraction(GO:1904694) |
| 0.7 | 2.7 | GO:0045054 | constitutive secretory pathway(GO:0045054) |
| 0.7 | 2.0 | GO:1900149 | positive regulation of Schwann cell migration(GO:1900149) |
| 0.7 | 4.1 | GO:0009405 | pathogenesis(GO:0009405) |
| 0.7 | 6.0 | GO:0021902 | commitment of neuronal cell to specific neuron type in forebrain(GO:0021902) |
| 0.7 | 2.7 | GO:0036072 | intramembranous ossification(GO:0001957) direct ossification(GO:0036072) |
| 0.7 | 2.0 | GO:0017085 | response to insecticide(GO:0017085) |
| 0.6 | 1.3 | GO:0051967 | negative regulation of synaptic transmission, glutamatergic(GO:0051967) |
| 0.6 | 2.5 | GO:0021886 | hypothalamus gonadotrophin-releasing hormone neuron differentiation(GO:0021886) hypothalamus gonadotrophin-releasing hormone neuron development(GO:0021888) |
| 0.6 | 10.1 | GO:0014051 | gamma-aminobutyric acid secretion(GO:0014051) |
| 0.6 | 6.9 | GO:0009312 | oligosaccharide biosynthetic process(GO:0009312) |
| 0.6 | 3.7 | GO:2000672 | negative regulation of motor neuron apoptotic process(GO:2000672) |
| 0.6 | 3.0 | GO:0006177 | GMP biosynthetic process(GO:0006177) |
| 0.6 | 1.8 | GO:0060708 | spongiotrophoblast differentiation(GO:0060708) |
| 0.6 | 1.8 | GO:0018008 | N-terminal peptidyl-glycine N-myristoylation(GO:0018008) |
| 0.6 | 1.8 | GO:1904049 | negative regulation of spontaneous neurotransmitter secretion(GO:1904049) |
| 0.6 | 3.5 | GO:0070294 | renal sodium ion absorption(GO:0070294) |
| 0.6 | 1.7 | GO:0060478 | acrosomal vesicle exocytosis(GO:0060478) |
| 0.6 | 3.5 | GO:1990573 | potassium ion import across plasma membrane(GO:1990573) |
| 0.6 | 1.7 | GO:0018377 | N-terminal protein lipidation(GO:0006498) N-terminal protein myristoylation(GO:0006499) protein myristoylation(GO:0018377) |
| 0.6 | 3.4 | GO:0015014 | heparan sulfate proteoglycan biosynthetic process, polysaccharide chain biosynthetic process(GO:0015014) |
| 0.6 | 5.1 | GO:0016198 | axon choice point recognition(GO:0016198) |
| 0.6 | 4.4 | GO:1901629 | regulation of presynaptic membrane organization(GO:1901629) |
| 0.5 | 6.6 | GO:0043653 | mitochondrial fragmentation involved in apoptotic process(GO:0043653) |
| 0.5 | 6.0 | GO:2000480 | negative regulation of cAMP-dependent protein kinase activity(GO:2000480) |
| 0.5 | 10.3 | GO:0022027 | interkinetic nuclear migration(GO:0022027) |
| 0.5 | 1.6 | GO:0019676 | ammonia assimilation cycle(GO:0019676) |
| 0.5 | 5.9 | GO:0007194 | negative regulation of adenylate cyclase activity(GO:0007194) |
| 0.5 | 2.5 | GO:0061073 | anterior commissure morphogenesis(GO:0021960) ciliary body morphogenesis(GO:0061073) |
| 0.5 | 3.4 | GO:0007158 | neuron cell-cell adhesion(GO:0007158) |
| 0.5 | 2.5 | GO:0000117 | regulation of transcription involved in G2/M transition of mitotic cell cycle(GO:0000117) |
| 0.5 | 1.9 | GO:0001920 | negative regulation of receptor recycling(GO:0001920) |
| 0.5 | 3.4 | GO:1904217 | regulation of CDP-diacylglycerol-serine O-phosphatidyltransferase activity(GO:1904217) positive regulation of CDP-diacylglycerol-serine O-phosphatidyltransferase activity(GO:1904219) regulation of serine C-palmitoyltransferase activity(GO:1904220) positive regulation of serine C-palmitoyltransferase activity(GO:1904222) |
| 0.5 | 1.4 | GO:0071929 | alpha-tubulin acetylation(GO:0071929) |
| 0.5 | 4.2 | GO:2001135 | regulation of endocytic recycling(GO:2001135) |
| 0.5 | 1.9 | GO:0016128 | phytosteroid metabolic process(GO:0016128) phytosteroid biosynthetic process(GO:0016129) |
| 0.5 | 2.3 | GO:1902775 | mitochondrial large ribosomal subunit assembly(GO:1902775) |
| 0.5 | 3.7 | GO:0061368 | maternal process involved in parturition(GO:0060137) behavioral response to chemical pain(GO:0061366) behavioral response to formalin induced pain(GO:0061368) |
| 0.5 | 3.7 | GO:0014848 | urinary bladder smooth muscle contraction(GO:0014832) urinary tract smooth muscle contraction(GO:0014848) |
| 0.5 | 1.4 | GO:0021698 | cerebellar cortex structural organization(GO:0021698) |
| 0.4 | 18.7 | GO:0006376 | mRNA splice site selection(GO:0006376) |
| 0.4 | 1.3 | GO:0031547 | brain-derived neurotrophic factor receptor signaling pathway(GO:0031547) |
| 0.4 | 15.4 | GO:0050919 | negative chemotaxis(GO:0050919) |
| 0.4 | 1.2 | GO:0007525 | somatic muscle development(GO:0007525) |
| 0.4 | 1.2 | GO:0061744 | motor behavior(GO:0061744) |
| 0.4 | 1.2 | GO:1900365 | cytoplasmic translational elongation(GO:0002182) regulation of cytoplasmic translational elongation(GO:1900247) negative regulation of cytoplasmic translational elongation(GO:1900248) positive regulation of mRNA polyadenylation(GO:1900365) |
| 0.4 | 1.2 | GO:0009597 | detection of virus(GO:0009597) |
| 0.4 | 2.0 | GO:0060178 | regulation of exocyst localization(GO:0060178) |
| 0.4 | 5.6 | GO:0033623 | regulation of integrin activation(GO:0033623) |
| 0.4 | 1.6 | GO:0044861 | protein transport into plasma membrane raft(GO:0044861) |
| 0.4 | 1.5 | GO:0007352 | zygotic specification of dorsal/ventral axis(GO:0007352) positive regulation of nodal signaling pathway involved in determination of lateral mesoderm left/right asymmetry(GO:1900224) positive regulation of mesoderm development(GO:2000382) |
| 0.4 | 3.8 | GO:1900113 | negative regulation of histone H3-K9 trimethylation(GO:1900113) |
| 0.4 | 1.5 | GO:0035025 | positive regulation of Rho protein signal transduction(GO:0035025) |
| 0.4 | 0.7 | GO:0002035 | brain renin-angiotensin system(GO:0002035) |
| 0.4 | 1.1 | GO:0090285 | negative regulation of protein glycosylation in Golgi(GO:0090285) |
| 0.4 | 2.9 | GO:0038180 | nerve growth factor signaling pathway(GO:0038180) |
| 0.4 | 2.6 | GO:0060124 | positive regulation of growth hormone secretion(GO:0060124) |
| 0.4 | 1.1 | GO:0042726 | flavin-containing compound metabolic process(GO:0042726) |
| 0.4 | 8.8 | GO:0008340 | determination of adult lifespan(GO:0008340) |
| 0.4 | 1.8 | GO:1902455 | negative regulation of stem cell population maintenance(GO:1902455) |
| 0.4 | 2.5 | GO:0015808 | L-alanine transport(GO:0015808) |
| 0.4 | 3.6 | GO:1901621 | negative regulation of smoothened signaling pathway involved in dorsal/ventral neural tube patterning(GO:1901621) |
| 0.4 | 3.9 | GO:0007141 | male meiosis I(GO:0007141) |
| 0.4 | 7.8 | GO:0030517 | negative regulation of axon extension(GO:0030517) |
| 0.3 | 5.6 | GO:0048240 | sperm capacitation(GO:0048240) |
| 0.3 | 5.2 | GO:0031115 | negative regulation of microtubule polymerization(GO:0031115) |
| 0.3 | 1.0 | GO:0060017 | parathyroid gland development(GO:0060017) |
| 0.3 | 48.0 | GO:0007416 | synapse assembly(GO:0007416) |
| 0.3 | 2.0 | GO:0099590 | neurotransmitter receptor internalization(GO:0099590) |
| 0.3 | 11.8 | GO:0051491 | positive regulation of filopodium assembly(GO:0051491) |
| 0.3 | 2.7 | GO:0061577 | calcium ion transmembrane transport via high voltage-gated calcium channel(GO:0061577) |
| 0.3 | 1.0 | GO:0003245 | cardiac muscle tissue growth involved in heart morphogenesis(GO:0003245) |
| 0.3 | 2.3 | GO:0046549 | retinal cone cell development(GO:0046549) |
| 0.3 | 0.6 | GO:0071550 | death-inducing signaling complex assembly(GO:0071550) |
| 0.3 | 8.7 | GO:0043551 | regulation of phosphatidylinositol 3-kinase activity(GO:0043551) |
| 0.3 | 52.1 | GO:0030041 | actin filament polymerization(GO:0030041) |
| 0.3 | 0.9 | GO:0007023 | post-chaperonin tubulin folding pathway(GO:0007023) |
| 0.3 | 0.3 | GO:2000646 | negative regulation of PERK-mediated unfolded protein response(GO:1903898) positive regulation of receptor catabolic process(GO:2000646) |
| 0.3 | 0.9 | GO:0098974 | postsynaptic actin cytoskeleton organization(GO:0098974) |
| 0.3 | 5.0 | GO:2000311 | regulation of alpha-amino-3-hydroxy-5-methyl-4-isoxazole propionate selective glutamate receptor activity(GO:2000311) |
| 0.3 | 1.6 | GO:0021626 | hindbrain maturation(GO:0021578) cerebellum maturation(GO:0021590) central nervous system maturation(GO:0021626) cerebellar cortex maturation(GO:0021699) |
| 0.3 | 1.2 | GO:0001550 | ovarian cumulus expansion(GO:0001550) fused antrum stage(GO:0048165) |
| 0.3 | 0.9 | GO:0015772 | disaccharide transport(GO:0015766) sucrose transport(GO:0015770) oligosaccharide transport(GO:0015772) |
| 0.3 | 8.0 | GO:0016578 | histone deubiquitination(GO:0016578) |
| 0.3 | 3.8 | GO:0030042 | actin filament depolymerization(GO:0030042) |
| 0.3 | 5.5 | GO:0035414 | negative regulation of catenin import into nucleus(GO:0035414) |
| 0.3 | 2.9 | GO:0098887 | neurotransmitter receptor transport, endosome to postsynaptic membrane(GO:0098887) endosome to plasma membrane protein transport(GO:0099638) neurotransmitter receptor transport, endosome to plasma membrane(GO:0099639) |
| 0.3 | 1.1 | GO:0060158 | phospholipase C-activating dopamine receptor signaling pathway(GO:0060158) |
| 0.3 | 0.6 | GO:0035547 | interferon-beta secretion(GO:0035546) regulation of interferon-beta secretion(GO:0035547) positive regulation of interferon-beta secretion(GO:0035549) |
| 0.3 | 0.9 | GO:0072382 | minus-end-directed vesicle transport along microtubule(GO:0072382) |
| 0.3 | 0.6 | GO:0072385 | minus-end-directed organelle transport along microtubule(GO:0072385) |
| 0.3 | 1.7 | GO:1903071 | positive regulation of ER-associated ubiquitin-dependent protein catabolic process(GO:1903071) |
| 0.3 | 3.0 | GO:0002230 | positive regulation of defense response to virus by host(GO:0002230) |
| 0.3 | 20.0 | GO:0010923 | negative regulation of phosphatase activity(GO:0010923) |
| 0.3 | 3.5 | GO:0047497 | establishment of mitochondrion localization, microtubule-mediated(GO:0034643) mitochondrion transport along microtubule(GO:0047497) |
| 0.3 | 1.1 | GO:0033326 | cerebrospinal fluid secretion(GO:0033326) |
| 0.3 | 0.8 | GO:0030643 | cellular phosphate ion homeostasis(GO:0030643) cellular trivalent inorganic anion homeostasis(GO:0072502) |
| 0.3 | 2.7 | GO:0014010 | Schwann cell proliferation(GO:0014010) |
| 0.3 | 4.8 | GO:0046069 | cGMP catabolic process(GO:0046069) |
| 0.3 | 1.9 | GO:0045760 | positive regulation of action potential(GO:0045760) |
| 0.3 | 1.6 | GO:0035435 | phosphate ion transmembrane transport(GO:0035435) |
| 0.3 | 1.6 | GO:0036438 | maintenance of lens transparency(GO:0036438) |
| 0.3 | 2.5 | GO:0042754 | negative regulation of circadian rhythm(GO:0042754) |
| 0.3 | 3.0 | GO:0046855 | phosphorylated carbohydrate dephosphorylation(GO:0046838) inositol phosphate dephosphorylation(GO:0046855) |
| 0.2 | 2.2 | GO:1990845 | adaptive thermogenesis(GO:1990845) |
| 0.2 | 1.2 | GO:0045324 | late endosome to vacuole transport(GO:0045324) |
| 0.2 | 0.7 | GO:0090649 | cellular response to manganese ion(GO:0071287) response to oxygen-glucose deprivation(GO:0090649) cellular response to oxygen-glucose deprivation(GO:0090650) |
| 0.2 | 2.4 | GO:0021684 | cerebellar granular layer formation(GO:0021684) cerebellar granule cell differentiation(GO:0021707) |
| 0.2 | 3.3 | GO:0008090 | retrograde axonal transport(GO:0008090) |
| 0.2 | 0.7 | GO:0051036 | regulation of endosome size(GO:0051036) |
| 0.2 | 0.7 | GO:0035574 | histone H4-K20 demethylation(GO:0035574) |
| 0.2 | 2.7 | GO:1900383 | regulation of synaptic plasticity by receptor localization to synapse(GO:1900383) |
| 0.2 | 1.3 | GO:0031584 | activation of phospholipase D activity(GO:0031584) |
| 0.2 | 2.8 | GO:0043252 | sodium-independent organic anion transport(GO:0043252) |
| 0.2 | 2.1 | GO:0033169 | histone H3-K9 demethylation(GO:0033169) |
| 0.2 | 1.0 | GO:0090292 | nuclear matrix organization(GO:0043578) nuclear matrix anchoring at nuclear membrane(GO:0090292) |
| 0.2 | 3.7 | GO:0033198 | response to ATP(GO:0033198) |
| 0.2 | 1.2 | GO:0090315 | negative regulation of protein targeting to membrane(GO:0090315) |
| 0.2 | 3.5 | GO:0008210 | estrogen metabolic process(GO:0008210) |
| 0.2 | 1.8 | GO:0021540 | corpus callosum morphogenesis(GO:0021540) |
| 0.2 | 2.6 | GO:0045947 | negative regulation of translational initiation(GO:0045947) |
| 0.2 | 1.2 | GO:0003344 | pericardium morphogenesis(GO:0003344) |
| 0.2 | 1.3 | GO:0036265 | RNA (guanine-N7)-methylation(GO:0036265) |
| 0.2 | 1.1 | GO:0006646 | phosphatidylethanolamine biosynthetic process(GO:0006646) |
| 0.2 | 0.8 | GO:1902268 | negative regulation of polyamine transmembrane transport(GO:1902268) |
| 0.2 | 0.9 | GO:0000480 | endonucleolytic cleavage in 5'-ETS of tricistronic rRNA transcript (SSU-rRNA, 5.8S rRNA, LSU-rRNA)(GO:0000480) |
| 0.2 | 3.9 | GO:0095500 | acetylcholine receptor signaling pathway(GO:0095500) signal transduction involved in cellular response to ammonium ion(GO:1903831) response to acetylcholine(GO:1905144) cellular response to acetylcholine(GO:1905145) |
| 0.2 | 3.5 | GO:0032331 | negative regulation of chondrocyte differentiation(GO:0032331) |
| 0.2 | 2.4 | GO:0007214 | gamma-aminobutyric acid signaling pathway(GO:0007214) |
| 0.2 | 1.3 | GO:2001224 | positive regulation of neuron migration(GO:2001224) |
| 0.2 | 1.8 | GO:0015838 | amino-acid betaine transport(GO:0015838) |
| 0.2 | 4.4 | GO:0010758 | regulation of macrophage chemotaxis(GO:0010758) |
| 0.2 | 0.5 | GO:0071544 | diphosphoinositol polyphosphate catabolic process(GO:0071544) |
| 0.2 | 0.5 | GO:1902950 | regulation of dendritic spine maintenance(GO:1902950) negative regulation of dendritic spine maintenance(GO:1902951) |
| 0.2 | 1.2 | GO:0090074 | negative regulation of protein homodimerization activity(GO:0090074) |
| 0.2 | 1.0 | GO:0045956 | positive regulation of calcium ion-dependent exocytosis(GO:0045956) |
| 0.2 | 4.6 | GO:0019228 | neuronal action potential(GO:0019228) |
| 0.2 | 0.3 | GO:0009838 | abscission(GO:0009838) |
| 0.2 | 0.9 | GO:0090666 | scaRNA localization to Cajal body(GO:0090666) |
| 0.2 | 1.8 | GO:0045921 | positive regulation of exocytosis(GO:0045921) |
| 0.2 | 0.7 | GO:0048675 | axon extension(GO:0048675) |
| 0.2 | 6.2 | GO:0034605 | cellular response to heat(GO:0034605) |
| 0.2 | 1.0 | GO:0045650 | negative regulation of macrophage differentiation(GO:0045650) |
| 0.2 | 0.2 | GO:0002339 | B cell selection(GO:0002339) |
| 0.2 | 1.1 | GO:0038028 | insulin receptor signaling pathway via phosphatidylinositol 3-kinase(GO:0038028) |
| 0.2 | 0.5 | GO:0006868 | glutamine transport(GO:0006868) |
| 0.2 | 1.1 | GO:0006020 | inositol metabolic process(GO:0006020) |
| 0.2 | 1.2 | GO:0070314 | G1 to G0 transition(GO:0070314) |
| 0.2 | 4.2 | GO:0044342 | type B pancreatic cell proliferation(GO:0044342) |
| 0.2 | 1.7 | GO:0033005 | positive regulation of mast cell activation(GO:0033005) |
| 0.2 | 0.6 | GO:0045213 | neurotransmitter receptor metabolic process(GO:0045213) |
| 0.1 | 1.9 | GO:0006044 | N-acetylglucosamine metabolic process(GO:0006044) |
| 0.1 | 0.7 | GO:0015692 | vanadium ion transport(GO:0015676) lead ion transport(GO:0015692) |
| 0.1 | 0.9 | GO:0046598 | positive regulation of viral entry into host cell(GO:0046598) |
| 0.1 | 2.5 | GO:0016601 | Rac protein signal transduction(GO:0016601) |
| 0.1 | 2.1 | GO:0006828 | manganese ion transport(GO:0006828) |
| 0.1 | 1.8 | GO:1901385 | regulation of voltage-gated calcium channel activity(GO:1901385) |
| 0.1 | 0.3 | GO:0009212 | dTTP biosynthetic process(GO:0006235) deoxyribonucleoside triphosphate biosynthetic process(GO:0009202) pyrimidine deoxyribonucleoside triphosphate biosynthetic process(GO:0009212) dTTP metabolic process(GO:0046075) |
| 0.1 | 1.5 | GO:0051256 | mitotic spindle midzone assembly(GO:0051256) |
| 0.1 | 0.6 | GO:0061304 | retinal blood vessel morphogenesis(GO:0061304) |
| 0.1 | 0.4 | GO:0006597 | spermine biosynthetic process(GO:0006597) |
| 0.1 | 0.7 | GO:0002553 | histamine production involved in inflammatory response(GO:0002349) histamine secretion involved in inflammatory response(GO:0002441) histamine secretion by mast cell(GO:0002553) Golgi reassembly(GO:0090168) |
| 0.1 | 0.9 | GO:1900246 | positive regulation of RIG-I signaling pathway(GO:1900246) |
| 0.1 | 0.9 | GO:0035826 | rubidium ion transport(GO:0035826) cellular hypotonic response(GO:0071476) |
| 0.1 | 1.0 | GO:0099563 | modification of synaptic structure(GO:0099563) |
| 0.1 | 2.2 | GO:0007157 | heterophilic cell-cell adhesion via plasma membrane cell adhesion molecules(GO:0007157) |
| 0.1 | 2.7 | GO:0007205 | protein kinase C-activating G-protein coupled receptor signaling pathway(GO:0007205) |
| 0.1 | 0.4 | GO:1900244 | positive regulation of synaptic vesicle endocytosis(GO:1900244) |
| 0.1 | 0.4 | GO:0048133 | germ-line stem cell division(GO:0042078) male germ-line stem cell asymmetric division(GO:0048133) germline stem cell asymmetric division(GO:0098728) |
| 0.1 | 1.2 | GO:0032274 | gonadotropin secretion(GO:0032274) |
| 0.1 | 0.3 | GO:0035984 | response to trichostatin A(GO:0035983) cellular response to trichostatin A(GO:0035984) |
| 0.1 | 1.2 | GO:0035970 | peptidyl-threonine dephosphorylation(GO:0035970) |
| 0.1 | 1.1 | GO:2000651 | positive regulation of sodium ion transmembrane transporter activity(GO:2000651) |
| 0.1 | 0.6 | GO:0050912 | detection of chemical stimulus involved in sensory perception(GO:0050907) detection of chemical stimulus involved in sensory perception of taste(GO:0050912) |
| 0.1 | 1.8 | GO:2000310 | regulation of N-methyl-D-aspartate selective glutamate receptor activity(GO:2000310) |
| 0.1 | 1.3 | GO:0016082 | synaptic vesicle priming(GO:0016082) |
| 0.1 | 0.9 | GO:0033184 | positive regulation of histone ubiquitination(GO:0033184) |
| 0.1 | 2.8 | GO:1900026 | positive regulation of substrate adhesion-dependent cell spreading(GO:1900026) |
| 0.1 | 0.8 | GO:0043508 | negative regulation of JUN kinase activity(GO:0043508) |
| 0.1 | 2.2 | GO:0008053 | mitochondrial fusion(GO:0008053) |
| 0.1 | 0.9 | GO:0033353 | S-adenosylmethionine cycle(GO:0033353) |
| 0.1 | 0.4 | GO:0070162 | adiponectin secretion(GO:0070162) regulation of adiponectin secretion(GO:0070163) negative regulation of adiponectin secretion(GO:0070164) |
| 0.1 | 0.9 | GO:0051503 | calcium ion transmembrane import into mitochondrion(GO:0036444) adenine nucleotide transport(GO:0051503) |
| 0.1 | 0.3 | GO:0015910 | peroxisomal long-chain fatty acid import(GO:0015910) |
| 0.1 | 1.9 | GO:0000188 | inactivation of MAPK activity(GO:0000188) |
| 0.1 | 1.3 | GO:0070995 | NADPH oxidation(GO:0070995) |
| 0.1 | 1.5 | GO:0002495 | antigen processing and presentation of peptide antigen via MHC class II(GO:0002495) antigen processing and presentation of peptide or polysaccharide antigen via MHC class II(GO:0002504) |
| 0.1 | 1.7 | GO:0006895 | Golgi to endosome transport(GO:0006895) |
| 0.1 | 8.7 | GO:0000045 | autophagosome assembly(GO:0000045) |
| 0.1 | 0.3 | GO:0046077 | dUDP biosynthetic process(GO:0006227) pyrimidine nucleoside diphosphate metabolic process(GO:0009138) pyrimidine nucleoside diphosphate biosynthetic process(GO:0009139) pyrimidine deoxyribonucleoside diphosphate metabolic process(GO:0009196) pyrimidine deoxyribonucleoside diphosphate biosynthetic process(GO:0009197) dUDP metabolic process(GO:0046077) |
| 0.1 | 1.1 | GO:1902187 | negative regulation of viral release from host cell(GO:1902187) |
| 0.1 | 0.9 | GO:0046856 | phosphatidylinositol dephosphorylation(GO:0046856) |
| 0.1 | 6.2 | GO:0070936 | protein K48-linked ubiquitination(GO:0070936) |
| 0.1 | 0.3 | GO:0006556 | S-adenosylmethionine biosynthetic process(GO:0006556) |
| 0.1 | 0.2 | GO:0036092 | phosphatidylinositol-3-phosphate biosynthetic process(GO:0036092) |
| 0.1 | 3.1 | GO:1903169 | regulation of calcium ion transmembrane transport(GO:1903169) |
| 0.1 | 0.7 | GO:0001675 | acrosome assembly(GO:0001675) |
| 0.1 | 1.3 | GO:0032410 | negative regulation of transporter activity(GO:0032410) |
| 0.1 | 0.7 | GO:1902083 | negative regulation of peptidyl-cysteine S-nitrosylation(GO:1902083) |
| 0.1 | 3.3 | GO:0001541 | ovarian follicle development(GO:0001541) |
| 0.1 | 0.8 | GO:0014067 | negative regulation of phosphatidylinositol 3-kinase signaling(GO:0014067) |
| 0.1 | 1.1 | GO:0030866 | cortical actin cytoskeleton organization(GO:0030866) |
| 0.1 | 1.1 | GO:0030516 | regulation of axon extension(GO:0030516) |
| 0.1 | 11.6 | GO:0042787 | protein ubiquitination involved in ubiquitin-dependent protein catabolic process(GO:0042787) |
| 0.1 | 1.7 | GO:0006607 | NLS-bearing protein import into nucleus(GO:0006607) |
| 0.1 | 0.2 | GO:0019372 | lipoxygenase pathway(GO:0019372) |
| 0.1 | 2.1 | GO:0032292 | myelination in peripheral nervous system(GO:0022011) peripheral nervous system axon ensheathment(GO:0032292) |
| 0.1 | 1.8 | GO:0048167 | regulation of synaptic plasticity(GO:0048167) |
| 0.1 | 0.3 | GO:0019509 | L-methionine biosynthetic process from methylthioadenosine(GO:0019509) |
| 0.1 | 1.0 | GO:1901223 | negative regulation of NIK/NF-kappaB signaling(GO:1901223) |
| 0.1 | 1.7 | GO:0000413 | protein peptidyl-prolyl isomerization(GO:0000413) |
| 0.1 | 9.6 | GO:0006906 | vesicle fusion(GO:0006906) |
| 0.1 | 1.0 | GO:0035721 | intraciliary retrograde transport(GO:0035721) |
| 0.1 | 1.2 | GO:0006744 | ubiquinone biosynthetic process(GO:0006744) |
| 0.1 | 1.5 | GO:0043113 | receptor clustering(GO:0043113) |
| 0.1 | 1.2 | GO:0061001 | regulation of dendritic spine morphogenesis(GO:0061001) |
| 0.1 | 0.7 | GO:0045723 | positive regulation of fatty acid biosynthetic process(GO:0045723) |
| 0.1 | 1.1 | GO:0015693 | magnesium ion transport(GO:0015693) |
| 0.1 | 1.2 | GO:0035036 | binding of sperm to zona pellucida(GO:0007339) sperm-egg recognition(GO:0035036) |
| 0.1 | 1.0 | GO:0034394 | protein localization to cell surface(GO:0034394) |
| 0.1 | 0.2 | GO:0031133 | regulation of axon diameter(GO:0031133) |
| 0.1 | 0.8 | GO:0046485 | ether lipid metabolic process(GO:0046485) |
| 0.1 | 0.8 | GO:0070584 | mitochondrion morphogenesis(GO:0070584) |
| 0.1 | 1.5 | GO:2000401 | regulation of lymphocyte migration(GO:2000401) |
| 0.1 | 4.9 | GO:0051225 | spindle assembly(GO:0051225) |
| 0.1 | 2.2 | GO:0050772 | positive regulation of axonogenesis(GO:0050772) |
| 0.1 | 0.3 | GO:0072321 | chaperone-mediated protein transport(GO:0072321) |
| 0.1 | 3.8 | GO:0019882 | antigen processing and presentation(GO:0019882) |
| 0.1 | 0.2 | GO:0030576 | Cajal body organization(GO:0030576) |
| 0.1 | 1.1 | GO:0006904 | vesicle docking involved in exocytosis(GO:0006904) |
| 0.1 | 1.4 | GO:0015813 | L-glutamate transport(GO:0015813) |
| 0.1 | 12.5 | GO:0006914 | autophagy(GO:0006914) |
| 0.1 | 0.3 | GO:0050908 | detection of light stimulus involved in visual perception(GO:0050908) detection of light stimulus involved in sensory perception(GO:0050962) |
| 0.1 | 0.2 | GO:0016188 | synaptic vesicle maturation(GO:0016188) |
| 0.1 | 2.0 | GO:0006890 | retrograde vesicle-mediated transport, Golgi to ER(GO:0006890) |
| 0.1 | 2.0 | GO:0080171 | lysosome organization(GO:0007040) lytic vacuole organization(GO:0080171) |
| 0.1 | 1.1 | GO:0002437 | inflammatory response to antigenic stimulus(GO:0002437) |
| 0.1 | 1.8 | GO:0048813 | dendrite morphogenesis(GO:0048813) |
| 0.1 | 0.3 | GO:0042632 | cholesterol homeostasis(GO:0042632) sterol homeostasis(GO:0055092) |
| 0.1 | 1.3 | GO:0032011 | ARF protein signal transduction(GO:0032011) regulation of ARF protein signal transduction(GO:0032012) |
| 0.1 | 1.0 | GO:0006308 | DNA catabolic process(GO:0006308) |
| 0.1 | 1.7 | GO:0048814 | regulation of dendrite morphogenesis(GO:0048814) |
| 0.0 | 5.3 | GO:0043547 | positive regulation of GTPase activity(GO:0043547) |
| 0.0 | 0.4 | GO:0050995 | negative regulation of lipid catabolic process(GO:0050995) |
| 0.0 | 0.2 | GO:1902856 | negative regulation of nonmotile primary cilium assembly(GO:1902856) |
| 0.0 | 0.4 | GO:1990126 | retrograde transport, endosome to plasma membrane(GO:1990126) |
| 0.0 | 0.1 | GO:0070966 | nuclear-transcribed mRNA catabolic process, no-go decay(GO:0070966) |
| 0.0 | 0.3 | GO:0017196 | N-terminal peptidyl-methionine acetylation(GO:0017196) |
| 0.0 | 0.4 | GO:2000353 | positive regulation of endothelial cell apoptotic process(GO:2000353) |
| 0.0 | 1.5 | GO:0048536 | spleen development(GO:0048536) |
| 0.0 | 2.7 | GO:0007286 | spermatid development(GO:0007286) |
| 0.0 | 0.5 | GO:0043982 | histone H4-K5 acetylation(GO:0043981) histone H4-K8 acetylation(GO:0043982) |
| 0.0 | 0.3 | GO:0042759 | long-chain fatty acid biosynthetic process(GO:0042759) |
| 0.0 | 1.6 | GO:0016574 | histone ubiquitination(GO:0016574) |
| 0.0 | 0.1 | GO:0072678 | T cell migration(GO:0072678) |
| 0.0 | 0.9 | GO:0036465 | synaptic vesicle recycling(GO:0036465) |
| 0.0 | 0.3 | GO:0034433 | steroid esterification(GO:0034433) sterol esterification(GO:0034434) cholesterol esterification(GO:0034435) |
| 0.0 | 1.2 | GO:0030317 | sperm motility(GO:0030317) |
| 0.0 | 0.1 | GO:0061511 | centriole elongation(GO:0061511) |
| 0.0 | 0.6 | GO:0006491 | N-glycan processing(GO:0006491) |
| 0.0 | 1.1 | GO:1904893 | negative regulation of JAK-STAT cascade(GO:0046426) negative regulation of STAT cascade(GO:1904893) |
| 0.0 | 0.1 | GO:0090271 | positive regulation of fibroblast growth factor production(GO:0090271) |
| 0.0 | 0.7 | GO:0043666 | regulation of phosphoprotein phosphatase activity(GO:0043666) |
| 0.0 | 0.1 | GO:1904690 | regulation of cap-independent translational initiation(GO:1903677) positive regulation of cap-independent translational initiation(GO:1903679) regulation of cytoplasmic translational initiation(GO:1904688) positive regulation of cytoplasmic translational initiation(GO:1904690) |
| 0.0 | 1.8 | GO:0006414 | translational elongation(GO:0006414) |
| 0.0 | 0.8 | GO:0007520 | myoblast fusion(GO:0007520) |
| 0.0 | 1.2 | GO:0007029 | endoplasmic reticulum organization(GO:0007029) |
| 0.0 | 0.5 | GO:0031648 | protein destabilization(GO:0031648) |
| 0.0 | 0.5 | GO:0048013 | ephrin receptor signaling pathway(GO:0048013) |
| 0.0 | 1.6 | GO:0016525 | negative regulation of angiogenesis(GO:0016525) |
| 0.0 | 1.5 | GO:0006487 | protein N-linked glycosylation(GO:0006487) |
| 0.0 | 1.3 | GO:0042439 | ethanolamine-containing compound metabolic process(GO:0042439) |
| 0.0 | 0.8 | GO:0031333 | negative regulation of protein complex assembly(GO:0031333) |
| 0.0 | 0.8 | GO:0042073 | intraciliary transport(GO:0042073) |
| 0.0 | 0.5 | GO:0046627 | negative regulation of insulin receptor signaling pathway(GO:0046627) |
| 0.0 | 0.1 | GO:0035633 | negative regulation of heterotypic cell-cell adhesion(GO:0034115) maintenance of blood-brain barrier(GO:0035633) chemokine (C-C motif) ligand 2 secretion(GO:0035926) cell-cell adhesion involved in gastrulation(GO:0070586) regulation of cell-cell adhesion involved in gastrulation(GO:0070587) regulation of chemokine (C-C motif) ligand 2 secretion(GO:1904207) positive regulation of chemokine (C-C motif) ligand 2 secretion(GO:1904209) |
| 0.0 | 0.4 | GO:0050832 | defense response to fungus(GO:0050832) |
| 0.0 | 1.0 | GO:0002028 | regulation of sodium ion transport(GO:0002028) |
| 0.0 | 0.9 | GO:0048477 | oogenesis(GO:0048477) |
| 0.0 | 0.6 | GO:0046513 | ceramide biosynthetic process(GO:0046513) |
| 0.0 | 0.5 | GO:0031146 | SCF-dependent proteasomal ubiquitin-dependent protein catabolic process(GO:0031146) |
| 0.0 | 0.9 | GO:0043044 | ATP-dependent chromatin remodeling(GO:0043044) |
| 0.0 | 0.3 | GO:0043153 | entrainment of circadian clock by photoperiod(GO:0043153) |
| 0.0 | 1.0 | GO:1902600 | hydrogen ion transmembrane transport(GO:1902600) |
| 0.0 | 0.1 | GO:1902414 | protein localization to cell junction(GO:1902414) |
| 0.0 | 0.3 | GO:0030150 | protein import into mitochondrial matrix(GO:0030150) |
| 0.0 | 0.6 | GO:0006879 | cellular iron ion homeostasis(GO:0006879) |
| 0.0 | 1.0 | GO:0006749 | glutathione metabolic process(GO:0006749) |
| 0.0 | 0.2 | GO:0031507 | heterochromatin assembly(GO:0031507) |
| 0.0 | 0.3 | GO:0006821 | chloride transport(GO:0006821) |
| 0.0 | 0.8 | GO:0007156 | homophilic cell adhesion via plasma membrane adhesion molecules(GO:0007156) |
| 0.0 | 0.4 | GO:0099536 | synaptic signaling(GO:0099536) |
| 0.0 | 0.1 | GO:1990022 | RNA polymerase II complex import to nucleus(GO:0044376) RNA polymerase III complex localization to nucleus(GO:1990022) |
| 0.0 | 0.2 | GO:0010172 | embryonic body morphogenesis(GO:0010172) |
Gene overrepresentation in cellular_component category:
| Log-likelihood per target | Total log-likelihood | Term | Description |
|---|---|---|---|
| 5.5 | 16.4 | GO:0002142 | stereocilia ankle link complex(GO:0002142) |
| 3.9 | 39.0 | GO:0045298 | tubulin complex(GO:0045298) |
| 3.0 | 27.2 | GO:0097442 | CA3 pyramidal cell dendrite(GO:0097442) |
| 1.7 | 1.7 | GO:0033093 | Weibel-Palade body(GO:0033093) |
| 1.5 | 4.5 | GO:0098831 | presynaptic active zone cytoplasmic component(GO:0098831) |
| 1.5 | 5.9 | GO:0090537 | CERF complex(GO:0090537) |
| 1.5 | 36.3 | GO:0071565 | nBAF complex(GO:0071565) |
| 1.4 | 5.7 | GO:0044307 | dendritic branch(GO:0044307) |
| 1.4 | 5.6 | GO:0099569 | presynaptic cytoskeleton(GO:0099569) |
| 1.4 | 6.8 | GO:0044305 | calyx of Held(GO:0044305) |
| 1.3 | 20.4 | GO:1990635 | proximal dendrite(GO:1990635) |
| 1.3 | 19.0 | GO:0001518 | voltage-gated sodium channel complex(GO:0001518) |
| 1.2 | 3.7 | GO:0097058 | CRLF-CLCF1 complex(GO:0097058) |
| 1.2 | 5.9 | GO:0032437 | cuticular plate(GO:0032437) |
| 1.2 | 14.1 | GO:0043083 | synaptic cleft(GO:0043083) |
| 1.2 | 4.7 | GO:0043259 | laminin-1 complex(GO:0005606) laminin-10 complex(GO:0043259) |
| 1.1 | 9.1 | GO:0001520 | outer dense fiber(GO:0001520) |
| 1.1 | 46.7 | GO:0005891 | voltage-gated calcium channel complex(GO:0005891) |
| 1.1 | 4.4 | GO:0016035 | zeta DNA polymerase complex(GO:0016035) |
| 1.0 | 3.0 | GO:0098855 | HCN channel complex(GO:0098855) |
| 0.9 | 15.6 | GO:0032279 | asymmetric synapse(GO:0032279) |
| 0.8 | 4.2 | GO:0005587 | collagen type IV trimer(GO:0005587) network-forming collagen trimer(GO:0098642) collagen network(GO:0098645) basement membrane collagen trimer(GO:0098651) |
| 0.8 | 3.3 | GO:0031673 | H zone(GO:0031673) |
| 0.8 | 1.5 | GO:0042470 | melanosome(GO:0042470) pigment granule(GO:0048770) |
| 0.7 | 2.1 | GO:0016533 | cyclin-dependent protein kinase 5 holoenzyme complex(GO:0016533) |
| 0.6 | 16.0 | GO:0031430 | M band(GO:0031430) |
| 0.6 | 2.5 | GO:0036449 | microtubule minus-end(GO:0036449) |
| 0.6 | 2.4 | GO:0070436 | Grb2-EGFR complex(GO:0070436) |
| 0.6 | 9.0 | GO:1902711 | GABA-A receptor complex(GO:1902711) |
| 0.6 | 37.8 | GO:0005881 | cytoplasmic microtubule(GO:0005881) |
| 0.5 | 2.7 | GO:1902710 | GABA receptor complex(GO:1902710) |
| 0.5 | 4.6 | GO:0036056 | filtration diaphragm(GO:0036056) slit diaphragm(GO:0036057) |
| 0.5 | 1.0 | GO:0031933 | telomeric heterochromatin(GO:0031933) |
| 0.5 | 1.5 | GO:0097524 | sperm plasma membrane(GO:0097524) |
| 0.5 | 5.4 | GO:0097136 | Bcl-2 family protein complex(GO:0097136) |
| 0.5 | 7.8 | GO:0031229 | integral component of nuclear inner membrane(GO:0005639) intrinsic component of nuclear inner membrane(GO:0031229) |
| 0.5 | 4.8 | GO:0032426 | stereocilium tip(GO:0032426) |
| 0.5 | 8.1 | GO:0000124 | SAGA complex(GO:0000124) |
| 0.5 | 3.7 | GO:0031012 | extracellular matrix(GO:0031012) |
| 0.4 | 1.3 | GO:0031533 | mRNA cap methyltransferase complex(GO:0031533) |
| 0.4 | 6.9 | GO:0031528 | microvillus membrane(GO:0031528) |
| 0.4 | 7.3 | GO:0005865 | striated muscle thin filament(GO:0005865) |
| 0.4 | 1.3 | GO:0044308 | axonal spine(GO:0044308) |
| 0.4 | 3.7 | GO:0044327 | dendritic spine head(GO:0044327) |
| 0.4 | 1.5 | GO:0032444 | activin responsive factor complex(GO:0032444) |
| 0.4 | 20.0 | GO:0031941 | filamentous actin(GO:0031941) |
| 0.4 | 3.0 | GO:0031315 | extrinsic component of mitochondrial outer membrane(GO:0031315) |
| 0.4 | 2.6 | GO:0000322 | storage vacuole(GO:0000322) |
| 0.4 | 1.1 | GO:1990730 | VCP-NSFL1C complex(GO:1990730) |
| 0.4 | 2.2 | GO:0044530 | supraspliceosomal complex(GO:0044530) |
| 0.4 | 7.5 | GO:0000159 | protein phosphatase type 2A complex(GO:0000159) |
| 0.4 | 1.8 | GO:1990761 | dendritic spine neck(GO:0044326) growth cone lamellipodium(GO:1990761) |
| 0.4 | 2.5 | GO:0005638 | lamin filament(GO:0005638) |
| 0.4 | 4.6 | GO:0005952 | cAMP-dependent protein kinase complex(GO:0005952) |
| 0.4 | 2.8 | GO:1990909 | Wnt signalosome(GO:1990909) |
| 0.3 | 7.7 | GO:0030285 | integral component of synaptic vesicle membrane(GO:0030285) intrinsic component of synaptic vesicle membrane(GO:0098563) |
| 0.3 | 4.1 | GO:0042581 | specific granule(GO:0042581) |
| 0.3 | 4.0 | GO:0044300 | cerebellar mossy fiber(GO:0044300) |
| 0.3 | 1.3 | GO:0005594 | collagen type IX trimer(GO:0005594) |
| 0.3 | 4.2 | GO:0030057 | desmosome(GO:0030057) |
| 0.3 | 3.6 | GO:0098845 | postsynaptic endosome(GO:0098845) |
| 0.3 | 7.4 | GO:0005942 | phosphatidylinositol 3-kinase complex(GO:0005942) |
| 0.3 | 5.4 | GO:0034704 | calcium channel complex(GO:0034704) |
| 0.3 | 2.4 | GO:0000138 | Golgi trans cisterna(GO:0000138) |
| 0.3 | 14.0 | GO:0005834 | heterotrimeric G-protein complex(GO:0005834) |
| 0.3 | 18.5 | GO:0009925 | basal plasma membrane(GO:0009925) |
| 0.3 | 2.8 | GO:0035686 | sperm fibrous sheath(GO:0035686) |
| 0.3 | 2.5 | GO:0031362 | anchored component of external side of plasma membrane(GO:0031362) |
| 0.3 | 0.5 | GO:0097629 | extrinsic component of omegasome membrane(GO:0097629) |
| 0.3 | 1.1 | GO:0030906 | retromer, cargo-selective complex(GO:0030906) |
| 0.3 | 2.9 | GO:0034464 | BBSome(GO:0034464) |
| 0.3 | 8.3 | GO:0097610 | cleavage furrow(GO:0032154) cell surface furrow(GO:0097610) |
| 0.3 | 22.7 | GO:0008076 | voltage-gated potassium channel complex(GO:0008076) |
| 0.3 | 5.1 | GO:0045334 | clathrin-coated endocytic vesicle(GO:0045334) |
| 0.3 | 2.0 | GO:0060091 | kinocilium(GO:0060091) |
| 0.3 | 1.8 | GO:0005916 | fascia adherens(GO:0005916) |
| 0.3 | 44.9 | GO:0001726 | ruffle(GO:0001726) |
| 0.2 | 1.4 | GO:0001750 | photoreceptor outer segment(GO:0001750) |
| 0.2 | 7.8 | GO:0097440 | apical dendrite(GO:0097440) |
| 0.2 | 6.4 | GO:0030425 | dendrite(GO:0030425) |
| 0.2 | 6.3 | GO:0032281 | AMPA glutamate receptor complex(GO:0032281) |
| 0.2 | 2.2 | GO:0001739 | sex chromatin(GO:0001739) |
| 0.2 | 0.9 | GO:0016222 | procollagen-proline 4-dioxygenase complex(GO:0016222) |
| 0.2 | 1.9 | GO:0002177 | manchette(GO:0002177) |
| 0.2 | 0.6 | GO:0034751 | aryl hydrocarbon receptor complex(GO:0034751) |
| 0.2 | 21.5 | GO:0030017 | sarcomere(GO:0030017) |
| 0.2 | 19.6 | GO:0043204 | perikaryon(GO:0043204) |
| 0.2 | 5.8 | GO:0005790 | smooth endoplasmic reticulum(GO:0005790) |
| 0.2 | 2.6 | GO:0032420 | stereocilium(GO:0032420) |
| 0.2 | 1.6 | GO:0042382 | paraspeckles(GO:0042382) |
| 0.2 | 1.2 | GO:0016602 | CCAAT-binding factor complex(GO:0016602) |
| 0.2 | 1.4 | GO:0071598 | neuronal ribonucleoprotein granule(GO:0071598) |
| 0.2 | 1.1 | GO:0005853 | eukaryotic translation elongation factor 1 complex(GO:0005853) |
| 0.2 | 1.4 | GO:0097427 | microtubule bundle(GO:0097427) |
| 0.2 | 1.2 | GO:0048787 | presynaptic active zone membrane(GO:0048787) |
| 0.2 | 2.1 | GO:0002199 | zona pellucida receptor complex(GO:0002199) |
| 0.1 | 0.7 | GO:0070826 | paraferritin complex(GO:0070826) |
| 0.1 | 4.5 | GO:0005721 | pericentric heterochromatin(GO:0005721) |
| 0.1 | 1.9 | GO:0051233 | spindle midzone(GO:0051233) |
| 0.1 | 2.4 | GO:0030139 | endocytic vesicle(GO:0030139) |
| 0.1 | 2.8 | GO:0097038 | perinuclear endoplasmic reticulum(GO:0097038) |
| 0.1 | 0.8 | GO:0099512 | supramolecular fiber(GO:0099512) polymeric cytoskeletal fiber(GO:0099513) |
| 0.1 | 2.2 | GO:0043679 | axon terminus(GO:0043679) |
| 0.1 | 26.2 | GO:0045211 | postsynaptic membrane(GO:0045211) |
| 0.1 | 1.5 | GO:0031080 | nuclear pore outer ring(GO:0031080) |
| 0.1 | 3.7 | GO:0030131 | clathrin adaptor complex(GO:0030131) |
| 0.1 | 0.6 | GO:0031143 | pseudopodium(GO:0031143) |
| 0.1 | 1.4 | GO:0000812 | Swr1 complex(GO:0000812) |
| 0.1 | 5.4 | GO:0016324 | apical plasma membrane(GO:0016324) |
| 0.1 | 44.0 | GO:0005874 | microtubule(GO:0005874) |
| 0.1 | 1.2 | GO:0000815 | ESCRT III complex(GO:0000815) |
| 0.1 | 1.0 | GO:0030991 | intraciliary transport particle A(GO:0030991) |
| 0.1 | 1.0 | GO:0031045 | dense core granule(GO:0031045) |
| 0.1 | 0.6 | GO:0005726 | perichromatin fibrils(GO:0005726) |
| 0.1 | 0.8 | GO:1990391 | DNA repair complex(GO:1990391) |
| 0.1 | 3.5 | GO:0009898 | cytoplasmic side of plasma membrane(GO:0009898) |
| 0.1 | 4.7 | GO:0030173 | integral component of Golgi membrane(GO:0030173) |
| 0.1 | 0.3 | GO:0031417 | NatC complex(GO:0031417) |
| 0.1 | 6.6 | GO:0005581 | collagen trimer(GO:0005581) |
| 0.1 | 0.9 | GO:0005871 | kinesin complex(GO:0005871) |
| 0.1 | 0.3 | GO:0097443 | sorting endosome(GO:0097443) |
| 0.1 | 10.4 | GO:0055037 | recycling endosome(GO:0055037) |
| 0.1 | 6.0 | GO:0005776 | autophagosome(GO:0005776) |
| 0.1 | 2.8 | GO:0030496 | midbody(GO:0030496) |
| 0.1 | 1.0 | GO:0000347 | THO complex(GO:0000347) THO complex part of transcription export complex(GO:0000445) |
| 0.1 | 0.3 | GO:0048269 | methionine adenosyltransferase complex(GO:0048269) |
| 0.1 | 4.0 | GO:0005905 | clathrin-coated pit(GO:0005905) |
| 0.1 | 2.5 | GO:0031307 | integral component of mitochondrial outer membrane(GO:0031307) |
| 0.1 | 0.7 | GO:0045180 | basal cortex(GO:0045180) |
| 0.1 | 6.1 | GO:0005913 | cell-cell adherens junction(GO:0005913) |
| 0.1 | 0.4 | GO:0000308 | cytoplasmic cyclin-dependent protein kinase holoenzyme complex(GO:0000308) |
| 0.1 | 0.4 | GO:0042406 | extrinsic component of endoplasmic reticulum membrane(GO:0042406) |
| 0.1 | 14.2 | GO:0000139 | Golgi membrane(GO:0000139) |
| 0.1 | 3.8 | GO:0031463 | Cul3-RING ubiquitin ligase complex(GO:0031463) |
| 0.1 | 1.2 | GO:0045177 | apical part of cell(GO:0045177) |
| 0.1 | 0.3 | GO:0005672 | transcription factor TFIIA complex(GO:0005672) |
| 0.1 | 0.2 | GO:0019815 | B cell receptor complex(GO:0019815) |
| 0.1 | 0.8 | GO:0043198 | dendritic shaft(GO:0043198) |
| 0.1 | 0.3 | GO:0042719 | mitochondrial intermembrane space protein transporter complex(GO:0042719) |
| 0.1 | 0.2 | GO:0071008 | U2-type post-mRNA release spliceosomal complex(GO:0071008) |
| 0.0 | 2.3 | GO:0042645 | nucleoid(GO:0009295) mitochondrial nucleoid(GO:0042645) |
| 0.0 | 0.5 | GO:0034709 | methylosome(GO:0034709) |
| 0.0 | 2.1 | GO:0043195 | terminal bouton(GO:0043195) |
| 0.0 | 0.9 | GO:0046658 | anchored component of plasma membrane(GO:0046658) |
| 0.0 | 1.1 | GO:0016323 | basolateral plasma membrane(GO:0016323) |
| 0.0 | 0.9 | GO:0032391 | photoreceptor connecting cilium(GO:0032391) |
| 0.0 | 2.0 | GO:0019898 | extrinsic component of membrane(GO:0019898) |
| 0.0 | 1.6 | GO:0001725 | stress fiber(GO:0001725) contractile actin filament bundle(GO:0097517) |
| 0.0 | 0.6 | GO:0044432 | endoplasmic reticulum part(GO:0044432) |
| 0.0 | 0.7 | GO:0044298 | cell body membrane(GO:0044298) |
| 0.0 | 1.3 | GO:0080008 | Cul4-RING E3 ubiquitin ligase complex(GO:0080008) |
| 0.0 | 0.8 | GO:0005921 | gap junction(GO:0005921) |
| 0.0 | 2.7 | GO:0000118 | histone deacetylase complex(GO:0000118) |
| 0.0 | 8.4 | GO:0097708 | cytoplasmic vesicle(GO:0031410) intracellular vesicle(GO:0097708) |
| 0.0 | 1.4 | GO:0035097 | histone methyltransferase complex(GO:0035097) |
| 0.0 | 0.2 | GO:0033553 | rDNA heterochromatin(GO:0033553) |
| 0.0 | 2.3 | GO:0005643 | nuclear pore(GO:0005643) |
| 0.0 | 1.6 | GO:0031234 | extrinsic component of cytoplasmic side of plasma membrane(GO:0031234) |
| 0.0 | 0.8 | GO:0070069 | cytochrome complex(GO:0070069) |
| 0.0 | 0.3 | GO:0090571 | RNA polymerase II transcription repressor complex(GO:0090571) |
| 0.0 | 1.0 | GO:0005801 | cis-Golgi network(GO:0005801) |
| 0.0 | 2.2 | GO:0005923 | bicellular tight junction(GO:0005923) |
| 0.0 | 1.5 | GO:0072562 | blood microparticle(GO:0072562) |
| 0.0 | 0.3 | GO:0044666 | MLL3/4 complex(GO:0044666) |
| 0.0 | 0.4 | GO:0036038 | MKS complex(GO:0036038) |
| 0.0 | 0.8 | GO:0098797 | plasma membrane protein complex(GO:0098797) |
| 0.0 | 0.5 | GO:0008180 | COP9 signalosome(GO:0008180) |
| 0.0 | 0.3 | GO:0001917 | photoreceptor inner segment(GO:0001917) |
| 0.0 | 0.3 | GO:0005782 | peroxisomal matrix(GO:0005782) microbody lumen(GO:0031907) |
| 0.0 | 5.5 | GO:0005789 | endoplasmic reticulum membrane(GO:0005789) |
| 0.0 | 0.1 | GO:0043218 | compact myelin(GO:0043218) |
| 0.0 | 0.3 | GO:0005680 | anaphase-promoting complex(GO:0005680) |
| 0.0 | 0.8 | GO:0042383 | sarcolemma(GO:0042383) |
| 0.0 | 1.8 | GO:0030133 | transport vesicle(GO:0030133) |
| 0.0 | 0.4 | GO:0045171 | intercellular bridge(GO:0045171) |
| 0.0 | 6.6 | GO:0005887 | integral component of plasma membrane(GO:0005887) |
| 0.0 | 0.6 | GO:0005758 | mitochondrial intermembrane space(GO:0005758) |
| 0.0 | 0.1 | GO:0034518 | mRNA cap binding complex(GO:0005845) RNA cap binding complex(GO:0034518) |
| 0.0 | 8.8 | GO:0005886 | plasma membrane(GO:0005886) |
Gene overrepresentation in molecular_function category:
| Log-likelihood per target | Total log-likelihood | Term | Description |
|---|---|---|---|
| 4.7 | 32.6 | GO:0099609 | microtubule lateral binding(GO:0099609) |
| 4.4 | 17.6 | GO:0005008 | hepatocyte growth factor-activated receptor activity(GO:0005008) |
| 4.3 | 12.8 | GO:0016155 | formyltetrahydrofolate dehydrogenase activity(GO:0016155) |
| 3.6 | 28.9 | GO:0005519 | cytoskeletal regulatory protein binding(GO:0005519) |
| 3.3 | 16.7 | GO:0003835 | beta-galactoside alpha-2,6-sialyltransferase activity(GO:0003835) |
| 2.0 | 5.9 | GO:0070615 | nucleosome-dependent ATPase activity(GO:0070615) |
| 1.8 | 25.6 | GO:0031005 | filamin binding(GO:0031005) |
| 1.8 | 16.3 | GO:0003873 | 6-phosphofructo-2-kinase activity(GO:0003873) fructose-2,6-bisphosphate 2-phosphatase activity(GO:0004331) |
| 1.8 | 14.1 | GO:0099583 | neurotransmitter receptor activity involved in regulation of postsynaptic membrane potential(GO:0099529) neurotransmitter receptor activity involved in regulation of postsynaptic cytosolic calcium ion concentration(GO:0099583) |
| 1.7 | 6.9 | GO:0047275 | glucosaminylgalactosylglucosylceramide beta-galactosyltransferase activity(GO:0047275) |
| 1.6 | 4.7 | GO:0005237 | inhibitory extracellular ligand-gated ion channel activity(GO:0005237) |
| 1.5 | 8.8 | GO:0003828 | alpha-N-acetylneuraminate alpha-2,8-sialyltransferase activity(GO:0003828) |
| 1.4 | 9.8 | GO:0001609 | G-protein coupled adenosine receptor activity(GO:0001609) |
| 1.4 | 6.9 | GO:0004105 | choline-phosphate cytidylyltransferase activity(GO:0004105) |
| 1.4 | 13.8 | GO:0031802 | type 5 metabotropic glutamate receptor binding(GO:0031802) |
| 1.4 | 5.4 | GO:0008332 | low voltage-gated calcium channel activity(GO:0008332) |
| 1.3 | 8.9 | GO:0086006 | voltage-gated sodium channel activity involved in cardiac muscle cell action potential(GO:0086006) |
| 1.2 | 6.0 | GO:0016907 | G-protein coupled acetylcholine receptor activity(GO:0016907) |
| 1.1 | 4.6 | GO:0030348 | syntaxin-3 binding(GO:0030348) |
| 1.1 | 6.8 | GO:0035381 | extracellular ATP-gated cation channel activity(GO:0004931) ATP-gated ion channel activity(GO:0035381) |
| 1.1 | 4.4 | GO:0016909 | JUN kinase activity(GO:0004705) SAP kinase activity(GO:0016909) |
| 1.0 | 7.2 | GO:0046935 | 1-phosphatidylinositol-3-kinase regulator activity(GO:0046935) |
| 1.0 | 5.0 | GO:0052833 | inositol monophosphate 1-phosphatase activity(GO:0008934) inositol monophosphate 3-phosphatase activity(GO:0052832) inositol monophosphate 4-phosphatase activity(GO:0052833) inositol monophosphate phosphatase activity(GO:0052834) |
| 1.0 | 14.7 | GO:0005248 | voltage-gated sodium channel activity(GO:0005248) |
| 1.0 | 2.9 | GO:0005119 | smoothened binding(GO:0005119) |
| 0.9 | 4.6 | GO:0008269 | JAK pathway signal transduction adaptor activity(GO:0008269) |
| 0.9 | 28.5 | GO:0004115 | 3',5'-cyclic-AMP phosphodiesterase activity(GO:0004115) |
| 0.8 | 3.4 | GO:0042328 | heparan sulfate N-acetylglucosaminyltransferase activity(GO:0042328) |
| 0.8 | 7.3 | GO:0005523 | tropomyosin binding(GO:0005523) |
| 0.8 | 2.3 | GO:0008502 | melatonin receptor activity(GO:0008502) |
| 0.8 | 4.6 | GO:0070699 | type II activin receptor binding(GO:0070699) |
| 0.8 | 51.5 | GO:0015459 | potassium channel regulator activity(GO:0015459) |
| 0.8 | 3.0 | GO:0003938 | IMP dehydrogenase activity(GO:0003938) |
| 0.7 | 4.3 | GO:0000155 | phosphorelay sensor kinase activity(GO:0000155) |
| 0.7 | 7.7 | GO:0004017 | adenylate kinase activity(GO:0004017) |
| 0.7 | 9.8 | GO:0042288 | MHC class I protein binding(GO:0042288) |
| 0.7 | 9.8 | GO:0008331 | high voltage-gated calcium channel activity(GO:0008331) |
| 0.7 | 3.5 | GO:0015467 | G-protein activated inward rectifier potassium channel activity(GO:0015467) |
| 0.7 | 0.7 | GO:0031697 | beta-1 adrenergic receptor binding(GO:0031697) |
| 0.6 | 1.9 | GO:0035650 | AP-1 adaptor complex binding(GO:0035650) |
| 0.6 | 2.6 | GO:0031800 | type 3 metabotropic glutamate receptor binding(GO:0031800) |
| 0.6 | 5.4 | GO:0051434 | BH3 domain binding(GO:0051434) |
| 0.6 | 6.6 | GO:0019531 | secondary active sulfate transmembrane transporter activity(GO:0008271) oxalate transmembrane transporter activity(GO:0019531) |
| 0.6 | 1.8 | GO:0045127 | N-acetylglucosamine kinase activity(GO:0045127) |
| 0.6 | 1.8 | GO:0050656 | 3'-phosphoadenosine 5'-phosphosulfate binding(GO:0050656) |
| 0.6 | 1.8 | GO:0019107 | glycylpeptide N-tetradecanoyltransferase activity(GO:0004379) myristoyltransferase activity(GO:0019107) |
| 0.6 | 4.7 | GO:0043208 | glycosphingolipid binding(GO:0043208) |
| 0.6 | 6.6 | GO:0050897 | cobalt ion binding(GO:0050897) |
| 0.6 | 16.1 | GO:0003785 | actin monomer binding(GO:0003785) |
| 0.5 | 2.2 | GO:0017077 | oxidative phosphorylation uncoupler activity(GO:0017077) |
| 0.5 | 4.3 | GO:0016312 | inositol bisphosphate phosphatase activity(GO:0016312) |
| 0.5 | 1.6 | GO:0016880 | acid-ammonia (or amide) ligase activity(GO:0016880) |
| 0.5 | 2.1 | GO:0022851 | GABA-gated chloride ion channel activity(GO:0022851) |
| 0.5 | 1.6 | GO:0008109 | N-acetyllactosaminide beta-1,6-N-acetylglucosaminyltransferase activity(GO:0008109) |
| 0.5 | 5.3 | GO:0001206 | transcriptional repressor activity, RNA polymerase II distal enhancer sequence-specific binding(GO:0001206) |
| 0.5 | 10.9 | GO:0005070 | SH3/SH2 adaptor activity(GO:0005070) |
| 0.5 | 1.5 | GO:0030618 | transforming growth factor beta receptor, pathway-specific cytoplasmic mediator activity(GO:0030618) |
| 0.5 | 8.7 | GO:0034237 | protein kinase A regulatory subunit binding(GO:0034237) |
| 0.5 | 4.5 | GO:0005068 | transmembrane receptor protein tyrosine kinase adaptor activity(GO:0005068) |
| 0.5 | 8.7 | GO:0034236 | protein kinase A catalytic subunit binding(GO:0034236) |
| 0.5 | 3.4 | GO:0005127 | ciliary neurotrophic factor receptor binding(GO:0005127) |
| 0.5 | 1.4 | GO:0015173 | hydrogen:amino acid symporter activity(GO:0005280) aromatic amino acid transmembrane transporter activity(GO:0015173) |
| 0.4 | 3.1 | GO:0004716 | receptor signaling protein tyrosine kinase activity(GO:0004716) |
| 0.4 | 2.7 | GO:0004965 | G-protein coupled GABA receptor activity(GO:0004965) |
| 0.4 | 2.2 | GO:0008454 | alpha-1,3-mannosylglycoprotein 4-beta-N-acetylglucosaminyltransferase activity(GO:0008454) |
| 0.4 | 1.3 | GO:0004482 | mRNA (guanine-N7-)-methyltransferase activity(GO:0004482) |
| 0.4 | 1.8 | GO:0070012 | oligopeptidase activity(GO:0070012) |
| 0.4 | 7.1 | GO:0031681 | G-protein beta-subunit binding(GO:0031681) |
| 0.4 | 5.8 | GO:0030296 | protein tyrosine kinase activator activity(GO:0030296) |
| 0.4 | 14.9 | GO:0035259 | glucocorticoid receptor binding(GO:0035259) |
| 0.4 | 2.2 | GO:0061665 | SUMO ligase activity(GO:0061665) |
| 0.4 | 2.6 | GO:0035374 | chondroitin sulfate binding(GO:0035374) |
| 0.4 | 5.8 | GO:0022889 | L-serine transmembrane transporter activity(GO:0015194) serine transmembrane transporter activity(GO:0022889) |
| 0.4 | 1.2 | GO:0008504 | monoamine transmembrane transporter activity(GO:0008504) |
| 0.4 | 1.6 | GO:0005315 | inorganic phosphate transmembrane transporter activity(GO:0005315) |
| 0.4 | 3.5 | GO:0030550 | acetylcholine receptor inhibitor activity(GO:0030550) |
| 0.4 | 5.7 | GO:0017128 | phospholipid scramblase activity(GO:0017128) |
| 0.4 | 8.2 | GO:0031489 | myosin V binding(GO:0031489) |
| 0.4 | 1.1 | GO:0071633 | dihydroceramidase activity(GO:0071633) |
| 0.4 | 1.1 | GO:0005124 | scavenger receptor binding(GO:0005124) |
| 0.4 | 5.9 | GO:0051010 | microtubule plus-end binding(GO:0051010) |
| 0.4 | 4.0 | GO:0030306 | ADP-ribosylation factor binding(GO:0030306) |
| 0.4 | 7.6 | GO:0005104 | fibroblast growth factor receptor binding(GO:0005104) |
| 0.4 | 2.9 | GO:0032051 | clathrin light chain binding(GO:0032051) |
| 0.4 | 19.5 | GO:0036002 | pre-mRNA binding(GO:0036002) |
| 0.3 | 6.6 | GO:0032454 | histone demethylase activity (H3-K9 specific)(GO:0032454) |
| 0.3 | 16.2 | GO:0001784 | phosphotyrosine binding(GO:0001784) |
| 0.3 | 7.2 | GO:0016709 | oxidoreductase activity, acting on paired donors, with incorporation or reduction of molecular oxygen, NAD(P)H as one donor, and incorporation of one atom of oxygen(GO:0016709) |
| 0.3 | 1.0 | GO:0004534 | transcription termination site sequence-specific DNA binding(GO:0001147) transcription termination site DNA binding(GO:0001160) 5'-3' exoribonuclease activity(GO:0004534) |
| 0.3 | 5.1 | GO:0003680 | AT DNA binding(GO:0003680) |
| 0.3 | 0.9 | GO:0098973 | structural constituent of synapse(GO:0098918) structural constituent of postsynaptic actin cytoskeleton(GO:0098973) |
| 0.3 | 78.4 | GO:0008017 | microtubule binding(GO:0008017) |
| 0.3 | 1.9 | GO:0004311 | farnesyltranstransferase activity(GO:0004311) |
| 0.3 | 2.2 | GO:0043423 | 3-phosphoinositide-dependent protein kinase binding(GO:0043423) |
| 0.3 | 1.2 | GO:0005093 | Rab GDP-dissociation inhibitor activity(GO:0005093) |
| 0.3 | 2.2 | GO:0005021 | vascular endothelial growth factor-activated receptor activity(GO:0005021) |
| 0.3 | 3.9 | GO:0016755 | transferase activity, transferring amino-acyl groups(GO:0016755) |
| 0.3 | 3.6 | GO:0022842 | leak channel activity(GO:0022840) narrow pore channel activity(GO:0022842) |
| 0.3 | 0.9 | GO:0008515 | sucrose:proton symporter activity(GO:0008506) sucrose transmembrane transporter activity(GO:0008515) disaccharide transmembrane transporter activity(GO:0015154) oligosaccharide transmembrane transporter activity(GO:0015157) |
| 0.3 | 1.5 | GO:0004691 | cAMP-dependent protein kinase activity(GO:0004691) |
| 0.3 | 1.8 | GO:0070326 | very-low-density lipoprotein particle receptor binding(GO:0070326) |
| 0.3 | 4.7 | GO:0031683 | G-protein beta/gamma-subunit complex binding(GO:0031683) |
| 0.3 | 22.6 | GO:0019888 | protein phosphatase regulator activity(GO:0019888) |
| 0.3 | 9.9 | GO:0017022 | myosin binding(GO:0017022) |
| 0.3 | 5.9 | GO:0030506 | ankyrin binding(GO:0030506) |
| 0.3 | 2.5 | GO:0005007 | fibroblast growth factor-activated receptor activity(GO:0005007) |
| 0.3 | 1.1 | GO:0000832 | inositol hexakisphosphate kinase activity(GO:0000828) inositol hexakisphosphate 5-kinase activity(GO:0000832) inositol hexakisphosphate 1-kinase activity(GO:0052723) inositol hexakisphosphate 3-kinase activity(GO:0052724) |
| 0.3 | 10.6 | GO:0046875 | ephrin receptor binding(GO:0046875) |
| 0.3 | 1.1 | GO:0004345 | glucose-6-phosphate dehydrogenase activity(GO:0004345) |
| 0.3 | 0.8 | GO:0003963 | RNA-3'-phosphate cyclase activity(GO:0003963) |
| 0.3 | 6.0 | GO:0043395 | heparan sulfate proteoglycan binding(GO:0043395) |
| 0.3 | 2.8 | GO:0015347 | sodium-independent organic anion transmembrane transporter activity(GO:0015347) |
| 0.2 | 0.7 | GO:0004711 | ribosomal protein S6 kinase activity(GO:0004711) |
| 0.2 | 6.1 | GO:0070577 | lysine-acetylated histone binding(GO:0070577) |
| 0.2 | 0.7 | GO:0030350 | iron-responsive element binding(GO:0030350) |
| 0.2 | 5.0 | GO:0005245 | voltage-gated calcium channel activity(GO:0005245) |
| 0.2 | 1.2 | GO:0001517 | N-acetylglucosamine 6-O-sulfotransferase activity(GO:0001517) |
| 0.2 | 3.3 | GO:0042043 | neurexin family protein binding(GO:0042043) |
| 0.2 | 2.1 | GO:0050291 | sphingosine N-acyltransferase activity(GO:0050291) |
| 0.2 | 0.7 | GO:0046969 | histone deacetylase activity (H3-K9 specific)(GO:0032129) NAD-dependent histone deacetylase activity (H3-K9 specific)(GO:0046969) |
| 0.2 | 5.8 | GO:0042805 | actinin binding(GO:0042805) |
| 0.2 | 1.1 | GO:0004305 | ethanolamine kinase activity(GO:0004305) |
| 0.2 | 2.9 | GO:0005159 | insulin-like growth factor receptor binding(GO:0005159) |
| 0.2 | 1.3 | GO:0035612 | AP-2 adaptor complex binding(GO:0035612) |
| 0.2 | 3.7 | GO:0005521 | lamin binding(GO:0005521) |
| 0.2 | 5.7 | GO:0070325 | lipoprotein particle receptor binding(GO:0070325) |
| 0.2 | 1.7 | GO:0005092 | GDP-dissociation inhibitor activity(GO:0005092) |
| 0.2 | 12.3 | GO:0030276 | clathrin binding(GO:0030276) |
| 0.2 | 4.4 | GO:0003950 | NAD+ ADP-ribosyltransferase activity(GO:0003950) |
| 0.2 | 0.6 | GO:0008527 | taste receptor activity(GO:0008527) |
| 0.2 | 0.8 | GO:0047389 | glycerophosphocholine phosphodiesterase activity(GO:0047389) |
| 0.2 | 2.2 | GO:0004890 | GABA-A receptor activity(GO:0004890) |
| 0.2 | 1.4 | GO:0015129 | lactate transmembrane transporter activity(GO:0015129) |
| 0.2 | 1.2 | GO:0048039 | ubiquinone binding(GO:0048039) |
| 0.2 | 9.3 | GO:0015485 | cholesterol binding(GO:0015485) |
| 0.2 | 1.4 | GO:0008526 | phosphatidylinositol transporter activity(GO:0008526) |
| 0.2 | 0.6 | GO:0033680 | ATP-dependent DNA/RNA helicase activity(GO:0033680) |
| 0.2 | 0.8 | GO:0071532 | ornithine decarboxylase inhibitor activity(GO:0008073) ankyrin repeat binding(GO:0071532) |
| 0.2 | 0.6 | GO:0008330 | protein tyrosine/threonine phosphatase activity(GO:0008330) |
| 0.2 | 2.8 | GO:0000900 | translation repressor activity, nucleic acid binding(GO:0000900) |
| 0.2 | 19.3 | GO:0005089 | Rho guanyl-nucleotide exchange factor activity(GO:0005089) |
| 0.2 | 7.3 | GO:0005546 | phosphatidylinositol-4,5-bisphosphate binding(GO:0005546) |
| 0.2 | 14.2 | GO:0030674 | protein binding, bridging(GO:0030674) |
| 0.2 | 0.9 | GO:0004656 | procollagen-proline 4-dioxygenase activity(GO:0004656) procollagen-proline dioxygenase activity(GO:0019798) |
| 0.2 | 0.5 | GO:0047256 | beta-galactosyl-N-acetylglucosaminylgalactosylglucosyl-ceramide beta-1,3-acetylglucosaminyltransferase activity(GO:0008457) lactosylceramide 1,3-N-acetyl-beta-D-glucosaminyltransferase activity(GO:0047256) |
| 0.2 | 1.7 | GO:0019865 | immunoglobulin binding(GO:0019865) |
| 0.2 | 0.9 | GO:0045322 | unmethylated CpG binding(GO:0045322) |
| 0.2 | 3.0 | GO:0005154 | epidermal growth factor receptor binding(GO:0005154) |
| 0.2 | 0.8 | GO:0070679 | inositol 1,4,5 trisphosphate binding(GO:0070679) |
| 0.2 | 2.9 | GO:0005158 | insulin receptor binding(GO:0005158) |
| 0.2 | 1.8 | GO:0008157 | protein phosphatase 1 binding(GO:0008157) |
| 0.2 | 1.6 | GO:0015279 | store-operated calcium channel activity(GO:0015279) |
| 0.2 | 9.1 | GO:0051219 | phosphoprotein binding(GO:0051219) |
| 0.2 | 1.3 | GO:0015386 | potassium:proton antiporter activity(GO:0015386) |
| 0.2 | 1.5 | GO:0042287 | MHC protein binding(GO:0042287) |
| 0.2 | 0.3 | GO:0004127 | cytidylate kinase activity(GO:0004127) |
| 0.1 | 1.8 | GO:0050998 | nitric-oxide synthase binding(GO:0050998) |
| 0.1 | 11.2 | GO:0044325 | ion channel binding(GO:0044325) |
| 0.1 | 0.7 | GO:0005004 | GPI-linked ephrin receptor activity(GO:0005004) neurotrophin receptor activity(GO:0005030) |
| 0.1 | 0.7 | GO:0051021 | GDP-dissociation inhibitor binding(GO:0051021) |
| 0.1 | 12.9 | GO:0008201 | heparin binding(GO:0008201) |
| 0.1 | 36.0 | GO:0005096 | GTPase activator activity(GO:0005096) |
| 0.1 | 1.2 | GO:0005025 | transforming growth factor beta receptor activity, type I(GO:0005025) |
| 0.1 | 6.4 | GO:0030374 | ligand-dependent nuclear receptor transcription coactivator activity(GO:0030374) |
| 0.1 | 0.8 | GO:0047184 | 1-acylglycerophosphocholine O-acyltransferase activity(GO:0047184) |
| 0.1 | 2.5 | GO:0005035 | tumor necrosis factor-activated receptor activity(GO:0005031) death receptor activity(GO:0005035) |
| 0.1 | 0.7 | GO:0031748 | D1 dopamine receptor binding(GO:0031748) |
| 0.1 | 0.9 | GO:0016802 | adenosylhomocysteinase activity(GO:0004013) trialkylsulfonium hydrolase activity(GO:0016802) |
| 0.1 | 0.9 | GO:0015379 | potassium:chloride symporter activity(GO:0015379) potassium ion symporter activity(GO:0022820) |
| 0.1 | 0.2 | GO:1904288 | BAT3 complex binding(GO:1904288) |
| 0.1 | 0.5 | GO:0015186 | L-glutamine transmembrane transporter activity(GO:0015186) |
| 0.1 | 0.8 | GO:0016714 | oxidoreductase activity, acting on paired donors, with incorporation or reduction of molecular oxygen, reduced pteridine as one donor, and incorporation of one atom of oxygen(GO:0016714) |
| 0.1 | 2.2 | GO:0008327 | methyl-CpG binding(GO:0008327) |
| 0.1 | 4.4 | GO:0050840 | extracellular matrix binding(GO:0050840) |
| 0.1 | 1.5 | GO:0047372 | acylglycerol lipase activity(GO:0047372) |
| 0.1 | 1.7 | GO:0005528 | macrolide binding(GO:0005527) FK506 binding(GO:0005528) |
| 0.1 | 1.8 | GO:0017075 | syntaxin-1 binding(GO:0017075) |
| 0.1 | 0.4 | GO:0015410 | manganese-transporting ATPase activity(GO:0015410) |
| 0.1 | 2.2 | GO:0043015 | gamma-tubulin binding(GO:0043015) |
| 0.1 | 0.4 | GO:0019808 | polyamine binding(GO:0019808) |
| 0.1 | 29.2 | GO:0061630 | ubiquitin protein ligase activity(GO:0061630) |
| 0.1 | 1.3 | GO:0047555 | 3',5'-cyclic-GMP phosphodiesterase activity(GO:0047555) |
| 0.1 | 1.4 | GO:0005314 | high-affinity glutamate transmembrane transporter activity(GO:0005314) |
| 0.1 | 4.8 | GO:0005200 | structural constituent of cytoskeleton(GO:0005200) |
| 0.1 | 1.3 | GO:0004622 | lysophospholipase activity(GO:0004622) |
| 0.1 | 1.0 | GO:0008190 | eukaryotic initiation factor 4E binding(GO:0008190) |
| 0.1 | 2.4 | GO:0005112 | Notch binding(GO:0005112) |
| 0.1 | 3.8 | GO:0004364 | glutathione transferase activity(GO:0004364) |
| 0.1 | 3.0 | GO:0008376 | acetylgalactosaminyltransferase activity(GO:0008376) |
| 0.1 | 2.3 | GO:0051721 | protein phosphatase 2A binding(GO:0051721) |
| 0.1 | 1.2 | GO:0005078 | MAP-kinase scaffold activity(GO:0005078) |
| 0.1 | 6.4 | GO:0017137 | Rab GTPase binding(GO:0017137) |
| 0.1 | 1.3 | GO:0017017 | MAP kinase tyrosine/serine/threonine phosphatase activity(GO:0017017) |
| 0.1 | 0.1 | GO:0031435 | mitogen-activated protein kinase kinase kinase binding(GO:0031435) |
| 0.1 | 1.2 | GO:0004385 | guanylate kinase activity(GO:0004385) |
| 0.1 | 0.5 | GO:0000298 | endopolyphosphatase activity(GO:0000298) diphosphoinositol-polyphosphate diphosphatase activity(GO:0008486) bis(5'-adenosyl)-hexaphosphatase activity(GO:0034431) bis(5'-adenosyl)-pentaphosphatase activity(GO:0034432) |
| 0.1 | 0.6 | GO:0090599 | alpha-glucosidase activity(GO:0090599) |
| 0.1 | 0.9 | GO:0015217 | ATP transmembrane transporter activity(GO:0005347) ADP transmembrane transporter activity(GO:0015217) |
| 0.1 | 20.0 | GO:0004842 | ubiquitin-protein transferase activity(GO:0004842) |
| 0.1 | 4.8 | GO:0051117 | ATPase binding(GO:0051117) |
| 0.1 | 0.3 | GO:0035851 | Krueppel-associated box domain binding(GO:0035851) |
| 0.1 | 7.4 | GO:0005057 | receptor signaling protein activity(GO:0005057) |
| 0.1 | 2.0 | GO:0004012 | phospholipid-translocating ATPase activity(GO:0004012) |
| 0.1 | 0.6 | GO:0001094 | TFIID-class transcription factor binding(GO:0001094) |
| 0.1 | 1.3 | GO:0080025 | phosphatidylinositol-3,5-bisphosphate binding(GO:0080025) |
| 0.1 | 0.5 | GO:0043325 | phosphatidylinositol-3,4-bisphosphate binding(GO:0043325) |
| 0.1 | 1.8 | GO:0003746 | translation elongation factor activity(GO:0003746) |
| 0.1 | 0.2 | GO:0035240 | dopamine neurotransmitter receptor activity, coupled via Gi/Go(GO:0001591) dopamine binding(GO:0035240) |
| 0.1 | 0.8 | GO:0070008 | serine-type exopeptidase activity(GO:0070008) |
| 0.1 | 3.9 | GO:0004722 | protein serine/threonine phosphatase activity(GO:0004722) |
| 0.1 | 1.3 | GO:0030215 | semaphorin receptor binding(GO:0030215) |
| 0.1 | 0.9 | GO:0008569 | ATP-dependent microtubule motor activity, minus-end-directed(GO:0008569) |
| 0.1 | 0.6 | GO:0046974 | histone methyltransferase activity (H3-K9 specific)(GO:0046974) |
| 0.1 | 19.8 | GO:0003779 | actin binding(GO:0003779) |
| 0.1 | 1.0 | GO:0005537 | mannose binding(GO:0005537) |
| 0.1 | 1.0 | GO:0017160 | Ral GTPase binding(GO:0017160) |
| 0.1 | 0.3 | GO:0005324 | long-chain fatty acid transporter activity(GO:0005324) |
| 0.1 | 0.6 | GO:0048407 | platelet-derived growth factor binding(GO:0048407) |
| 0.1 | 1.7 | GO:0008139 | nuclear localization sequence binding(GO:0008139) |
| 0.1 | 3.2 | GO:0019903 | protein phosphatase binding(GO:0019903) |
| 0.1 | 1.1 | GO:0015095 | magnesium ion transmembrane transporter activity(GO:0015095) |
| 0.1 | 0.2 | GO:0008556 | sodium:potassium-exchanging ATPase activity(GO:0005391) potassium-transporting ATPase activity(GO:0008556) |
| 0.1 | 0.3 | GO:0016215 | acyl-CoA desaturase activity(GO:0016215) |
| 0.1 | 1.0 | GO:0004190 | aspartic-type endopeptidase activity(GO:0004190) aspartic-type peptidase activity(GO:0070001) |
| 0.1 | 1.0 | GO:0015301 | anion:anion antiporter activity(GO:0015301) |
| 0.1 | 0.2 | GO:0043559 | insulin binding(GO:0043559) |
| 0.1 | 0.5 | GO:0043995 | histone acetyltransferase activity (H4-K5 specific)(GO:0043995) histone acetyltransferase activity (H4-K8 specific)(GO:0043996) histone acetyltransferase activity (H4-K16 specific)(GO:0046972) |
| 0.1 | 4.4 | GO:0005516 | calmodulin binding(GO:0005516) |
| 0.1 | 1.0 | GO:0005496 | steroid binding(GO:0005496) |
| 0.1 | 1.4 | GO:0008536 | Ran GTPase binding(GO:0008536) |
| 0.0 | 0.2 | GO:0004468 | lysine N-acetyltransferase activity, acting on acetyl phosphate as donor(GO:0004468) |
| 0.0 | 0.6 | GO:0015026 | coreceptor activity(GO:0015026) |
| 0.0 | 0.4 | GO:0051787 | misfolded protein binding(GO:0051787) |
| 0.0 | 0.9 | GO:0003841 | 1-acylglycerol-3-phosphate O-acyltransferase activity(GO:0003841) |
| 0.0 | 0.1 | GO:0048248 | CXCR3 chemokine receptor binding(GO:0048248) |
| 0.0 | 0.8 | GO:0004129 | cytochrome-c oxidase activity(GO:0004129) heme-copper terminal oxidase activity(GO:0015002) oxidoreductase activity, acting on a heme group of donors, oxygen as acceptor(GO:0016676) |
| 0.0 | 10.7 | GO:0016887 | ATPase activity(GO:0016887) |
| 0.0 | 2.3 | GO:0008565 | protein transporter activity(GO:0008565) |
| 0.0 | 1.4 | GO:0015631 | tubulin binding(GO:0015631) |
| 0.0 | 0.9 | GO:0044183 | protein binding involved in protein folding(GO:0044183) |
| 0.0 | 0.7 | GO:0005086 | ARF guanyl-nucleotide exchange factor activity(GO:0005086) |
| 0.0 | 0.2 | GO:0035005 | 1-phosphatidylinositol-4-phosphate 3-kinase activity(GO:0035005) |
| 0.0 | 8.7 | GO:0050839 | cell adhesion molecule binding(GO:0050839) |
| 0.0 | 0.4 | GO:0048365 | Rac GTPase binding(GO:0048365) |
| 0.0 | 1.4 | GO:0016209 | antioxidant activity(GO:0016209) |
| 0.0 | 0.2 | GO:0016701 | oxidoreductase activity, acting on single donors with incorporation of molecular oxygen(GO:0016701) oxidoreductase activity, acting on single donors with incorporation of molecular oxygen, incorporation of two atoms of oxygen(GO:0016702) |
| 0.0 | 1.8 | GO:0004222 | metalloendopeptidase activity(GO:0004222) |
| 0.0 | 0.6 | GO:0017112 | Rab guanyl-nucleotide exchange factor activity(GO:0017112) |
| 0.0 | 0.2 | GO:0043560 | insulin receptor substrate binding(GO:0043560) |
| 0.0 | 0.2 | GO:0030742 | GTP-dependent protein binding(GO:0030742) |
| 0.0 | 0.1 | GO:1990247 | N6-methyladenosine-containing RNA binding(GO:1990247) |
| 0.0 | 0.3 | GO:0005201 | extracellular matrix structural constituent(GO:0005201) |
| 0.0 | 0.5 | GO:0051019 | mitogen-activated protein kinase binding(GO:0051019) |
| 0.0 | 0.1 | GO:0070181 | small ribosomal subunit rRNA binding(GO:0070181) |
| 0.0 | 0.2 | GO:0034987 | immunoglobulin receptor binding(GO:0034987) |
| 0.0 | 1.2 | GO:0035091 | phosphatidylinositol binding(GO:0035091) |
| 0.0 | 0.4 | GO:0005484 | SNAP receptor activity(GO:0005484) |
Gene overrepresentation in C2:CP category:
| Log-likelihood per target | Total log-likelihood | Term | Description |
|---|---|---|---|
| 1.8 | 34.2 | PID_P38_GAMMA_DELTA_PATHWAY | Signaling mediated by p38-gamma and p38-delta |
| 0.7 | 29.9 | PID_LIS1_PATHWAY | Lissencephaly gene (LIS1) in neuronal migration and development |
| 0.7 | 8.2 | PID_THROMBIN_PAR4_PATHWAY | PAR4-mediated thrombin signaling events |
| 0.6 | 4.7 | PID_INTEGRIN4_PATHWAY | Alpha6 beta4 integrin-ligand interactions |
| 0.5 | 20.3 | PID_REELIN_PATHWAY | Reelin signaling pathway |
| 0.5 | 27.1 | PID_TCPTP_PATHWAY | Signaling events mediated by TCPTP |
| 0.5 | 16.3 | PID_IL3_PATHWAY | IL3-mediated signaling events |
| 0.5 | 20.6 | PID_RAC1_REG_PATHWAY | Regulation of RAC1 activity |
| 0.5 | 21.0 | PID_CDC42_REG_PATHWAY | Regulation of CDC42 activity |
| 0.4 | 26.7 | PID_LKB1_PATHWAY | LKB1 signaling events |
| 0.3 | 8.8 | NABA_BASEMENT_MEMBRANES | Genes encoding structural components of basement membranes |
| 0.3 | 12.3 | PID_KIT_PATHWAY | Signaling events mediated by Stem cell factor receptor (c-Kit) |
| 0.3 | 4.5 | PID_EPHA_FWDPATHWAY | EPHA forward signaling |
| 0.2 | 11.0 | PID_INSULIN_PATHWAY | Insulin Pathway |
| 0.2 | 2.2 | PID_VEGF_VEGFR_PATHWAY | VEGF and VEGFR signaling network |
| 0.2 | 7.8 | NABA_PROTEOGLYCANS | Genes encoding proteoglycans |
| 0.2 | 5.0 | ST_PHOSPHOINOSITIDE_3_KINASE_PATHWAY | PI3K Pathway |
| 0.2 | 4.9 | PID_ER_NONGENOMIC_PATHWAY | Plasma membrane estrogen receptor signaling |
| 0.2 | 15.8 | PID_HIF1_TFPATHWAY | HIF-1-alpha transcription factor network |
| 0.2 | 4.4 | PID_ERBB2_ERBB3_PATHWAY | ErbB2/ErbB3 signaling events |
| 0.2 | 3.4 | PID_RET_PATHWAY | Signaling events regulated by Ret tyrosine kinase |
| 0.2 | 8.5 | PID_HNF3A_PATHWAY | FOXA1 transcription factor network |
| 0.2 | 8.3 | PID_P38_ALPHA_BETA_DOWNSTREAM_PATHWAY | Signaling mediated by p38-alpha and p38-beta |
| 0.2 | 4.6 | SIG_CD40PATHWAYMAP | Genes related to CD40 signaling |
| 0.2 | 3.7 | PID_EPHB_FWD_PATHWAY | EPHB forward signaling |
| 0.2 | 1.2 | PID_AJDISS_2PATHWAY | Posttranslational regulation of adherens junction stability and dissassembly |
| 0.2 | 0.9 | PID_GLYPICAN_1PATHWAY | Glypican 1 network |
| 0.1 | 1.7 | PID_PTP1B_PATHWAY | Signaling events mediated by PTP1B |
| 0.1 | 8.6 | PID_PDGFRB_PATHWAY | PDGFR-beta signaling pathway |
| 0.1 | 2.6 | ST_G_ALPHA_I_PATHWAY | G alpha i Pathway |
| 0.1 | 1.7 | PID_SYNDECAN_2_PATHWAY | Syndecan-2-mediated signaling events |
| 0.1 | 7.0 | PID_TGFBR_PATHWAY | TGF-beta receptor signaling |
| 0.1 | 1.8 | PID_IFNG_PATHWAY | IFN-gamma pathway |
| 0.1 | 2.1 | PID_SHP2_PATHWAY | SHP2 signaling |
| 0.1 | 1.4 | PID_NFAT_TFPATHWAY | Calcineurin-regulated NFAT-dependent transcription in lymphocytes |
| 0.1 | 5.0 | PID_AVB3_INTEGRIN_PATHWAY | Integrins in angiogenesis |
| 0.1 | 7.9 | PID_P53_DOWNSTREAM_PATHWAY | Direct p53 effectors |
| 0.1 | 1.7 | PID_IL4_2PATHWAY | IL4-mediated signaling events |
| 0.1 | 3.5 | PID_TAP63_PATHWAY | Validated transcriptional targets of TAp63 isoforms |
| 0.1 | 2.1 | PID_ERBB1_INTERNALIZATION_PATHWAY | Internalization of ErbB1 |
| 0.1 | 0.8 | PID_INTEGRIN3_PATHWAY | Beta3 integrin cell surface interactions |
| 0.1 | 12.2 | NABA_SECRETED_FACTORS | Genes encoding secreted soluble factors |
| 0.1 | 1.3 | PID_INTEGRIN_A4B1_PATHWAY | Alpha4 beta1 integrin signaling events |
| 0.1 | 1.7 | PID_BMP_PATHWAY | BMP receptor signaling |
| 0.1 | 1.3 | PID_P38_ALPHA_BETA_PATHWAY | Regulation of p38-alpha and p38-beta |
| 0.1 | 7.0 | NABA_ECM_GLYCOPROTEINS | Genes encoding structural ECM glycoproteins |
| 0.1 | 0.4 | PID_ARF6_DOWNSTREAM_PATHWAY | Arf6 downstream pathway |
| 0.1 | 1.5 | PID_FOXO_PATHWAY | FoxO family signaling |
| 0.1 | 6.0 | NABA_ECM_AFFILIATED | Genes encoding proteins affiliated structurally or functionally to extracellular matrix proteins |
| 0.1 | 1.3 | PID_ERBB1_DOWNSTREAM_PATHWAY | ErbB1 downstream signaling |
| 0.0 | 0.7 | ST_TUMOR_NECROSIS_FACTOR_PATHWAY | Tumor Necrosis Factor Pathway. |
| 0.0 | 0.3 | ST_JAK_STAT_PATHWAY | Jak-STAT Pathway |
| 0.0 | 0.8 | PID_ARF6_PATHWAY | Arf6 signaling events |
| 0.0 | 1.0 | PID_REG_GR_PATHWAY | Glucocorticoid receptor regulatory network |
| 0.0 | 1.2 | PID_TCR_PATHWAY | TCR signaling in naïve CD4+ T cells |
| 0.0 | 0.2 | PID_TOLL_ENDOGENOUS_PATHWAY | Endogenous TLR signaling |
| 0.0 | 0.7 | PID_P75_NTR_PATHWAY | p75(NTR)-mediated signaling |
| 0.0 | 0.3 | PID_ALPHA_SYNUCLEIN_PATHWAY | Alpha-synuclein signaling |
| 0.0 | 0.6 | PID_P73PATHWAY | p73 transcription factor network |
| 0.0 | 0.3 | PID_ARF_3PATHWAY | Arf1 pathway |
Gene overrepresentation in C2:CP:REACTOME category:
| Log-likelihood per target | Total log-likelihood | Term | Description |
|---|---|---|---|
| 1.4 | 27.6 | REACTOME_CRMPS_IN_SEMA3A_SIGNALING | Genes involved in CRMPs in Sema3A signaling |
| 1.0 | 23.4 | REACTOME_CASPASE_MEDIATED_CLEAVAGE_OF_CYTOSKELETAL_PROTEINS | Genes involved in Caspase-mediated cleavage of cytoskeletal proteins |
| 1.0 | 6.8 | REACTOME_TANDEM_PORE_DOMAIN_POTASSIUM_CHANNELS | Genes involved in Tandem pore domain potassium channels |
| 1.0 | 15.2 | REACTOME_POST_CHAPERONIN_TUBULIN_FOLDING_PATHWAY | Genes involved in Post-chaperonin tubulin folding pathway |
| 0.9 | 9.0 | REACTOME_ACETYLCHOLINE_NEUROTRANSMITTER_RELEASE_CYCLE | Genes involved in Acetylcholine Neurotransmitter Release Cycle |
| 0.9 | 22.4 | REACTOME_CREB_PHOSPHORYLATION_THROUGH_THE_ACTIVATION_OF_CAMKII | Genes involved in CREB phosphorylation through the activation of CaMKII |
| 0.8 | 4.1 | REACTOME_OLFACTORY_SIGNALING_PATHWAY | Genes involved in Olfactory Signaling Pathway |
| 0.8 | 29.5 | REACTOME_DARPP_32_EVENTS | Genes involved in DARPP-32 events |
| 0.8 | 0.8 | REACTOME_SIGNALING_BY_ACTIVATED_POINT_MUTANTS_OF_FGFR1 | Genes involved in Signaling by activated point mutants of FGFR1 |
| 0.7 | 6.7 | REACTOME_IL_7_SIGNALING | Genes involved in Interleukin-7 signaling |
| 0.7 | 11.5 | REACTOME_GABA_A_RECEPTOR_ACTIVATION | Genes involved in GABA A receptor activation |
| 0.7 | 13.4 | REACTOME_N_GLYCAN_ANTENNAE_ELONGATION | Genes involved in N-Glycan antennae elongation |
| 0.6 | 9.0 | REACTOME_INFLAMMASOMES | Genes involved in Inflammasomes |
| 0.6 | 16.5 | REACTOME_CGMP_EFFECTS | Genes involved in cGMP effects |
| 0.6 | 10.6 | REACTOME_NEPHRIN_INTERACTIONS | Genes involved in Nephrin interactions |
| 0.6 | 13.2 | REACTOME_TIE2_SIGNALING | Genes involved in Tie2 Signaling |
| 0.5 | 7.4 | REACTOME_ERK_MAPK_TARGETS | Genes involved in ERK/MAPK targets |
| 0.5 | 6.0 | REACTOME_AMINE_LIGAND_BINDING_RECEPTORS | Genes involved in Amine ligand-binding receptors |
| 0.4 | 15.0 | REACTOME_GLYCOLYSIS | Genes involved in Glycolysis |
| 0.4 | 8.6 | REACTOME_OTHER_SEMAPHORIN_INTERACTIONS | Genes involved in Other semaphorin interactions |
| 0.4 | 15.1 | REACTOME_VOLTAGE_GATED_POTASSIUM_CHANNELS | Genes involved in Voltage gated Potassium channels |
| 0.4 | 14.6 | REACTOME_INHIBITION_OF_VOLTAGE_GATED_CA2_CHANNELS_VIA_GBETA_GAMMA_SUBUNITS | Genes involved in Inhibition of voltage gated Ca2+ channels via Gbeta/gamma subunits |
| 0.4 | 18.4 | REACTOME_NCAM1_INTERACTIONS | Genes involved in NCAM1 interactions |
| 0.4 | 1.1 | REACTOME_SYNTHESIS_OF_PE | Genes involved in Synthesis of PE |
| 0.4 | 47.7 | REACTOME_L1CAM_INTERACTIONS | Genes involved in L1CAM interactions |
| 0.3 | 1.7 | REACTOME_PLATELET_ADHESION_TO_EXPOSED_COLLAGEN | Genes involved in Platelet Adhesion to exposed collagen |
| 0.3 | 12.8 | REACTOME_SEMA4D_IN_SEMAPHORIN_SIGNALING | Genes involved in Sema4D in semaphorin signaling |
| 0.3 | 5.0 | REACTOME_REGULATION_OF_KIT_SIGNALING | Genes involved in Regulation of KIT signaling |
| 0.3 | 8.0 | REACTOME_RAP1_SIGNALLING | Genes involved in Rap1 signalling |
| 0.3 | 2.3 | REACTOME_FGFR4_LIGAND_BINDING_AND_ACTIVATION | Genes involved in FGFR4 ligand binding and activation |
| 0.3 | 6.3 | REACTOME_ACTIVATION_OF_BH3_ONLY_PROTEINS | Genes involved in Activation of BH3-only proteins |
| 0.3 | 6.6 | REACTOME_SYNTHESIS_OF_PC | Genes involved in Synthesis of PC |
| 0.3 | 4.1 | REACTOME_SYNTHESIS_OF_PIPS_AT_THE_LATE_ENDOSOME_MEMBRANE | Genes involved in Synthesis of PIPs at the late endosome membrane |
| 0.3 | 1.6 | REACTOME_ELEVATION_OF_CYTOSOLIC_CA2_LEVELS | Genes involved in Elevation of cytosolic Ca2+ levels |
| 0.3 | 2.1 | REACTOME_ANTIGEN_ACTIVATES_B_CELL_RECEPTOR_LEADING_TO_GENERATION_OF_SECOND_MESSENGERS | Genes involved in Antigen Activates B Cell Receptor Leading to Generation of Second Messengers |
| 0.3 | 3.0 | REACTOME_POTASSIUM_CHANNELS | Genes involved in Potassium Channels |
| 0.3 | 5.3 | REACTOME_CELL_EXTRACELLULAR_MATRIX_INTERACTIONS | Genes involved in Cell-extracellular matrix interactions |
| 0.2 | 17.4 | REACTOME_NRAGE_SIGNALS_DEATH_THROUGH_JNK | Genes involved in NRAGE signals death through JNK |
| 0.2 | 1.6 | REACTOME_ARMS_MEDIATED_ACTIVATION | Genes involved in ARMS-mediated activation |
| 0.2 | 21.7 | REACTOME_SIGNALING_BY_RHO_GTPASES | Genes involved in Signaling by Rho GTPases |
| 0.2 | 2.8 | REACTOME_IRAK1_RECRUITS_IKK_COMPLEX | Genes involved in IRAK1 recruits IKK complex |
| 0.2 | 3.0 | REACTOME_PURINE_RIBONUCLEOSIDE_MONOPHOSPHATE_BIOSYNTHESIS | Genes involved in Purine ribonucleoside monophosphate biosynthesis |
| 0.2 | 2.9 | REACTOME_CTNNB1_PHOSPHORYLATION_CASCADE | Genes involved in Beta-catenin phosphorylation cascade |
| 0.2 | 0.8 | REACTOME_PECAM1_INTERACTIONS | Genes involved in PECAM1 interactions |
| 0.2 | 2.5 | REACTOME_CYTOCHROME_P450_ARRANGED_BY_SUBSTRATE_TYPE | Genes involved in Cytochrome P450 - arranged by substrate type |
| 0.2 | 5.0 | REACTOME_TRAFFICKING_OF_AMPA_RECEPTORS | Genes involved in Trafficking of AMPA receptors |
| 0.2 | 2.7 | REACTOME_IL_3_5_AND_GM_CSF_SIGNALING | Genes involved in Interleukin-3, 5 and GM-CSF signaling |
| 0.2 | 7.7 | REACTOME_COLLAGEN_FORMATION | Genes involved in Collagen formation |
| 0.2 | 10.7 | REACTOME_RESPONSE_TO_ELEVATED_PLATELET_CYTOSOLIC_CA2_ | Genes involved in Response to elevated platelet cytosolic Ca2+ |
| 0.2 | 4.3 | REACTOME_RNA_POL_III_TRANSCRIPTION_TERMINATION | Genes involved in RNA Polymerase III Transcription Termination |
| 0.2 | 1.4 | REACTOME_BILE_SALT_AND_ORGANIC_ANION_SLC_TRANSPORTERS | Genes involved in Bile salt and organic anion SLC transporters |
| 0.2 | 1.6 | REACTOME_ROLE_OF_DCC_IN_REGULATING_APOPTOSIS | Genes involved in Role of DCC in regulating apoptosis |
| 0.1 | 1.8 | REACTOME_INTRINSIC_PATHWAY_FOR_APOPTOSIS | Genes involved in Intrinsic Pathway for Apoptosis |
| 0.1 | 0.7 | REACTOME_N_GLYCAN_ANTENNAE_ELONGATION_IN_THE_MEDIAL_TRANS_GOLGI | Genes involved in N-glycan antennae elongation in the medial/trans-Golgi |
| 0.1 | 1.1 | REACTOME_THROMBOXANE_SIGNALLING_THROUGH_TP_RECEPTOR | Genes involved in Thromboxane signalling through TP receptor |
| 0.1 | 2.0 | REACTOME_JNK_C_JUN_KINASES_PHOSPHORYLATION_AND_ACTIVATION_MEDIATED_BY_ACTIVATED_HUMAN_TAK1 | Genes involved in JNK (c-Jun kinases) phosphorylation and activation mediated by activated human TAK1 |
| 0.1 | 0.6 | REACTOME_SIGNAL_AMPLIFICATION | Genes involved in Signal amplification |
| 0.1 | 12.1 | REACTOME_TRANSPORT_OF_INORGANIC_CATIONS_ANIONS_AND_AMINO_ACIDS_OLIGOPEPTIDES | Genes involved in Transport of inorganic cations/anions and amino acids/oligopeptides |
| 0.1 | 2.6 | REACTOME_GROWTH_HORMONE_RECEPTOR_SIGNALING | Genes involved in Growth hormone receptor signaling |
| 0.1 | 4.4 | REACTOME_SPHINGOLIPID_DE_NOVO_BIOSYNTHESIS | Genes involved in Sphingolipid de novo biosynthesis |
| 0.1 | 1.2 | REACTOME_TRANSPORT_TO_THE_GOLGI_AND_SUBSEQUENT_MODIFICATION | Genes involved in Transport to the Golgi and subsequent modification |
| 0.1 | 9.9 | REACTOME_FACTORS_INVOLVED_IN_MEGAKARYOCYTE_DEVELOPMENT_AND_PLATELET_PRODUCTION | Genes involved in Factors involved in megakaryocyte development and platelet production |
| 0.1 | 0.8 | REACTOME_ACYL_CHAIN_REMODELLING_OF_PC | Genes involved in Acyl chain remodelling of PC |
| 0.1 | 2.4 | REACTOME_ABC_FAMILY_PROTEINS_MEDIATED_TRANSPORT | Genes involved in ABC-family proteins mediated transport |
| 0.1 | 1.8 | REACTOME_PREFOLDIN_MEDIATED_TRANSFER_OF_SUBSTRATE_TO_CCT_TRIC | Genes involved in Prefoldin mediated transfer of substrate to CCT/TriC |
| 0.1 | 0.6 | REACTOME_CLASS_C_3_METABOTROPIC_GLUTAMATE_PHEROMONE_RECEPTORS | Genes involved in Class C/3 (Metabotropic glutamate/pheromone receptors) |
| 0.1 | 0.7 | REACTOME_ACYL_CHAIN_REMODELLING_OF_PG | Genes involved in Acyl chain remodelling of PG |
| 0.1 | 1.1 | REACTOME_REGULATION_OF_INSULIN_LIKE_GROWTH_FACTOR_IGF_ACTIVITY_BY_INSULIN_LIKE_GROWTH_FACTOR_BINDING_PROTEINS_IGFBPS | Genes involved in Regulation of Insulin-like Growth Factor (IGF) Activity by Insulin-like Growth Factor Binding Proteins (IGFBPs) |
| 0.1 | 1.2 | REACTOME_KERATAN_SULFATE_BIOSYNTHESIS | Genes involved in Keratan sulfate biosynthesis |
| 0.1 | 2.2 | REACTOME_REGULATION_OF_GLUCOKINASE_BY_GLUCOKINASE_REGULATORY_PROTEIN | Genes involved in Regulation of Glucokinase by Glucokinase Regulatory Protein |
| 0.1 | 0.9 | REACTOME_NEF_MEDIATED_DOWNREGULATION_OF_MHC_CLASS_I_COMPLEX_CELL_SURFACE_EXPRESSION | Genes involved in Nef mediated downregulation of MHC class I complex cell surface expression |
| 0.1 | 0.5 | REACTOME_ACTIVATION_OF_CHAPERONE_GENES_BY_ATF6_ALPHA | Genes involved in Activation of Chaperone Genes by ATF6-alpha |
| 0.1 | 0.6 | REACTOME_CALNEXIN_CALRETICULIN_CYCLE | Genes involved in Calnexin/calreticulin cycle |
| 0.1 | 3.4 | REACTOME_MHC_CLASS_II_ANTIGEN_PRESENTATION | Genes involved in MHC class II antigen presentation |
| 0.1 | 3.8 | REACTOME_TRANSMISSION_ACROSS_CHEMICAL_SYNAPSES | Genes involved in Transmission across Chemical Synapses |
| 0.1 | 2.4 | REACTOME_ANTIVIRAL_MECHANISM_BY_IFN_STIMULATED_GENES | Genes involved in Antiviral mechanism by IFN-stimulated genes |
| 0.1 | 1.3 | REACTOME_DOWNREGULATION_OF_TGF_BETA_RECEPTOR_SIGNALING | Genes involved in Downregulation of TGF-beta receptor signaling |
| 0.0 | 1.5 | REACTOME_ASSOCIATION_OF_TRIC_CCT_WITH_TARGET_PROTEINS_DURING_BIOSYNTHESIS | Genes involved in Association of TriC/CCT with target proteins during biosynthesis |
| 0.0 | 0.9 | REACTOME_ACTIVATION_OF_GENES_BY_ATF4 | Genes involved in Activation of Genes by ATF4 |
| 0.0 | 1.2 | REACTOME_ENDOSOMAL_SORTING_COMPLEX_REQUIRED_FOR_TRANSPORT_ESCRT | Genes involved in Endosomal Sorting Complex Required For Transport (ESCRT) |
| 0.0 | 1.7 | REACTOME_ION_TRANSPORT_BY_P_TYPE_ATPASES | Genes involved in Ion transport by P-type ATPases |
| 0.0 | 0.8 | REACTOME_CHONDROITIN_SULFATE_BIOSYNTHESIS | Genes involved in Chondroitin sulfate biosynthesis |
| 0.0 | 0.9 | REACTOME_SIGNALING_BY_HIPPO | Genes involved in Signaling by Hippo |
| 0.0 | 0.9 | REACTOME_SYNTHESIS_OF_PA | Genes involved in Synthesis of PA |
| 0.0 | 0.5 | REACTOME_CHOLESTEROL_BIOSYNTHESIS | Genes involved in Cholesterol biosynthesis |
| 0.0 | 0.4 | REACTOME_G0_AND_EARLY_G1 | Genes involved in G0 and Early G1 |
| 0.0 | 1.7 | REACTOME_RESPIRATORY_ELECTRON_TRANSPORT_ATP_SYNTHESIS_BY_CHEMIOSMOTIC_COUPLING_AND_HEAT_PRODUCTION_BY_UNCOUPLING_PROTEINS_ | Genes involved in Respiratory electron transport, ATP synthesis by chemiosmotic coupling, and heat production by uncoupling proteins. |
| 0.0 | 0.3 | REACTOME_ALPHA_LINOLENIC_ACID_ALA_METABOLISM | Genes involved in alpha-linolenic acid (ALA) metabolism |
| 0.0 | 0.7 | REACTOME_GOLGI_ASSOCIATED_VESICLE_BIOGENESIS | Genes involved in Golgi Associated Vesicle Biogenesis |
| 0.0 | 0.3 | REACTOME_PHOSPHORYLATION_OF_THE_APC_C | Genes involved in Phosphorylation of the APC/C |
| 0.0 | 0.2 | REACTOME_PROTEOLYTIC_CLEAVAGE_OF_SNARE_COMPLEX_PROTEINS | Genes involved in Proteolytic cleavage of SNARE complex proteins |
| 0.0 | 0.7 | REACTOME_MITOCHONDRIAL_PROTEIN_IMPORT | Genes involved in Mitochondrial Protein Import |
| 0.0 | 1.1 | REACTOME_MITOTIC_PROMETAPHASE | Genes involved in Mitotic Prometaphase |
|
|
|
|