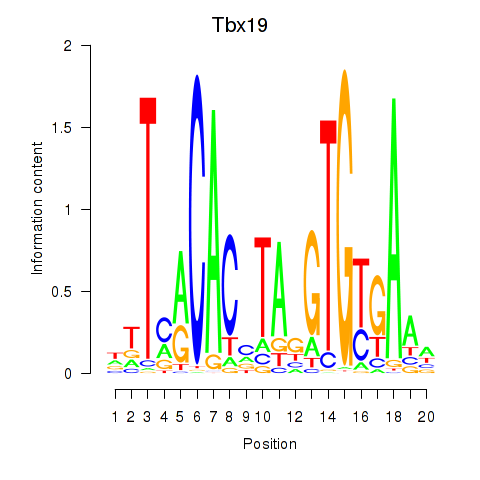
Motif ID: Tbx19
Z-value: 0.696
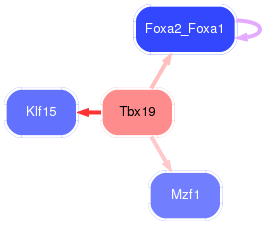
Transcription factors associated with Tbx19:
| Gene Symbol | Entrez ID | Gene Name |
|---|---|---|
| Tbx19 | ENSMUSG00000026572.5 | Tbx19 |

Top targets:
Gene overrepresentation in biological_process category:
| Log-likelihood per target | Total log-likelihood | Term | Description |
|---|---|---|---|
| 0.9 | 2.8 | GO:0051464 | positive regulation of cortisol secretion(GO:0051464) |
| 0.8 | 2.5 | GO:1901228 | regulation of osteoclast proliferation(GO:0090289) positive regulation of transcription from RNA polymerase II promoter involved in heart development(GO:1901228) negative regulation of bone development(GO:1903011) |
| 0.6 | 3.1 | GO:0002457 | T cell antigen processing and presentation(GO:0002457) |
| 0.5 | 3.2 | GO:0060718 | chorionic trophoblast cell differentiation(GO:0060718) |
| 0.4 | 1.3 | GO:0002538 | arachidonic acid metabolite production involved in inflammatory response(GO:0002538) olefin metabolic process(GO:1900673) |
| 0.4 | 1.4 | GO:1902990 | leading strand elongation(GO:0006272) mitotic telomere maintenance via semi-conservative replication(GO:1902990) |
| 0.3 | 4.7 | GO:0048672 | positive regulation of collateral sprouting(GO:0048672) |
| 0.3 | 0.8 | GO:0006578 | amino-acid betaine biosynthetic process(GO:0006578) |
| 0.2 | 1.3 | GO:0050747 | positive regulation of lipoprotein metabolic process(GO:0050747) |
| 0.2 | 1.1 | GO:1903215 | negative regulation of protein targeting to mitochondrion(GO:1903215) |
| 0.2 | 1.5 | GO:1903690 | negative regulation of wound healing, spreading of epidermal cells(GO:1903690) |
| 0.2 | 0.6 | GO:0097278 | complement-dependent cytotoxicity(GO:0097278) |
| 0.2 | 1.4 | GO:0048304 | positive regulation of isotype switching to IgG isotypes(GO:0048304) |
| 0.2 | 1.6 | GO:0070874 | negative regulation of glycogen biosynthetic process(GO:0045719) negative regulation of glycogen metabolic process(GO:0070874) |
| 0.2 | 0.5 | GO:0031590 | wybutosine metabolic process(GO:0031590) wybutosine biosynthetic process(GO:0031591) |
| 0.2 | 0.6 | GO:0071034 | CUT catabolic process(GO:0071034) CUT metabolic process(GO:0071043) polyadenylation-dependent snoRNA 3'-end processing(GO:0071051) |
| 0.1 | 0.4 | GO:0006434 | seryl-tRNA aminoacylation(GO:0006434) |
| 0.1 | 0.8 | GO:0046477 | glycosylceramide catabolic process(GO:0046477) |
| 0.1 | 0.1 | GO:0051462 | cortisol secretion(GO:0043400) regulation of cortisol secretion(GO:0051462) |
| 0.1 | 0.6 | GO:0098734 | protein depalmitoylation(GO:0002084) positive regulation of pinocytosis(GO:0048549) macromolecule depalmitoylation(GO:0098734) |
| 0.1 | 1.3 | GO:1902018 | negative regulation of cilium assembly(GO:1902018) |
| 0.1 | 1.8 | GO:0072112 | renal filtration cell differentiation(GO:0061318) glomerular visceral epithelial cell differentiation(GO:0072112) glomerular epithelial cell differentiation(GO:0072311) |
| 0.1 | 0.4 | GO:0035937 | androgen catabolic process(GO:0006710) estrogen secretion(GO:0035937) estradiol secretion(GO:0035938) testosterone biosynthetic process(GO:0061370) regulation of estrogen secretion(GO:2000861) regulation of estradiol secretion(GO:2000864) |
| 0.1 | 4.0 | GO:0035411 | catenin import into nucleus(GO:0035411) |
| 0.1 | 0.5 | GO:0098707 | ferrous iron import into cell(GO:0097460) ferrous iron import across plasma membrane(GO:0098707) |
| 0.1 | 0.2 | GO:0006116 | NADH oxidation(GO:0006116) |
| 0.1 | 0.9 | GO:0030150 | protein import into mitochondrial matrix(GO:0030150) |
| 0.1 | 0.2 | GO:0045014 | detection of carbohydrate stimulus(GO:0009730) detection of hexose stimulus(GO:0009732) detection of monosaccharide stimulus(GO:0034287) carbon catabolite repression of transcription(GO:0045013) negative regulation of transcription by glucose(GO:0045014) detection of glucose(GO:0051594) |
| 0.1 | 0.4 | GO:0099550 | trans-synaptic signalling, modulating synaptic transmission(GO:0099550) |
| 0.0 | 0.2 | GO:0032627 | interleukin-23 production(GO:0032627) regulation of interleukin-23 production(GO:0032667) |
| 0.0 | 0.8 | GO:0006120 | mitochondrial electron transport, NADH to ubiquinone(GO:0006120) |
| 0.0 | 0.7 | GO:0043011 | myeloid dendritic cell differentiation(GO:0043011) |
| 0.0 | 0.3 | GO:0032364 | oxygen homeostasis(GO:0032364) |
| 0.0 | 0.8 | GO:0046597 | negative regulation of viral entry into host cell(GO:0046597) |
| 0.0 | 2.3 | GO:0000266 | mitochondrial fission(GO:0000266) |
| 0.0 | 0.4 | GO:0010793 | regulation of mRNA export from nucleus(GO:0010793) |
| 0.0 | 0.1 | GO:1902340 | telomeric heterochromatin assembly(GO:0031509) negative regulation of chromosome condensation(GO:1902340) |
| 0.0 | 0.2 | GO:0042270 | protection from natural killer cell mediated cytotoxicity(GO:0042270) |
| 0.0 | 0.1 | GO:1903490 | regulation of cytokinetic process(GO:0032954) regulation of mitotic cytokinetic process(GO:1903436) positive regulation of mitotic cytokinetic process(GO:1903438) positive regulation of mitotic cytokinesis(GO:1903490) |
| 0.0 | 1.8 | GO:0045600 | positive regulation of fat cell differentiation(GO:0045600) |
| 0.0 | 0.6 | GO:0032402 | melanosome transport(GO:0032402) anagen(GO:0042640) |
| 0.0 | 0.8 | GO:0034723 | DNA replication-dependent nucleosome assembly(GO:0006335) DNA replication-dependent nucleosome organization(GO:0034723) |
| 0.0 | 1.9 | GO:0061077 | chaperone-mediated protein folding(GO:0061077) |
| 0.0 | 0.4 | GO:0006465 | signal peptide processing(GO:0006465) |
| 0.0 | 0.8 | GO:0042773 | ATP synthesis coupled electron transport(GO:0042773) |
| 0.0 | 2.1 | GO:0006338 | chromatin remodeling(GO:0006338) |
Gene overrepresentation in cellular_component category:
| Log-likelihood per target | Total log-likelihood | Term | Description |
|---|---|---|---|
| 0.7 | 4.0 | GO:0031262 | Ndc80 complex(GO:0031262) |
| 0.5 | 1.4 | GO:0070557 | PCNA-p21 complex(GO:0070557) |
| 0.2 | 1.3 | GO:0045179 | apical cortex(GO:0045179) |
| 0.2 | 0.6 | GO:0042470 | melanosome(GO:0042470) pigment granule(GO:0048770) |
| 0.1 | 0.6 | GO:0033093 | multivesicular body membrane(GO:0032585) Weibel-Palade body(GO:0033093) |
| 0.1 | 1.5 | GO:0045180 | basal cortex(GO:0045180) |
| 0.1 | 0.5 | GO:0005785 | signal recognition particle receptor complex(GO:0005785) dense body(GO:0097433) |
| 0.1 | 0.3 | GO:0097361 | CIA complex(GO:0097361) |
| 0.1 | 0.6 | GO:0000176 | nuclear exosome (RNase complex)(GO:0000176) |
| 0.1 | 2.7 | GO:0005788 | endoplasmic reticulum lumen(GO:0005788) |
| 0.0 | 0.4 | GO:0005787 | signal peptidase complex(GO:0005787) |
| 0.0 | 1.0 | GO:0000788 | nuclear nucleosome(GO:0000788) |
| 0.0 | 0.1 | GO:0000120 | RNA polymerase I transcription factor complex(GO:0000120) |
| 0.0 | 0.2 | GO:0060091 | kinocilium(GO:0060091) |
| 0.0 | 3.6 | GO:0001650 | fibrillar center(GO:0001650) |
| 0.0 | 1.6 | GO:0022625 | cytosolic large ribosomal subunit(GO:0022625) |
| 0.0 | 1.6 | GO:0070469 | respiratory chain(GO:0070469) |
| 0.0 | 1.3 | GO:0031526 | brush border membrane(GO:0031526) |
| 0.0 | 4.5 | GO:0005769 | early endosome(GO:0005769) |
| 0.0 | 3.3 | GO:0005759 | mitochondrial matrix(GO:0005759) |
| 0.0 | 0.1 | GO:0005642 | annulate lamellae(GO:0005642) |
| 0.0 | 5.5 | GO:0031012 | extracellular matrix(GO:0031012) |
Gene overrepresentation in molecular_function category:
| Log-likelihood per target | Total log-likelihood | Term | Description |
|---|---|---|---|
| 0.7 | 2.8 | GO:0004966 | galanin receptor activity(GO:0004966) |
| 0.5 | 1.4 | GO:0032139 | DNA polymerase processivity factor activity(GO:0030337) dinucleotide insertion or deletion binding(GO:0032139) |
| 0.4 | 3.1 | GO:0032453 | histone demethylase activity (H3-K4 specific)(GO:0032453) |
| 0.3 | 3.6 | GO:0008430 | selenium binding(GO:0008430) |
| 0.3 | 2.5 | GO:0036122 | BMP binding(GO:0036122) |
| 0.3 | 1.3 | GO:0004301 | epoxide hydrolase activity(GO:0004301) |
| 0.2 | 0.8 | GO:0070991 | medium-chain-acyl-CoA dehydrogenase activity(GO:0070991) |
| 0.2 | 1.3 | GO:0008429 | phosphatidylethanolamine binding(GO:0008429) |
| 0.1 | 3.2 | GO:0005520 | insulin-like growth factor binding(GO:0005520) |
| 0.1 | 0.4 | GO:0004828 | serine-tRNA ligase activity(GO:0004828) |
| 0.1 | 2.2 | GO:0005528 | macrolide binding(GO:0005527) FK506 binding(GO:0005528) |
| 0.1 | 0.4 | GO:0005030 | neurotrophin receptor activity(GO:0005030) |
| 0.1 | 0.5 | GO:0015091 | signal recognition particle binding(GO:0005047) ferric iron transmembrane transporter activity(GO:0015091) trivalent inorganic cation transmembrane transporter activity(GO:0072510) |
| 0.1 | 0.4 | GO:0070330 | aromatase activity(GO:0070330) |
| 0.1 | 1.1 | GO:0070403 | NAD+ binding(GO:0070403) |
| 0.1 | 0.6 | GO:0008474 | palmitoyl-(protein) hydrolase activity(GO:0008474) palmitoyl hydrolase activity(GO:0098599) |
| 0.1 | 0.4 | GO:1990932 | 5.8S rRNA binding(GO:1990932) |
| 0.1 | 1.9 | GO:0003954 | NADH dehydrogenase activity(GO:0003954) |
| 0.1 | 2.2 | GO:0004003 | ATP-dependent DNA helicase activity(GO:0004003) |
| 0.0 | 0.2 | GO:0004090 | carbonyl reductase (NADPH) activity(GO:0004090) |
| 0.0 | 1.8 | GO:0005109 | frizzled binding(GO:0005109) |
| 0.0 | 0.2 | GO:1990430 | extracellular matrix protein binding(GO:1990430) |
| 0.0 | 2.7 | GO:0004540 | ribonuclease activity(GO:0004540) |
| 0.0 | 0.6 | GO:0031489 | myosin V binding(GO:0031489) |
| 0.0 | 0.2 | GO:0046703 | natural killer cell lectin-like receptor binding(GO:0046703) |
| 0.0 | 0.1 | GO:0051425 | PTB domain binding(GO:0051425) |
| 0.0 | 0.2 | GO:0051022 | Rho GDP-dissociation inhibitor binding(GO:0051022) |
| 0.0 | 1.0 | GO:0031492 | nucleosomal DNA binding(GO:0031492) |
| 0.0 | 0.4 | GO:0034237 | lamin binding(GO:0005521) protein kinase A regulatory subunit binding(GO:0034237) |
| 0.0 | 0.1 | GO:0004726 | non-membrane spanning protein tyrosine phosphatase activity(GO:0004726) |
| 0.0 | 0.6 | GO:0004527 | exonuclease activity(GO:0004527) |
| 0.0 | 3.6 | GO:0003924 | GTPase activity(GO:0003924) |
| 0.0 | 1.8 | GO:0003735 | structural constituent of ribosome(GO:0003735) |
Gene overrepresentation in C2:CP category:
| Log-likelihood per target | Total log-likelihood | Term | Description |
|---|---|---|---|
| 0.1 | 4.0 | PID_PLK1_PATHWAY | PLK1 signaling events |
| 0.0 | 2.5 | PID_BMP_PATHWAY | BMP receptor signaling |
| 0.0 | 1.4 | PID_BARD1_PATHWAY | BARD1 signaling events |
| 0.0 | 1.0 | PID_HNF3B_PATHWAY | FOXA2 and FOXA3 transcription factor networks |
| 0.0 | 2.5 | NABA_ECM_GLYCOPROTEINS | Genes encoding structural ECM glycoproteins |
| 0.0 | 1.8 | WNT_SIGNALING | Genes related to Wnt-mediated signal transduction |
| 0.0 | 0.2 | PID_INTEGRIN_A9B1_PATHWAY | Alpha9 beta1 integrin signaling events |
| 0.0 | 1.1 | PID_HDAC_CLASSI_PATHWAY | Signaling events mediated by HDAC Class I |
| 0.0 | 1.5 | NABA_ECM_REGULATORS | Genes encoding enzymes and their regulators involved in the remodeling of the extracellular matrix |
Gene overrepresentation in C2:CP:REACTOME category:
| Log-likelihood per target | Total log-likelihood | Term | Description |
|---|---|---|---|
| 0.1 | 1.4 | REACTOME_REMOVAL_OF_THE_FLAP_INTERMEDIATE_FROM_THE_C_STRAND | Genes involved in Removal of the Flap Intermediate from the C-strand |
| 0.1 | 0.6 | REACTOME_MRNA_DECAY_BY_3_TO_5_EXORIBONUCLEASE | Genes involved in mRNA Decay by 3' to 5' Exoribonuclease |
| 0.1 | 1.3 | REACTOME_SYNTHESIS_OF_PC | Genes involved in Synthesis of PC |
| 0.1 | 0.4 | REACTOME_ENDOGENOUS_STEROLS | Genes involved in Endogenous sterols |
| 0.0 | 0.8 | REACTOME_MITOCHONDRIAL_FATTY_ACID_BETA_OXIDATION | Genes involved in Mitochondrial Fatty Acid Beta-Oxidation |
| 0.0 | 2.1 | REACTOME_ACTIVATION_OF_CHAPERONE_GENES_BY_XBP1S | Genes involved in Activation of Chaperone Genes by XBP1(S) |
| 0.0 | 4.0 | REACTOME_MITOTIC_PROMETAPHASE | Genes involved in Mitotic Prometaphase |
| 0.0 | 2.8 | REACTOME_PEPTIDE_LIGAND_BINDING_RECEPTORS | Genes involved in Peptide ligand-binding receptors |
| 0.0 | 0.6 | REACTOME_INSULIN_SYNTHESIS_AND_PROCESSING | Genes involved in Insulin Synthesis and Processing |
| 0.0 | 0.4 | REACTOME_SYNTHESIS_SECRETION_AND_INACTIVATION_OF_GIP | Genes involved in Synthesis, Secretion, and Inactivation of Glucose-dependent Insulinotropic Polypeptide (GIP) |
| 0.0 | 0.8 | REACTOME_GLYCOSPHINGOLIPID_METABOLISM | Genes involved in Glycosphingolipid metabolism |
| 0.0 | 1.0 | REACTOME_RNA_POL_I_PROMOTER_OPENING | Genes involved in RNA Polymerase I Promoter Opening |
| 0.0 | 0.4 | REACTOME_MITOCHONDRIAL_TRNA_AMINOACYLATION | Genes involved in Mitochondrial tRNA aminoacylation |
| 0.0 | 1.6 | REACTOME_PEPTIDE_CHAIN_ELONGATION | Genes involved in Peptide chain elongation |
| 0.0 | 0.7 | REACTOME_MITOCHONDRIAL_PROTEIN_IMPORT | Genes involved in Mitochondrial Protein Import |
| 0.0 | 0.5 | REACTOME_ADHERENS_JUNCTIONS_INTERACTIONS | Genes involved in Adherens junctions interactions |
| 0.0 | 0.2 | REACTOME_SEMA3A_PLEXIN_REPULSION_SIGNALING_BY_INHIBITING_INTEGRIN_ADHESION | Genes involved in SEMA3A-Plexin repulsion signaling by inhibiting Integrin adhesion |