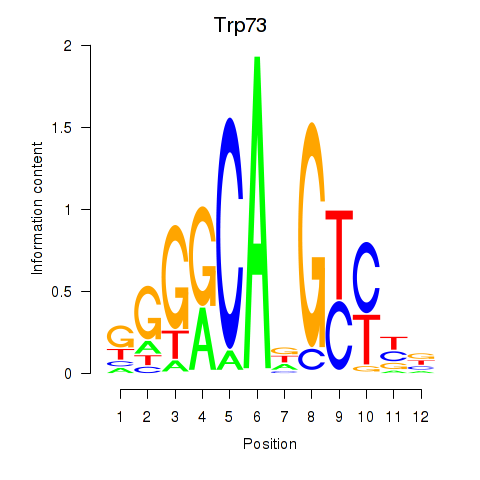
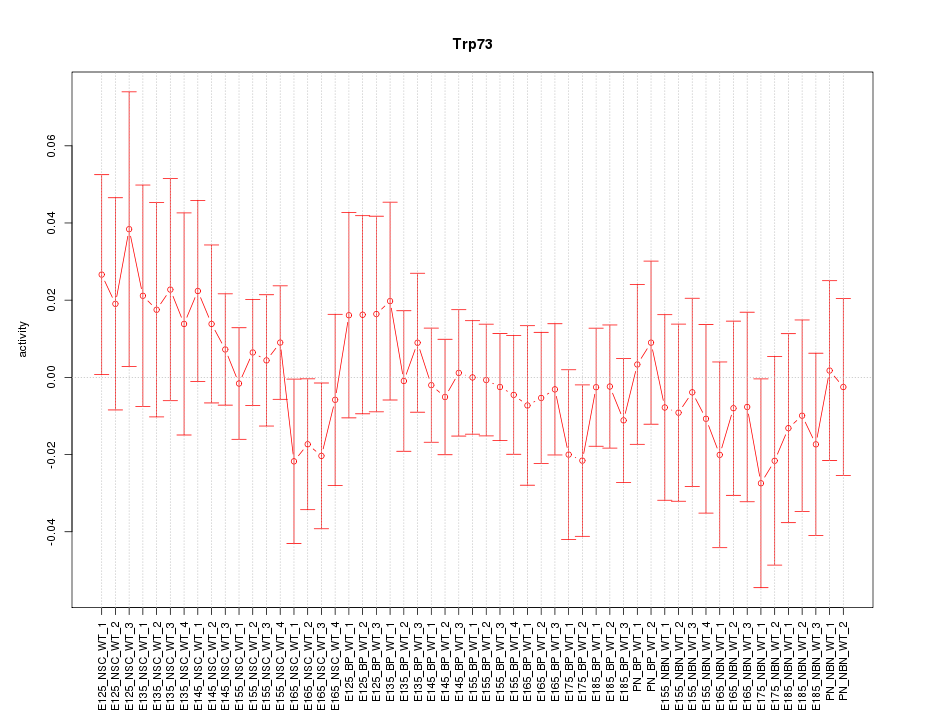
Motif ID: Trp73
Z-value: 0.596
Transcription factors associated with Trp73:
| Gene Symbol | Entrez ID | Gene Name |
|---|---|---|
| Trp73 | ENSMUSG00000029026.10 | Trp73 |
Activity-expression correlation:
| Gene Symbol | Promoter | Pearson corr. coef. | P-value | Plot |
|---|---|---|---|---|
| Trp73 | mm10_v2_chr4_-_154097105_154097173 | 0.51 | 5.9e-05 | Click! |


Top targets:
Gene overrepresentation in biological_process category:
| Log-likelihood per target | Total log-likelihood | Term | Description |
|---|---|---|---|
| 1.9 | 7.8 | GO:0060741 | prostate gland stromal morphogenesis(GO:0060741) |
| 1.0 | 2.9 | GO:0061357 | Wnt protein secretion(GO:0061355) regulation of Wnt protein secretion(GO:0061356) positive regulation of Wnt protein secretion(GO:0061357) |
| 0.9 | 7.0 | GO:0035542 | regulation of SNARE complex assembly(GO:0035542) |
| 0.8 | 3.1 | GO:0042360 | vitamin E metabolic process(GO:0042360) |
| 0.5 | 3.2 | GO:0045218 | zonula adherens maintenance(GO:0045218) |
| 0.5 | 1.4 | GO:0043456 | regulation of pentose-phosphate shunt(GO:0043456) |
| 0.5 | 5.1 | GO:2000741 | positive regulation of mesenchymal stem cell differentiation(GO:2000741) |
| 0.4 | 6.8 | GO:0045723 | positive regulation of fatty acid biosynthetic process(GO:0045723) |
| 0.4 | 3.3 | GO:0071493 | cellular response to UV-B(GO:0071493) |
| 0.4 | 1.4 | GO:0071930 | negative regulation of transcription involved in G1/S transition of mitotic cell cycle(GO:0071930) |
| 0.3 | 0.9 | GO:0021577 | hindbrain structural organization(GO:0021577) cerebellum structural organization(GO:0021589) |
| 0.3 | 4.3 | GO:0007213 | G-protein coupled acetylcholine receptor signaling pathway(GO:0007213) regulation of dopamine receptor signaling pathway(GO:0060159) |
| 0.2 | 2.3 | GO:0048742 | regulation of skeletal muscle fiber development(GO:0048742) |
| 0.2 | 3.4 | GO:0043567 | regulation of insulin-like growth factor receptor signaling pathway(GO:0043567) |
| 0.1 | 0.5 | GO:0006776 | vitamin A metabolic process(GO:0006776) |
| 0.1 | 0.5 | GO:0060316 | positive regulation of ryanodine-sensitive calcium-release channel activity(GO:0060316) |
| 0.1 | 0.5 | GO:0090365 | regulation of mRNA modification(GO:0090365) |
| 0.1 | 0.9 | GO:1902969 | mitotic DNA replication(GO:1902969) |
| 0.1 | 3.4 | GO:0045104 | intermediate filament cytoskeleton organization(GO:0045104) |
| 0.1 | 0.7 | GO:1900194 | negative regulation of oocyte development(GO:0060283) negative regulation of oocyte maturation(GO:1900194) |
| 0.1 | 1.3 | GO:0043248 | proteasome assembly(GO:0043248) |
| 0.1 | 0.8 | GO:0018195 | peptidyl-arginine modification(GO:0018195) |
| 0.1 | 0.9 | GO:1904262 | negative regulation of TORC1 signaling(GO:1904262) |
| 0.1 | 1.3 | GO:0044381 | glucose import in response to insulin stimulus(GO:0044381) |
| 0.1 | 0.2 | GO:0048289 | interleukin-4-mediated signaling pathway(GO:0035771) isotype switching to IgE isotypes(GO:0048289) regulation of isotype switching to IgE isotypes(GO:0048293) |
| 0.1 | 0.2 | GO:0002842 | positive regulation of T cell mediated immune response to tumor cell(GO:0002842) protein import into mitochondrial intermembrane space(GO:0045041) |
| 0.0 | 0.6 | GO:0090557 | establishment of endothelial intestinal barrier(GO:0090557) |
| 0.0 | 0.6 | GO:0002467 | germinal center formation(GO:0002467) |
| 0.0 | 0.3 | GO:0045900 | negative regulation of translational elongation(GO:0045900) |
| 0.0 | 0.1 | GO:0071963 | establishment or maintenance of cell polarity regulating cell shape(GO:0071963) |
| 0.0 | 0.8 | GO:0045948 | positive regulation of translational initiation(GO:0045948) |
| 0.0 | 1.0 | GO:0060445 | branching involved in salivary gland morphogenesis(GO:0060445) |
| 0.0 | 2.3 | GO:0070527 | platelet aggregation(GO:0070527) |
| 0.0 | 1.9 | GO:0006749 | glutathione metabolic process(GO:0006749) |
| 0.0 | 1.2 | GO:0042462 | eye photoreceptor cell development(GO:0042462) |
| 0.0 | 1.1 | GO:0006730 | one-carbon metabolic process(GO:0006730) |
| 0.0 | 0.3 | GO:0001675 | acrosome assembly(GO:0001675) |
| 0.0 | 0.3 | GO:0051085 | chaperone mediated protein folding requiring cofactor(GO:0051085) |
| 0.0 | 0.1 | GO:0033566 | gamma-tubulin complex localization(GO:0033566) |
| 0.0 | 0.8 | GO:0046329 | negative regulation of JNK cascade(GO:0046329) |
| 0.0 | 0.2 | GO:0043252 | sodium-independent organic anion transport(GO:0043252) |
| 0.0 | 0.1 | GO:0036120 | cellular response to platelet-derived growth factor stimulus(GO:0036120) |
| 0.0 | 0.7 | GO:0042035 | regulation of cytokine biosynthetic process(GO:0042035) |
| 0.0 | 5.4 | GO:0007186 | G-protein coupled receptor signaling pathway(GO:0007186) |
Gene overrepresentation in cellular_component category:
| Log-likelihood per target | Total log-likelihood | Term | Description |
|---|---|---|---|
| 1.1 | 3.4 | GO:0044299 | C-fiber(GO:0044299) |
| 1.1 | 3.3 | GO:0070557 | PCNA-p21 complex(GO:0070557) |
| 0.4 | 7.0 | GO:0000145 | exocyst(GO:0000145) |
| 0.3 | 0.9 | GO:0000811 | GINS complex(GO:0000811) |
| 0.3 | 3.2 | GO:0005915 | zonula adherens(GO:0005915) |
| 0.3 | 2.3 | GO:0090571 | RNA polymerase II transcription repressor complex(GO:0090571) |
| 0.1 | 1.3 | GO:0008541 | proteasome regulatory particle, lid subcomplex(GO:0008541) |
| 0.1 | 0.6 | GO:0033256 | I-kappaB/NF-kappaB complex(GO:0033256) |
| 0.1 | 3.2 | GO:0032839 | dendrite cytoplasm(GO:0032839) |
| 0.1 | 3.1 | GO:0032809 | neuronal cell body membrane(GO:0032809) |
| 0.1 | 1.3 | GO:0032593 | insulin-responsive compartment(GO:0032593) |
| 0.1 | 0.4 | GO:0035189 | Rb-E2F complex(GO:0035189) |
| 0.1 | 0.9 | GO:0034663 | endoplasmic reticulum chaperone complex(GO:0034663) |
| 0.1 | 0.9 | GO:0061700 | GATOR2 complex(GO:0061700) |
| 0.1 | 0.6 | GO:0046581 | intercellular canaliculus(GO:0046581) |
| 0.1 | 0.8 | GO:0008250 | oligosaccharyltransferase complex(GO:0008250) |
| 0.0 | 1.2 | GO:0032391 | photoreceptor connecting cilium(GO:0032391) |
| 0.0 | 0.2 | GO:0046696 | lipopolysaccharide receptor complex(GO:0046696) |
| 0.0 | 0.5 | GO:0045120 | pronucleus(GO:0045120) |
| 0.0 | 1.1 | GO:0005881 | cytoplasmic microtubule(GO:0005881) |
| 0.0 | 0.3 | GO:1990124 | messenger ribonucleoprotein complex(GO:1990124) |
| 0.0 | 0.3 | GO:0002080 | acrosomal membrane(GO:0002080) |
| 0.0 | 6.1 | GO:0005667 | transcription factor complex(GO:0005667) |
| 0.0 | 5.9 | GO:0005874 | microtubule(GO:0005874) |
| 0.0 | 3.1 | GO:0005802 | trans-Golgi network(GO:0005802) |
| 0.0 | 2.7 | GO:0043209 | myelin sheath(GO:0043209) |
| 0.0 | 2.8 | GO:0016324 | apical plasma membrane(GO:0016324) |
| 0.0 | 0.8 | GO:0017053 | transcriptional repressor complex(GO:0017053) |
| 0.0 | 3.8 | GO:0005925 | focal adhesion(GO:0005925) |
Gene overrepresentation in molecular_function category:
| Log-likelihood per target | Total log-likelihood | Term | Description |
|---|---|---|---|
| 1.1 | 3.3 | GO:0019912 | cyclin-dependent protein kinase activating kinase activity(GO:0019912) |
| 0.5 | 1.4 | GO:0046538 | bisphosphoglycerate mutase activity(GO:0004082) phosphoglycerate mutase activity(GO:0004619) 2,3-bisphosphoglycerate-dependent phosphoglycerate mutase activity(GO:0046538) |
| 0.4 | 3.4 | GO:0031995 | insulin-like growth factor II binding(GO:0031995) |
| 0.4 | 7.0 | GO:0098641 | cadherin binding involved in cell-cell adhesion(GO:0098641) |
| 0.3 | 1.3 | GO:0055056 | D-glucose transmembrane transporter activity(GO:0055056) |
| 0.3 | 2.3 | GO:0001226 | RNA polymerase II transcription corepressor binding(GO:0001226) |
| 0.3 | 2.9 | GO:0031852 | mu-type opioid receptor binding(GO:0031852) |
| 0.3 | 3.2 | GO:0070097 | delta-catenin binding(GO:0070097) |
| 0.2 | 0.5 | GO:0016501 | prostacyclin receptor activity(GO:0016501) |
| 0.2 | 1.2 | GO:0008242 | omega peptidase activity(GO:0008242) |
| 0.1 | 0.9 | GO:0070728 | leucine binding(GO:0070728) |
| 0.1 | 4.3 | GO:0001965 | G-protein alpha-subunit binding(GO:0001965) |
| 0.1 | 1.0 | GO:1990247 | N6-methyladenosine-containing RNA binding(GO:1990247) |
| 0.1 | 0.6 | GO:1990932 | 5.8S rRNA binding(GO:1990932) |
| 0.1 | 1.1 | GO:0004089 | carbonate dehydratase activity(GO:0004089) |
| 0.1 | 1.4 | GO:0008483 | transaminase activity(GO:0008483) |
| 0.1 | 0.8 | GO:0004576 | oligosaccharyl transferase activity(GO:0004576) dolichyl-diphosphooligosaccharide-protein glycotransferase activity(GO:0004579) |
| 0.1 | 0.6 | GO:0071253 | connexin binding(GO:0071253) |
| 0.1 | 0.9 | GO:0043138 | 3'-5' DNA helicase activity(GO:0043138) |
| 0.0 | 0.4 | GO:0061676 | importin-alpha family protein binding(GO:0061676) |
| 0.0 | 1.1 | GO:0051787 | misfolded protein binding(GO:0051787) |
| 0.0 | 7.8 | GO:0001085 | RNA polymerase II transcription factor binding(GO:0001085) |
| 0.0 | 1.9 | GO:0031492 | nucleosomal DNA binding(GO:0031492) |
| 0.0 | 0.7 | GO:0004708 | MAP kinase kinase activity(GO:0004708) |
| 0.0 | 5.1 | GO:0001078 | transcriptional repressor activity, RNA polymerase II core promoter proximal region sequence-specific binding(GO:0001078) |
| 0.0 | 0.3 | GO:0035925 | mRNA 3'-UTR AU-rich region binding(GO:0035925) |
| 0.0 | 0.5 | GO:0004602 | glutathione peroxidase activity(GO:0004602) |
| 0.0 | 0.7 | GO:0005070 | SH3/SH2 adaptor activity(GO:0005070) |
| 0.0 | 1.0 | GO:0030971 | receptor tyrosine kinase binding(GO:0030971) |
| 0.0 | 5.3 | GO:0008022 | protein C-terminus binding(GO:0008022) |
| 0.0 | 0.2 | GO:0030628 | pre-mRNA 3'-splice site binding(GO:0030628) |
| 0.0 | 0.2 | GO:0015347 | sodium-independent organic anion transmembrane transporter activity(GO:0015347) |
| 0.0 | 0.4 | GO:0050136 | NADH dehydrogenase (ubiquinone) activity(GO:0008137) NADH dehydrogenase (quinone) activity(GO:0050136) |
| 0.0 | 1.0 | GO:0001227 | transcriptional repressor activity, RNA polymerase II transcription regulatory region sequence-specific binding(GO:0001227) |
| 0.0 | 1.3 | GO:0004725 | protein tyrosine phosphatase activity(GO:0004725) |
Gene overrepresentation in C2:CP category:
| Log-likelihood per target | Total log-likelihood | Term | Description |
|---|---|---|---|
| 0.4 | 3.3 | SA_G2_AND_M_PHASES | Cdc25 activates the cdc2/cyclin B complex to induce the G2/M transition. |
| 0.1 | 1.3 | PID_PRL_SIGNALING_EVENTS_PATHWAY | Signaling events mediated by PRL |
| 0.1 | 3.1 | ST_G_ALPHA_I_PATHWAY | G alpha i Pathway |
| 0.1 | 2.0 | PID_EPHRINB_REV_PATHWAY | Ephrin B reverse signaling |
| 0.1 | 3.2 | PID_ECADHERIN_STABILIZATION_PATHWAY | Stabilization and expansion of the E-cadherin adherens junction |
| 0.0 | 1.3 | PID_INSULIN_GLUCOSE_PATHWAY | Insulin-mediated glucose transport |
| 0.0 | 0.7 | PID_ANTHRAX_PATHWAY | Cellular roles of Anthrax toxin |
| 0.0 | 2.3 | PID_HDAC_CLASSII_PATHWAY | Signaling events mediated by HDAC Class II |
| 0.0 | 0.7 | PID_PDGFRA_PATHWAY | PDGFR-alpha signaling pathway |
| 0.0 | 0.6 | ST_GAQ_PATHWAY | G alpha q Pathway |
| 0.0 | 0.2 | SIG_IL4RECEPTOR_IN_B_LYPHOCYTES | Genes related to IL4 rceptor signaling in B lymphocytes |
| 0.0 | 0.6 | PID_NEPHRIN_NEPH1_PATHWAY | Nephrin/Neph1 signaling in the kidney podocyte |
| 0.0 | 2.9 | NABA_ECM_GLYCOPROTEINS | Genes encoding structural ECM glycoproteins |
| 0.0 | 0.5 | PID_RXR_VDR_PATHWAY | RXR and RAR heterodimerization with other nuclear receptor |
| 0.0 | 1.4 | PID_E2F_PATHWAY | E2F transcription factor network |
| 0.0 | 0.5 | PID_TELOMERASE_PATHWAY | Regulation of Telomerase |
Gene overrepresentation in C2:CP:REACTOME category:
| Log-likelihood per target | Total log-likelihood | Term | Description |
|---|---|---|---|
| 0.2 | 3.1 | REACTOME_HDL_MEDIATED_LIPID_TRANSPORT | Genes involved in HDL-mediated lipid transport |
| 0.2 | 3.4 | REACTOME_REGULATION_OF_INSULIN_LIKE_GROWTH_FACTOR_IGF_ACTIVITY_BY_INSULIN_LIKE_GROWTH_FACTOR_BINDING_PROTEINS_IGFBPS | Genes involved in Regulation of Insulin-like Growth Factor (IGF) Activity by Insulin-like Growth Factor Binding Proteins (IGFBPs) |
| 0.1 | 3.3 | REACTOME_AKT_PHOSPHORYLATES_TARGETS_IN_THE_CYTOSOL | Genes involved in AKT phosphorylates targets in the cytosol |
| 0.1 | 1.3 | REACTOME_FACILITATIVE_NA_INDEPENDENT_GLUCOSE_TRANSPORTERS | Genes involved in Facilitative Na+-independent glucose transporters |
| 0.1 | 0.9 | REACTOME_ACTIVATION_OF_CHAPERONE_GENES_BY_ATF6_ALPHA | Genes involved in Activation of Chaperone Genes by ATF6-alpha |
| 0.1 | 0.6 | REACTOME_APOPTOTIC_CLEAVAGE_OF_CELL_ADHESION_PROTEINS | Genes involved in Apoptotic cleavage of cell adhesion proteins |
| 0.1 | 0.9 | REACTOME_UNWINDING_OF_DNA | Genes involved in Unwinding of DNA |
| 0.1 | 1.4 | REACTOME_AMINO_ACID_SYNTHESIS_AND_INTERCONVERSION_TRANSAMINATION | Genes involved in Amino acid synthesis and interconversion (transamination) |
| 0.1 | 7.5 | REACTOME_G_ALPHA_I_SIGNALLING_EVENTS | Genes involved in G alpha (i) signalling events |
| 0.0 | 0.7 | REACTOME_ACTIVATED_TAK1_MEDIATES_P38_MAPK_ACTIVATION | Genes involved in activated TAK1 mediates p38 MAPK activation |
| 0.0 | 1.4 | REACTOME_GLUCONEOGENESIS | Genes involved in Gluconeogenesis |
| 0.0 | 0.4 | REACTOME_INHIBITION_OF_REPLICATION_INITIATION_OF_DAMAGED_DNA_BY_RB1_E2F1 | Genes involved in Inhibition of replication initiation of damaged DNA by RB1/E2F1 |
| 0.0 | 0.6 | REACTOME_RIP_MEDIATED_NFKB_ACTIVATION_VIA_DAI | Genes involved in RIP-mediated NFkB activation via DAI |
| 0.0 | 2.3 | REACTOME_NOTCH1_INTRACELLULAR_DOMAIN_REGULATES_TRANSCRIPTION | Genes involved in NOTCH1 Intracellular Domain Regulates Transcription |
| 0.0 | 1.3 | REACTOME_CROSS_PRESENTATION_OF_SOLUBLE_EXOGENOUS_ANTIGENS_ENDOSOMES | Genes involved in Cross-presentation of soluble exogenous antigens (endosomes) |