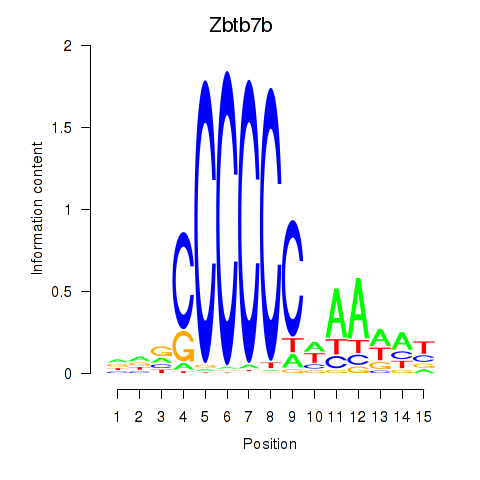
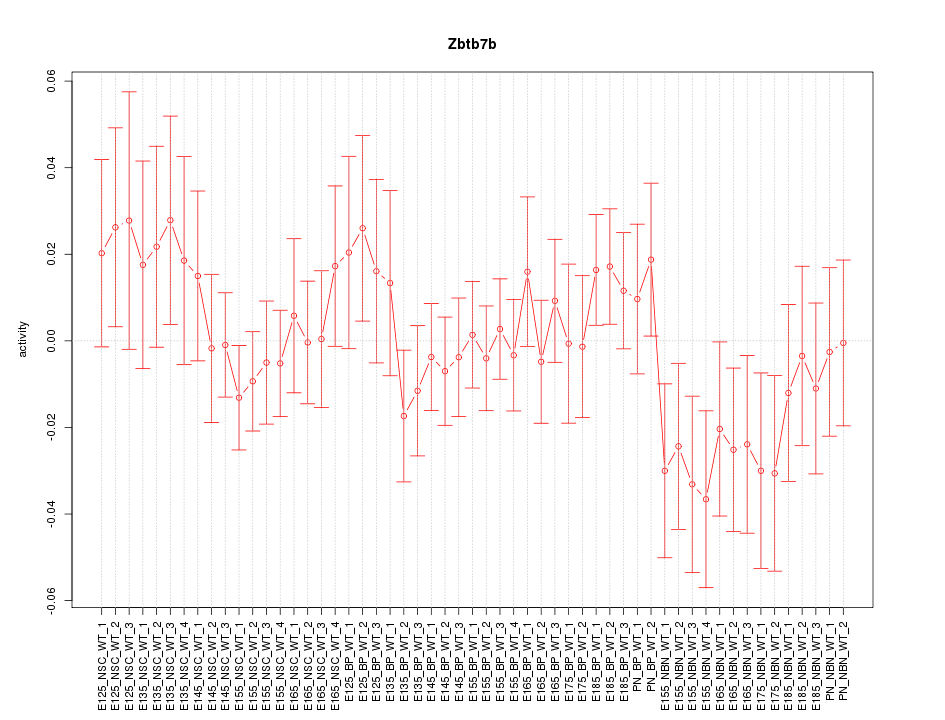
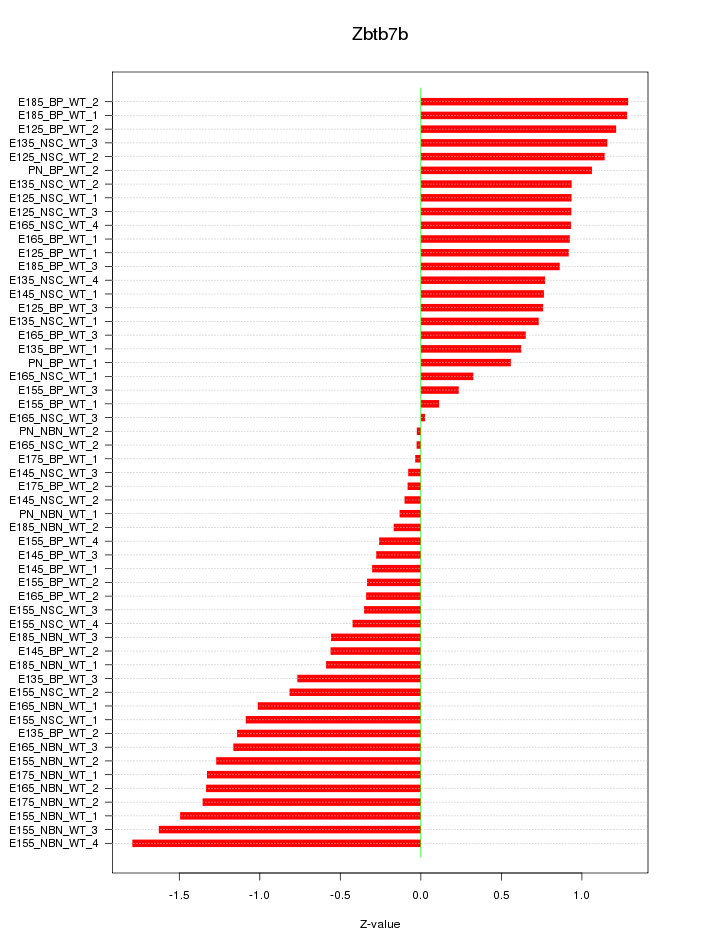
Motif ID: Zbtb7b
Z-value: 0.864
Transcription factors associated with Zbtb7b:
| Gene Symbol | Entrez ID | Gene Name |
|---|---|---|
| Zbtb7b | ENSMUSG00000028042.9 | Zbtb7b |
Activity-expression correlation:
| Gene Symbol | Promoter | Pearson corr. coef. | P-value | Plot |
|---|---|---|---|---|
| Zbtb7b | mm10_v2_chr3_-_89393294_89393378 | 0.36 | 6.4e-03 | Click! |

Top targets:
Gene overrepresentation in biological_process category:
| Log-likelihood per target | Total log-likelihood | Term | Description |
|---|---|---|---|
| 1.7 | 6.8 | GO:0060032 | notochord regression(GO:0060032) |
| 1.6 | 4.9 | GO:0097402 | neuroblast migration(GO:0097402) |
| 1.5 | 13.2 | GO:1902715 | positive regulation of interferon-gamma secretion(GO:1902715) |
| 1.3 | 5.4 | GO:0071930 | negative regulation of transcription involved in G1/S transition of mitotic cell cycle(GO:0071930) |
| 1.2 | 5.8 | GO:0021914 | negative regulation of smoothened signaling pathway involved in ventral spinal cord patterning(GO:0021914) |
| 1.0 | 3.1 | GO:0061181 | regulation of chondrocyte development(GO:0061181) |
| 1.0 | 3.0 | GO:0070476 | rRNA (guanine-N7)-methylation(GO:0070476) |
| 0.9 | 6.6 | GO:0071699 | olfactory placode formation(GO:0030910) olfactory placode development(GO:0071698) olfactory placode morphogenesis(GO:0071699) |
| 0.9 | 3.6 | GO:2000525 | regulation of T cell costimulation(GO:2000523) positive regulation of T cell costimulation(GO:2000525) |
| 0.9 | 2.6 | GO:1903644 | regulation of chaperone-mediated protein folding(GO:1903644) |
| 0.7 | 5.1 | GO:0035726 | common myeloid progenitor cell proliferation(GO:0035726) |
| 0.6 | 4.2 | GO:0043569 | negative regulation of insulin-like growth factor receptor signaling pathway(GO:0043569) |
| 0.6 | 2.8 | GO:0014022 | neural plate elongation(GO:0014022) convergent extension involved in neural plate elongation(GO:0022007) |
| 0.5 | 4.2 | GO:0048625 | myoblast fate commitment(GO:0048625) |
| 0.5 | 6.8 | GO:0055059 | asymmetric neuroblast division(GO:0055059) |
| 0.5 | 2.9 | GO:0006363 | termination of RNA polymerase I transcription(GO:0006363) |
| 0.5 | 1.8 | GO:0003357 | noradrenergic neuron differentiation(GO:0003357) |
| 0.4 | 3.4 | GO:0015074 | DNA integration(GO:0015074) |
| 0.4 | 4.2 | GO:0030388 | fructose 1,6-bisphosphate metabolic process(GO:0030388) |
| 0.4 | 2.3 | GO:2001185 | regulation of CD8-positive, alpha-beta T cell activation(GO:2001185) |
| 0.4 | 1.1 | GO:1902071 | regulation of hypoxia-inducible factor-1alpha signaling pathway(GO:1902071) |
| 0.3 | 3.3 | GO:0035873 | lactate transport(GO:0015727) lactate transmembrane transport(GO:0035873) plasma membrane lactate transport(GO:0035879) |
| 0.3 | 0.8 | GO:0021998 | neural plate mediolateral regionalization(GO:0021998) mesoderm structural organization(GO:0048338) paraxial mesoderm structural organization(GO:0048352) positive regulation of cardiac ventricle development(GO:1904414) |
| 0.3 | 4.4 | GO:0051451 | myoblast migration(GO:0051451) |
| 0.3 | 1.9 | GO:0070779 | D-aspartate transport(GO:0070777) D-aspartate import(GO:0070779) |
| 0.3 | 0.8 | GO:0035880 | embryonic nail plate morphogenesis(GO:0035880) positive regulation of catagen(GO:0051795) frontal suture morphogenesis(GO:0060364) |
| 0.2 | 0.7 | GO:0033566 | gamma-tubulin complex localization(GO:0033566) |
| 0.2 | 1.2 | GO:0006564 | L-serine biosynthetic process(GO:0006564) |
| 0.2 | 3.9 | GO:0000920 | cell separation after cytokinesis(GO:0000920) |
| 0.2 | 0.9 | GO:0046874 | quinolinate metabolic process(GO:0046874) |
| 0.2 | 2.7 | GO:0060019 | radial glial cell differentiation(GO:0060019) |
| 0.2 | 2.0 | GO:0036123 | histone H3-K9 dimethylation(GO:0036123) |
| 0.2 | 2.3 | GO:0036315 | cellular response to sterol(GO:0036315) T-helper 17 cell differentiation(GO:0072539) regulation of cholesterol homeostasis(GO:2000188) |
| 0.2 | 2.1 | GO:0006527 | arginine catabolic process(GO:0006527) |
| 0.2 | 1.1 | GO:0001980 | regulation of systemic arterial blood pressure by ischemic conditions(GO:0001980) |
| 0.2 | 1.2 | GO:0070475 | rRNA base methylation(GO:0070475) |
| 0.2 | 2.1 | GO:0060501 | positive regulation of epithelial cell proliferation involved in lung morphogenesis(GO:0060501) |
| 0.2 | 0.5 | GO:1903225 | regulation of endodermal cell fate specification(GO:0042663) negative regulation of endodermal cell differentiation(GO:1903225) |
| 0.2 | 3.3 | GO:0042711 | maternal behavior(GO:0042711) |
| 0.2 | 0.6 | GO:1903347 | negative regulation of bicellular tight junction assembly(GO:1903347) |
| 0.1 | 0.4 | GO:0035507 | regulation of myosin-light-chain-phosphatase activity(GO:0035507) |
| 0.1 | 0.9 | GO:1904217 | regulation of CDP-diacylglycerol-serine O-phosphatidyltransferase activity(GO:1904217) positive regulation of CDP-diacylglycerol-serine O-phosphatidyltransferase activity(GO:1904219) regulation of serine C-palmitoyltransferase activity(GO:1904220) positive regulation of serine C-palmitoyltransferase activity(GO:1904222) |
| 0.1 | 1.4 | GO:0060340 | positive regulation of type I interferon-mediated signaling pathway(GO:0060340) |
| 0.1 | 0.5 | GO:0006121 | mitochondrial electron transport, succinate to ubiquinone(GO:0006121) |
| 0.1 | 0.7 | GO:0043137 | DNA replication, removal of RNA primer(GO:0043137) |
| 0.1 | 3.7 | GO:0006182 | cGMP biosynthetic process(GO:0006182) |
| 0.1 | 3.0 | GO:0009954 | proximal/distal pattern formation(GO:0009954) |
| 0.1 | 5.5 | GO:0007628 | adult walking behavior(GO:0007628) |
| 0.1 | 0.5 | GO:0014886 | transition between slow and fast fiber(GO:0014886) |
| 0.1 | 0.5 | GO:0051611 | negative regulation of neurotransmitter uptake(GO:0051581) serotonin uptake(GO:0051610) regulation of serotonin uptake(GO:0051611) negative regulation of serotonin uptake(GO:0051612) |
| 0.1 | 0.6 | GO:0046541 | saliva secretion(GO:0046541) |
| 0.1 | 2.7 | GO:0032467 | positive regulation of cytokinesis(GO:0032467) |
| 0.1 | 1.5 | GO:0033622 | integrin activation(GO:0033622) |
| 0.1 | 7.0 | GO:0046785 | microtubule polymerization(GO:0046785) |
| 0.1 | 0.3 | GO:0007113 | endomitotic cell cycle(GO:0007113) |
| 0.1 | 0.7 | GO:0071578 | zinc II ion transmembrane import(GO:0071578) |
| 0.1 | 0.4 | GO:1903275 | positive regulation of sodium ion export(GO:1903275) positive regulation of sodium ion export from cell(GO:1903278) regulation of inorganic anion transmembrane transport(GO:1903795) |
| 0.1 | 0.5 | GO:0070458 | detoxification of nitrogen compound(GO:0051410) cellular detoxification of nitrogen compound(GO:0070458) |
| 0.1 | 1.4 | GO:0016339 | calcium-dependent cell-cell adhesion via plasma membrane cell adhesion molecules(GO:0016339) |
| 0.1 | 0.4 | GO:2000253 | positive regulation of feeding behavior(GO:2000253) |
| 0.1 | 13.1 | GO:0008360 | regulation of cell shape(GO:0008360) |
| 0.1 | 2.2 | GO:0009299 | mRNA transcription(GO:0009299) |
| 0.1 | 0.2 | GO:0071455 | cellular response to hyperoxia(GO:0071455) |
| 0.1 | 2.1 | GO:1901522 | positive regulation of transcription from RNA polymerase II promoter involved in cellular response to chemical stimulus(GO:1901522) |
| 0.1 | 1.4 | GO:0042474 | middle ear morphogenesis(GO:0042474) |
| 0.1 | 0.8 | GO:0000188 | inactivation of MAPK activity(GO:0000188) |
| 0.1 | 0.4 | GO:0071802 | negative regulation of podosome assembly(GO:0071802) |
| 0.1 | 3.3 | GO:0001885 | endothelial cell development(GO:0001885) |
| 0.0 | 0.2 | GO:0097494 | regulation of vesicle size(GO:0097494) |
| 0.0 | 1.6 | GO:0000038 | very long-chain fatty acid metabolic process(GO:0000038) |
| 0.0 | 2.9 | GO:0008543 | fibroblast growth factor receptor signaling pathway(GO:0008543) |
| 0.0 | 2.0 | GO:0051973 | positive regulation of telomerase activity(GO:0051973) |
| 0.0 | 4.0 | GO:0051592 | response to calcium ion(GO:0051592) |
| 0.0 | 0.8 | GO:0031065 | positive regulation of histone deacetylation(GO:0031065) |
| 0.0 | 0.2 | GO:0075525 | viral translational termination-reinitiation(GO:0075525) |
| 0.0 | 1.9 | GO:0045670 | regulation of osteoclast differentiation(GO:0045670) |
| 0.0 | 1.0 | GO:0031122 | cytoplasmic microtubule organization(GO:0031122) |
| 0.0 | 0.3 | GO:0006348 | chromatin silencing at telomere(GO:0006348) |
| 0.0 | 0.2 | GO:2000507 | positive regulation of energy homeostasis(GO:2000507) |
| 0.0 | 0.5 | GO:1900153 | regulation of nuclear-transcribed mRNA catabolic process, deadenylation-dependent decay(GO:1900151) positive regulation of nuclear-transcribed mRNA catabolic process, deadenylation-dependent decay(GO:1900153) |
| 0.0 | 0.4 | GO:0060219 | camera-type eye photoreceptor cell differentiation(GO:0060219) |
| 0.0 | 0.5 | GO:1902043 | positive regulation of extrinsic apoptotic signaling pathway via death domain receptors(GO:1902043) |
| 0.0 | 0.1 | GO:0010991 | negative regulation of SMAD protein complex assembly(GO:0010991) |
| 0.0 | 0.7 | GO:0045216 | cell-cell junction organization(GO:0045216) |
| 0.0 | 1.0 | GO:1901998 | toxin transport(GO:1901998) |
| 0.0 | 0.1 | GO:0060770 | negative regulation of epithelial cell proliferation involved in prostate gland development(GO:0060770) |
| 0.0 | 0.2 | GO:0031665 | negative regulation of lipopolysaccharide-mediated signaling pathway(GO:0031665) |
| 0.0 | 0.4 | GO:0000028 | ribosomal small subunit assembly(GO:0000028) |
| 0.0 | 2.8 | GO:0007219 | Notch signaling pathway(GO:0007219) |
| 0.0 | 0.5 | GO:0005978 | glycogen biosynthetic process(GO:0005978) glucan biosynthetic process(GO:0009250) cellular polysaccharide biosynthetic process(GO:0033692) |
| 0.0 | 0.1 | GO:0036506 | maintenance of unfolded protein(GO:0036506) tail-anchored membrane protein insertion into ER membrane(GO:0071816) maintenance of unfolded protein involved in ERAD pathway(GO:1904378) |
| 0.0 | 0.2 | GO:0060391 | positive regulation of SMAD protein import into nucleus(GO:0060391) |
| 0.0 | 1.7 | GO:0051028 | mRNA transport(GO:0051028) |
| 0.0 | 0.9 | GO:0061077 | chaperone-mediated protein folding(GO:0061077) |
| 0.0 | 0.7 | GO:0006970 | response to osmotic stress(GO:0006970) |
| 0.0 | 0.2 | GO:0048672 | bleb assembly(GO:0032060) positive regulation of collateral sprouting(GO:0048672) |
Gene overrepresentation in cellular_component category:
| Log-likelihood per target | Total log-likelihood | Term | Description |
|---|---|---|---|
| 1.1 | 5.4 | GO:0035189 | Rb-E2F complex(GO:0035189) |
| 0.8 | 7.0 | GO:0097427 | microtubule bundle(GO:0097427) |
| 0.6 | 4.4 | GO:0036195 | muscle cell projection(GO:0036194) muscle cell projection membrane(GO:0036195) |
| 0.5 | 6.8 | GO:0097542 | ciliary tip(GO:0097542) |
| 0.5 | 4.2 | GO:0070369 | beta-catenin-TCF7L2 complex(GO:0070369) |
| 0.4 | 3.9 | GO:0042587 | glycogen granule(GO:0042587) |
| 0.4 | 2.2 | GO:0005853 | eukaryotic translation elongation factor 1 complex(GO:0005853) |
| 0.3 | 4.6 | GO:0030061 | mitochondrial crista(GO:0030061) |
| 0.3 | 4.2 | GO:0035686 | sperm fibrous sheath(GO:0035686) |
| 0.3 | 1.1 | GO:1990584 | cardiac Troponin complex(GO:1990584) |
| 0.2 | 3.7 | GO:0008074 | guanylate cyclase complex, soluble(GO:0008074) |
| 0.2 | 2.9 | GO:0005736 | DNA-directed RNA polymerase I complex(GO:0005736) |
| 0.1 | 0.5 | GO:0045283 | mitochondrial respiratory chain complex II, succinate dehydrogenase complex (ubiquinone)(GO:0005749) succinate dehydrogenase complex (ubiquinone)(GO:0045257) respiratory chain complex II(GO:0045273) succinate dehydrogenase complex(GO:0045281) fumarate reductase complex(GO:0045283) |
| 0.1 | 0.7 | GO:0032299 | ribonuclease H2 complex(GO:0032299) |
| 0.1 | 0.6 | GO:0035976 | AP1 complex(GO:0035976) |
| 0.1 | 0.4 | GO:0072357 | PTW/PP1 phosphatase complex(GO:0072357) |
| 0.1 | 0.4 | GO:1990462 | omegasome(GO:1990462) |
| 0.1 | 2.8 | GO:0051233 | spindle midzone(GO:0051233) |
| 0.1 | 1.1 | GO:0031462 | Cul2-RING ubiquitin ligase complex(GO:0031462) |
| 0.1 | 4.9 | GO:0005871 | kinesin complex(GO:0005871) |
| 0.1 | 0.1 | GO:0019907 | cyclin-dependent protein kinase activating kinase holoenzyme complex(GO:0019907) |
| 0.1 | 0.8 | GO:0045095 | keratin filament(GO:0045095) |
| 0.1 | 2.1 | GO:0005788 | endoplasmic reticulum lumen(GO:0005788) |
| 0.1 | 2.5 | GO:0016235 | aggresome(GO:0016235) |
| 0.0 | 1.9 | GO:0030673 | axolemma(GO:0030673) |
| 0.0 | 6.6 | GO:0044798 | nuclear transcription factor complex(GO:0044798) |
| 0.0 | 0.1 | GO:0001405 | presequence translocase-associated import motor(GO:0001405) |
| 0.0 | 8.8 | GO:0005667 | transcription factor complex(GO:0005667) |
| 0.0 | 0.9 | GO:0034451 | centriolar satellite(GO:0034451) |
| 0.0 | 1.4 | GO:0016234 | inclusion body(GO:0016234) |
| 0.0 | 0.4 | GO:0008385 | IkappaB kinase complex(GO:0008385) |
| 0.0 | 0.7 | GO:0005839 | proteasome core complex(GO:0005839) |
| 0.0 | 0.2 | GO:0016281 | eukaryotic translation initiation factor 4F complex(GO:0016281) |
| 0.0 | 0.4 | GO:0005666 | DNA-directed RNA polymerase III complex(GO:0005666) |
| 0.0 | 0.3 | GO:0044666 | MLL3/4 complex(GO:0044666) |
| 0.0 | 1.6 | GO:0010494 | cytoplasmic stress granule(GO:0010494) |
| 0.0 | 0.2 | GO:0071541 | eukaryotic translation initiation factor 3 complex, eIF3m(GO:0071541) |
| 0.0 | 1.5 | GO:0005581 | collagen trimer(GO:0005581) |
| 0.0 | 0.2 | GO:0001891 | phagocytic cup(GO:0001891) |
| 0.0 | 0.1 | GO:0071818 | BAT3 complex(GO:0071818) ER membrane insertion complex(GO:0072379) |
| 0.0 | 2.2 | GO:0005923 | bicellular tight junction(GO:0005923) |
| 0.0 | 0.2 | GO:0032541 | cortical endoplasmic reticulum(GO:0032541) |
| 0.0 | 3.3 | GO:0030027 | lamellipodium(GO:0030027) |
| 0.0 | 0.9 | GO:0000315 | organellar large ribosomal subunit(GO:0000315) mitochondrial large ribosomal subunit(GO:0005762) |
| 0.0 | 1.3 | GO:0005901 | caveola(GO:0005901) |
| 0.0 | 0.4 | GO:0000314 | organellar small ribosomal subunit(GO:0000314) mitochondrial small ribosomal subunit(GO:0005763) |
| 0.0 | 0.1 | GO:0043203 | axon hillock(GO:0043203) |
Gene overrepresentation in molecular_function category:
| Log-likelihood per target | Total log-likelihood | Term | Description |
|---|---|---|---|
| 1.2 | 13.2 | GO:0019992 | diacylglycerol binding(GO:0019992) |
| 1.0 | 2.9 | GO:0005105 | type 1 fibroblast growth factor receptor binding(GO:0005105) |
| 0.7 | 4.2 | GO:0004332 | fructose-bisphosphate aldolase activity(GO:0004332) |
| 0.6 | 2.3 | GO:0008142 | oxysterol binding(GO:0008142) |
| 0.5 | 3.3 | GO:0015129 | lactate transmembrane transporter activity(GO:0015129) |
| 0.4 | 4.2 | GO:0004445 | inositol-polyphosphate 5-phosphatase activity(GO:0004445) inositol trisphosphate phosphatase activity(GO:0046030) |
| 0.4 | 1.2 | GO:0004647 | phosphoserine phosphatase activity(GO:0004647) |
| 0.4 | 2.0 | GO:1904047 | S-adenosyl-L-methionine binding(GO:1904047) |
| 0.4 | 1.2 | GO:0010698 | acetyltransferase activator activity(GO:0010698) |
| 0.4 | 1.1 | GO:0030172 | troponin C binding(GO:0030172) |
| 0.3 | 6.6 | GO:0035198 | miRNA binding(GO:0035198) |
| 0.3 | 2.1 | GO:0016813 | hydrolase activity, acting on carbon-nitrogen (but not peptide) bonds, in linear amidines(GO:0016813) |
| 0.3 | 1.9 | GO:0015501 | glutamate:sodium symporter activity(GO:0015501) |
| 0.2 | 1.2 | GO:0016434 | rRNA (cytosine) methyltransferase activity(GO:0016434) |
| 0.2 | 3.1 | GO:0001618 | virus receptor activity(GO:0001618) |
| 0.2 | 4.9 | GO:0001222 | transcription corepressor binding(GO:0001222) |
| 0.2 | 2.1 | GO:0004886 | 9-cis retinoic acid receptor activity(GO:0004886) |
| 0.2 | 4.2 | GO:0045295 | gamma-catenin binding(GO:0045295) |
| 0.2 | 3.7 | GO:0004383 | guanylate cyclase activity(GO:0004383) |
| 0.2 | 2.9 | GO:0001054 | RNA polymerase I activity(GO:0001054) |
| 0.2 | 3.6 | GO:0005003 | ephrin receptor activity(GO:0005003) |
| 0.2 | 6.8 | GO:1990841 | promoter-specific chromatin binding(GO:1990841) |
| 0.2 | 3.1 | GO:0070411 | I-SMAD binding(GO:0070411) |
| 0.2 | 0.6 | GO:0016286 | small conductance calcium-activated potassium channel activity(GO:0016286) |
| 0.1 | 1.6 | GO:0031957 | very long-chain fatty acid-CoA ligase activity(GO:0031957) |
| 0.1 | 0.4 | GO:0004980 | melanocortin receptor activity(GO:0004977) melanocyte-stimulating hormone receptor activity(GO:0004980) |
| 0.1 | 0.4 | GO:0008384 | IkappaB kinase activity(GO:0008384) |
| 0.1 | 0.5 | GO:0000104 | succinate dehydrogenase activity(GO:0000104) |
| 0.1 | 0.5 | GO:0001010 | transcription factor activity, sequence-specific DNA binding transcription factor recruiting(GO:0001010) |
| 0.1 | 0.8 | GO:0098821 | BMP receptor activity(GO:0098821) |
| 0.1 | 1.1 | GO:0019871 | sodium channel inhibitor activity(GO:0019871) |
| 0.1 | 0.7 | GO:0004523 | RNA-DNA hybrid ribonuclease activity(GO:0004523) |
| 0.1 | 2.2 | GO:0003746 | translation elongation factor activity(GO:0003746) |
| 0.1 | 0.7 | GO:0008329 | signaling pattern recognition receptor activity(GO:0008329) pattern recognition receptor activity(GO:0038187) |
| 0.1 | 2.8 | GO:0005109 | frizzled binding(GO:0005109) |
| 0.1 | 0.9 | GO:0022889 | L-serine transmembrane transporter activity(GO:0015194) serine transmembrane transporter activity(GO:0022889) |
| 0.1 | 1.4 | GO:0070628 | proteasome binding(GO:0070628) |
| 0.1 | 4.9 | GO:0003777 | microtubule motor activity(GO:0003777) |
| 0.1 | 1.6 | GO:0008028 | monocarboxylic acid transmembrane transporter activity(GO:0008028) |
| 0.1 | 0.4 | GO:0070181 | small ribosomal subunit rRNA binding(GO:0070181) |
| 0.0 | 3.3 | GO:0008276 | protein methyltransferase activity(GO:0008276) |
| 0.0 | 11.0 | GO:0008017 | microtubule binding(GO:0008017) |
| 0.0 | 1.4 | GO:0071837 | HMG box domain binding(GO:0071837) |
| 0.0 | 6.5 | GO:0001085 | RNA polymerase II transcription factor binding(GO:0001085) |
| 0.0 | 4.2 | GO:0015631 | tubulin binding(GO:0015631) |
| 0.0 | 0.2 | GO:0035614 | snRNA stem-loop binding(GO:0035614) |
| 0.0 | 16.8 | GO:0000978 | RNA polymerase II core promoter proximal region sequence-specific DNA binding(GO:0000978) |
| 0.0 | 4.9 | GO:0001047 | core promoter binding(GO:0001047) |
| 0.0 | 3.5 | GO:0019208 | phosphatase regulator activity(GO:0019208) |
| 0.0 | 0.9 | GO:0042805 | actinin binding(GO:0042805) |
| 0.0 | 2.8 | GO:0000981 | RNA polymerase II transcription factor activity, sequence-specific DNA binding(GO:0000981) |
| 0.0 | 0.7 | GO:0004298 | threonine-type endopeptidase activity(GO:0004298) threonine-type peptidase activity(GO:0070003) |
| 0.0 | 0.2 | GO:0001223 | transcription coactivator binding(GO:0001223) |
| 0.0 | 2.0 | GO:0000975 | regulatory region DNA binding(GO:0000975) transcription regulatory region DNA binding(GO:0044212) |
| 0.0 | 1.4 | GO:0003690 | double-stranded DNA binding(GO:0003690) |
| 0.0 | 2.1 | GO:0004540 | ribonuclease activity(GO:0004540) |
| 0.0 | 0.8 | GO:0051879 | Hsp90 protein binding(GO:0051879) |
| 0.0 | 0.7 | GO:0005385 | zinc ion transmembrane transporter activity(GO:0005385) |
| 0.0 | 3.3 | GO:0001228 | transcriptional activator activity, RNA polymerase II transcription regulatory region sequence-specific binding(GO:0001228) |
| 0.0 | 0.3 | GO:0008641 | small protein activating enzyme activity(GO:0008641) |
| 0.0 | 0.2 | GO:0070915 | lysophosphatidic acid receptor activity(GO:0070915) |
| 0.0 | 8.5 | GO:0043565 | sequence-specific DNA binding(GO:0043565) |
| 0.0 | 0.2 | GO:0008190 | eukaryotic initiation factor 4E binding(GO:0008190) |
| 0.0 | 0.5 | GO:1900750 | glutathione binding(GO:0043295) oligopeptide binding(GO:1900750) |
| 0.0 | 0.1 | GO:0070412 | R-SMAD binding(GO:0070412) |
| 0.0 | 0.1 | GO:0000774 | adenyl-nucleotide exchange factor activity(GO:0000774) |
| 0.0 | 0.4 | GO:0003899 | DNA-directed RNA polymerase activity(GO:0003899) RNA polymerase activity(GO:0034062) |
| 0.0 | 0.1 | GO:0005127 | ciliary neurotrophic factor receptor binding(GO:0005127) |
| 0.0 | 0.4 | GO:0017080 | sodium channel regulator activity(GO:0017080) |
| 0.0 | 3.2 | GO:0003924 | GTPase activity(GO:0003924) |
| 0.0 | 0.8 | GO:0008080 | N-acetyltransferase activity(GO:0008080) |
Gene overrepresentation in C2:CP category:
| Log-likelihood per target | Total log-likelihood | Term | Description |
|---|---|---|---|
| 0.4 | 5.4 | SA_REG_CASCADE_OF_CYCLIN_EXPR | Expression of cyclins regulates progression through the cell cycle by activating cyclin-dependent kinases. |
| 0.3 | 13.2 | PID_RAS_PATHWAY | Regulation of Ras family activation |
| 0.2 | 4.2 | PID_EPHA2_FWD_PATHWAY | EPHA2 forward signaling |
| 0.2 | 6.8 | PID_HEDGEHOG_2PATHWAY | Signaling events mediated by the Hedgehog family |
| 0.2 | 13.3 | PID_CASPASE_PATHWAY | Caspase cascade in apoptosis |
| 0.2 | 5.9 | PID_BETA_CATENIN_DEG_PATHWAY | Degradation of beta catenin |
| 0.1 | 3.6 | PID_EPHRINB_REV_PATHWAY | Ephrin B reverse signaling |
| 0.1 | 4.9 | PID_AURORA_B_PATHWAY | Aurora B signaling |
| 0.1 | 3.9 | PID_MAPK_TRK_PATHWAY | Trk receptor signaling mediated by the MAPK pathway |
| 0.1 | 3.0 | PID_P38_ALPHA_BETA_PATHWAY | Regulation of p38-alpha and p38-beta |
| 0.1 | 4.8 | PID_AP1_PATHWAY | AP-1 transcription factor network |
| 0.1 | 5.9 | PID_HIF1_TFPATHWAY | HIF-1-alpha transcription factor network |
| 0.1 | 4.7 | PID_E2F_PATHWAY | E2F transcription factor network |
| 0.1 | 2.9 | PID_FGF_PATHWAY | FGF signaling pathway |
| 0.0 | 2.3 | PID_AR_TF_PATHWAY | Regulation of Androgen receptor activity |
| 0.0 | 1.5 | NABA_COLLAGENS | Genes encoding collagen proteins |
| 0.0 | 0.3 | PID_ERB_GENOMIC_PATHWAY | Validated nuclear estrogen receptor beta network |
| 0.0 | 0.4 | PID_NFKAPPAB_ATYPICAL_PATHWAY | Atypical NF-kappaB pathway |
| 0.0 | 1.5 | PID_RAC1_REG_PATHWAY | Regulation of RAC1 activity |
| 0.0 | 0.8 | PID_BMP_PATHWAY | BMP receptor signaling |
| 0.0 | 2.2 | NABA_ECM_AFFILIATED | Genes encoding proteins affiliated structurally or functionally to extracellular matrix proteins |
| 0.0 | 0.4 | PID_RHOA_PATHWAY | RhoA signaling pathway |
Gene overrepresentation in C2:CP:REACTOME category:
| Log-likelihood per target | Total log-likelihood | Term | Description |
|---|---|---|---|
| 0.7 | 8.1 | REACTOME_CDC6_ASSOCIATION_WITH_THE_ORC_ORIGIN_COMPLEX | Genes involved in CDC6 association with the ORC:origin complex |
| 0.6 | 13.1 | REACTOME_CASPASE_MEDIATED_CLEAVAGE_OF_CYTOSKELETAL_PROTEINS | Genes involved in Caspase-mediated cleavage of cytoskeletal proteins |
| 0.4 | 3.3 | REACTOME_BILE_SALT_AND_ORGANIC_ANION_SLC_TRANSPORTERS | Genes involved in Bile salt and organic anion SLC transporters |
| 0.4 | 12.0 | REACTOME_RAP1_SIGNALLING | Genes involved in Rap1 signalling |
| 0.4 | 2.9 | REACTOME_FGFR4_LIGAND_BINDING_AND_ACTIVATION | Genes involved in FGFR4 ligand binding and activation |
| 0.2 | 3.9 | REACTOME_SIGNALLING_TO_P38_VIA_RIT_AND_RIN | Genes involved in Signalling to p38 via RIT and RIN |
| 0.2 | 6.8 | REACTOME_YAP1_AND_WWTR1_TAZ_STIMULATED_GENE_EXPRESSION | Genes involved in YAP1- and WWTR1 (TAZ)-stimulated gene expression |
| 0.2 | 4.9 | REACTOME_KINESINS | Genes involved in Kinesins |
| 0.2 | 2.3 | REACTOME_CIRCADIAN_REPRESSION_OF_EXPRESSION_BY_REV_ERBA | Genes involved in Circadian Repression of Expression by REV-ERBA |
| 0.1 | 4.2 | REACTOME_IL_RECEPTOR_SHC_SIGNALING | Genes involved in Interleukin receptor SHC signaling |
| 0.1 | 4.2 | REACTOME_GLUCONEOGENESIS | Genes involved in Gluconeogenesis |
| 0.1 | 2.8 | REACTOME_SIGNALING_BY_HIPPO | Genes involved in Signaling by Hippo |
| 0.1 | 3.4 | REACTOME_TIGHT_JUNCTION_INTERACTIONS | Genes involved in Tight junction interactions |
| 0.1 | 2.0 | REACTOME_REGULATION_OF_BETA_CELL_DEVELOPMENT | Genes involved in Regulation of beta-cell development |
| 0.0 | 1.1 | REACTOME_STRIATED_MUSCLE_CONTRACTION | Genes involved in Striated Muscle Contraction |
| 0.0 | 0.7 | REACTOME_ZINC_TRANSPORTERS | Genes involved in Zinc transporters |
| 0.0 | 0.4 | REACTOME_IKK_COMPLEX_RECRUITMENT_MEDIATED_BY_RIP1 | Genes involved in IKK complex recruitment mediated by RIP1 |
| 0.0 | 1.9 | REACTOME_AMINO_ACID_AND_OLIGOPEPTIDE_SLC_TRANSPORTERS | Genes involved in Amino acid and oligopeptide SLC transporters |
| 0.0 | 0.8 | REACTOME_SIGNALING_BY_BMP | Genes involved in Signaling by BMP |
| 0.0 | 0.2 | REACTOME_ELEVATION_OF_CYTOSOLIC_CA2_LEVELS | Genes involved in Elevation of cytosolic Ca2+ levels |
| 0.0 | 1.5 | REACTOME_COLLAGEN_FORMATION | Genes involved in Collagen formation |
| 0.0 | 0.2 | REACTOME_EXTRINSIC_PATHWAY_FOR_APOPTOSIS | Genes involved in Extrinsic Pathway for Apoptosis |
| 0.0 | 0.5 | REACTOME_CITRIC_ACID_CYCLE_TCA_CYCLE | Genes involved in Citric acid cycle (TCA cycle) |
| 0.0 | 0.4 | REACTOME_RNA_POL_III_CHAIN_ELONGATION | Genes involved in RNA Polymerase III Chain Elongation |
| 0.0 | 0.2 | REACTOME_MTORC1_MEDIATED_SIGNALLING | Genes involved in mTORC1-mediated signalling |
| 0.0 | 0.9 | REACTOME_METABOLISM_OF_VITAMINS_AND_COFACTORS | Genes involved in Metabolism of vitamins and cofactors |
| 0.0 | 2.4 | REACTOME_TRANSLATION | Genes involved in Translation |
| 0.0 | 0.7 | REACTOME_CDK_MEDIATED_PHOSPHORYLATION_AND_REMOVAL_OF_CDC6 | Genes involved in CDK-mediated phosphorylation and removal of Cdc6 |
| 0.0 | 0.2 | REACTOME_METABOLISM_OF_POLYAMINES | Genes involved in Metabolism of polyamines |
| 0.0 | 0.7 | REACTOME_LOSS_OF_NLP_FROM_MITOTIC_CENTROSOMES | Genes involved in Loss of Nlp from mitotic centrosomes |