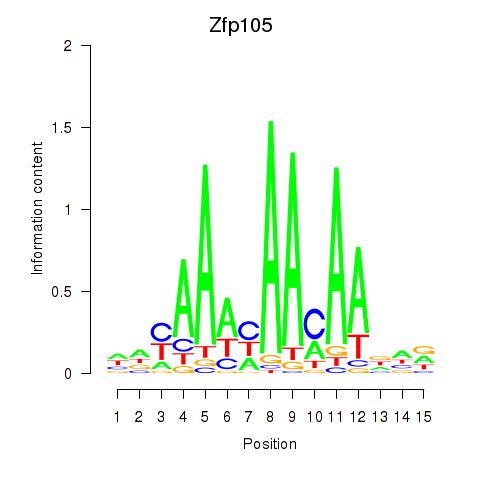
Motif ID: Zfp105
Z-value: 0.508

Transcription factors associated with Zfp105:
| Gene Symbol | Entrez ID | Gene Name |
|---|---|---|
| Zfp105 | ENSMUSG00000057895.5 | Zfp105 |
Activity-expression correlation:
| Gene Symbol | Promoter | Pearson corr. coef. | P-value | Plot |
|---|---|---|---|---|
| Zfp105 | mm10_v2_chr9_+_122923050_122923099 | 0.57 | 4.7e-06 | Click! |
Top targets:
Gene overrepresentation in biological_process category:
| Log-likelihood per target | Total log-likelihood | Term | Description |
|---|---|---|---|
| 1.0 | 3.0 | GO:0090425 | hepatocyte cell migration(GO:0002194) branching involved in pancreas morphogenesis(GO:0061114) acinar cell differentiation(GO:0090425) positive regulation of forebrain neuron differentiation(GO:2000979) |
| 1.0 | 6.7 | GO:0060666 | dichotomous subdivision of terminal units involved in salivary gland branching(GO:0060666) |
| 0.7 | 2.2 | GO:0030421 | defecation(GO:0030421) |
| 0.4 | 4.3 | GO:0042572 | retinol metabolic process(GO:0042572) |
| 0.2 | 2.0 | GO:1901386 | negative regulation of voltage-gated calcium channel activity(GO:1901386) |
| 0.2 | 1.0 | GO:0070460 | thyroid-stimulating hormone secretion(GO:0070460) |
| 0.2 | 0.5 | GO:0003349 | epicardium-derived cardiac endothelial cell differentiation(GO:0003349) |
| 0.2 | 0.8 | GO:0046864 | retinol transport(GO:0034633) isoprenoid transport(GO:0046864) terpenoid transport(GO:0046865) alveolar primary septum development(GO:0061143) |
| 0.1 | 1.9 | GO:0071481 | cellular response to X-ray(GO:0071481) |
| 0.1 | 0.7 | GO:0010637 | negative regulation of mitochondrial fusion(GO:0010637) |
| 0.1 | 0.4 | GO:2000054 | regulation of chondrocyte development(GO:0061181) negative regulation of Wnt signaling pathway involved in dorsal/ventral axis specification(GO:2000054) |
| 0.1 | 1.3 | GO:0042118 | endothelial cell activation(GO:0042118) |
| 0.1 | 0.9 | GO:0002903 | negative regulation of B cell apoptotic process(GO:0002903) |
| 0.1 | 0.8 | GO:0021684 | cerebellar granular layer formation(GO:0021684) cerebellar granule cell differentiation(GO:0021707) |
| 0.0 | 0.1 | GO:1904578 | response to thapsigargin(GO:1904578) cellular response to thapsigargin(GO:1904579) |
| 0.0 | 0.5 | GO:0006120 | mitochondrial electron transport, NADH to ubiquinone(GO:0006120) |
| 0.0 | 0.2 | GO:0030206 | chondroitin sulfate biosynthetic process(GO:0030206) |
| 0.0 | 1.0 | GO:0007566 | embryo implantation(GO:0007566) |
Gene overrepresentation in cellular_component category:
| Log-likelihood per target | Total log-likelihood | Term | Description |
|---|---|---|---|
| 0.5 | 1.9 | GO:0097129 | cyclin D2-CDK4 complex(GO:0097129) |
| 0.3 | 1.8 | GO:0097443 | sorting endosome(GO:0097443) |
| 0.1 | 2.0 | GO:0051233 | spindle midzone(GO:0051233) |
| 0.0 | 0.2 | GO:0032580 | Golgi cisterna membrane(GO:0032580) |
| 0.0 | 0.1 | GO:0046696 | lipopolysaccharide receptor complex(GO:0046696) |
| 0.0 | 0.5 | GO:0090544 | BAF-type complex(GO:0090544) |
Gene overrepresentation in molecular_function category:
| Log-likelihood per target | Total log-likelihood | Term | Description |
|---|---|---|---|
| 0.6 | 4.3 | GO:0052650 | NADP-retinol dehydrogenase activity(GO:0052650) |
| 0.4 | 4.9 | GO:0038191 | neuropilin binding(GO:0038191) |
| 0.4 | 1.8 | GO:0038085 | vascular endothelial growth factor binding(GO:0038085) |
| 0.3 | 1.3 | GO:0001011 | transcription factor activity, sequence-specific DNA binding, RNA polymerase recruiting(GO:0001011) transcription factor activity, TFIIB-class binding(GO:0001087) |
| 0.2 | 3.0 | GO:0050693 | LBD domain binding(GO:0050693) |
| 0.1 | 0.2 | GO:0050510 | N-acetylgalactosaminyl-proteoglycan 3-beta-glucuronosyltransferase activity(GO:0050510) |
| 0.0 | 2.0 | GO:0019003 | GDP binding(GO:0019003) |
| 0.0 | 0.1 | GO:0001165 | RNA polymerase I upstream control element sequence-specific DNA binding(GO:0001165) |
| 0.0 | 0.8 | GO:0051183 | vitamin transporter activity(GO:0051183) |
| 0.0 | 0.9 | GO:0071889 | 14-3-3 protein binding(GO:0071889) |
| 0.0 | 2.2 | GO:0008083 | growth factor activity(GO:0008083) |
| 0.0 | 0.5 | GO:0050136 | NADH dehydrogenase (ubiquinone) activity(GO:0008137) NADH dehydrogenase (quinone) activity(GO:0050136) |
Gene overrepresentation in C2:CP category:
| Log-likelihood per target | Total log-likelihood | Term | Description |
|---|---|---|---|
| 0.1 | 1.8 | PID_VEGF_VEGFR_PATHWAY | VEGF and VEGFR signaling network |
| 0.1 | 2.2 | PID_SYNDECAN_4_PATHWAY | Syndecan-4-mediated signaling events |
| 0.1 | 4.3 | PID_TAP63_PATHWAY | Validated transcriptional targets of TAp63 isoforms |
| 0.0 | 4.9 | NABA_ECM_AFFILIATED | Genes encoding proteins affiliated structurally or functionally to extracellular matrix proteins |
| 0.0 | 1.9 | PID_IL2_STAT5_PATHWAY | IL2 signaling events mediated by STAT5 |
| 0.0 | 0.9 | PID_EPO_PATHWAY | EPO signaling pathway |
| 0.0 | 1.7 | PID_BETA_CATENIN_NUC_PATHWAY | Regulation of nuclear beta catenin signaling and target gene transcription |
Gene overrepresentation in C2:CP:REACTOME category:
| Log-likelihood per target | Total log-likelihood | Term | Description |
|---|---|---|---|
| 0.2 | 3.6 | REACTOME_SEMA3A_PLEXIN_REPULSION_SIGNALING_BY_INHIBITING_INTEGRIN_ADHESION | Genes involved in SEMA3A-Plexin repulsion signaling by inhibiting Integrin adhesion |
| 0.1 | 1.0 | REACTOME_AMINE_DERIVED_HORMONES | Genes involved in Amine-derived hormones |
| 0.0 | 0.9 | REACTOME_SIGNAL_ATTENUATION | Genes involved in Signal attenuation |
| 0.0 | 1.9 | REACTOME_G1_PHASE | Genes involved in G1 Phase |
| 0.0 | 1.3 | REACTOME_MYOGENESIS | Genes involved in Myogenesis |
| 0.0 | 0.2 | REACTOME_CHONDROITIN_SULFATE_BIOSYNTHESIS | Genes involved in Chondroitin sulfate biosynthesis |


