| 6.8 |
20.5 |
GO:1904274 |
tricellular tight junction assembly(GO:1904274) |
| 4.7 |
23.4 |
GO:0015671 |
oxygen transport(GO:0015671) |
| 3.8 |
18.8 |
GO:0046864 |
retinol transport(GO:0034633) isoprenoid transport(GO:0046864) terpenoid transport(GO:0046865) alveolar primary septum development(GO:0061143) |
| 3.6 |
7.2 |
GO:0060129 |
thyroid-stimulating hormone-secreting cell differentiation(GO:0060129) |
| 3.1 |
9.2 |
GO:0072138 |
mesenchymal cell proliferation involved in ureteric bud development(GO:0072138) |
| 3.0 |
11.8 |
GO:0046061 |
dATP catabolic process(GO:0046061) |
| 2.9 |
11.8 |
GO:0002339 |
B cell selection(GO:0002339) |
| 2.9 |
20.3 |
GO:0061304 |
retinal blood vessel morphogenesis(GO:0061304) |
| 2.7 |
13.5 |
GO:0015705 |
iodide transport(GO:0015705) |
| 2.6 |
10.3 |
GO:0048819 |
regulation of hair follicle maturation(GO:0048819) regulation of catagen(GO:0051794) |
| 2.3 |
7.0 |
GO:0060598 |
dichotomous subdivision of terminal units involved in mammary gland duct morphogenesis(GO:0060598) |
| 2.3 |
6.8 |
GO:0006001 |
fructose catabolic process(GO:0006001) fructose catabolic process to hydroxyacetone phosphate and glyceraldehyde-3-phosphate(GO:0061624) glycolytic process through fructose-1-phosphate(GO:0061625) |
| 2.1 |
6.2 |
GO:0000087 |
mitotic M phase(GO:0000087) |
| 2.0 |
6.1 |
GO:0010725 |
regulation of primitive erythrocyte differentiation(GO:0010725) |
| 1.9 |
1.9 |
GO:1900020 |
regulation of protein kinase C activity(GO:1900019) positive regulation of protein kinase C activity(GO:1900020) |
| 1.9 |
5.6 |
GO:0038203 |
TORC2 signaling(GO:0038203) |
| 1.9 |
5.6 |
GO:0060821 |
inactivation of X chromosome by DNA methylation(GO:0060821) |
| 1.8 |
7.1 |
GO:2000525 |
regulation of T cell costimulation(GO:2000523) positive regulation of T cell costimulation(GO:2000525) |
| 1.7 |
6.9 |
GO:0042414 |
epinephrine metabolic process(GO:0042414) |
| 1.7 |
5.1 |
GO:2000256 |
positive regulation of male germ cell proliferation(GO:2000256) |
| 1.7 |
6.7 |
GO:0048682 |
axon extension involved in regeneration(GO:0048677) sprouting of injured axon(GO:0048682) |
| 1.7 |
3.3 |
GO:0038091 |
VEGF-activated platelet-derived growth factor receptor signaling pathway(GO:0038086) positive regulation of cell proliferation by VEGF-activated platelet derived growth factor receptor signaling pathway(GO:0038091) |
| 1.6 |
6.5 |
GO:0042905 |
9-cis-retinoic acid biosynthetic process(GO:0042904) 9-cis-retinoic acid metabolic process(GO:0042905) |
| 1.6 |
4.9 |
GO:0015772 |
disaccharide transport(GO:0015766) sucrose transport(GO:0015770) oligosaccharide transport(GO:0015772) |
| 1.6 |
9.5 |
GO:0003433 |
chondrocyte development involved in endochondral bone morphogenesis(GO:0003433) |
| 1.5 |
6.2 |
GO:0001787 |
natural killer cell proliferation(GO:0001787) |
| 1.5 |
6.2 |
GO:0097211 |
response to gonadotropin-releasing hormone(GO:0097210) cellular response to gonadotropin-releasing hormone(GO:0097211) |
| 1.5 |
4.6 |
GO:0046121 |
deoxyribonucleoside catabolic process(GO:0046121) |
| 1.5 |
6.1 |
GO:0007223 |
Wnt signaling pathway, calcium modulating pathway(GO:0007223) |
| 1.5 |
4.6 |
GO:0033634 |
positive regulation of cell-cell adhesion mediated by integrin(GO:0033634) |
| 1.5 |
4.5 |
GO:0021759 |
globus pallidus development(GO:0021759) |
| 1.5 |
3.0 |
GO:0014016 |
neuroblast differentiation(GO:0014016) |
| 1.5 |
8.8 |
GO:0021797 |
forebrain anterior/posterior pattern specification(GO:0021797) |
| 1.5 |
10.3 |
GO:0042590 |
antigen processing and presentation of exogenous peptide antigen via MHC class I(GO:0042590) |
| 1.5 |
4.4 |
GO:2000393 |
negative regulation of lamellipodium morphogenesis(GO:2000393) |
| 1.5 |
4.4 |
GO:0060437 |
lung growth(GO:0060437) |
| 1.5 |
5.8 |
GO:0006842 |
tricarboxylic acid transport(GO:0006842) succinate transport(GO:0015744) citrate transport(GO:0015746) |
| 1.4 |
5.8 |
GO:0061626 |
pharyngeal arch artery morphogenesis(GO:0061626) |
| 1.4 |
4.2 |
GO:0061537 |
glycine secretion(GO:0061536) glycine secretion, neurotransmission(GO:0061537) |
| 1.4 |
8.3 |
GO:0072513 |
positive regulation of secondary heart field cardioblast proliferation(GO:0072513) |
| 1.4 |
4.1 |
GO:0016095 |
polyprenol catabolic process(GO:0016095) |
| 1.4 |
5.5 |
GO:0071449 |
cellular response to lipid hydroperoxide(GO:0071449) |
| 1.4 |
4.1 |
GO:0019676 |
ammonia assimilation cycle(GO:0019676) |
| 1.3 |
5.3 |
GO:1903416 |
response to glycoside(GO:1903416) |
| 1.3 |
4.0 |
GO:1903232 |
melanosome assembly(GO:1903232) |
| 1.3 |
5.3 |
GO:0002337 |
B-1a B cell differentiation(GO:0002337) |
| 1.3 |
3.9 |
GO:0044778 |
meiotic DNA integrity checkpoint(GO:0044778) |
| 1.3 |
2.6 |
GO:2000157 |
regulation of protein K48-linked deubiquitination(GO:1903093) negative regulation of protein K48-linked deubiquitination(GO:1903094) negative regulation of ubiquitin-specific protease activity(GO:2000157) |
| 1.3 |
2.6 |
GO:0061074 |
regulation of neural retina development(GO:0061074) |
| 1.3 |
3.9 |
GO:0044413 |
evasion or tolerance of host defenses by virus(GO:0019049) transforming growth factor beta3 production(GO:0032907) regulation of transforming growth factor beta3 production(GO:0032910) positive regulation of transforming growth factor beta3 production(GO:0032916) avoidance of host defenses(GO:0044413) evasion or tolerance of host defenses(GO:0044415) avoidance of defenses of other organism involved in symbiotic interaction(GO:0051832) evasion or tolerance of defenses of other organism involved in symbiotic interaction(GO:0051834) activation of cysteine-type endopeptidase activity involved in apoptotic signaling pathway(GO:0097296) |
| 1.3 |
3.8 |
GO:0061642 |
chemoattraction of axon(GO:0061642) |
| 1.3 |
1.3 |
GO:0070162 |
adiponectin secretion(GO:0070162) regulation of adiponectin secretion(GO:0070163) negative regulation of adiponectin secretion(GO:0070164) |
| 1.2 |
3.7 |
GO:0010989 |
negative regulation of low-density lipoprotein particle clearance(GO:0010989) |
| 1.2 |
3.7 |
GO:0042822 |
vitamin B6 metabolic process(GO:0042816) pyridoxal phosphate metabolic process(GO:0042822) pyridoxal phosphate biosynthetic process(GO:0042823) |
| 1.2 |
3.7 |
GO:0060754 |
positive regulation of mast cell chemotaxis(GO:0060754) |
| 1.2 |
3.6 |
GO:1904457 |
positive regulation of neuronal action potential(GO:1904457) |
| 1.2 |
3.6 |
GO:2000562 |
negative regulation of CD4-positive, alpha-beta T cell proliferation(GO:2000562) |
| 1.2 |
3.5 |
GO:0035696 |
monocyte extravasation(GO:0035696) regulation of monocyte extravasation(GO:2000437) |
| 1.2 |
4.6 |
GO:0060032 |
notochord regression(GO:0060032) |
| 1.2 |
3.5 |
GO:0036118 |
hyaluranon cable assembly(GO:0036118) regulation of hyaluranon cable assembly(GO:1900104) positive regulation of hyaluranon cable assembly(GO:1900106) |
| 1.1 |
3.4 |
GO:0002408 |
myeloid dendritic cell chemotaxis(GO:0002408) |
| 1.1 |
5.5 |
GO:1903553 |
positive regulation of extracellular exosome assembly(GO:1903553) |
| 1.1 |
3.3 |
GO:0035878 |
nail development(GO:0035878) |
| 1.1 |
3.3 |
GO:0072139 |
glomerular parietal epithelial cell differentiation(GO:0072139) |
| 1.1 |
3.3 |
GO:0035633 |
maintenance of blood-brain barrier(GO:0035633) |
| 1.1 |
2.2 |
GO:0010273 |
detoxification of copper ion(GO:0010273) stress response to copper ion(GO:1990169) |
| 1.1 |
3.2 |
GO:0032877 |
positive regulation of DNA endoreduplication(GO:0032877) |
| 1.1 |
4.3 |
GO:0070829 |
heterochromatin maintenance(GO:0070829) |
| 1.1 |
8.5 |
GO:2001198 |
regulation of dendritic cell differentiation(GO:2001198) |
| 1.1 |
2.1 |
GO:0060166 |
olfactory pit development(GO:0060166) |
| 1.1 |
4.2 |
GO:0032914 |
positive regulation of transforming growth factor beta1 production(GO:0032914) |
| 1.0 |
3.1 |
GO:0009446 |
putrescine biosynthetic process(GO:0009446) |
| 1.0 |
5.2 |
GO:1903012 |
positive regulation of bone development(GO:1903012) |
| 1.0 |
6.2 |
GO:0003065 |
positive regulation of heart rate by epinephrine(GO:0003065) |
| 1.0 |
5.2 |
GO:0072488 |
ammonium transmembrane transport(GO:0072488) |
| 1.0 |
3.1 |
GO:1903048 |
regulation of acetylcholine-gated cation channel activity(GO:1903048) |
| 1.0 |
2.1 |
GO:1904058 |
positive regulation of sensory perception of pain(GO:1904058) |
| 1.0 |
4.1 |
GO:1904565 |
response to 1-oleoyl-sn-glycerol 3-phosphate(GO:1904565) cellular response to 1-oleoyl-sn-glycerol 3-phosphate(GO:1904566) |
| 1.0 |
5.1 |
GO:0006447 |
regulation of translational initiation by iron(GO:0006447) positive regulation of translational initiation by iron(GO:0045994) |
| 1.0 |
4.0 |
GO:0060762 |
regulation of branching involved in mammary gland duct morphogenesis(GO:0060762) |
| 1.0 |
5.0 |
GO:0010835 |
regulation of protein ADP-ribosylation(GO:0010835) |
| 1.0 |
2.0 |
GO:0046391 |
5-phosphoribose 1-diphosphate biosynthetic process(GO:0006015) 5-phosphoribose 1-diphosphate metabolic process(GO:0046391) |
| 1.0 |
5.0 |
GO:0045918 |
negative regulation of cytolysis(GO:0045918) |
| 1.0 |
3.0 |
GO:0003094 |
glomerular filtration(GO:0003094) |
| 1.0 |
3.0 |
GO:1901097 |
negative regulation of autophagosome maturation(GO:1901097) |
| 1.0 |
2.0 |
GO:1900426 |
positive regulation of defense response to bacterium(GO:1900426) |
| 1.0 |
4.9 |
GO:2000483 |
negative regulation of interleukin-8 secretion(GO:2000483) |
| 1.0 |
2.9 |
GO:0072429 |
response to cell cycle checkpoint signaling(GO:0072396) response to DNA integrity checkpoint signaling(GO:0072402) response to DNA damage checkpoint signaling(GO:0072423) response to intra-S DNA damage checkpoint signaling(GO:0072429) |
| 1.0 |
4.8 |
GO:0032237 |
activation of store-operated calcium channel activity(GO:0032237) |
| 1.0 |
4.8 |
GO:0034372 |
very-low-density lipoprotein particle remodeling(GO:0034372) |
| 0.9 |
2.8 |
GO:0035582 |
sequestering of BMP in extracellular matrix(GO:0035582) |
| 0.9 |
0.9 |
GO:0045650 |
negative regulation of macrophage differentiation(GO:0045650) |
| 0.9 |
8.5 |
GO:1902715 |
positive regulation of interferon-gamma secretion(GO:1902715) |
| 0.9 |
1.8 |
GO:0010046 |
response to mycotoxin(GO:0010046) |
| 0.9 |
5.5 |
GO:0035428 |
hexose transmembrane transport(GO:0035428) |
| 0.9 |
2.8 |
GO:0030300 |
regulation of intestinal cholesterol absorption(GO:0030300) |
| 0.9 |
1.8 |
GO:2000224 |
testosterone biosynthetic process(GO:0061370) regulation of testosterone biosynthetic process(GO:2000224) |
| 0.9 |
2.7 |
GO:0018298 |
protein-chromophore linkage(GO:0018298) |
| 0.9 |
2.7 |
GO:0007354 |
zygotic determination of anterior/posterior axis, embryo(GO:0007354) |
| 0.9 |
1.8 |
GO:0035814 |
negative regulation of renal sodium excretion(GO:0035814) |
| 0.9 |
4.5 |
GO:0006167 |
AMP biosynthetic process(GO:0006167) |
| 0.9 |
0.9 |
GO:1903244 |
regulation of cardiac muscle adaptation(GO:0010612) positive regulation of cardiac muscle adaptation(GO:0010615) regulation of cardiac muscle hypertrophy in response to stress(GO:1903242) positive regulation of cardiac muscle hypertrophy in response to stress(GO:1903244) |
| 0.9 |
8.0 |
GO:0061436 |
establishment of skin barrier(GO:0061436) |
| 0.9 |
2.6 |
GO:1902037 |
negative regulation of hematopoietic stem cell differentiation(GO:1902037) |
| 0.9 |
4.3 |
GO:0003420 |
regulation of growth plate cartilage chondrocyte proliferation(GO:0003420) |
| 0.9 |
3.4 |
GO:0014846 |
esophagus smooth muscle contraction(GO:0014846) |
| 0.9 |
2.6 |
GO:1903225 |
negative regulation of endodermal cell differentiation(GO:1903225) |
| 0.8 |
7.6 |
GO:0032286 |
central nervous system myelin maintenance(GO:0032286) |
| 0.8 |
3.4 |
GO:0032439 |
endosome localization(GO:0032439) |
| 0.8 |
9.2 |
GO:0006000 |
fructose metabolic process(GO:0006000) |
| 0.8 |
5.8 |
GO:0032782 |
bile acid secretion(GO:0032782) |
| 0.8 |
2.5 |
GO:0060672 |
epithelial cell differentiation involved in embryonic placenta development(GO:0060671) epithelial cell morphogenesis involved in placental branching(GO:0060672) |
| 0.8 |
4.9 |
GO:2000491 |
positive regulation of hepatic stellate cell activation(GO:2000491) |
| 0.8 |
2.5 |
GO:0015920 |
regulation of phosphatidylcholine catabolic process(GO:0010899) lipopolysaccharide transport(GO:0015920) |
| 0.8 |
1.6 |
GO:0060158 |
phospholipase C-activating dopamine receptor signaling pathway(GO:0060158) |
| 0.8 |
4.9 |
GO:0043137 |
DNA replication, removal of RNA primer(GO:0043137) |
| 0.8 |
0.8 |
GO:0070166 |
tooth mineralization(GO:0034505) enamel mineralization(GO:0070166) |
| 0.8 |
4.1 |
GO:0031536 |
positive regulation of exit from mitosis(GO:0031536) |
| 0.8 |
4.9 |
GO:0098838 |
reduced folate transmembrane transport(GO:0098838) |
| 0.8 |
3.2 |
GO:0050862 |
positive regulation of T cell receptor signaling pathway(GO:0050862) |
| 0.8 |
2.4 |
GO:1904879 |
positive regulation of calcium ion transmembrane transport via high voltage-gated calcium channel(GO:1904879) |
| 0.8 |
4.0 |
GO:0010359 |
regulation of anion channel activity(GO:0010359) |
| 0.8 |
3.9 |
GO:0038018 |
Wnt receptor catabolic process(GO:0038018) |
| 0.8 |
5.5 |
GO:0018158 |
protein oxidation(GO:0018158) |
| 0.8 |
2.3 |
GO:0060217 |
hemangioblast cell differentiation(GO:0060217) |
| 0.8 |
1.5 |
GO:1902956 |
regulation of mitochondrial electron transport, NADH to ubiquinone(GO:1902956) |
| 0.8 |
1.5 |
GO:0036166 |
phenotypic switching(GO:0036166) |
| 0.8 |
2.3 |
GO:0045915 |
positive regulation of catecholamine metabolic process(GO:0045915) positive regulation of dopamine metabolic process(GO:0045964) |
| 0.8 |
4.6 |
GO:0001980 |
regulation of systemic arterial blood pressure by ischemic conditions(GO:0001980) |
| 0.8 |
3.8 |
GO:0002523 |
leukocyte migration involved in inflammatory response(GO:0002523) |
| 0.8 |
0.8 |
GO:0034370 |
triglyceride-rich lipoprotein particle remodeling(GO:0034370) |
| 0.8 |
3.8 |
GO:0061181 |
regulation of chondrocyte development(GO:0061181) |
| 0.7 |
3.7 |
GO:1903361 |
protein localization to basolateral plasma membrane(GO:1903361) |
| 0.7 |
6.0 |
GO:0030174 |
regulation of DNA-dependent DNA replication initiation(GO:0030174) |
| 0.7 |
2.2 |
GO:0035989 |
tendon development(GO:0035989) |
| 0.7 |
2.2 |
GO:1990034 |
calcium ion export from cell(GO:1990034) |
| 0.7 |
16.1 |
GO:0010569 |
regulation of double-strand break repair via homologous recombination(GO:0010569) |
| 0.7 |
2.2 |
GO:0003245 |
cardiac muscle tissue growth involved in heart morphogenesis(GO:0003245) |
| 0.7 |
2.9 |
GO:0033580 |
protein glycosylation at cell surface(GO:0033575) protein galactosylation at cell surface(GO:0033580) protein galactosylation(GO:0042125) |
| 0.7 |
5.1 |
GO:0021913 |
regulation of transcription from RNA polymerase II promoter involved in spinal cord motor neuron fate specification(GO:0021912) regulation of transcription from RNA polymerase II promoter involved in ventral spinal cord interneuron specification(GO:0021913) |
| 0.7 |
5.8 |
GO:0021521 |
ventral spinal cord interneuron specification(GO:0021521) cell fate specification involved in pattern specification(GO:0060573) |
| 0.7 |
2.2 |
GO:0030167 |
proteoglycan catabolic process(GO:0030167) positive regulation of hair follicle development(GO:0051798) |
| 0.7 |
3.6 |
GO:0070327 |
thyroid hormone transport(GO:0070327) |
| 0.7 |
2.2 |
GO:0048597 |
post-embryonic camera-type eye morphogenesis(GO:0048597) |
| 0.7 |
2.8 |
GO:0042360 |
vitamin E metabolic process(GO:0042360) |
| 0.7 |
2.1 |
GO:0007161 |
calcium-independent cell-matrix adhesion(GO:0007161) |
| 0.7 |
2.8 |
GO:2000504 |
positive regulation of blood vessel remodeling(GO:2000504) |
| 0.7 |
1.4 |
GO:0090324 |
negative regulation of oxidative phosphorylation(GO:0090324) |
| 0.7 |
2.1 |
GO:0010814 |
substance P catabolic process(GO:0010814) calcitonin catabolic process(GO:0010816) endothelin maturation(GO:0034959) |
| 0.7 |
2.8 |
GO:0032901 |
positive regulation of neurotrophin production(GO:0032901) |
| 0.7 |
6.9 |
GO:1903975 |
regulation of glial cell migration(GO:1903975) |
| 0.7 |
5.5 |
GO:0032463 |
negative regulation of protein homooligomerization(GO:0032463) |
| 0.7 |
2.7 |
GO:0010694 |
positive regulation of alkaline phosphatase activity(GO:0010694) |
| 0.7 |
3.4 |
GO:0021984 |
adenohypophysis development(GO:0021984) |
| 0.7 |
1.3 |
GO:0098751 |
bone cell development(GO:0098751) |
| 0.7 |
3.4 |
GO:1990928 |
response to amino acid starvation(GO:1990928) |
| 0.7 |
1.3 |
GO:0060591 |
chondroblast differentiation(GO:0060591) |
| 0.7 |
2.0 |
GO:0038145 |
macrophage colony-stimulating factor signaling pathway(GO:0038145) |
| 0.7 |
2.0 |
GO:1901552 |
positive regulation of endothelial cell development(GO:1901552) positive regulation of establishment of endothelial barrier(GO:1903142) |
| 0.6 |
0.6 |
GO:0033632 |
regulation of cell-cell adhesion mediated by integrin(GO:0033632) |
| 0.6 |
1.9 |
GO:0033566 |
gamma-tubulin complex localization(GO:0033566) |
| 0.6 |
3.2 |
GO:0019249 |
lactate biosynthetic process from pyruvate(GO:0019244) lactate biosynthetic process(GO:0019249) |
| 0.6 |
1.9 |
GO:2000620 |
positive regulation of histone H4-K16 acetylation(GO:2000620) |
| 0.6 |
1.3 |
GO:1904431 |
pyrimidine dimer repair by nucleotide-excision repair(GO:0000720) positive regulation of t-circle formation(GO:1904431) |
| 0.6 |
0.6 |
GO:0045472 |
response to ether(GO:0045472) |
| 0.6 |
2.5 |
GO:0010593 |
negative regulation of lamellipodium assembly(GO:0010593) negative regulation of lamellipodium organization(GO:1902744) |
| 0.6 |
5.6 |
GO:0006071 |
glycerol metabolic process(GO:0006071) |
| 0.6 |
1.9 |
GO:2000192 |
negative regulation of fatty acid transport(GO:2000192) |
| 0.6 |
0.6 |
GO:0010571 |
positive regulation of nuclear cell cycle DNA replication(GO:0010571) |
| 0.6 |
1.2 |
GO:0072061 |
inner medullary collecting duct development(GO:0072061) |
| 0.6 |
1.2 |
GO:0002295 |
T-helper cell lineage commitment(GO:0002295) CD4-positive, alpha-beta T cell lineage commitment(GO:0043373) |
| 0.6 |
2.4 |
GO:0072675 |
osteoclast fusion(GO:0072675) |
| 0.6 |
4.9 |
GO:0006004 |
fucose metabolic process(GO:0006004) |
| 0.6 |
3.0 |
GO:0046654 |
tetrahydrofolate biosynthetic process(GO:0046654) |
| 0.6 |
3.6 |
GO:0046688 |
response to copper ion(GO:0046688) |
| 0.6 |
3.0 |
GO:0042758 |
long-chain fatty acid catabolic process(GO:0042758) |
| 0.6 |
1.2 |
GO:0002314 |
germinal center B cell differentiation(GO:0002314) |
| 0.6 |
3.0 |
GO:2000343 |
positive regulation of chemokine (C-X-C motif) ligand 2 production(GO:2000343) |
| 0.6 |
2.4 |
GO:0017183 |
peptidyl-diphthamide metabolic process(GO:0017182) peptidyl-diphthamide biosynthetic process from peptidyl-histidine(GO:0017183) |
| 0.6 |
2.3 |
GO:0006549 |
isoleucine metabolic process(GO:0006549) |
| 0.6 |
10.0 |
GO:2000353 |
positive regulation of endothelial cell apoptotic process(GO:2000353) |
| 0.6 |
0.6 |
GO:0032829 |
regulation of CD4-positive, CD25-positive, alpha-beta regulatory T cell differentiation(GO:0032829) |
| 0.6 |
2.3 |
GO:0030576 |
Cajal body organization(GO:0030576) |
| 0.6 |
8.6 |
GO:0048387 |
negative regulation of retinoic acid receptor signaling pathway(GO:0048387) |
| 0.6 |
1.7 |
GO:0045578 |
negative regulation of B cell differentiation(GO:0045578) |
| 0.6 |
2.8 |
GO:0007386 |
compartment pattern specification(GO:0007386) |
| 0.6 |
5.6 |
GO:0001977 |
renal system process involved in regulation of blood volume(GO:0001977) |
| 0.6 |
2.2 |
GO:0030049 |
muscle filament sliding(GO:0030049) |
| 0.6 |
3.3 |
GO:1904707 |
positive regulation of vascular smooth muscle cell proliferation(GO:1904707) |
| 0.6 |
1.1 |
GO:0033239 |
negative regulation of cellular amine metabolic process(GO:0033239) |
| 0.5 |
1.6 |
GO:0003341 |
cilium movement(GO:0003341) |
| 0.5 |
3.3 |
GO:0007406 |
negative regulation of neuroblast proliferation(GO:0007406) |
| 0.5 |
1.6 |
GO:0014005 |
microglia differentiation(GO:0014004) microglia development(GO:0014005) |
| 0.5 |
5.5 |
GO:0006977 |
DNA damage response, signal transduction by p53 class mediator resulting in cell cycle arrest(GO:0006977) |
| 0.5 |
1.1 |
GO:0035106 |
operant conditioning(GO:0035106) |
| 0.5 |
4.9 |
GO:0030206 |
chondroitin sulfate biosynthetic process(GO:0030206) |
| 0.5 |
12.0 |
GO:0046685 |
response to arsenic-containing substance(GO:0046685) |
| 0.5 |
0.5 |
GO:0060681 |
branch elongation involved in ureteric bud branching(GO:0060681) |
| 0.5 |
4.9 |
GO:0006104 |
succinyl-CoA metabolic process(GO:0006104) |
| 0.5 |
3.2 |
GO:0042866 |
pyruvate biosynthetic process(GO:0042866) |
| 0.5 |
2.7 |
GO:0070934 |
CRD-mediated mRNA stabilization(GO:0070934) |
| 0.5 |
1.6 |
GO:1903984 |
regulation of TRAIL-activated apoptotic signaling pathway(GO:1903121) positive regulation of TRAIL-activated apoptotic signaling pathway(GO:1903984) |
| 0.5 |
1.1 |
GO:0070255 |
regulation of mucus secretion(GO:0070255) |
| 0.5 |
1.6 |
GO:0060334 |
regulation of interferon-gamma-mediated signaling pathway(GO:0060334) |
| 0.5 |
5.3 |
GO:0003417 |
growth plate cartilage development(GO:0003417) |
| 0.5 |
2.1 |
GO:0051599 |
response to hydrostatic pressure(GO:0051599) |
| 0.5 |
4.7 |
GO:0046784 |
viral mRNA export from host cell nucleus(GO:0046784) |
| 0.5 |
2.6 |
GO:0045743 |
positive regulation of fibroblast growth factor receptor signaling pathway(GO:0045743) |
| 0.5 |
3.1 |
GO:0060768 |
regulation of epithelial cell proliferation involved in prostate gland development(GO:0060768) negative regulation of epithelial cell proliferation involved in prostate gland development(GO:0060770) |
| 0.5 |
10.4 |
GO:0042744 |
hydrogen peroxide catabolic process(GO:0042744) |
| 0.5 |
5.2 |
GO:0006560 |
proline metabolic process(GO:0006560) |
| 0.5 |
1.6 |
GO:0070889 |
platelet alpha granule organization(GO:0070889) |
| 0.5 |
1.0 |
GO:0051971 |
positive regulation of transmission of nerve impulse(GO:0051971) |
| 0.5 |
2.1 |
GO:0008635 |
activation of cysteine-type endopeptidase activity involved in apoptotic process by cytochrome c(GO:0008635) |
| 0.5 |
2.6 |
GO:0045198 |
establishment of epithelial cell apical/basal polarity(GO:0045198) |
| 0.5 |
1.0 |
GO:0006610 |
ribosomal protein import into nucleus(GO:0006610) |
| 0.5 |
0.5 |
GO:0071316 |
cellular response to nicotine(GO:0071316) |
| 0.5 |
1.5 |
GO:2000686 |
regulation of rubidium ion transmembrane transporter activity(GO:2000686) |
| 0.5 |
2.5 |
GO:0032472 |
Golgi calcium ion transport(GO:0032472) |
| 0.5 |
2.5 |
GO:0045163 |
clustering of voltage-gated potassium channels(GO:0045163) |
| 0.5 |
11.8 |
GO:0035116 |
embryonic hindlimb morphogenesis(GO:0035116) |
| 0.5 |
2.0 |
GO:0000733 |
DNA strand renaturation(GO:0000733) |
| 0.5 |
2.4 |
GO:0046826 |
negative regulation of protein export from nucleus(GO:0046826) |
| 0.5 |
1.9 |
GO:0046836 |
glycolipid transport(GO:0046836) |
| 0.5 |
1.4 |
GO:0000389 |
mRNA 3'-splice site recognition(GO:0000389) |
| 0.5 |
2.9 |
GO:0003383 |
apical constriction(GO:0003383) |
| 0.5 |
2.4 |
GO:0001842 |
neural fold formation(GO:0001842) |
| 0.5 |
2.9 |
GO:0007253 |
cytoplasmic sequestering of NF-kappaB(GO:0007253) |
| 0.5 |
0.5 |
GO:0050847 |
progesterone receptor signaling pathway(GO:0050847) |
| 0.5 |
1.0 |
GO:0015675 |
nickel cation transport(GO:0015675) |
| 0.5 |
0.5 |
GO:0003376 |
sphingosine-1-phosphate signaling pathway(GO:0003376) sphingolipid mediated signaling pathway(GO:0090520) |
| 0.5 |
1.4 |
GO:0042535 |
positive regulation of tumor necrosis factor biosynthetic process(GO:0042535) |
| 0.5 |
4.3 |
GO:0031274 |
positive regulation of pseudopodium assembly(GO:0031274) |
| 0.5 |
1.9 |
GO:0035624 |
receptor transactivation(GO:0035624) epidermal growth factor-activated receptor transactivation by G-protein coupled receptor signaling pathway(GO:0035625) |
| 0.5 |
0.9 |
GO:1902262 |
apoptotic process involved in patterning of blood vessels(GO:1902262) |
| 0.5 |
2.8 |
GO:0032929 |
negative regulation of superoxide anion generation(GO:0032929) |
| 0.5 |
4.1 |
GO:0042135 |
neurotransmitter catabolic process(GO:0042135) |
| 0.5 |
0.5 |
GO:0051902 |
negative regulation of mitochondrial depolarization(GO:0051902) negative regulation of membrane depolarization(GO:1904180) |
| 0.5 |
1.4 |
GO:0071649 |
regulation of chemokine (C-C motif) ligand 5 production(GO:0071649) |
| 0.5 |
4.1 |
GO:0044336 |
canonical Wnt signaling pathway involved in negative regulation of apoptotic process(GO:0044336) |
| 0.5 |
3.6 |
GO:1904948 |
midbrain dopaminergic neuron differentiation(GO:1904948) |
| 0.5 |
0.5 |
GO:0044333 |
Wnt signaling pathway involved in digestive tract morphogenesis(GO:0044333) regulation of planar cell polarity pathway involved in axis elongation(GO:2000040) negative regulation of planar cell polarity pathway involved in axis elongation(GO:2000041) |
| 0.5 |
2.3 |
GO:0090666 |
telomere assembly(GO:0032202) scaRNA localization to Cajal body(GO:0090666) |
| 0.4 |
1.8 |
GO:0090309 |
positive regulation of methylation-dependent chromatin silencing(GO:0090309) |
| 0.4 |
5.4 |
GO:0051451 |
myoblast migration(GO:0051451) |
| 0.4 |
3.1 |
GO:0042538 |
hyperosmotic salinity response(GO:0042538) |
| 0.4 |
0.4 |
GO:0060528 |
secretory columnal luminar epithelial cell differentiation involved in prostate glandular acinus development(GO:0060528) |
| 0.4 |
1.8 |
GO:0035752 |
lysosomal lumen pH elevation(GO:0035752) |
| 0.4 |
2.6 |
GO:0046060 |
dATP metabolic process(GO:0046060) |
| 0.4 |
0.9 |
GO:0006558 |
L-phenylalanine metabolic process(GO:0006558) erythrose 4-phosphate/phosphoenolpyruvate family amino acid metabolic process(GO:1902221) |
| 0.4 |
0.4 |
GO:0000454 |
snoRNA guided rRNA pseudouridine synthesis(GO:0000454) |
| 0.4 |
8.2 |
GO:0046597 |
negative regulation of viral entry into host cell(GO:0046597) |
| 0.4 |
1.7 |
GO:0098915 |
membrane repolarization during ventricular cardiac muscle cell action potential(GO:0098915) |
| 0.4 |
9.9 |
GO:0070208 |
protein heterotrimerization(GO:0070208) |
| 0.4 |
1.7 |
GO:1903251 |
multi-ciliated epithelial cell differentiation(GO:1903251) |
| 0.4 |
6.4 |
GO:0090136 |
epithelial cell-cell adhesion(GO:0090136) |
| 0.4 |
0.4 |
GO:0060295 |
regulation of cilium movement(GO:0003352) regulation of cilium beat frequency(GO:0003356) regulation of cilium movement involved in cell motility(GO:0060295) regulation of cilium beat frequency involved in ciliary motility(GO:0060296) regulation of cilium-dependent cell motility(GO:1902019) |
| 0.4 |
1.3 |
GO:2001286 |
regulation of caveolin-mediated endocytosis(GO:2001286) |
| 0.4 |
2.1 |
GO:0061073 |
ciliary body morphogenesis(GO:0061073) |
| 0.4 |
1.7 |
GO:0036265 |
RNA (guanine-N7)-methylation(GO:0036265) |
| 0.4 |
2.5 |
GO:1901029 |
negative regulation of mitochondrial outer membrane permeabilization involved in apoptotic signaling pathway(GO:1901029) |
| 0.4 |
2.1 |
GO:0050747 |
positive regulation of lipoprotein metabolic process(GO:0050747) |
| 0.4 |
2.5 |
GO:0016576 |
histone dephosphorylation(GO:0016576) |
| 0.4 |
2.9 |
GO:0022417 |
protein maturation by protein folding(GO:0022417) |
| 0.4 |
4.5 |
GO:0061179 |
negative regulation of insulin secretion involved in cellular response to glucose stimulus(GO:0061179) |
| 0.4 |
0.8 |
GO:0050859 |
negative regulation of B cell receptor signaling pathway(GO:0050859) |
| 0.4 |
4.1 |
GO:0097067 |
cellular response to thyroid hormone stimulus(GO:0097067) |
| 0.4 |
0.8 |
GO:0014873 |
response to muscle activity involved in regulation of muscle adaptation(GO:0014873) |
| 0.4 |
0.8 |
GO:0050434 |
positive regulation of viral transcription(GO:0050434) |
| 0.4 |
1.2 |
GO:0014835 |
myoblast differentiation involved in skeletal muscle regeneration(GO:0014835) |
| 0.4 |
1.2 |
GO:0018199 |
peptidyl-glutamine modification(GO:0018199) |
| 0.4 |
0.8 |
GO:0070103 |
regulation of interleukin-6-mediated signaling pathway(GO:0070103) negative regulation of interleukin-6-mediated signaling pathway(GO:0070104) |
| 0.4 |
2.8 |
GO:0098535 |
de novo centriole assembly(GO:0098535) |
| 0.4 |
0.4 |
GO:0006702 |
androgen biosynthetic process(GO:0006702) |
| 0.4 |
2.0 |
GO:0090272 |
negative regulation of fibroblast growth factor production(GO:0090272) |
| 0.4 |
2.4 |
GO:0010747 |
positive regulation of plasma membrane long-chain fatty acid transport(GO:0010747) |
| 0.4 |
1.2 |
GO:1904154 |
positive regulation of retrograde protein transport, ER to cytosol(GO:1904154) |
| 0.4 |
1.6 |
GO:0050812 |
regulation of acetyl-CoA biosynthetic process from pyruvate(GO:0010510) regulation of acyl-CoA biosynthetic process(GO:0050812) |
| 0.4 |
1.2 |
GO:0046533 |
regulation of photoreceptor cell differentiation(GO:0046532) negative regulation of photoreceptor cell differentiation(GO:0046533) |
| 0.4 |
1.2 |
GO:0019043 |
establishment of viral latency(GO:0019043) |
| 0.4 |
4.0 |
GO:0032060 |
bleb assembly(GO:0032060) |
| 0.4 |
1.2 |
GO:0002710 |
negative regulation of T cell mediated immunity(GO:0002710) |
| 0.4 |
0.8 |
GO:0006083 |
acetate metabolic process(GO:0006083) |
| 0.4 |
2.0 |
GO:0034080 |
CENP-A containing nucleosome assembly(GO:0034080) CENP-A containing chromatin organization(GO:0061641) |
| 0.4 |
3.1 |
GO:1900262 |
regulation of DNA-directed DNA polymerase activity(GO:1900262) positive regulation of DNA-directed DNA polymerase activity(GO:1900264) |
| 0.4 |
1.6 |
GO:1900017 |
positive regulation of cytokine production involved in inflammatory response(GO:1900017) |
| 0.4 |
4.7 |
GO:0035563 |
positive regulation of chromatin binding(GO:0035563) |
| 0.4 |
3.1 |
GO:0048096 |
chromatin-mediated maintenance of transcription(GO:0048096) |
| 0.4 |
0.8 |
GO:1903961 |
positive regulation of anion transmembrane transport(GO:1903961) |
| 0.4 |
1.9 |
GO:0070474 |
uterine smooth muscle contraction(GO:0070471) regulation of uterine smooth muscle contraction(GO:0070472) positive regulation of uterine smooth muscle contraction(GO:0070474) |
| 0.4 |
1.5 |
GO:0046469 |
platelet activating factor biosynthetic process(GO:0006663) platelet activating factor metabolic process(GO:0046469) |
| 0.4 |
0.4 |
GO:1901386 |
negative regulation of voltage-gated calcium channel activity(GO:1901386) |
| 0.4 |
2.7 |
GO:0042573 |
retinoic acid metabolic process(GO:0042573) |
| 0.4 |
3.8 |
GO:0070574 |
cadmium ion transport(GO:0015691) cadmium ion transmembrane transport(GO:0070574) |
| 0.4 |
0.4 |
GO:0034382 |
chylomicron remnant clearance(GO:0034382) triglyceride-rich lipoprotein particle clearance(GO:0071830) |
| 0.4 |
1.5 |
GO:2001168 |
regulation of histone H2B ubiquitination(GO:2001166) positive regulation of histone H2B ubiquitination(GO:2001168) |
| 0.4 |
1.5 |
GO:0010940 |
positive regulation of necrotic cell death(GO:0010940) |
| 0.4 |
3.7 |
GO:0090308 |
regulation of methylation-dependent chromatin silencing(GO:0090308) |
| 0.4 |
1.1 |
GO:0071699 |
olfactory placode formation(GO:0030910) olfactory placode development(GO:0071698) olfactory placode morphogenesis(GO:0071699) |
| 0.4 |
1.8 |
GO:0030091 |
protein repair(GO:0030091) |
| 0.4 |
1.8 |
GO:0006123 |
mitochondrial electron transport, cytochrome c to oxygen(GO:0006123) |
| 0.4 |
3.6 |
GO:0055070 |
copper ion homeostasis(GO:0055070) |
| 0.4 |
1.1 |
GO:0006097 |
glyoxylate cycle(GO:0006097) glyoxylate metabolic process(GO:0046487) |
| 0.4 |
9.8 |
GO:0046039 |
GTP metabolic process(GO:0046039) |
| 0.4 |
0.4 |
GO:0060744 |
thelarche(GO:0042695) mammary gland branching involved in thelarche(GO:0060744) |
| 0.4 |
1.1 |
GO:0034729 |
histone H3-K79 methylation(GO:0034729) |
| 0.4 |
4.3 |
GO:0097062 |
dendritic spine maintenance(GO:0097062) |
| 0.4 |
1.4 |
GO:0031581 |
hemidesmosome assembly(GO:0031581) |
| 0.4 |
1.4 |
GO:0045987 |
positive regulation of smooth muscle contraction(GO:0045987) |
| 0.4 |
1.8 |
GO:0006348 |
chromatin silencing at telomere(GO:0006348) |
| 0.4 |
1.8 |
GO:0060355 |
positive regulation of cell adhesion molecule production(GO:0060355) |
| 0.4 |
0.7 |
GO:0072718 |
response to cisplatin(GO:0072718) |
| 0.4 |
4.9 |
GO:0042541 |
hemoglobin biosynthetic process(GO:0042541) |
| 0.3 |
3.1 |
GO:2001214 |
positive regulation of vasculogenesis(GO:2001214) |
| 0.3 |
3.5 |
GO:0070836 |
caveola assembly(GO:0070836) |
| 0.3 |
0.7 |
GO:0060330 |
regulation of response to interferon-gamma(GO:0060330) |
| 0.3 |
1.7 |
GO:0002317 |
plasma cell differentiation(GO:0002317) |
| 0.3 |
1.0 |
GO:1903334 |
positive regulation of protein folding(GO:1903334) |
| 0.3 |
0.7 |
GO:0035793 |
negative regulation of phosphatidylinositol biosynthetic process(GO:0010512) cell migration involved in metanephros development(GO:0035788) metanephric mesenchymal cell migration(GO:0035789) positive regulation of metanephric mesenchymal cell migration by platelet-derived growth factor receptor-beta signaling pathway(GO:0035793) regulation of metanephric mesenchymal cell migration by platelet-derived growth factor receptor-beta signaling pathway(GO:1900238) regulation of metanephric mesenchymal cell migration(GO:2000589) positive regulation of metanephric mesenchymal cell migration(GO:2000591) |
| 0.3 |
1.0 |
GO:0048698 |
negative regulation of collateral sprouting in absence of injury(GO:0048698) |
| 0.3 |
5.0 |
GO:0006851 |
mitochondrial calcium ion transport(GO:0006851) |
| 0.3 |
2.0 |
GO:0010804 |
negative regulation of tumor necrosis factor-mediated signaling pathway(GO:0010804) |
| 0.3 |
3.0 |
GO:1901970 |
positive regulation of mitotic sister chromatid separation(GO:1901970) |
| 0.3 |
0.7 |
GO:0072554 |
arterial endothelial cell fate commitment(GO:0060844) blood vessel endothelial cell fate commitment(GO:0060846) endothelial cell fate specification(GO:0060847) Notch signaling pathway involved in arterial endothelial cell fate commitment(GO:0060853) regulation of cell adhesion involved in heart morphogenesis(GO:0061344) blood vessel lumenization(GO:0072554) blood vessel endothelial cell fate specification(GO:0097101) positive regulation of ephrin receptor signaling pathway(GO:1901189) regulation of canonical Wnt signaling pathway involved in cardiac muscle cell fate commitment(GO:1901295) positive regulation of heart induction(GO:1901321) regulation of canonical Wnt signaling pathway involved in heart development(GO:1905066) |
| 0.3 |
3.3 |
GO:0045899 |
positive regulation of RNA polymerase II transcriptional preinitiation complex assembly(GO:0045899) |
| 0.3 |
2.0 |
GO:0006528 |
asparagine metabolic process(GO:0006528) |
| 0.3 |
3.6 |
GO:0001911 |
negative regulation of leukocyte mediated cytotoxicity(GO:0001911) |
| 0.3 |
4.5 |
GO:0007035 |
vacuolar acidification(GO:0007035) |
| 0.3 |
0.3 |
GO:0070278 |
extracellular matrix constituent secretion(GO:0070278) |
| 0.3 |
0.3 |
GO:1902018 |
negative regulation of cilium assembly(GO:1902018) |
| 0.3 |
1.0 |
GO:0034287 |
detection of carbohydrate stimulus(GO:0009730) detection of hexose stimulus(GO:0009732) detection of monosaccharide stimulus(GO:0034287) detection of glucose(GO:0051594) |
| 0.3 |
4.1 |
GO:0006654 |
phosphatidic acid biosynthetic process(GO:0006654) phosphatidic acid metabolic process(GO:0046473) |
| 0.3 |
0.9 |
GO:0061153 |
trachea submucosa development(GO:0061152) trachea gland development(GO:0061153) |
| 0.3 |
4.7 |
GO:0045907 |
positive regulation of vasoconstriction(GO:0045907) |
| 0.3 |
0.9 |
GO:1903377 |
negative regulation of oxidative stress-induced neuron intrinsic apoptotic signaling pathway(GO:1903377) |
| 0.3 |
5.3 |
GO:0048384 |
retinoic acid receptor signaling pathway(GO:0048384) |
| 0.3 |
1.3 |
GO:0042511 |
positive regulation of tyrosine phosphorylation of Stat1 protein(GO:0042511) |
| 0.3 |
5.3 |
GO:0033194 |
response to hydroperoxide(GO:0033194) |
| 0.3 |
2.2 |
GO:0006729 |
tetrahydrobiopterin biosynthetic process(GO:0006729) tetrahydrobiopterin metabolic process(GO:0046146) |
| 0.3 |
8.4 |
GO:0036075 |
endochondral ossification(GO:0001958) replacement ossification(GO:0036075) |
| 0.3 |
1.2 |
GO:0014029 |
neural crest formation(GO:0014029) |
| 0.3 |
2.5 |
GO:0060033 |
anatomical structure regression(GO:0060033) |
| 0.3 |
9.8 |
GO:0051497 |
negative regulation of stress fiber assembly(GO:0051497) |
| 0.3 |
1.2 |
GO:0046294 |
formaldehyde catabolic process(GO:0046294) |
| 0.3 |
1.2 |
GO:0032511 |
late endosome to vacuole transport via multivesicular body sorting pathway(GO:0032511) protein targeting to vacuole involved in ubiquitin-dependent protein catabolic process via the multivesicular body sorting pathway(GO:0043328) |
| 0.3 |
0.3 |
GO:0045656 |
negative regulation of monocyte differentiation(GO:0045656) |
| 0.3 |
1.5 |
GO:0090038 |
negative regulation of protein kinase C signaling(GO:0090038) |
| 0.3 |
1.5 |
GO:0071361 |
cellular response to ethanol(GO:0071361) |
| 0.3 |
0.9 |
GO:1903887 |
motile primary cilium assembly(GO:1903887) |
| 0.3 |
6.9 |
GO:0006270 |
DNA replication initiation(GO:0006270) |
| 0.3 |
2.7 |
GO:0006958 |
complement activation, classical pathway(GO:0006958) |
| 0.3 |
1.8 |
GO:2000672 |
negative regulation of motor neuron apoptotic process(GO:2000672) |
| 0.3 |
0.9 |
GO:0036500 |
ATF6-mediated unfolded protein response(GO:0036500) |
| 0.3 |
0.6 |
GO:0097150 |
neuronal stem cell population maintenance(GO:0097150) |
| 0.3 |
4.1 |
GO:0048642 |
negative regulation of skeletal muscle tissue development(GO:0048642) |
| 0.3 |
0.3 |
GO:0016114 |
terpenoid biosynthetic process(GO:0016114) |
| 0.3 |
2.4 |
GO:0061158 |
3'-UTR-mediated mRNA destabilization(GO:0061158) |
| 0.3 |
4.7 |
GO:0035873 |
lactate transport(GO:0015727) lactate transmembrane transport(GO:0035873) plasma membrane lactate transport(GO:0035879) |
| 0.3 |
0.6 |
GO:2000744 |
anterior head development(GO:0097065) regulation of anterior head development(GO:2000742) positive regulation of anterior head development(GO:2000744) |
| 0.3 |
2.6 |
GO:0009143 |
nucleoside triphosphate catabolic process(GO:0009143) |
| 0.3 |
2.0 |
GO:0031119 |
tRNA pseudouridine synthesis(GO:0031119) |
| 0.3 |
3.5 |
GO:0050909 |
sensory perception of taste(GO:0050909) |
| 0.3 |
1.7 |
GO:0002063 |
chondrocyte development(GO:0002063) |
| 0.3 |
1.4 |
GO:0018364 |
peptidyl-glutamine methylation(GO:0018364) |
| 0.3 |
4.9 |
GO:0000920 |
cell separation after cytokinesis(GO:0000920) |
| 0.3 |
1.4 |
GO:0071294 |
cellular response to zinc ion(GO:0071294) |
| 0.3 |
3.2 |
GO:0007076 |
mitotic chromosome condensation(GO:0007076) |
| 0.3 |
1.7 |
GO:0008343 |
adult feeding behavior(GO:0008343) |
| 0.3 |
1.1 |
GO:0070345 |
negative regulation of fat cell proliferation(GO:0070345) |
| 0.3 |
1.1 |
GO:0071985 |
multivesicular body sorting pathway(GO:0071985) |
| 0.3 |
5.3 |
GO:0035036 |
binding of sperm to zona pellucida(GO:0007339) sperm-egg recognition(GO:0035036) |
| 0.3 |
0.8 |
GO:0097500 |
receptor localization to nonmotile primary cilium(GO:0097500) |
| 0.3 |
1.4 |
GO:0045019 |
negative regulation of nitric oxide biosynthetic process(GO:0045019) negative regulation of nitric oxide metabolic process(GO:1904406) |
| 0.3 |
4.2 |
GO:0006910 |
phagocytosis, recognition(GO:0006910) |
| 0.3 |
1.7 |
GO:0014816 |
skeletal muscle satellite cell differentiation(GO:0014816) |
| 0.3 |
3.0 |
GO:0032287 |
peripheral nervous system myelin maintenance(GO:0032287) |
| 0.3 |
0.6 |
GO:0060159 |
regulation of dopamine receptor signaling pathway(GO:0060159) |
| 0.3 |
0.3 |
GO:0090045 |
positive regulation of deacetylase activity(GO:0090045) |
| 0.3 |
1.1 |
GO:2001274 |
negative regulation of glucose import in response to insulin stimulus(GO:2001274) |
| 0.3 |
1.4 |
GO:0033182 |
regulation of histone ubiquitination(GO:0033182) |
| 0.3 |
0.8 |
GO:1903800 |
positive regulation of production of miRNAs involved in gene silencing by miRNA(GO:1903800) |
| 0.3 |
1.6 |
GO:0044034 |
negative stranded viral RNA replication(GO:0039689) multi-organism biosynthetic process(GO:0044034) |
| 0.3 |
0.8 |
GO:0051031 |
tRNA transport(GO:0051031) |
| 0.3 |
1.9 |
GO:0070458 |
detoxification of nitrogen compound(GO:0051410) cellular detoxification of nitrogen compound(GO:0070458) |
| 0.3 |
0.5 |
GO:0042701 |
progesterone secretion(GO:0042701) |
| 0.3 |
1.3 |
GO:0050855 |
regulation of B cell receptor signaling pathway(GO:0050855) positive regulation of B cell receptor signaling pathway(GO:0050861) |
| 0.3 |
1.1 |
GO:0038089 |
positive regulation of cell migration by vascular endothelial growth factor signaling pathway(GO:0038089) |
| 0.3 |
1.3 |
GO:0097421 |
liver regeneration(GO:0097421) |
| 0.3 |
0.5 |
GO:0006776 |
vitamin A metabolic process(GO:0006776) |
| 0.3 |
1.0 |
GO:0018242 |
protein O-linked glycosylation via serine(GO:0018242) |
| 0.3 |
0.8 |
GO:0006072 |
glycerol-3-phosphate metabolic process(GO:0006072) |
| 0.3 |
2.3 |
GO:0006012 |
galactose metabolic process(GO:0006012) |
| 0.3 |
0.3 |
GO:0035701 |
hematopoietic stem cell migration(GO:0035701) |
| 0.3 |
2.6 |
GO:0043312 |
neutrophil degranulation(GO:0043312) |
| 0.3 |
1.5 |
GO:0000447 |
endonucleolytic cleavage in ITS1 to separate SSU-rRNA from 5.8S rRNA and LSU-rRNA from tricistronic rRNA transcript (SSU-rRNA, 5.8S rRNA, LSU-rRNA)(GO:0000447) |
| 0.3 |
5.4 |
GO:0030212 |
hyaluronan metabolic process(GO:0030212) |
| 0.3 |
2.3 |
GO:0061298 |
retina vasculature development in camera-type eye(GO:0061298) |
| 0.3 |
1.5 |
GO:0019321 |
pentose metabolic process(GO:0019321) |
| 0.3 |
3.8 |
GO:1902186 |
regulation of viral release from host cell(GO:1902186) |
| 0.2 |
1.2 |
GO:0006048 |
UDP-N-acetylglucosamine biosynthetic process(GO:0006048) |
| 0.2 |
4.2 |
GO:0001913 |
T cell mediated cytotoxicity(GO:0001913) |
| 0.2 |
2.0 |
GO:0031053 |
primary miRNA processing(GO:0031053) |
| 0.2 |
0.7 |
GO:0043456 |
regulation of pentose-phosphate shunt(GO:0043456) |
| 0.2 |
1.2 |
GO:0007096 |
regulation of exit from mitosis(GO:0007096) |
| 0.2 |
0.7 |
GO:0030210 |
heparin biosynthetic process(GO:0030210) |
| 0.2 |
0.7 |
GO:0001732 |
formation of cytoplasmic translation initiation complex(GO:0001732) |
| 0.2 |
1.9 |
GO:0007175 |
negative regulation of epidermal growth factor-activated receptor activity(GO:0007175) |
| 0.2 |
0.7 |
GO:0032713 |
negative regulation of interleukin-4 production(GO:0032713) |
| 0.2 |
0.5 |
GO:0043144 |
snoRNA processing(GO:0043144) |
| 0.2 |
2.5 |
GO:0019243 |
methylglyoxal catabolic process to D-lactate via S-lactoyl-glutathione(GO:0019243) methylglyoxal catabolic process(GO:0051596) methylglyoxal catabolic process to lactate(GO:0061727) |
| 0.2 |
1.4 |
GO:0070092 |
glucagon secretion(GO:0070091) regulation of glucagon secretion(GO:0070092) |
| 0.2 |
1.2 |
GO:0021940 |
positive regulation of cerebellar granule cell precursor proliferation(GO:0021940) |
| 0.2 |
3.0 |
GO:0009134 |
nucleoside diphosphate catabolic process(GO:0009134) ribonucleoside diphosphate catabolic process(GO:0009191) |
| 0.2 |
4.8 |
GO:0002474 |
antigen processing and presentation of peptide antigen via MHC class I(GO:0002474) |
| 0.2 |
1.8 |
GO:0033353 |
S-adenosylmethionine cycle(GO:0033353) |
| 0.2 |
2.3 |
GO:0006953 |
acute-phase response(GO:0006953) |
| 0.2 |
0.2 |
GO:0021523 |
somatic motor neuron differentiation(GO:0021523) |
| 0.2 |
2.7 |
GO:0038063 |
collagen-activated tyrosine kinase receptor signaling pathway(GO:0038063) collagen-activated signaling pathway(GO:0038065) |
| 0.2 |
4.3 |
GO:0042474 |
middle ear morphogenesis(GO:0042474) |
| 0.2 |
1.8 |
GO:0042416 |
dopamine biosynthetic process(GO:0042416) |
| 0.2 |
1.6 |
GO:0060623 |
regulation of chromosome condensation(GO:0060623) |
| 0.2 |
0.4 |
GO:2000484 |
positive regulation of interleukin-8 secretion(GO:2000484) |
| 0.2 |
0.9 |
GO:0070589 |
cell wall mannoprotein biosynthetic process(GO:0000032) mannoprotein metabolic process(GO:0006056) mannoprotein biosynthetic process(GO:0006057) cell wall glycoprotein biosynthetic process(GO:0031506) cell wall biogenesis(GO:0042546) cell wall macromolecule metabolic process(GO:0044036) cell wall macromolecule biosynthetic process(GO:0044038) chain elongation of O-linked mannose residue(GO:0044845) cellular component macromolecule biosynthetic process(GO:0070589) cell wall organization or biogenesis(GO:0071554) |
| 0.2 |
1.6 |
GO:0061002 |
negative regulation of dendritic spine morphogenesis(GO:0061002) |
| 0.2 |
1.1 |
GO:0007197 |
adenylate cyclase-inhibiting G-protein coupled acetylcholine receptor signaling pathway(GO:0007197) phospholipase C-activating G-protein coupled acetylcholine receptor signaling pathway(GO:0007207) |
| 0.2 |
0.9 |
GO:0048537 |
mucosal-associated lymphoid tissue development(GO:0048537) Peyer's patch development(GO:0048541) |
| 0.2 |
0.4 |
GO:0060579 |
ventral spinal cord interneuron fate commitment(GO:0060579) cell fate commitment involved in pattern specification(GO:0060581) |
| 0.2 |
5.8 |
GO:0000027 |
ribosomal large subunit assembly(GO:0000027) |
| 0.2 |
0.2 |
GO:0042045 |
epithelial fluid transport(GO:0042045) |
| 0.2 |
0.6 |
GO:0034162 |
toll-like receptor 9 signaling pathway(GO:0034162) |
| 0.2 |
2.5 |
GO:0044458 |
motile cilium assembly(GO:0044458) |
| 0.2 |
1.9 |
GO:0019800 |
peptide cross-linking via chondroitin 4-sulfate glycosaminoglycan(GO:0019800) |
| 0.2 |
1.2 |
GO:0042795 |
snRNA transcription from RNA polymerase II promoter(GO:0042795) |
| 0.2 |
0.8 |
GO:0019509 |
L-methionine biosynthetic process from methylthioadenosine(GO:0019509) |
| 0.2 |
0.8 |
GO:0001550 |
ovarian cumulus expansion(GO:0001550) fused antrum stage(GO:0048165) |
| 0.2 |
1.2 |
GO:0036158 |
outer dynein arm assembly(GO:0036158) |
| 0.2 |
1.0 |
GO:0009068 |
aspartate family amino acid catabolic process(GO:0009068) |
| 0.2 |
0.6 |
GO:0019441 |
tryptophan catabolic process(GO:0006569) aromatic amino acid family catabolic process(GO:0009074) tryptophan catabolic process to kynurenine(GO:0019441) indole-containing compound catabolic process(GO:0042436) indolalkylamine catabolic process(GO:0046218) kynurenine metabolic process(GO:0070189) |
| 0.2 |
4.5 |
GO:0007200 |
phospholipase C-activating G-protein coupled receptor signaling pathway(GO:0007200) |
| 0.2 |
1.6 |
GO:0051574 |
positive regulation of histone H3-K9 methylation(GO:0051574) |
| 0.2 |
0.8 |
GO:0034113 |
heterotypic cell-cell adhesion(GO:0034113) |
| 0.2 |
2.4 |
GO:0033327 |
Leydig cell differentiation(GO:0033327) |
| 0.2 |
0.8 |
GO:0002517 |
T cell tolerance induction(GO:0002517) regulation of T cell tolerance induction(GO:0002664) |
| 0.2 |
2.4 |
GO:0000059 |
protein import into nucleus, docking(GO:0000059) |
| 0.2 |
0.8 |
GO:0070125 |
mitochondrial translational elongation(GO:0070125) |
| 0.2 |
1.6 |
GO:0042640 |
anagen(GO:0042640) |
| 0.2 |
2.0 |
GO:0010826 |
negative regulation of centrosome duplication(GO:0010826) negative regulation of centrosome cycle(GO:0046606) |
| 0.2 |
0.8 |
GO:0048852 |
diencephalon morphogenesis(GO:0048852) |
| 0.2 |
1.0 |
GO:0021780 |
oligodendrocyte cell fate specification(GO:0021778) oligodendrocyte cell fate commitment(GO:0021779) glial cell fate specification(GO:0021780) |
| 0.2 |
2.5 |
GO:1902857 |
positive regulation of nonmotile primary cilium assembly(GO:1902857) |
| 0.2 |
0.4 |
GO:0010519 |
negative regulation of phospholipase activity(GO:0010519) |
| 0.2 |
0.2 |
GO:0060161 |
positive regulation of dopamine receptor signaling pathway(GO:0060161) |
| 0.2 |
0.8 |
GO:0007044 |
cell-substrate junction assembly(GO:0007044) |
| 0.2 |
0.4 |
GO:0086045 |
membrane depolarization during AV node cell action potential(GO:0086045) |
| 0.2 |
0.8 |
GO:2000051 |
negative regulation of non-canonical Wnt signaling pathway(GO:2000051) |
| 0.2 |
3.9 |
GO:0015985 |
energy coupled proton transport, down electrochemical gradient(GO:0015985) ATP synthesis coupled proton transport(GO:0015986) |
| 0.2 |
2.5 |
GO:0009950 |
dorsal/ventral axis specification(GO:0009950) |
| 0.2 |
6.3 |
GO:0005978 |
glycogen biosynthetic process(GO:0005978) glucan biosynthetic process(GO:0009250) |
| 0.2 |
2.5 |
GO:0051383 |
kinetochore assembly(GO:0051382) kinetochore organization(GO:0051383) |
| 0.2 |
0.4 |
GO:0033088 |
negative regulation of immature T cell proliferation in thymus(GO:0033088) |
| 0.2 |
1.1 |
GO:0051694 |
pointed-end actin filament capping(GO:0051694) |
| 0.2 |
1.5 |
GO:0015868 |
purine ribonucleotide transport(GO:0015868) |
| 0.2 |
0.9 |
GO:0061052 |
negative regulation of cell growth involved in cardiac muscle cell development(GO:0061052) |
| 0.2 |
0.2 |
GO:0010390 |
histone monoubiquitination(GO:0010390) |
| 0.2 |
0.6 |
GO:0060425 |
lung morphogenesis(GO:0060425) |
| 0.2 |
0.9 |
GO:0035090 |
maintenance of apical/basal cell polarity(GO:0035090) |
| 0.2 |
1.5 |
GO:0014883 |
transition between fast and slow fiber(GO:0014883) |
| 0.2 |
1.7 |
GO:0071763 |
nuclear membrane organization(GO:0071763) |
| 0.2 |
6.8 |
GO:0000387 |
spliceosomal snRNP assembly(GO:0000387) |
| 0.2 |
0.9 |
GO:0006297 |
nucleotide-excision repair, DNA gap filling(GO:0006297) |
| 0.2 |
0.7 |
GO:0051096 |
regulation of helicase activity(GO:0051095) positive regulation of helicase activity(GO:0051096) |
| 0.2 |
2.8 |
GO:0051127 |
positive regulation of actin nucleation(GO:0051127) |
| 0.2 |
0.4 |
GO:2000852 |
regulation of corticosterone secretion(GO:2000852) |
| 0.2 |
2.7 |
GO:0042407 |
cristae formation(GO:0042407) |
| 0.2 |
0.9 |
GO:0090527 |
actin filament reorganization(GO:0090527) |
| 0.2 |
0.5 |
GO:1990481 |
mRNA pseudouridine synthesis(GO:1990481) |
| 0.2 |
1.2 |
GO:0042347 |
negative regulation of NF-kappaB import into nucleus(GO:0042347) |
| 0.2 |
1.9 |
GO:0044406 |
adhesion of symbiont to host(GO:0044406) |
| 0.2 |
1.9 |
GO:0000463 |
maturation of LSU-rRNA from tricistronic rRNA transcript (SSU-rRNA, 5.8S rRNA, LSU-rRNA)(GO:0000463) |
| 0.2 |
0.7 |
GO:0019355 |
nicotinamide nucleotide biosynthetic process from aspartate(GO:0019355) 'de novo' NAD biosynthetic process(GO:0034627) 'de novo' NAD biosynthetic process from aspartate(GO:0034628) |
| 0.2 |
1.4 |
GO:0034315 |
regulation of Arp2/3 complex-mediated actin nucleation(GO:0034315) |
| 0.2 |
0.7 |
GO:0030225 |
macrophage differentiation(GO:0030225) |
| 0.2 |
2.3 |
GO:0071392 |
cellular response to estradiol stimulus(GO:0071392) |
| 0.2 |
0.3 |
GO:1902260 |
negative regulation of delayed rectifier potassium channel activity(GO:1902260) negative regulation of voltage-gated potassium channel activity(GO:1903817) |
| 0.2 |
0.3 |
GO:0010040 |
response to iron(II) ion(GO:0010040) |
| 0.2 |
1.2 |
GO:0006621 |
protein retention in ER lumen(GO:0006621) |
| 0.2 |
1.4 |
GO:0048680 |
positive regulation of axon regeneration(GO:0048680) |
| 0.2 |
0.9 |
GO:0051661 |
maintenance of centrosome location(GO:0051661) |
| 0.2 |
1.0 |
GO:0043568 |
positive regulation of insulin-like growth factor receptor signaling pathway(GO:0043568) |
| 0.2 |
1.4 |
GO:0006398 |
mRNA 3'-end processing by stem-loop binding and cleavage(GO:0006398) |
| 0.2 |
1.7 |
GO:0021516 |
dorsal spinal cord development(GO:0021516) |
| 0.2 |
2.9 |
GO:0042753 |
positive regulation of circadian rhythm(GO:0042753) |
| 0.2 |
2.2 |
GO:0030150 |
protein import into mitochondrial matrix(GO:0030150) |
| 0.2 |
1.3 |
GO:0030903 |
notochord development(GO:0030903) |
| 0.2 |
1.2 |
GO:0071459 |
protein localization to kinetochore(GO:0034501) protein localization to chromosome, centromeric region(GO:0071459) |
| 0.2 |
0.7 |
GO:1903624 |
regulation of apoptotic DNA fragmentation(GO:1902510) regulation of DNA catabolic process(GO:1903624) |
| 0.2 |
0.3 |
GO:0036509 |
trimming of terminal mannose on B branch(GO:0036509) |
| 0.2 |
0.5 |
GO:0042196 |
dichloromethane metabolic process(GO:0018900) chlorinated hydrocarbon metabolic process(GO:0042196) halogenated hydrocarbon metabolic process(GO:0042197) |
| 0.2 |
0.5 |
GO:0051490 |
negative regulation of filopodium assembly(GO:0051490) |
| 0.2 |
0.5 |
GO:0048853 |
forebrain morphogenesis(GO:0048853) |
| 0.2 |
1.0 |
GO:0050849 |
negative regulation of calcium-mediated signaling(GO:0050849) |
| 0.2 |
3.1 |
GO:0001937 |
negative regulation of endothelial cell proliferation(GO:0001937) |
| 0.2 |
0.2 |
GO:0051958 |
methotrexate transport(GO:0051958) |
| 0.2 |
0.5 |
GO:0051151 |
negative regulation of smooth muscle cell differentiation(GO:0051151) |
| 0.2 |
0.5 |
GO:2000048 |
negative regulation of cell-cell adhesion mediated by cadherin(GO:2000048) |
| 0.2 |
1.1 |
GO:0043983 |
histone H4-K12 acetylation(GO:0043983) |
| 0.2 |
0.6 |
GO:0000479 |
endonucleolytic cleavage of tricistronic rRNA transcript (SSU-rRNA, 5.8S rRNA, LSU-rRNA)(GO:0000479) |
| 0.2 |
0.8 |
GO:0016127 |
cholesterol catabolic process(GO:0006707) sterol catabolic process(GO:0016127) |
| 0.2 |
3.9 |
GO:0034724 |
DNA replication-independent nucleosome assembly(GO:0006336) DNA replication-independent nucleosome organization(GO:0034724) |
| 0.2 |
0.6 |
GO:0010288 |
response to lead ion(GO:0010288) |
| 0.2 |
0.5 |
GO:0045943 |
positive regulation of transcription from RNA polymerase I promoter(GO:0045943) |
| 0.2 |
2.2 |
GO:0051044 |
positive regulation of membrane protein ectodomain proteolysis(GO:0051044) |
| 0.2 |
2.7 |
GO:0030513 |
positive regulation of BMP signaling pathway(GO:0030513) |
| 0.2 |
1.9 |
GO:0031954 |
positive regulation of protein autophosphorylation(GO:0031954) |
| 0.2 |
0.6 |
GO:0060050 |
positive regulation of protein glycosylation(GO:0060050) |
| 0.2 |
0.9 |
GO:0000132 |
establishment of mitotic spindle orientation(GO:0000132) establishment of mitotic spindle localization(GO:0040001) |
| 0.2 |
2.2 |
GO:0005980 |
polysaccharide catabolic process(GO:0000272) glycogen catabolic process(GO:0005980) glucan catabolic process(GO:0009251) cellular polysaccharide catabolic process(GO:0044247) |
| 0.2 |
0.3 |
GO:1901642 |
purine nucleoside transmembrane transport(GO:0015860) purine-containing compound transmembrane transport(GO:0072530) nucleoside transmembrane transport(GO:1901642) |
| 0.2 |
0.2 |
GO:0032466 |
negative regulation of cytokinesis(GO:0032466) |
| 0.2 |
0.6 |
GO:0000707 |
meiotic DNA recombinase assembly(GO:0000707) |
| 0.2 |
0.8 |
GO:0051013 |
microtubule severing(GO:0051013) |
| 0.2 |
2.1 |
GO:0032467 |
positive regulation of cytokinesis(GO:0032467) |
| 0.2 |
0.3 |
GO:0019732 |
antifungal humoral response(GO:0019732) |
| 0.2 |
2.1 |
GO:0007080 |
mitotic metaphase plate congression(GO:0007080) |
| 0.1 |
0.9 |
GO:0016255 |
attachment of GPI anchor to protein(GO:0016255) |
| 0.1 |
0.9 |
GO:0010759 |
positive regulation of macrophage chemotaxis(GO:0010759) |
| 0.1 |
3.2 |
GO:0016180 |
snRNA processing(GO:0016180) |
| 0.1 |
1.9 |
GO:0016339 |
calcium-dependent cell-cell adhesion via plasma membrane cell adhesion molecules(GO:0016339) |
| 0.1 |
0.9 |
GO:0006627 |
protein processing involved in protein targeting to mitochondrion(GO:0006627) mitochondrial protein processing(GO:0034982) |
| 0.1 |
0.4 |
GO:0051561 |
positive regulation of mitochondrial calcium ion concentration(GO:0051561) |
| 0.1 |
0.1 |
GO:0070459 |
prolactin secretion(GO:0070459) |
| 0.1 |
2.9 |
GO:0009299 |
mRNA transcription(GO:0009299) |
| 0.1 |
4.9 |
GO:0001895 |
retina homeostasis(GO:0001895) |
| 0.1 |
3.9 |
GO:0008608 |
attachment of spindle microtubules to kinetochore(GO:0008608) |
| 0.1 |
0.9 |
GO:0071578 |
zinc II ion transmembrane import(GO:0071578) |
| 0.1 |
0.4 |
GO:0060011 |
Sertoli cell proliferation(GO:0060011) |
| 0.1 |
1.1 |
GO:0007213 |
G-protein coupled acetylcholine receptor signaling pathway(GO:0007213) |
| 0.1 |
1.3 |
GO:2000381 |
negative regulation of mesoderm development(GO:2000381) |
| 0.1 |
0.8 |
GO:0060510 |
Type II pneumocyte differentiation(GO:0060510) |
| 0.1 |
0.7 |
GO:0014886 |
transition between slow and fast fiber(GO:0014886) |
| 0.1 |
0.8 |
GO:0045724 |
positive regulation of cilium assembly(GO:0045724) |
| 0.1 |
0.3 |
GO:0035519 |
protein K29-linked ubiquitination(GO:0035519) |
| 0.1 |
0.6 |
GO:0090336 |
positive regulation of brown fat cell differentiation(GO:0090336) |
| 0.1 |
0.6 |
GO:0006824 |
cobalt ion transport(GO:0006824) |
| 0.1 |
0.4 |
GO:0048711 |
positive regulation of astrocyte differentiation(GO:0048711) |
| 0.1 |
0.7 |
GO:0002862 |
regulation of inflammatory response to antigenic stimulus(GO:0002861) negative regulation of inflammatory response to antigenic stimulus(GO:0002862) |
| 0.1 |
2.6 |
GO:0050873 |
brown fat cell differentiation(GO:0050873) |
| 0.1 |
2.5 |
GO:0008584 |
male gonad development(GO:0008584) development of primary male sexual characteristics(GO:0046546) |
| 0.1 |
1.0 |
GO:0090502 |
RNA phosphodiester bond hydrolysis, endonucleolytic(GO:0090502) |
| 0.1 |
2.2 |
GO:0014009 |
glial cell proliferation(GO:0014009) |
| 0.1 |
0.8 |
GO:0035459 |
cargo loading into vesicle(GO:0035459) |
| 0.1 |
5.0 |
GO:0006970 |
response to osmotic stress(GO:0006970) |
| 0.1 |
0.5 |
GO:0002437 |
inflammatory response to antigenic stimulus(GO:0002437) |
| 0.1 |
1.1 |
GO:0055006 |
cardiac cell development(GO:0055006) cardiac muscle cell development(GO:0055013) |
| 0.1 |
0.5 |
GO:0000491 |
small nucleolar ribonucleoprotein complex assembly(GO:0000491) box C/D snoRNP assembly(GO:0000492) |
| 0.1 |
5.4 |
GO:0030490 |
maturation of SSU-rRNA(GO:0030490) |
| 0.1 |
1.5 |
GO:0031065 |
positive regulation of histone deacetylation(GO:0031065) |
| 0.1 |
0.5 |
GO:0007530 |
sex determination(GO:0007530) |
| 0.1 |
0.6 |
GO:2000194 |
regulation of female gonad development(GO:2000194) |
| 0.1 |
2.2 |
GO:0060706 |
cell differentiation involved in embryonic placenta development(GO:0060706) |
| 0.1 |
0.6 |
GO:0042059 |
negative regulation of epidermal growth factor receptor signaling pathway(GO:0042059) negative regulation of ERBB signaling pathway(GO:1901185) |
| 0.1 |
0.6 |
GO:0098789 |
pre-mRNA cleavage required for polyadenylation(GO:0098789) |
| 0.1 |
0.4 |
GO:2000612 |
pronephros development(GO:0048793) positive regulation of mesenchymal to epithelial transition involved in metanephros morphogenesis(GO:0072108) metanephric tubule formation(GO:0072174) metanephric nephron tubule formation(GO:0072289) regulation of mesenchymal cell apoptotic process involved in metanephric nephron morphogenesis(GO:0072304) negative regulation of mesenchymal cell apoptotic process involved in metanephric nephron morphogenesis(GO:0072305) mesenchymal stem cell maintenance involved in metanephric nephron morphogenesis(GO:0072309) mesenchymal cell apoptotic process involved in metanephros development(GO:1900200) apoptotic process involved in metanephric collecting duct development(GO:1900204) apoptotic process involved in metanephric nephron tubule development(GO:1900205) regulation of mesenchymal cell apoptotic process involved in metanephros development(GO:1900211) negative regulation of mesenchymal cell apoptotic process involved in metanephros development(GO:1900212) regulation of apoptotic process involved in metanephric collecting duct development(GO:1900214) negative regulation of apoptotic process involved in metanephric collecting duct development(GO:1900215) regulation of apoptotic process involved in metanephric nephron tubule development(GO:1900217) negative regulation of apoptotic process involved in metanephric nephron tubule development(GO:1900218) mesenchymal cell apoptotic process involved in metanephric nephron morphogenesis(GO:1901147) regulation of metanephric DCT cell differentiation(GO:2000592) positive regulation of metanephric DCT cell differentiation(GO:2000594) regulation of thyroid-stimulating hormone secretion(GO:2000612) |
| 0.1 |
0.4 |
GO:0006547 |
histidine metabolic process(GO:0006547) |
| 0.1 |
1.9 |
GO:2000060 |
positive regulation of protein ubiquitination involved in ubiquitin-dependent protein catabolic process(GO:2000060) |
| 0.1 |
2.0 |
GO:0043248 |
proteasome assembly(GO:0043248) |
| 0.1 |
0.9 |
GO:0042832 |
response to protozoan(GO:0001562) defense response to protozoan(GO:0042832) |
| 0.1 |
2.5 |
GO:0060445 |
branching involved in salivary gland morphogenesis(GO:0060445) |
| 0.1 |
4.2 |
GO:0031016 |
pancreas development(GO:0031016) |
| 0.1 |
0.2 |
GO:0045657 |
positive regulation of monocyte differentiation(GO:0045657) |
| 0.1 |
0.6 |
GO:0035188 |
blastocyst hatching(GO:0001835) hatching(GO:0035188) chondrocyte proliferation(GO:0035988) organism emergence from protective structure(GO:0071684) |
| 0.1 |
2.3 |
GO:0045540 |
regulation of cholesterol biosynthetic process(GO:0045540) |
| 0.1 |
0.7 |
GO:0015074 |
DNA integration(GO:0015074) |
| 0.1 |
0.5 |
GO:2000346 |
negative regulation of hepatocyte proliferation(GO:2000346) |
| 0.1 |
0.4 |
GO:0060339 |
negative regulation of type I interferon-mediated signaling pathway(GO:0060339) |
| 0.1 |
1.9 |
GO:0007588 |
excretion(GO:0007588) |
| 0.1 |
1.0 |
GO:0019395 |
fatty acid oxidation(GO:0019395) |
| 0.1 |
0.7 |
GO:0042274 |
ribosomal small subunit biogenesis(GO:0042274) |
| 0.1 |
0.4 |
GO:0045900 |
negative regulation of translational elongation(GO:0045900) |
| 0.1 |
0.7 |
GO:0006488 |
dolichol-linked oligosaccharide biosynthetic process(GO:0006488) |
| 0.1 |
1.3 |
GO:0034260 |
negative regulation of GTPase activity(GO:0034260) |
| 0.1 |
0.8 |
GO:0048199 |
vesicle targeting, to, from or within Golgi(GO:0048199) |
| 0.1 |
0.9 |
GO:0033234 |
negative regulation of protein sumoylation(GO:0033234) |
| 0.1 |
0.7 |
GO:0071494 |
cellular response to UV-C(GO:0071494) |
| 0.1 |
0.3 |
GO:0035262 |
gonad morphogenesis(GO:0035262) |
| 0.1 |
0.7 |
GO:0035735 |
intraciliary transport involved in cilium morphogenesis(GO:0035735) |
| 0.1 |
0.7 |
GO:0030578 |
PML body organization(GO:0030578) |
| 0.1 |
0.6 |
GO:0045721 |
negative regulation of gluconeogenesis(GO:0045721) |
| 0.1 |
0.9 |
GO:0071800 |
podosome assembly(GO:0071800) |
| 0.1 |
0.3 |
GO:0007171 |
activation of transmembrane receptor protein tyrosine kinase activity(GO:0007171) |
| 0.1 |
0.5 |
GO:0016540 |
protein autoprocessing(GO:0016540) |
| 0.1 |
0.2 |
GO:0097501 |
stress response to metal ion(GO:0097501) |
| 0.1 |
0.5 |
GO:0060040 |
retinal bipolar neuron differentiation(GO:0060040) |
| 0.1 |
0.6 |
GO:0009235 |
cobalamin metabolic process(GO:0009235) |
| 0.1 |
0.3 |
GO:0036462 |
TRAIL-activated apoptotic signaling pathway(GO:0036462) |
| 0.1 |
0.9 |
GO:0051156 |
glucose 6-phosphate metabolic process(GO:0051156) |
| 0.1 |
0.6 |
GO:0007398 |
ectoderm development(GO:0007398) |
| 0.1 |
0.6 |
GO:0006968 |
cellular defense response(GO:0006968) |
| 0.1 |
0.3 |
GO:0014050 |
negative regulation of glutamate secretion(GO:0014050) |
| 0.1 |
0.5 |
GO:0055007 |
cardiac muscle cell differentiation(GO:0055007) |
| 0.1 |
1.4 |
GO:0006099 |
tricarboxylic acid cycle(GO:0006099) |
| 0.1 |
0.2 |
GO:0001844 |
protein insertion into mitochondrial membrane involved in apoptotic signaling pathway(GO:0001844) |
| 0.1 |
1.4 |
GO:0001731 |
formation of translation preinitiation complex(GO:0001731) |
| 0.1 |
0.3 |
GO:0006436 |
tryptophanyl-tRNA aminoacylation(GO:0006436) |
| 0.1 |
0.2 |
GO:0070235 |
regulation of activation-induced cell death of T cells(GO:0070235) |
| 0.1 |
0.7 |
GO:1903298 |
negative regulation of cellular response to hypoxia(GO:1900038) regulation of hypoxia-induced intrinsic apoptotic signaling pathway(GO:1903297) negative regulation of hypoxia-induced intrinsic apoptotic signaling pathway(GO:1903298) intrinsic apoptotic signaling pathway in response to hypoxia(GO:1990144) |
| 0.1 |
0.4 |
GO:0006432 |
phenylalanyl-tRNA aminoacylation(GO:0006432) |
| 0.1 |
0.3 |
GO:0046016 |
regulation of transcription from RNA polymerase II promoter by glucose(GO:0000430) positive regulation of transcription from RNA polymerase II promoter by glucose(GO:0000432) positive regulation of transcription by glucose(GO:0046016) |
| 0.1 |
0.3 |
GO:0032836 |
glomerular basement membrane development(GO:0032836) |
| 0.1 |
3.2 |
GO:0003382 |
epithelial cell morphogenesis(GO:0003382) |
| 0.1 |
0.5 |
GO:0050882 |
voluntary musculoskeletal movement(GO:0050882) |
| 0.1 |
0.3 |
GO:2000767 |
positive regulation of cytoplasmic translation(GO:2000767) |
| 0.1 |
0.6 |
GO:0019532 |
oxalate transport(GO:0019532) |
| 0.1 |
2.7 |
GO:0045746 |
negative regulation of Notch signaling pathway(GO:0045746) |
| 0.1 |
1.5 |
GO:1902042 |
negative regulation of extrinsic apoptotic signaling pathway via death domain receptors(GO:1902042) |
| 0.1 |
0.2 |
GO:0048703 |
embryonic viscerocranium morphogenesis(GO:0048703) |
| 0.1 |
0.4 |
GO:0072369 |
regulation of lipid transport by positive regulation of transcription from RNA polymerase II promoter(GO:0072369) |
| 0.1 |
0.8 |
GO:0006144 |
purine nucleobase metabolic process(GO:0006144) |
| 0.1 |
0.9 |
GO:0000281 |
mitotic cytokinesis(GO:0000281) |
| 0.1 |
0.5 |
GO:0010739 |
positive regulation of protein kinase A signaling(GO:0010739) |
| 0.1 |
0.4 |
GO:0046599 |
regulation of centriole replication(GO:0046599) |
| 0.1 |
0.9 |
GO:0031952 |
regulation of protein autophosphorylation(GO:0031952) |
| 0.1 |
0.9 |
GO:0035721 |
intraciliary retrograde transport(GO:0035721) |
| 0.1 |
0.6 |
GO:0006452 |
translational frameshifting(GO:0006452) positive regulation of translational termination(GO:0045905) |
| 0.1 |
0.8 |
GO:0021678 |
third ventricle development(GO:0021678) |
| 0.1 |
0.3 |
GO:0006556 |
S-adenosylmethionine biosynthetic process(GO:0006556) |
| 0.1 |
0.4 |
GO:0042256 |
mature ribosome assembly(GO:0042256) |
| 0.1 |
0.6 |
GO:0033299 |
secretion of lysosomal enzymes(GO:0033299) |
| 0.1 |
0.5 |
GO:0046037 |
GMP biosynthetic process(GO:0006177) GMP metabolic process(GO:0046037) |
| 0.1 |
0.9 |
GO:0034244 |
negative regulation of transcription elongation from RNA polymerase II promoter(GO:0034244) |
| 0.1 |
0.4 |
GO:0035162 |
embryonic hemopoiesis(GO:0035162) |
| 0.1 |
0.1 |
GO:0042359 |
vitamin D metabolic process(GO:0042359) |
| 0.1 |
2.0 |
GO:0032008 |
positive regulation of TOR signaling(GO:0032008) |
| 0.1 |
0.4 |
GO:0000379 |
tRNA-type intron splice site recognition and cleavage(GO:0000379) |
| 0.1 |
0.3 |
GO:0090073 |
positive regulation of protein homodimerization activity(GO:0090073) |
| 0.1 |
0.3 |
GO:0035574 |
histone H4-K20 demethylation(GO:0035574) |
| 0.1 |
0.6 |
GO:0006103 |
2-oxoglutarate metabolic process(GO:0006103) |
| 0.1 |
0.3 |
GO:0016266 |
O-glycan processing(GO:0016266) |
| 0.1 |
0.4 |
GO:0051152 |
positive regulation of smooth muscle cell differentiation(GO:0051152) |
| 0.1 |
1.1 |
GO:0042255 |
ribosome assembly(GO:0042255) |
| 0.1 |
0.4 |
GO:0010719 |
negative regulation of epithelial to mesenchymal transition(GO:0010719) |
| 0.1 |
0.3 |
GO:0006681 |
galactosylceramide metabolic process(GO:0006681) galactolipid metabolic process(GO:0019374) |
| 0.1 |
1.9 |
GO:0031960 |
response to corticosteroid(GO:0031960) response to glucocorticoid(GO:0051384) |
| 0.1 |
1.3 |
GO:0045838 |
positive regulation of membrane potential(GO:0045838) |
| 0.1 |
0.1 |
GO:1903525 |
regulation of membrane tubulation(GO:1903525) |
| 0.1 |
0.4 |
GO:0032534 |
regulation of microvillus assembly(GO:0032534) |
| 0.1 |
1.2 |
GO:0000186 |
activation of MAPKK activity(GO:0000186) |
| 0.1 |
0.4 |
GO:0033692 |
cellular polysaccharide biosynthetic process(GO:0033692) |
| 0.1 |
0.8 |
GO:0045292 |
mRNA cis splicing, via spliceosome(GO:0045292) |
| 0.1 |
1.1 |
GO:0060765 |
regulation of androgen receptor signaling pathway(GO:0060765) |
| 0.1 |
0.4 |
GO:0019236 |
response to pheromone(GO:0019236) |
| 0.1 |
3.5 |
GO:0043966 |
histone H3 acetylation(GO:0043966) |
| 0.1 |
0.2 |
GO:0003014 |
renal system process(GO:0003014) |
| 0.1 |
3.3 |
GO:0000725 |
double-strand break repair via homologous recombination(GO:0000724) recombinational repair(GO:0000725) |
| 0.1 |
0.6 |
GO:0043923 |
positive regulation by host of viral transcription(GO:0043923) |
| 0.1 |
0.1 |
GO:0098528 |
skeletal muscle fiber differentiation(GO:0098528) |
| 0.1 |
1.0 |
GO:0043984 |
histone H4-K16 acetylation(GO:0043984) |
| 0.1 |
0.5 |
GO:0051418 |
interphase microtubule nucleation by interphase microtubule organizing center(GO:0051415) microtubule nucleation by microtubule organizing center(GO:0051418) |
| 0.1 |
0.6 |
GO:0045672 |
positive regulation of osteoclast differentiation(GO:0045672) |
| 0.1 |
0.4 |
GO:0031047 |
gene silencing by RNA(GO:0031047) |
| 0.1 |
1.5 |
GO:0001656 |
metanephros development(GO:0001656) |
| 0.1 |
2.5 |
GO:0010811 |
positive regulation of cell-substrate adhesion(GO:0010811) |
| 0.1 |
0.4 |
GO:0019370 |
leukotriene biosynthetic process(GO:0019370) |
| 0.1 |
0.5 |
GO:0035561 |
regulation of chromatin binding(GO:0035561) |
| 0.1 |
0.2 |
GO:0006975 |
DNA damage induced protein phosphorylation(GO:0006975) |
| 0.1 |
0.3 |
GO:0006624 |
vacuolar protein processing(GO:0006624) |
| 0.1 |
3.4 |
GO:0006635 |
fatty acid beta-oxidation(GO:0006635) |
| 0.1 |
2.2 |
GO:1902807 |
negative regulation of cell cycle G1/S phase transition(GO:1902807) |
| 0.1 |
6.4 |
GO:0051028 |
mRNA transport(GO:0051028) |
| 0.1 |
0.4 |
GO:0006532 |
aspartate biosynthetic process(GO:0006532) |
| 0.1 |
1.1 |
GO:0006353 |
DNA-templated transcription, termination(GO:0006353) |
| 0.1 |
0.2 |
GO:0015886 |
heme transport(GO:0015886) |
| 0.1 |
0.4 |
GO:0001765 |
membrane raft assembly(GO:0001765) |
| 0.1 |
0.2 |
GO:1902310 |
positive regulation of peptidyl-serine dephosphorylation(GO:1902310) |
| 0.1 |
0.6 |
GO:0010666 |
positive regulation of striated muscle cell apoptotic process(GO:0010663) positive regulation of cardiac muscle cell apoptotic process(GO:0010666) |
| 0.1 |
1.0 |
GO:0035058 |
nonmotile primary cilium assembly(GO:0035058) |
| 0.1 |
0.7 |
GO:0070050 |
neuron cellular homeostasis(GO:0070050) |
| 0.1 |
0.4 |
GO:0006384 |
transcription initiation from RNA polymerase III promoter(GO:0006384) |
| 0.1 |
0.9 |
GO:0000183 |
chromatin silencing at rDNA(GO:0000183) |
| 0.1 |
0.8 |
GO:0048701 |
embryonic cranial skeleton morphogenesis(GO:0048701) |
| 0.1 |
1.0 |
GO:0034314 |
Arp2/3 complex-mediated actin nucleation(GO:0034314) |
| 0.1 |
1.5 |
GO:0070534 |
protein K63-linked ubiquitination(GO:0070534) |
| 0.1 |
0.5 |
GO:0032462 |
regulation of protein homooligomerization(GO:0032462) |
| 0.1 |
1.5 |
GO:0033209 |
tumor necrosis factor-mediated signaling pathway(GO:0033209) |
| 0.1 |
3.4 |
GO:0032543 |
mitochondrial translation(GO:0032543) |
| 0.1 |
0.3 |
GO:0044253 |
positive regulation of collagen metabolic process(GO:0010714) positive regulation of collagen biosynthetic process(GO:0032967) positive regulation of multicellular organismal metabolic process(GO:0044253) |
| 0.1 |
0.2 |
GO:0001991 |
regulation of systemic arterial blood pressure by circulatory renin-angiotensin(GO:0001991) |
| 0.1 |
4.5 |
GO:0006413 |
translational initiation(GO:0006413) |
| 0.1 |
0.2 |
GO:0070213 |
protein auto-ADP-ribosylation(GO:0070213) |
| 0.1 |
0.3 |
GO:0043928 |
exonucleolytic nuclear-transcribed mRNA catabolic process involved in deadenylation-dependent decay(GO:0043928) regulation of ligand-dependent nuclear receptor transcription coactivator activity(GO:2000325) positive regulation of ligand-dependent nuclear receptor transcription coactivator activity(GO:2000327) |
| 0.1 |
1.0 |
GO:0003229 |
ventricular cardiac muscle tissue development(GO:0003229) |
| 0.1 |
1.7 |
GO:2001244 |
positive regulation of intrinsic apoptotic signaling pathway(GO:2001244) |
| 0.1 |
0.7 |
GO:0008535 |
respiratory chain complex IV assembly(GO:0008535) |
| 0.1 |
2.3 |
GO:0043039 |
tRNA aminoacylation for protein translation(GO:0006418) tRNA aminoacylation(GO:0043039) |
| 0.1 |
0.6 |
GO:0060216 |
definitive hemopoiesis(GO:0060216) |
| 0.1 |
1.3 |
GO:0070979 |
protein K11-linked ubiquitination(GO:0070979) |
| 0.1 |
1.2 |
GO:0045739 |
positive regulation of DNA repair(GO:0045739) |
| 0.1 |
0.4 |
GO:0010992 |
ubiquitin homeostasis(GO:0010992) |
| 0.1 |
1.1 |
GO:1902653 |
cholesterol biosynthetic process(GO:0006695) secondary alcohol biosynthetic process(GO:1902653) |
| 0.1 |
0.5 |
GO:0032020 |
ISG15-protein conjugation(GO:0032020) |
| 0.1 |
0.6 |
GO:0001945 |
lymph vessel development(GO:0001945) |
| 0.1 |
0.5 |
GO:0022027 |
interkinetic nuclear migration(GO:0022027) |
| 0.1 |
4.3 |
GO:0010466 |
negative regulation of peptidase activity(GO:0010466) |
| 0.1 |
0.5 |
GO:2001224 |
positive regulation of neuron migration(GO:2001224) |
| 0.1 |
0.6 |
GO:0018126 |
protein hydroxylation(GO:0018126) |
| 0.1 |
0.7 |
GO:0010960 |
magnesium ion homeostasis(GO:0010960) |
| 0.1 |
0.1 |
GO:1990253 |
cellular response to leucine starvation(GO:1990253) |
| 0.1 |
1.5 |
GO:0035914 |
skeletal muscle cell differentiation(GO:0035914) |
| 0.1 |
0.4 |
GO:0009615 |
response to virus(GO:0009615) |
| 0.1 |
0.5 |
GO:0032200 |
telomere maintenance(GO:0000723) telomere organization(GO:0032200) |
| 0.1 |
0.2 |
GO:0071787 |
endoplasmic reticulum tubular network assembly(GO:0071787) |
| 0.1 |
2.0 |
GO:0045454 |
cell redox homeostasis(GO:0045454) |
| 0.1 |
0.9 |
GO:0043171 |
peptide catabolic process(GO:0043171) |
| 0.1 |
0.4 |
GO:0031987 |
locomotion involved in locomotory behavior(GO:0031987) |
| 0.1 |
0.9 |
GO:0006805 |
xenobiotic metabolic process(GO:0006805) |
| 0.1 |
0.6 |
GO:0019368 |
fatty acid elongation, saturated fatty acid(GO:0019367) fatty acid elongation, unsaturated fatty acid(GO:0019368) fatty acid elongation, monounsaturated fatty acid(GO:0034625) fatty acid elongation, polyunsaturated fatty acid(GO:0034626) |
| 0.0 |
0.7 |
GO:0035269 |
protein O-linked mannosylation(GO:0035269) |
| 0.0 |
0.2 |
GO:0018206 |
peptidyl-methionine modification(GO:0018206) |
| 0.0 |
0.3 |
GO:0015879 |
carnitine transport(GO:0015879) |
| 0.0 |
1.0 |
GO:0010718 |
positive regulation of epithelial to mesenchymal transition(GO:0010718) |
| 0.0 |
0.5 |
GO:0015858 |
nucleoside transport(GO:0015858) |
| 0.0 |
0.8 |
GO:0046677 |
response to antibiotic(GO:0046677) |
| 0.0 |
0.4 |
GO:0006516 |
glycoprotein catabolic process(GO:0006516) |
| 0.0 |
0.2 |
GO:0010717 |
regulation of epithelial to mesenchymal transition(GO:0010717) |
| 0.0 |
0.4 |
GO:0090201 |
negative regulation of release of cytochrome c from mitochondria(GO:0090201) |
| 0.0 |
0.4 |
GO:0042790 |
transcription of nuclear large rRNA transcript from RNA polymerase I promoter(GO:0042790) |
| 0.0 |
0.2 |
GO:0030644 |
cellular chloride ion homeostasis(GO:0030644) |
| 0.0 |
0.1 |
GO:0000393 |
spliceosomal conformational changes to generate catalytic conformation(GO:0000393) |
| 0.0 |
0.3 |
GO:0034587 |
piRNA metabolic process(GO:0034587) |
| 0.0 |
0.2 |
GO:0071712 |
ER-associated misfolded protein catabolic process(GO:0071712) |
| 0.0 |
0.3 |
GO:1903755 |
regulation of SUMO transferase activity(GO:1903182) positive regulation of SUMO transferase activity(GO:1903755) |
| 0.0 |
0.1 |
GO:0046022 |
regulation of transcription from RNA polymerase II promoter, mitotic(GO:0046021) positive regulation of transcription from RNA polymerase II promoter during mitosis(GO:0046022) |
| 0.0 |
0.4 |
GO:1903077 |
negative regulation of protein localization to plasma membrane(GO:1903077) negative regulation of protein localization to cell periphery(GO:1904376) |
| 0.0 |
0.5 |
GO:1902235 |
regulation of endoplasmic reticulum stress-induced intrinsic apoptotic signaling pathway(GO:1902235) |
| 0.0 |
0.3 |
GO:0060716 |
labyrinthine layer blood vessel development(GO:0060716) |
| 0.0 |
0.5 |
GO:0048025 |
negative regulation of mRNA splicing, via spliceosome(GO:0048025) |
| 0.0 |
0.1 |
GO:0036336 |
dendritic cell migration(GO:0036336) |
| 0.0 |
1.2 |
GO:0002181 |
cytoplasmic translation(GO:0002181) |
| 0.0 |
0.3 |
GO:0045840 |
positive regulation of mitotic nuclear division(GO:0045840) |
| 0.0 |
0.2 |
GO:0032515 |
negative regulation of phosphoprotein phosphatase activity(GO:0032515) |
| 0.0 |
0.5 |
GO:0002526 |
acute inflammatory response(GO:0002526) |
| 0.0 |
0.4 |
GO:0015936 |
coenzyme A metabolic process(GO:0015936) |
| 0.0 |
0.8 |
GO:0070613 |
regulation of protein processing(GO:0070613) |
| 0.0 |
0.2 |
GO:2000249 |
regulation of actin cytoskeleton reorganization(GO:2000249) |
| 0.0 |
0.4 |
GO:0009649 |
entrainment of circadian clock(GO:0009649) |
| 0.0 |
0.3 |
GO:0018344 |
protein geranylgeranylation(GO:0018344) |
| 0.0 |
3.0 |
GO:0007160 |
cell-matrix adhesion(GO:0007160) |
| 0.0 |
0.3 |
GO:0006686 |
sphingomyelin biosynthetic process(GO:0006686) |
| 0.0 |
0.3 |
GO:0008340 |
determination of adult lifespan(GO:0008340) |
| 0.0 |
0.2 |
GO:0035542 |
regulation of SNARE complex assembly(GO:0035542) |
| 0.0 |
0.3 |
GO:0030510 |
regulation of BMP signaling pathway(GO:0030510) |
| 0.0 |
0.1 |
GO:0030813 |
positive regulation of nucleotide catabolic process(GO:0030813) positive regulation of glycolytic process(GO:0045821) positive regulation of cofactor metabolic process(GO:0051194) positive regulation of coenzyme metabolic process(GO:0051197) |
| 0.0 |
0.3 |
GO:1901409 |
regulation of phosphorylation of RNA polymerase II C-terminal domain(GO:1901407) positive regulation of phosphorylation of RNA polymerase II C-terminal domain(GO:1901409) |
| 0.0 |
0.4 |
GO:0007094 |
mitotic spindle assembly checkpoint(GO:0007094) spindle assembly checkpoint(GO:0071173) |
| 0.0 |
0.3 |
GO:0035886 |
vascular smooth muscle cell differentiation(GO:0035886) |
| 0.0 |
0.2 |
GO:0002566 |
somatic diversification of immune receptors via somatic mutation(GO:0002566) somatic hypermutation of immunoglobulin genes(GO:0016446) |
| 0.0 |
0.7 |
GO:2000045 |
regulation of G1/S transition of mitotic cell cycle(GO:2000045) |
| 0.0 |
0.2 |
GO:0090306 |
spindle assembly involved in meiosis(GO:0090306) |
| 0.0 |
0.1 |
GO:1902035 |
regulation of hematopoietic stem cell proliferation(GO:1902033) positive regulation of hematopoietic stem cell proliferation(GO:1902035) |
| 0.0 |
0.2 |
GO:0051601 |
exocyst localization(GO:0051601) |
| 0.0 |
0.1 |
GO:2000416 |
regulation of eosinophil migration(GO:2000416) positive regulation of eosinophil migration(GO:2000418) |
| 0.0 |
0.2 |
GO:0035584 |
calcium-mediated signaling using intracellular calcium source(GO:0035584) |
| 0.0 |
0.3 |
GO:0006390 |
transcription from mitochondrial promoter(GO:0006390) |
| 0.0 |
0.4 |
GO:0019369 |
arachidonic acid metabolic process(GO:0019369) |
| 0.0 |
0.4 |
GO:0032981 |
NADH dehydrogenase complex assembly(GO:0010257) mitochondrial respiratory chain complex I assembly(GO:0032981) mitochondrial respiratory chain complex I biogenesis(GO:0097031) |
| 0.0 |
0.2 |
GO:1904668 |
positive regulation of ubiquitin protein ligase activity(GO:1904668) |
| 0.0 |
0.3 |
GO:0006379 |
mRNA cleavage(GO:0006379) |
| 0.0 |
0.7 |
GO:0006284 |
base-excision repair(GO:0006284) |
| 0.0 |
0.7 |
GO:0032922 |
circadian regulation of gene expression(GO:0032922) |
| 0.0 |
0.6 |
GO:0048146 |
positive regulation of fibroblast proliferation(GO:0048146) |
| 0.0 |
0.2 |
GO:0019262 |
N-acetylneuraminate catabolic process(GO:0019262) |
| 0.0 |
0.2 |
GO:1901992 |
positive regulation of mitotic cell cycle phase transition(GO:1901992) |
| 0.0 |
0.2 |
GO:0071318 |
cellular response to ATP(GO:0071318) |
| 0.0 |
1.2 |
GO:0061077 |
chaperone-mediated protein folding(GO:0061077) |
| 0.0 |
0.3 |
GO:0007190 |
activation of adenylate cyclase activity(GO:0007190) |
| 0.0 |
0.1 |
GO:1902261 |
positive regulation of delayed rectifier potassium channel activity(GO:1902261) positive regulation of voltage-gated potassium channel activity(GO:1903818) |
| 0.0 |
0.1 |
GO:0045040 |
outer mitochondrial membrane organization(GO:0007008) protein import into mitochondrial outer membrane(GO:0045040) |
| 0.0 |
0.3 |
GO:0035518 |
histone H2A monoubiquitination(GO:0035518) |
| 0.0 |
0.1 |
GO:0032485 |
regulation of Ral protein signal transduction(GO:0032485) |
| 0.0 |
0.7 |
GO:0006376 |
mRNA splice site selection(GO:0006376) |
| 0.0 |
1.3 |
GO:0002244 |
hematopoietic progenitor cell differentiation(GO:0002244) |
| 0.0 |
0.3 |
GO:0051225 |
spindle assembly(GO:0051225) |
| 0.0 |
0.2 |
GO:0006474 |
N-terminal protein amino acid acetylation(GO:0006474) |
| 0.0 |
0.7 |
GO:0070936 |
protein K48-linked ubiquitination(GO:0070936) |
| 0.0 |
2.4 |
GO:0042254 |
ribosome biogenesis(GO:0042254) |
| 0.0 |
2.0 |
GO:0006338 |
chromatin remodeling(GO:0006338) |
| 0.0 |
0.2 |
GO:2000251 |
positive regulation of actin cytoskeleton reorganization(GO:2000251) |
| 0.0 |
0.2 |
GO:0006614 |
SRP-dependent cotranslational protein targeting to membrane(GO:0006614) |
| 0.0 |
0.1 |
GO:0009992 |
cellular water homeostasis(GO:0009992) |
| 0.0 |
0.0 |
GO:0030321 |
transepithelial chloride transport(GO:0030321) |
| 0.0 |
0.4 |
GO:0046856 |
phosphatidylinositol dephosphorylation(GO:0046856) |
| 0.0 |
0.2 |
GO:0003301 |
physiological muscle hypertrophy(GO:0003298) physiological cardiac muscle hypertrophy(GO:0003301) cell growth involved in cardiac muscle cell development(GO:0061049) |
| 0.0 |
0.1 |
GO:0070207 |
protein homotrimerization(GO:0070207) |
| 0.0 |
0.2 |
GO:0000245 |
spliceosomal complex assembly(GO:0000245) |
| 0.0 |
0.1 |
GO:1902287 |
semaphorin-plexin signaling pathway involved in axon guidance(GO:1902287) |
| 0.0 |
0.2 |
GO:0048678 |
response to axon injury(GO:0048678) |
| 0.0 |
0.1 |
GO:0018002 |
N-terminal peptidyl-serine acetylation(GO:0017198) N-terminal peptidyl-glutamic acid acetylation(GO:0018002) peptidyl-serine acetylation(GO:0030920) |
| 0.0 |
0.2 |
GO:1990126 |
retrograde transport, endosome to plasma membrane(GO:1990126) |
| 0.0 |
0.3 |
GO:0071108 |
protein K48-linked deubiquitination(GO:0071108) |
| 0.0 |
0.0 |
GO:0043162 |
ubiquitin-dependent protein catabolic process via the multivesicular body sorting pathway(GO:0043162) |
| 0.0 |
0.6 |
GO:0042742 |
defense response to bacterium(GO:0042742) |
| 0.0 |
0.8 |
GO:0042594 |
response to starvation(GO:0042594) |
| 0.0 |
0.0 |
GO:0006027 |
glycosaminoglycan catabolic process(GO:0006027) |
| 0.0 |
0.0 |
GO:0002315 |
marginal zone B cell differentiation(GO:0002315) |
| 0.0 |
0.3 |
GO:0035329 |
hippo signaling(GO:0035329) |
| 0.0 |
0.5 |
GO:0042060 |
wound healing(GO:0042060) |
| 0.0 |
0.1 |
GO:0009249 |
protein lipoylation(GO:0009249) |
| 0.0 |
0.9 |
GO:0008033 |
tRNA processing(GO:0008033) |
| 0.0 |
0.4 |
GO:0007052 |
mitotic spindle organization(GO:0007052) |
| 0.0 |
0.2 |
GO:0048821 |
erythrocyte development(GO:0048821) |
| 0.0 |
0.1 |
GO:0034498 |
early endosome to Golgi transport(GO:0034498) |
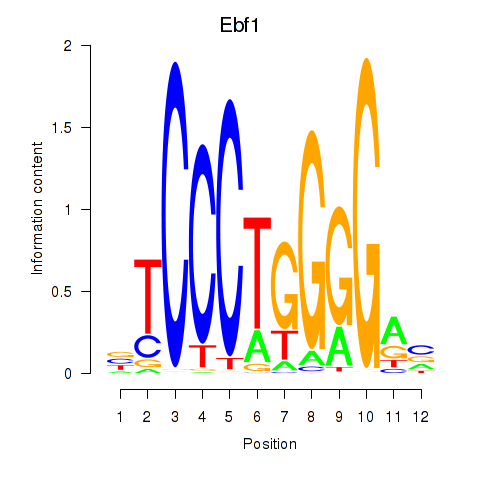

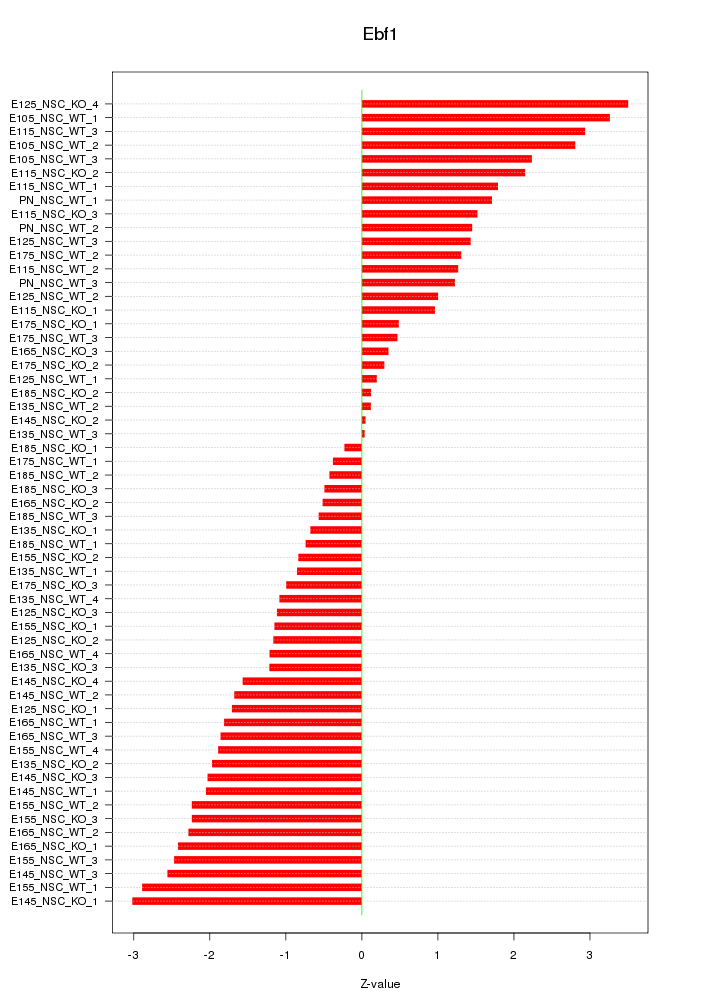

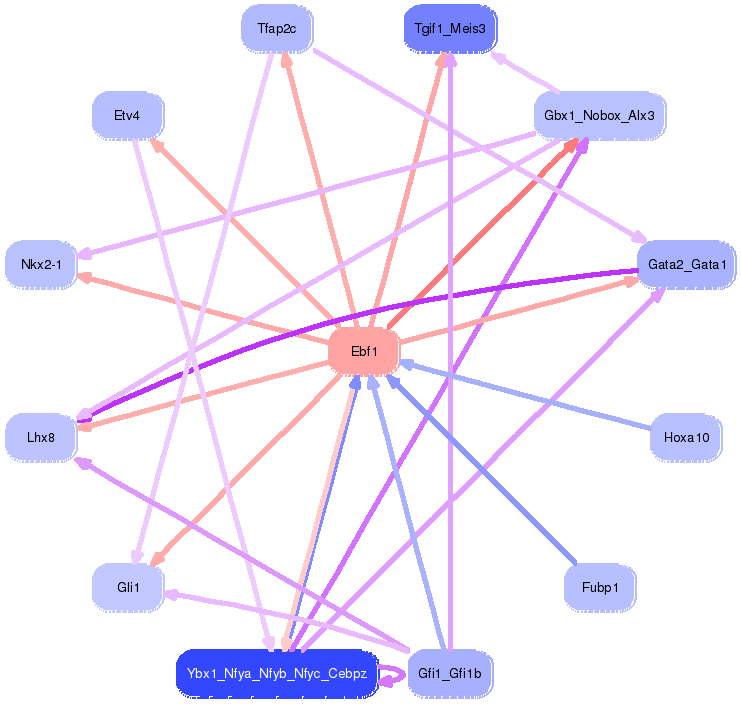