| 9.8 |
49.1 |
GO:0015671 |
oxygen transport(GO:0015671) |
| 3.7 |
11.2 |
GO:0072076 |
nephrogenic mesenchyme development(GO:0072076) |
| 3.0 |
9.0 |
GO:0061537 |
glycine secretion(GO:0061536) glycine secretion, neurotransmission(GO:0061537) |
| 2.6 |
7.9 |
GO:2001139 |
negative regulation of postsynaptic membrane organization(GO:1901627) negative regulation of dendritic spine maintenance(GO:1902951) negative regulation of phospholipid efflux(GO:1902999) regulation of lipid transport across blood brain barrier(GO:1903000) negative regulation of lipid transport across blood brain barrier(GO:1903001) positive regulation of lipid transport across blood brain barrier(GO:1903002) negative regulation of phospholipid transport(GO:2001139) |
| 2.1 |
2.1 |
GO:1903181 |
regulation of dopamine biosynthetic process(GO:1903179) positive regulation of dopamine biosynthetic process(GO:1903181) |
| 1.8 |
5.4 |
GO:0060596 |
mammary placode formation(GO:0060596) |
| 1.8 |
5.3 |
GO:1903795 |
regulation of inorganic anion transmembrane transport(GO:1903795) |
| 1.7 |
8.7 |
GO:0042637 |
catagen(GO:0042637) |
| 1.7 |
17.3 |
GO:0097421 |
liver regeneration(GO:0097421) |
| 1.7 |
15.5 |
GO:0060770 |
negative regulation of epithelial cell proliferation involved in prostate gland development(GO:0060770) |
| 1.6 |
6.4 |
GO:0032439 |
endosome localization(GO:0032439) |
| 1.5 |
4.5 |
GO:0003100 |
regulation of systemic arterial blood pressure by endothelin(GO:0003100) |
| 1.5 |
1.5 |
GO:0010560 |
positive regulation of glycoprotein biosynthetic process(GO:0010560) |
| 1.5 |
3.0 |
GO:1905005 |
regulation of epithelial to mesenchymal transition involved in endocardial cushion formation(GO:1905005) |
| 1.4 |
5.7 |
GO:0002741 |
positive regulation of cytokine secretion involved in immune response(GO:0002741) |
| 1.4 |
18.1 |
GO:0043589 |
skin morphogenesis(GO:0043589) |
| 1.4 |
4.2 |
GO:0042822 |
vitamin B6 metabolic process(GO:0042816) pyridoxal phosphate metabolic process(GO:0042822) pyridoxal phosphate biosynthetic process(GO:0042823) |
| 1.4 |
2.8 |
GO:1902947 |
regulation of tau-protein kinase activity(GO:1902947) |
| 1.4 |
5.5 |
GO:2000483 |
negative regulation of interleukin-8 secretion(GO:2000483) |
| 1.4 |
5.5 |
GO:0046391 |
5-phosphoribose 1-diphosphate biosynthetic process(GO:0006015) 5-phosphoribose 1-diphosphate metabolic process(GO:0046391) |
| 1.4 |
6.9 |
GO:0046598 |
positive regulation of viral entry into host cell(GO:0046598) |
| 1.3 |
5.3 |
GO:0042167 |
heme catabolic process(GO:0042167) pigment catabolic process(GO:0046149) |
| 1.3 |
4.0 |
GO:0090187 |
positive regulation of pancreatic juice secretion(GO:0090187) |
| 1.3 |
3.8 |
GO:0006167 |
AMP biosynthetic process(GO:0006167) |
| 1.3 |
3.8 |
GO:1903279 |
regulation of calcium:sodium antiporter activity(GO:1903279) |
| 1.3 |
3.8 |
GO:0015889 |
cobalamin transport(GO:0015889) |
| 1.3 |
3.8 |
GO:0046032 |
ADP catabolic process(GO:0046032) |
| 1.3 |
10.0 |
GO:0097460 |
ferrous iron import into cell(GO:0097460) |
| 1.2 |
6.1 |
GO:0070459 |
prolactin secretion(GO:0070459) |
| 1.2 |
4.8 |
GO:0019372 |
lipoxygenase pathway(GO:0019372) |
| 1.2 |
1.2 |
GO:0035799 |
ureter maturation(GO:0035799) |
| 1.2 |
5.9 |
GO:2000255 |
negative regulation of male germ cell proliferation(GO:2000255) |
| 1.2 |
4.7 |
GO:2000823 |
regulation of androgen receptor activity(GO:2000823) |
| 1.1 |
2.3 |
GO:0014846 |
esophagus smooth muscle contraction(GO:0014846) |
| 1.1 |
3.4 |
GO:0071603 |
endothelial cell-cell adhesion(GO:0071603) |
| 1.1 |
7.8 |
GO:0045650 |
negative regulation of macrophage differentiation(GO:0045650) |
| 1.1 |
6.7 |
GO:0032929 |
negative regulation of superoxide anion generation(GO:0032929) |
| 1.1 |
3.3 |
GO:0001803 |
type III hypersensitivity(GO:0001802) regulation of type III hypersensitivity(GO:0001803) positive regulation of type III hypersensitivity(GO:0001805) |
| 1.1 |
3.3 |
GO:2000393 |
negative regulation of lamellipodium morphogenesis(GO:2000393) |
| 1.1 |
4.4 |
GO:0001787 |
natural killer cell proliferation(GO:0001787) |
| 1.1 |
3.2 |
GO:1901552 |
positive regulation of endothelial cell development(GO:1901552) positive regulation of establishment of endothelial barrier(GO:1903142) |
| 1.1 |
3.2 |
GO:0001869 |
regulation of complement activation, lectin pathway(GO:0001868) negative regulation of complement activation, lectin pathway(GO:0001869) |
| 1.0 |
1.0 |
GO:1900020 |
regulation of protein kinase C activity(GO:1900019) positive regulation of protein kinase C activity(GO:1900020) |
| 1.0 |
3.1 |
GO:1902358 |
sulfate transmembrane transport(GO:1902358) |
| 1.0 |
3.1 |
GO:0009193 |
pyrimidine ribonucleoside diphosphate metabolic process(GO:0009193) UDP metabolic process(GO:0046048) |
| 1.0 |
1.0 |
GO:0003162 |
atrioventricular node development(GO:0003162) |
| 1.0 |
3.9 |
GO:0042590 |
antigen processing and presentation of exogenous peptide antigen via MHC class I(GO:0042590) |
| 1.0 |
2.9 |
GO:0010757 |
negative regulation of plasminogen activation(GO:0010757) |
| 1.0 |
2.9 |
GO:0032650 |
regulation of interleukin-1 alpha production(GO:0032650) positive regulation of interleukin-1 alpha production(GO:0032730) interleukin-1 alpha secretion(GO:0050703) |
| 1.0 |
3.8 |
GO:0010813 |
neuropeptide catabolic process(GO:0010813) |
| 1.0 |
2.9 |
GO:0033634 |
positive regulation of cell-cell adhesion mediated by integrin(GO:0033634) |
| 0.9 |
2.8 |
GO:0008582 |
regulation of synaptic growth at neuromuscular junction(GO:0008582) |
| 0.9 |
9.2 |
GO:2001214 |
positive regulation of vasculogenesis(GO:2001214) |
| 0.9 |
2.7 |
GO:0061300 |
cerebellum vasculature development(GO:0061300) |
| 0.9 |
3.6 |
GO:0014012 |
peripheral nervous system axon regeneration(GO:0014012) |
| 0.9 |
0.9 |
GO:1903416 |
response to glycoside(GO:1903416) |
| 0.9 |
3.6 |
GO:0042535 |
positive regulation of tumor necrosis factor biosynthetic process(GO:0042535) |
| 0.9 |
2.7 |
GO:0043181 |
vacuolar sequestering(GO:0043181) |
| 0.9 |
2.6 |
GO:1901420 |
negative regulation of response to alcohol(GO:1901420) |
| 0.9 |
0.9 |
GO:0071107 |
response to parathyroid hormone(GO:0071107) cellular response to parathyroid hormone stimulus(GO:0071374) |
| 0.9 |
3.4 |
GO:0042360 |
vitamin E metabolic process(GO:0042360) |
| 0.9 |
5.1 |
GO:0032346 |
positive regulation of aldosterone metabolic process(GO:0032346) positive regulation of aldosterone biosynthetic process(GO:0032349) |
| 0.8 |
3.4 |
GO:1902512 |
positive regulation of apoptotic DNA fragmentation(GO:1902512) positive regulation of DNA catabolic process(GO:1903626) |
| 0.8 |
3.3 |
GO:0003430 |
growth plate cartilage chondrocyte growth(GO:0003430) |
| 0.8 |
2.5 |
GO:0090202 |
transcriptional activation by promoter-enhancer looping(GO:0071733) gene looping(GO:0090202) dsDNA loop formation(GO:0090579) |
| 0.8 |
3.3 |
GO:0030214 |
hyaluronan catabolic process(GO:0030214) |
| 0.8 |
3.3 |
GO:0043490 |
malate-aspartate shuttle(GO:0043490) |
| 0.8 |
2.4 |
GO:0042560 |
10-formyltetrahydrofolate catabolic process(GO:0009258) folic acid-containing compound catabolic process(GO:0009397) pteridine-containing compound catabolic process(GO:0042560) |
| 0.8 |
2.4 |
GO:0010957 |
negative regulation of vitamin D biosynthetic process(GO:0010957) negative regulation of vitamin metabolic process(GO:0046137) regulation of cell differentiation involved in embryonic placenta development(GO:0060800) |
| 0.8 |
2.4 |
GO:0036233 |
glycine import(GO:0036233) |
| 0.8 |
0.8 |
GO:0072235 |
distal convoluted tubule development(GO:0072025) DCT cell differentiation(GO:0072069) metanephric distal convoluted tubule development(GO:0072221) metanephric distal tubule development(GO:0072235) metanephric DCT cell differentiation(GO:0072240) |
| 0.8 |
4.0 |
GO:0070278 |
extracellular matrix constituent secretion(GO:0070278) |
| 0.8 |
1.6 |
GO:0034372 |
very-low-density lipoprotein particle remodeling(GO:0034372) |
| 0.8 |
2.4 |
GO:0006001 |
fructose catabolic process(GO:0006001) fructose catabolic process to hydroxyacetone phosphate and glyceraldehyde-3-phosphate(GO:0061624) glycolytic process through fructose-1-phosphate(GO:0061625) |
| 0.8 |
3.9 |
GO:0034316 |
negative regulation of Arp2/3 complex-mediated actin nucleation(GO:0034316) |
| 0.8 |
0.8 |
GO:1904152 |
retrograde protein transport, ER to cytosol(GO:0030970) protein exit from endoplasmic reticulum(GO:0032527) regulation of protein exit from endoplasmic reticulum(GO:0070861) negative regulation of protein exit from endoplasmic reticulum(GO:0070862) regulation of retrograde protein transport, ER to cytosol(GO:1904152) negative regulation of retrograde protein transport, ER to cytosol(GO:1904153) |
| 0.8 |
4.7 |
GO:2000672 |
negative regulation of motor neuron apoptotic process(GO:2000672) |
| 0.8 |
5.4 |
GO:0033227 |
dsRNA transport(GO:0033227) |
| 0.8 |
2.3 |
GO:0072223 |
metanephric glomerular mesangium development(GO:0072223) metanephric glomerular mesangial cell proliferation involved in metanephros development(GO:0072262) |
| 0.8 |
2.3 |
GO:1990928 |
response to amino acid starvation(GO:1990928) |
| 0.8 |
3.0 |
GO:0031581 |
hemidesmosome assembly(GO:0031581) |
| 0.7 |
14.9 |
GO:0030212 |
hyaluronan metabolic process(GO:0030212) |
| 0.7 |
2.2 |
GO:1902109 |
negative regulation of mitochondrial membrane permeability involved in apoptotic process(GO:1902109) |
| 0.7 |
0.7 |
GO:0010155 |
regulation of proton transport(GO:0010155) |
| 0.7 |
2.2 |
GO:0045041 |
protein import into mitochondrial intermembrane space(GO:0045041) |
| 0.7 |
4.3 |
GO:0006957 |
complement activation, alternative pathway(GO:0006957) |
| 0.7 |
2.2 |
GO:0009256 |
10-formyltetrahydrofolate metabolic process(GO:0009256) |
| 0.7 |
2.9 |
GO:0010572 |
positive regulation of platelet activation(GO:0010572) |
| 0.7 |
0.7 |
GO:0060994 |
regulation of transcription from RNA polymerase II promoter involved in kidney development(GO:0060994) |
| 0.7 |
7.8 |
GO:2000653 |
regulation of genetic imprinting(GO:2000653) |
| 0.7 |
5.0 |
GO:0031639 |
plasminogen activation(GO:0031639) |
| 0.7 |
4.2 |
GO:0006452 |
translational frameshifting(GO:0006452) positive regulation of translational termination(GO:0045905) |
| 0.7 |
2.8 |
GO:0045112 |
integrin biosynthetic process(GO:0045112) |
| 0.7 |
2.1 |
GO:0090324 |
negative regulation of oxidative phosphorylation(GO:0090324) |
| 0.7 |
2.1 |
GO:0034135 |
regulation of toll-like receptor 2 signaling pathway(GO:0034135) |
| 0.7 |
2.0 |
GO:0042939 |
glutathione transport(GO:0034635) tripeptide transport(GO:0042939) |
| 0.7 |
2.7 |
GO:0051708 |
intracellular transport of viral protein in host cell(GO:0019060) symbiont intracellular protein transport in host(GO:0030581) cytosol to ER transport(GO:0046967) intracellular protein transport in other organism involved in symbiotic interaction(GO:0051708) |
| 0.7 |
1.3 |
GO:0014738 |
regulation of muscle hyperplasia(GO:0014738) muscle hyperplasia(GO:0014900) |
| 0.7 |
0.7 |
GO:0033962 |
cytoplasmic mRNA processing body assembly(GO:0033962) |
| 0.7 |
1.3 |
GO:0036166 |
phenotypic switching(GO:0036166) |
| 0.7 |
9.3 |
GO:0032463 |
negative regulation of protein homooligomerization(GO:0032463) |
| 0.7 |
1.3 |
GO:0035701 |
hematopoietic stem cell migration(GO:0035701) |
| 0.7 |
2.0 |
GO:0015772 |
disaccharide transport(GO:0015766) sucrose transport(GO:0015770) oligosaccharide transport(GO:0015772) |
| 0.7 |
2.0 |
GO:0002606 |
dendritic cell antigen processing and presentation(GO:0002468) regulation of dendritic cell antigen processing and presentation(GO:0002604) positive regulation of dendritic cell antigen processing and presentation(GO:0002606) |
| 0.7 |
2.6 |
GO:0090160 |
Golgi to lysosome transport(GO:0090160) |
| 0.6 |
11.0 |
GO:0042541 |
hemoglobin biosynthetic process(GO:0042541) |
| 0.6 |
1.9 |
GO:0030421 |
defecation(GO:0030421) |
| 0.6 |
3.2 |
GO:2000671 |
regulation of motor neuron apoptotic process(GO:2000671) |
| 0.6 |
0.6 |
GO:0051295 |
establishment of meiotic spindle localization(GO:0051295) |
| 0.6 |
22.1 |
GO:0045746 |
negative regulation of Notch signaling pathway(GO:0045746) |
| 0.6 |
5.0 |
GO:0061436 |
establishment of skin barrier(GO:0061436) |
| 0.6 |
3.1 |
GO:1905098 |
negative regulation of guanyl-nucleotide exchange factor activity(GO:1905098) |
| 0.6 |
1.9 |
GO:0042196 |
dichloromethane metabolic process(GO:0018900) chlorinated hydrocarbon metabolic process(GO:0042196) halogenated hydrocarbon metabolic process(GO:0042197) |
| 0.6 |
3.7 |
GO:0001980 |
regulation of systemic arterial blood pressure by ischemic conditions(GO:0001980) |
| 0.6 |
0.6 |
GO:0001880 |
Mullerian duct regression(GO:0001880) |
| 0.6 |
1.8 |
GO:0070889 |
platelet alpha granule organization(GO:0070889) |
| 0.6 |
1.8 |
GO:0016338 |
calcium-independent cell-cell adhesion via plasma membrane cell-adhesion molecules(GO:0016338) |
| 0.6 |
2.4 |
GO:0035461 |
vitamin transmembrane transport(GO:0035461) |
| 0.6 |
2.4 |
GO:0001920 |
negative regulation of receptor recycling(GO:0001920) |
| 0.6 |
0.6 |
GO:2000097 |
regulation of smooth muscle cell-matrix adhesion(GO:2000097) |
| 0.6 |
0.6 |
GO:0034287 |
detection of carbohydrate stimulus(GO:0009730) detection of hexose stimulus(GO:0009732) detection of monosaccharide stimulus(GO:0034287) detection of glucose(GO:0051594) |
| 0.6 |
1.7 |
GO:0035435 |
phosphate ion transmembrane transport(GO:0035435) |
| 0.6 |
2.3 |
GO:0006432 |
phenylalanyl-tRNA aminoacylation(GO:0006432) |
| 0.6 |
0.6 |
GO:0006982 |
response to lipid hydroperoxide(GO:0006982) |
| 0.6 |
0.6 |
GO:0051639 |
actin filament network formation(GO:0051639) |
| 0.6 |
1.7 |
GO:0019184 |
nonribosomal peptide biosynthetic process(GO:0019184) |
| 0.6 |
1.7 |
GO:0030208 |
dermatan sulfate biosynthetic process(GO:0030208) |
| 0.6 |
1.7 |
GO:0060265 |
positive regulation of respiratory burst involved in inflammatory response(GO:0060265) |
| 0.6 |
1.7 |
GO:2000501 |
natural killer cell chemotaxis(GO:0035747) negative regulation of lymphocyte migration(GO:2000402) regulation of natural killer cell chemotaxis(GO:2000501) |
| 0.6 |
0.6 |
GO:0019401 |
alditol biosynthetic process(GO:0019401) |
| 0.6 |
2.8 |
GO:0046016 |
regulation of transcription from RNA polymerase II promoter by glucose(GO:0000430) positive regulation of transcription from RNA polymerase II promoter by glucose(GO:0000432) positive regulation of transcription by glucose(GO:0046016) |
| 0.5 |
0.5 |
GO:0090403 |
oxidative stress-induced premature senescence(GO:0090403) |
| 0.5 |
1.6 |
GO:0030300 |
regulation of intestinal cholesterol absorption(GO:0030300) |
| 0.5 |
1.1 |
GO:0046618 |
drug export(GO:0046618) |
| 0.5 |
1.1 |
GO:0061484 |
hematopoietic stem cell homeostasis(GO:0061484) |
| 0.5 |
1.6 |
GO:0009298 |
GDP-mannose biosynthetic process(GO:0009298) |
| 0.5 |
8.0 |
GO:0050667 |
homocysteine metabolic process(GO:0050667) |
| 0.5 |
1.1 |
GO:0060744 |
thelarche(GO:0042695) mammary gland branching involved in thelarche(GO:0060744) |
| 0.5 |
1.1 |
GO:0043456 |
regulation of pentose-phosphate shunt(GO:0043456) |
| 0.5 |
3.7 |
GO:1901550 |
regulation of endothelial cell development(GO:1901550) regulation of establishment of endothelial barrier(GO:1903140) |
| 0.5 |
3.1 |
GO:0042866 |
pyruvate biosynthetic process(GO:0042866) |
| 0.5 |
1.6 |
GO:0009051 |
pentose-phosphate shunt, oxidative branch(GO:0009051) |
| 0.5 |
5.7 |
GO:0033623 |
regulation of integrin activation(GO:0033623) |
| 0.5 |
1.6 |
GO:0072531 |
pyrimidine-containing compound transmembrane transport(GO:0072531) |
| 0.5 |
1.6 |
GO:0006526 |
arginine biosynthetic process(GO:0006526) |
| 0.5 |
2.6 |
GO:0001955 |
blood vessel maturation(GO:0001955) |
| 0.5 |
1.5 |
GO:0060821 |
inactivation of X chromosome by DNA methylation(GO:0060821) |
| 0.5 |
1.5 |
GO:0008228 |
opsonization(GO:0008228) |
| 0.5 |
2.0 |
GO:0070358 |
actin polymerization-dependent cell motility(GO:0070358) |
| 0.5 |
1.0 |
GO:1902219 |
regulation of intrinsic apoptotic signaling pathway in response to osmotic stress(GO:1902218) negative regulation of intrinsic apoptotic signaling pathway in response to osmotic stress(GO:1902219) |
| 0.5 |
2.0 |
GO:0046477 |
glycosylceramide catabolic process(GO:0046477) |
| 0.5 |
0.5 |
GO:1902455 |
negative regulation of stem cell population maintenance(GO:1902455) |
| 0.5 |
2.0 |
GO:0070460 |
thyroid-stimulating hormone secretion(GO:0070460) |
| 0.5 |
4.0 |
GO:0044336 |
canonical Wnt signaling pathway involved in negative regulation of apoptotic process(GO:0044336) |
| 0.5 |
1.5 |
GO:1900133 |
renal response to blood flow involved in circulatory renin-angiotensin regulation of systemic arterial blood pressure(GO:0001999) renin secretion into blood stream(GO:0002001) regulation of renin secretion into blood stream(GO:1900133) |
| 0.5 |
2.0 |
GO:0045903 |
positive regulation of translational fidelity(GO:0045903) |
| 0.5 |
1.0 |
GO:1903377 |
negative regulation of oxidative stress-induced neuron intrinsic apoptotic signaling pathway(GO:1903377) |
| 0.5 |
2.5 |
GO:0043314 |
negative regulation of neutrophil degranulation(GO:0043314) negative regulation of blood vessel remodeling(GO:0060313) |
| 0.5 |
1.0 |
GO:0048014 |
Tie signaling pathway(GO:0048014) |
| 0.5 |
1.4 |
GO:0009644 |
response to high light intensity(GO:0009644) |
| 0.5 |
1.4 |
GO:0044339 |
canonical Wnt signaling pathway involved in osteoblast differentiation(GO:0044339) |
| 0.5 |
1.4 |
GO:0007406 |
negative regulation of neuroblast proliferation(GO:0007406) |
| 0.5 |
1.9 |
GO:0046552 |
eye photoreceptor cell fate commitment(GO:0042706) photoreceptor cell fate commitment(GO:0046552) |
| 0.5 |
1.9 |
GO:0018343 |
protein farnesylation(GO:0018343) |
| 0.5 |
1.4 |
GO:0072338 |
creatinine metabolic process(GO:0046449) cellular lactam metabolic process(GO:0072338) |
| 0.5 |
1.9 |
GO:0043461 |
proton-transporting ATP synthase complex assembly(GO:0043461) proton-transporting ATP synthase complex biogenesis(GO:0070272) |
| 0.5 |
0.5 |
GO:0034370 |
triglyceride-rich lipoprotein particle remodeling(GO:0034370) |
| 0.5 |
1.4 |
GO:1903048 |
regulation of acetylcholine-gated cation channel activity(GO:1903048) |
| 0.5 |
19.1 |
GO:0048821 |
erythrocyte development(GO:0048821) |
| 0.5 |
0.9 |
GO:0002295 |
T-helper cell lineage commitment(GO:0002295) |
| 0.5 |
2.3 |
GO:0010624 |
regulation of Schwann cell proliferation(GO:0010624) |
| 0.5 |
1.4 |
GO:1990034 |
calcium ion export from cell(GO:1990034) |
| 0.5 |
0.9 |
GO:0010248 |
B cell negative selection(GO:0002352) establishment or maintenance of transmembrane electrochemical gradient(GO:0010248) |
| 0.5 |
1.4 |
GO:0072204 |
cell-cell signaling involved in kidney development(GO:0060995) Wnt signaling pathway involved in kidney development(GO:0061289) canonical Wnt signaling pathway involved in metanephric kidney development(GO:0061290) cell-cell signaling involved in metanephros development(GO:0072204) |
| 0.5 |
1.4 |
GO:2001015 |
G1 to G0 transition involved in cell differentiation(GO:0070315) negative regulation of skeletal muscle cell differentiation(GO:2001015) |
| 0.5 |
1.4 |
GO:0019676 |
ammonia assimilation cycle(GO:0019676) |
| 0.5 |
2.7 |
GO:0038030 |
non-canonical Wnt signaling pathway via MAPK cascade(GO:0038030) non-canonical Wnt signaling pathway via JNK cascade(GO:0038031) |
| 0.4 |
0.9 |
GO:0009957 |
epidermal cell fate specification(GO:0009957) |
| 0.4 |
3.1 |
GO:0033631 |
cell-cell adhesion mediated by integrin(GO:0033631) |
| 0.4 |
0.9 |
GO:0070625 |
zymogen granule exocytosis(GO:0070625) |
| 0.4 |
1.8 |
GO:0019287 |
isopentenyl diphosphate biosynthetic process(GO:0009240) isopentenyl diphosphate biosynthetic process, mevalonate pathway(GO:0019287) isopentenyl diphosphate metabolic process(GO:0046490) |
| 0.4 |
0.9 |
GO:0048597 |
post-embryonic camera-type eye morphogenesis(GO:0048597) |
| 0.4 |
1.3 |
GO:0046416 |
D-amino acid catabolic process(GO:0019478) D-amino acid metabolic process(GO:0046416) |
| 0.4 |
1.3 |
GO:0002484 |
antigen processing and presentation of endogenous peptide antigen via MHC class I via ER pathway(GO:0002484) antigen processing and presentation of endogenous peptide antigen via MHC class I via ER pathway, TAP-dependent(GO:0002485) |
| 0.4 |
4.9 |
GO:0071578 |
zinc II ion transmembrane import(GO:0071578) |
| 0.4 |
1.8 |
GO:0051541 |
elastin metabolic process(GO:0051541) |
| 0.4 |
0.9 |
GO:0002765 |
immune response-inhibiting signal transduction(GO:0002765) |
| 0.4 |
4.3 |
GO:0006120 |
mitochondrial electron transport, NADH to ubiquinone(GO:0006120) |
| 0.4 |
3.8 |
GO:0033622 |
integrin activation(GO:0033622) |
| 0.4 |
2.1 |
GO:0009313 |
oligosaccharide catabolic process(GO:0009313) |
| 0.4 |
0.4 |
GO:0030223 |
neutrophil differentiation(GO:0030223) |
| 0.4 |
2.1 |
GO:0045347 |
negative regulation of MHC class II biosynthetic process(GO:0045347) |
| 0.4 |
1.7 |
GO:1903011 |
negative regulation of bone development(GO:1903011) |
| 0.4 |
2.5 |
GO:0032782 |
bile acid secretion(GO:0032782) |
| 0.4 |
2.5 |
GO:0006108 |
malate metabolic process(GO:0006108) |
| 0.4 |
1.2 |
GO:0097368 |
establishment of Sertoli cell barrier(GO:0097368) |
| 0.4 |
0.4 |
GO:0060155 |
platelet dense granule organization(GO:0060155) |
| 0.4 |
0.8 |
GO:0010958 |
regulation of amino acid import(GO:0010958) regulation of L-arginine import(GO:0010963) |
| 0.4 |
1.6 |
GO:0071104 |
response to interleukin-9(GO:0071104) |
| 0.4 |
1.6 |
GO:0002036 |
regulation of L-glutamate transport(GO:0002036) |
| 0.4 |
1.2 |
GO:0097402 |
regulation of neural retina development(GO:0061074) neuroblast migration(GO:0097402) |
| 0.4 |
1.2 |
GO:0015721 |
bile acid and bile salt transport(GO:0015721) |
| 0.4 |
1.5 |
GO:0033580 |
protein glycosylation at cell surface(GO:0033575) protein galactosylation at cell surface(GO:0033580) protein galactosylation(GO:0042125) |
| 0.4 |
1.5 |
GO:0010815 |
bradykinin catabolic process(GO:0010815) |
| 0.4 |
0.4 |
GO:2000668 |
dendritic cell apoptotic process(GO:0097048) regulation of dendritic cell apoptotic process(GO:2000668) |
| 0.4 |
0.4 |
GO:2000508 |
regulation of dendritic cell chemotaxis(GO:2000508) positive regulation of dendritic cell chemotaxis(GO:2000510) |
| 0.4 |
1.1 |
GO:0001193 |
maintenance of transcriptional fidelity during DNA-templated transcription elongation(GO:0001192) maintenance of transcriptional fidelity during DNA-templated transcription elongation from RNA polymerase II promoter(GO:0001193) |
| 0.4 |
1.9 |
GO:2000491 |
positive regulation of hepatic stellate cell activation(GO:2000491) |
| 0.4 |
1.1 |
GO:0042732 |
D-xylose metabolic process(GO:0042732) |
| 0.4 |
1.1 |
GO:1905049 |
negative regulation of metalloendopeptidase activity(GO:1904684) negative regulation of metallopeptidase activity(GO:1905049) |
| 0.4 |
0.7 |
GO:0044351 |
macropinocytosis(GO:0044351) |
| 0.4 |
1.9 |
GO:2000680 |
regulation of rubidium ion transport(GO:2000680) |
| 0.4 |
2.6 |
GO:0045647 |
negative regulation of erythrocyte differentiation(GO:0045647) |
| 0.4 |
2.6 |
GO:0007342 |
fusion of sperm to egg plasma membrane(GO:0007342) |
| 0.4 |
6.6 |
GO:0043537 |
negative regulation of blood vessel endothelial cell migration(GO:0043537) |
| 0.4 |
0.7 |
GO:0034196 |
acylglycerol transport(GO:0034196) triglyceride transport(GO:0034197) |
| 0.4 |
1.1 |
GO:0009174 |
UMP biosynthetic process(GO:0006222) pyrimidine ribonucleoside monophosphate metabolic process(GO:0009173) pyrimidine ribonucleoside monophosphate biosynthetic process(GO:0009174) UMP metabolic process(GO:0046049) |
| 0.4 |
0.7 |
GO:0003433 |
chondrocyte development involved in endochondral bone morphogenesis(GO:0003433) |
| 0.4 |
1.4 |
GO:0035590 |
purinergic nucleotide receptor signaling pathway(GO:0035590) |
| 0.4 |
1.8 |
GO:0009125 |
nucleoside monophosphate catabolic process(GO:0009125) |
| 0.3 |
1.4 |
GO:0031118 |
rRNA pseudouridine synthesis(GO:0031118) |
| 0.3 |
0.7 |
GO:0046122 |
purine deoxyribonucleoside metabolic process(GO:0046122) guanosine-containing compound catabolic process(GO:1901069) |
| 0.3 |
0.3 |
GO:2000811 |
negative regulation of anoikis(GO:2000811) |
| 0.3 |
2.1 |
GO:0033353 |
S-adenosylmethionine cycle(GO:0033353) |
| 0.3 |
7.5 |
GO:0002474 |
antigen processing and presentation of peptide antigen via MHC class I(GO:0002474) |
| 0.3 |
2.0 |
GO:0035999 |
tetrahydrofolate interconversion(GO:0035999) |
| 0.3 |
12.6 |
GO:0000038 |
very long-chain fatty acid metabolic process(GO:0000038) |
| 0.3 |
0.3 |
GO:0042270 |
protection from natural killer cell mediated cytotoxicity(GO:0042270) |
| 0.3 |
3.4 |
GO:0090385 |
phagosome-lysosome fusion(GO:0090385) |
| 0.3 |
1.0 |
GO:0035989 |
tendon development(GO:0035989) |
| 0.3 |
1.0 |
GO:0046133 |
pyrimidine ribonucleoside catabolic process(GO:0046133) |
| 0.3 |
2.4 |
GO:0032790 |
ribosome disassembly(GO:0032790) |
| 0.3 |
1.4 |
GO:0039703 |
viral RNA genome replication(GO:0039694) RNA replication(GO:0039703) |
| 0.3 |
3.0 |
GO:2000467 |
positive regulation of glycogen (starch) synthase activity(GO:2000467) |
| 0.3 |
0.7 |
GO:0075136 |
response to defenses of other organism involved in symbiotic interaction(GO:0052173) response to host defenses(GO:0052200) response to host(GO:0075136) |
| 0.3 |
1.3 |
GO:0034975 |
protein folding in endoplasmic reticulum(GO:0034975) |
| 0.3 |
3.0 |
GO:0019800 |
peptide cross-linking via chondroitin 4-sulfate glycosaminoglycan(GO:0019800) |
| 0.3 |
3.3 |
GO:0006122 |
mitochondrial electron transport, ubiquinol to cytochrome c(GO:0006122) |
| 0.3 |
1.0 |
GO:1903525 |
regulation of membrane tubulation(GO:1903525) |
| 0.3 |
5.5 |
GO:0006465 |
signal peptide processing(GO:0006465) |
| 0.3 |
6.2 |
GO:0000028 |
ribosomal small subunit assembly(GO:0000028) |
| 0.3 |
0.7 |
GO:0002901 |
mature B cell apoptotic process(GO:0002901) regulation of mature B cell apoptotic process(GO:0002905) negative regulation of mature B cell apoptotic process(GO:0002906) |
| 0.3 |
1.6 |
GO:0019659 |
lactate biosynthetic process from pyruvate(GO:0019244) lactate biosynthetic process(GO:0019249) glucose catabolic process to lactate(GO:0019659) glycolytic fermentation(GO:0019660) glucose catabolic process to lactate via pyruvate(GO:0019661) |
| 0.3 |
1.0 |
GO:0006553 |
lysine metabolic process(GO:0006553) |
| 0.3 |
1.0 |
GO:0034476 |
U1 snRNA 3'-end processing(GO:0034473) U5 snRNA 3'-end processing(GO:0034476) |
| 0.3 |
1.3 |
GO:0061526 |
acetylcholine secretion, neurotransmission(GO:0014055) regulation of acetylcholine secretion, neurotransmission(GO:0014056) acetylcholine secretion(GO:0061526) |
| 0.3 |
2.9 |
GO:0006071 |
glycerol metabolic process(GO:0006071) |
| 0.3 |
0.6 |
GO:0006573 |
valine metabolic process(GO:0006573) |
| 0.3 |
6.0 |
GO:0003416 |
endochondral bone growth(GO:0003416) |
| 0.3 |
2.8 |
GO:0009404 |
toxin metabolic process(GO:0009404) |
| 0.3 |
2.2 |
GO:0015808 |
L-alanine transport(GO:0015808) |
| 0.3 |
0.6 |
GO:0042636 |
negative regulation of hair cycle(GO:0042636) negative regulation of hair follicle development(GO:0051799) |
| 0.3 |
0.3 |
GO:0001788 |
antibody-dependent cellular cytotoxicity(GO:0001788) |
| 0.3 |
1.6 |
GO:0070327 |
thyroid hormone transport(GO:0070327) |
| 0.3 |
1.2 |
GO:0051305 |
chromosome movement towards spindle pole(GO:0051305) |
| 0.3 |
0.9 |
GO:0002184 |
cytoplasmic translational termination(GO:0002184) |
| 0.3 |
3.1 |
GO:0048386 |
positive regulation of retinoic acid receptor signaling pathway(GO:0048386) |
| 0.3 |
0.6 |
GO:0071673 |
positive regulation of smooth muscle cell chemotaxis(GO:0071673) |
| 0.3 |
3.7 |
GO:0033690 |
positive regulation of osteoblast proliferation(GO:0033690) |
| 0.3 |
0.9 |
GO:0032474 |
otolith morphogenesis(GO:0032474) |
| 0.3 |
0.3 |
GO:0048294 |
negative regulation of isotype switching(GO:0045829) negative regulation of isotype switching to IgE isotypes(GO:0048294) |
| 0.3 |
1.2 |
GO:0043415 |
positive regulation of skeletal muscle tissue regeneration(GO:0043415) |
| 0.3 |
0.6 |
GO:0031953 |
negative regulation of protein autophosphorylation(GO:0031953) |
| 0.3 |
0.9 |
GO:0001580 |
detection of chemical stimulus involved in sensory perception of bitter taste(GO:0001580) |
| 0.3 |
3.0 |
GO:0060294 |
cilium movement involved in cell motility(GO:0060294) |
| 0.3 |
0.9 |
GO:0001890 |
placenta development(GO:0001890) |
| 0.3 |
0.9 |
GO:0038165 |
oncostatin-M-mediated signaling pathway(GO:0038165) |
| 0.3 |
0.9 |
GO:0015938 |
coenzyme A catabolic process(GO:0015938) nucleoside bisphosphate catabolic process(GO:0033869) ribonucleoside bisphosphate catabolic process(GO:0034031) purine nucleoside bisphosphate catabolic process(GO:0034034) |
| 0.3 |
0.3 |
GO:0030071 |
regulation of mitotic metaphase/anaphase transition(GO:0030071) regulation of metaphase/anaphase transition of cell cycle(GO:1902099) |
| 0.3 |
0.9 |
GO:0048211 |
Golgi vesicle docking(GO:0048211) |
| 0.3 |
2.1 |
GO:0032264 |
IMP salvage(GO:0032264) |
| 0.3 |
2.1 |
GO:0035814 |
negative regulation of renal sodium excretion(GO:0035814) |
| 0.3 |
1.8 |
GO:0045056 |
transcytosis(GO:0045056) |
| 0.3 |
0.6 |
GO:0060033 |
anatomical structure regression(GO:0060033) |
| 0.3 |
1.2 |
GO:2000525 |
regulation of T cell costimulation(GO:2000523) positive regulation of T cell costimulation(GO:2000525) |
| 0.3 |
0.9 |
GO:0030046 |
parallel actin filament bundle assembly(GO:0030046) |
| 0.3 |
0.9 |
GO:0055012 |
ventricular cardiac muscle cell differentiation(GO:0055012) |
| 0.3 |
1.2 |
GO:0015871 |
choline transport(GO:0015871) |
| 0.3 |
0.9 |
GO:0035606 |
peptidyl-cysteine S-trans-nitrosylation(GO:0035606) |
| 0.3 |
1.2 |
GO:1904426 |
positive regulation of GTP binding(GO:1904426) regulation of hydrogen:potassium-exchanging ATPase activity(GO:1904451) positive regulation of hydrogen:potassium-exchanging ATPase activity(GO:1904453) |
| 0.3 |
1.8 |
GO:0035988 |
chondrocyte proliferation(GO:0035988) |
| 0.3 |
1.5 |
GO:0090038 |
negative regulation of protein kinase C signaling(GO:0090038) |
| 0.3 |
6.2 |
GO:0031115 |
negative regulation of microtubule polymerization(GO:0031115) |
| 0.3 |
4.1 |
GO:0050965 |
detection of temperature stimulus involved in sensory perception(GO:0050961) detection of temperature stimulus involved in sensory perception of pain(GO:0050965) |
| 0.3 |
1.5 |
GO:0006685 |
sphingomyelin catabolic process(GO:0006685) |
| 0.3 |
1.2 |
GO:0018242 |
protein O-linked glycosylation via serine(GO:0018242) |
| 0.3 |
0.9 |
GO:0000087 |
mitotic M phase(GO:0000087) |
| 0.3 |
0.6 |
GO:0045656 |
negative regulation of monocyte differentiation(GO:0045656) |
| 0.3 |
0.9 |
GO:1904177 |
regulation of adipose tissue development(GO:1904177) |
| 0.3 |
1.1 |
GO:0061304 |
retinal blood vessel morphogenesis(GO:0061304) |
| 0.3 |
0.9 |
GO:0015886 |
heme transport(GO:0015886) |
| 0.3 |
2.3 |
GO:0030206 |
chondroitin sulfate biosynthetic process(GO:0030206) |
| 0.3 |
2.9 |
GO:0030238 |
male sex determination(GO:0030238) |
| 0.3 |
1.7 |
GO:0044034 |
negative stranded viral RNA replication(GO:0039689) multi-organism biosynthetic process(GO:0044034) |
| 0.3 |
2.3 |
GO:0042775 |
mitochondrial ATP synthesis coupled electron transport(GO:0042775) |
| 0.3 |
1.1 |
GO:2000002 |
negative regulation of DNA damage checkpoint(GO:2000002) |
| 0.3 |
1.1 |
GO:0010668 |
ectodermal cell differentiation(GO:0010668) |
| 0.3 |
0.8 |
GO:0060742 |
epithelial cell differentiation involved in prostate gland development(GO:0060742) |
| 0.3 |
0.8 |
GO:0016256 |
N-glycan processing to lysosome(GO:0016256) |
| 0.3 |
0.8 |
GO:0048388 |
endosomal lumen acidification(GO:0048388) |
| 0.3 |
0.8 |
GO:0015014 |
heparan sulfate proteoglycan biosynthetic process, polysaccharide chain biosynthetic process(GO:0015014) |
| 0.3 |
1.1 |
GO:0070858 |
negative regulation of bile acid biosynthetic process(GO:0070858) negative regulation of bile acid metabolic process(GO:1904252) |
| 0.3 |
1.1 |
GO:0046836 |
glycolipid transport(GO:0046836) |
| 0.3 |
0.8 |
GO:2000256 |
positive regulation of male germ cell proliferation(GO:2000256) |
| 0.3 |
3.9 |
GO:0030150 |
protein import into mitochondrial matrix(GO:0030150) |
| 0.3 |
0.3 |
GO:0000291 |
nuclear-transcribed mRNA catabolic process, exonucleolytic(GO:0000291) |
| 0.3 |
1.1 |
GO:0036089 |
cleavage furrow formation(GO:0036089) |
| 0.3 |
1.9 |
GO:0051770 |
positive regulation of nitric-oxide synthase biosynthetic process(GO:0051770) |
| 0.3 |
3.0 |
GO:0060391 |
positive regulation of SMAD protein import into nucleus(GO:0060391) |
| 0.3 |
0.8 |
GO:0006103 |
2-oxoglutarate metabolic process(GO:0006103) |
| 0.3 |
0.8 |
GO:0019042 |
viral latency(GO:0019042) |
| 0.3 |
1.9 |
GO:0016139 |
glycoside catabolic process(GO:0016139) |
| 0.3 |
6.8 |
GO:0036075 |
endochondral ossification(GO:0001958) replacement ossification(GO:0036075) |
| 0.3 |
0.5 |
GO:0048050 |
post-embryonic eye morphogenesis(GO:0048050) |
| 0.3 |
0.8 |
GO:1900864 |
mitochondrial tRNA modification(GO:0070900) mitochondrial RNA modification(GO:1900864) |
| 0.3 |
2.4 |
GO:0000188 |
inactivation of MAPK activity(GO:0000188) |
| 0.3 |
1.3 |
GO:0060528 |
secretory columnal luminar epithelial cell differentiation involved in prostate glandular acinus development(GO:0060528) |
| 0.3 |
0.3 |
GO:1902861 |
copper ion import into cell(GO:1902861) |
| 0.3 |
0.5 |
GO:0030202 |
heparin metabolic process(GO:0030202) heparin biosynthetic process(GO:0030210) |
| 0.3 |
1.1 |
GO:0043985 |
histone H4-R3 methylation(GO:0043985) |
| 0.3 |
0.8 |
GO:0014022 |
neural plate elongation(GO:0014022) convergent extension involved in neural plate elongation(GO:0022007) |
| 0.3 |
0.5 |
GO:0070827 |
chromatin maintenance(GO:0070827) |
| 0.3 |
1.3 |
GO:2001269 |
positive regulation of cysteine-type endopeptidase activity involved in apoptotic signaling pathway(GO:2001269) |
| 0.3 |
1.6 |
GO:0046415 |
urate metabolic process(GO:0046415) |
| 0.3 |
2.6 |
GO:0048311 |
mitochondrion distribution(GO:0048311) |
| 0.3 |
3.4 |
GO:0042407 |
cristae formation(GO:0042407) |
| 0.3 |
1.8 |
GO:0033008 |
positive regulation of mast cell activation involved in immune response(GO:0033008) positive regulation of mast cell degranulation(GO:0043306) |
| 0.3 |
0.8 |
GO:0003199 |
endocardial cushion to mesenchymal transition involved in heart valve formation(GO:0003199) endocardial cushion to mesenchymal transition(GO:0090500) |
| 0.3 |
0.8 |
GO:0045655 |
regulation of monocyte differentiation(GO:0045655) positive regulation of monocyte differentiation(GO:0045657) |
| 0.3 |
2.3 |
GO:2000194 |
regulation of female gonad development(GO:2000194) |
| 0.3 |
0.8 |
GO:0006296 |
base-excision repair, AP site formation(GO:0006285) nucleotide-excision repair, DNA incision, 5'-to lesion(GO:0006296) |
| 0.3 |
1.3 |
GO:1901341 |
activation of store-operated calcium channel activity(GO:0032237) positive regulation of store-operated calcium channel activity(GO:1901341) |
| 0.3 |
0.5 |
GO:1904457 |
positive regulation of neuronal action potential(GO:1904457) |
| 0.3 |
1.5 |
GO:1903352 |
ornithine transport(GO:0015822) L-ornithine transmembrane transport(GO:1903352) |
| 0.3 |
3.3 |
GO:0006614 |
SRP-dependent cotranslational protein targeting to membrane(GO:0006614) |
| 0.3 |
5.1 |
GO:0015701 |
bicarbonate transport(GO:0015701) |
| 0.3 |
3.8 |
GO:0035855 |
megakaryocyte development(GO:0035855) |
| 0.3 |
0.8 |
GO:0006546 |
glycine catabolic process(GO:0006546) glycine decarboxylation via glycine cleavage system(GO:0019464) |
| 0.3 |
0.8 |
GO:0019276 |
UDP-N-acetylgalactosamine metabolic process(GO:0019276) |
| 0.3 |
9.8 |
GO:0070206 |
protein trimerization(GO:0070206) |
| 0.3 |
1.3 |
GO:0060040 |
retinal bipolar neuron differentiation(GO:0060040) |
| 0.2 |
0.5 |
GO:0051151 |
negative regulation of smooth muscle cell differentiation(GO:0051151) |
| 0.2 |
1.0 |
GO:0090365 |
regulation of mRNA modification(GO:0090365) |
| 0.2 |
0.5 |
GO:0002865 |
negative regulation of acute inflammatory response to antigenic stimulus(GO:0002865) |
| 0.2 |
1.2 |
GO:0001844 |
protein insertion into mitochondrial membrane involved in apoptotic signaling pathway(GO:0001844) |
| 0.2 |
0.2 |
GO:0072008 |
glomerular mesangial cell differentiation(GO:0072008) glomerular mesangial cell development(GO:0072144) |
| 0.2 |
1.0 |
GO:0006801 |
superoxide metabolic process(GO:0006801) |
| 0.2 |
0.7 |
GO:0006434 |
seryl-tRNA aminoacylation(GO:0006434) |
| 0.2 |
1.2 |
GO:0034551 |
respiratory chain complex III assembly(GO:0017062) mitochondrial respiratory chain complex III assembly(GO:0034551) mitochondrial respiratory chain complex III biogenesis(GO:0097033) |
| 0.2 |
3.1 |
GO:0006825 |
copper ion transport(GO:0006825) |
| 0.2 |
1.0 |
GO:0060290 |
transdifferentiation(GO:0060290) |
| 0.2 |
3.6 |
GO:0000338 |
protein deneddylation(GO:0000338) |
| 0.2 |
0.5 |
GO:0036518 |
chemorepulsion of dopaminergic neuron axon(GO:0036518) |
| 0.2 |
1.7 |
GO:0043951 |
negative regulation of cAMP-mediated signaling(GO:0043951) |
| 0.2 |
2.1 |
GO:0006309 |
apoptotic DNA fragmentation(GO:0006309) |
| 0.2 |
0.9 |
GO:1903909 |
regulation of receptor clustering(GO:1903909) |
| 0.2 |
3.5 |
GO:1901522 |
positive regulation of transcription from RNA polymerase II promoter involved in cellular response to chemical stimulus(GO:1901522) |
| 0.2 |
0.7 |
GO:0006558 |
L-phenylalanine metabolic process(GO:0006558) erythrose 4-phosphate/phosphoenolpyruvate family amino acid metabolic process(GO:1902221) |
| 0.2 |
0.7 |
GO:2000983 |
regulation of ATP citrate synthase activity(GO:2000983) negative regulation of ATP citrate synthase activity(GO:2000984) |
| 0.2 |
0.7 |
GO:0046341 |
CDP-diacylglycerol metabolic process(GO:0046341) |
| 0.2 |
1.2 |
GO:0009235 |
cobalamin metabolic process(GO:0009235) |
| 0.2 |
1.6 |
GO:0032534 |
regulation of microvillus assembly(GO:0032534) |
| 0.2 |
0.5 |
GO:0010455 |
positive regulation of cell fate commitment(GO:0010455) |
| 0.2 |
0.9 |
GO:0002710 |
negative regulation of T cell mediated immunity(GO:0002710) |
| 0.2 |
1.6 |
GO:0003148 |
outflow tract septum morphogenesis(GO:0003148) |
| 0.2 |
0.2 |
GO:0046098 |
guanine metabolic process(GO:0046098) |
| 0.2 |
1.2 |
GO:0070236 |
negative regulation of activation-induced cell death of T cells(GO:0070236) |
| 0.2 |
1.4 |
GO:0051775 |
response to redox state(GO:0051775) |
| 0.2 |
3.0 |
GO:0060261 |
positive regulation of transcription initiation from RNA polymerase II promoter(GO:0060261) |
| 0.2 |
0.7 |
GO:0010898 |
positive regulation of triglyceride catabolic process(GO:0010898) positive regulation of lipoprotein lipase activity(GO:0051006) |
| 0.2 |
3.9 |
GO:0001921 |
positive regulation of receptor recycling(GO:0001921) |
| 0.2 |
4.5 |
GO:0016226 |
iron-sulfur cluster assembly(GO:0016226) metallo-sulfur cluster assembly(GO:0031163) |
| 0.2 |
1.8 |
GO:0050892 |
intestinal absorption(GO:0050892) |
| 0.2 |
0.7 |
GO:0070257 |
mucus secretion(GO:0070254) positive regulation of mucus secretion(GO:0070257) |
| 0.2 |
0.7 |
GO:0006435 |
threonyl-tRNA aminoacylation(GO:0006435) |
| 0.2 |
0.9 |
GO:0038128 |
ERBB2 signaling pathway(GO:0038128) |
| 0.2 |
6.2 |
GO:0015985 |
energy coupled proton transport, down electrochemical gradient(GO:0015985) ATP synthesis coupled proton transport(GO:0015986) |
| 0.2 |
3.3 |
GO:0045063 |
T-helper 1 cell differentiation(GO:0045063) |
| 0.2 |
0.9 |
GO:1903251 |
multi-ciliated epithelial cell differentiation(GO:1903251) |
| 0.2 |
1.8 |
GO:0018916 |
nitrobenzene metabolic process(GO:0018916) |
| 0.2 |
3.3 |
GO:0032060 |
bleb assembly(GO:0032060) |
| 0.2 |
0.7 |
GO:0002002 |
regulation of systemic arterial blood pressure by circulatory renin-angiotensin(GO:0001991) regulation of angiotensin levels in blood(GO:0002002) |
| 0.2 |
3.3 |
GO:1902652 |
secondary alcohol metabolic process(GO:1902652) |
| 0.2 |
1.1 |
GO:0043312 |
neutrophil degranulation(GO:0043312) |
| 0.2 |
1.5 |
GO:0090336 |
positive regulation of brown fat cell differentiation(GO:0090336) |
| 0.2 |
0.4 |
GO:1901896 |
positive regulation of calcium-transporting ATPase activity(GO:1901896) |
| 0.2 |
0.9 |
GO:0050689 |
negative regulation of defense response to virus by host(GO:0050689) |
| 0.2 |
0.4 |
GO:0003376 |
sphingosine-1-phosphate signaling pathway(GO:0003376) sphingolipid mediated signaling pathway(GO:0090520) |
| 0.2 |
2.3 |
GO:1902895 |
positive regulation of pri-miRNA transcription from RNA polymerase II promoter(GO:1902895) |
| 0.2 |
1.7 |
GO:0010574 |
regulation of vascular endothelial growth factor production(GO:0010574) |
| 0.2 |
5.1 |
GO:0030199 |
collagen fibril organization(GO:0030199) |
| 0.2 |
1.9 |
GO:0001780 |
neutrophil homeostasis(GO:0001780) |
| 0.2 |
5.5 |
GO:0006099 |
tricarboxylic acid cycle(GO:0006099) |
| 0.2 |
0.4 |
GO:0040016 |
embryonic cleavage(GO:0040016) |
| 0.2 |
0.8 |
GO:0002934 |
desmosome organization(GO:0002934) |
| 0.2 |
0.6 |
GO:0032687 |
negative regulation of interferon-alpha production(GO:0032687) |
| 0.2 |
1.0 |
GO:0014886 |
transition between slow and fast fiber(GO:0014886) |
| 0.2 |
0.4 |
GO:0030997 |
regulation of centriole-centriole cohesion(GO:0030997) |
| 0.2 |
0.4 |
GO:0010878 |
cholesterol storage(GO:0010878) |
| 0.2 |
4.4 |
GO:0033014 |
porphyrin-containing compound biosynthetic process(GO:0006779) tetrapyrrole biosynthetic process(GO:0033014) |
| 0.2 |
1.2 |
GO:1990776 |
cellular response to angiotensin(GO:1904385) response to angiotensin(GO:1990776) |
| 0.2 |
2.3 |
GO:0042523 |
positive regulation of tyrosine phosphorylation of Stat5 protein(GO:0042523) |
| 0.2 |
1.0 |
GO:0042474 |
middle ear morphogenesis(GO:0042474) |
| 0.2 |
0.8 |
GO:0071220 |
response to bacterial lipopeptide(GO:0070339) cellular response to bacterial lipoprotein(GO:0071220) cellular response to bacterial lipopeptide(GO:0071221) response to diacyl bacterial lipopeptide(GO:0071724) cellular response to diacyl bacterial lipopeptide(GO:0071726) |
| 0.2 |
1.8 |
GO:0010992 |
ubiquitin homeostasis(GO:0010992) |
| 0.2 |
0.6 |
GO:0007403 |
glial cell fate determination(GO:0007403) |
| 0.2 |
0.8 |
GO:0097167 |
circadian regulation of translation(GO:0097167) |
| 0.2 |
0.8 |
GO:1900748 |
positive regulation of vascular endothelial growth factor signaling pathway(GO:1900748) |
| 0.2 |
1.2 |
GO:0051608 |
histamine transport(GO:0051608) |
| 0.2 |
0.6 |
GO:0051534 |
negative regulation of NFAT protein import into nucleus(GO:0051534) |
| 0.2 |
0.6 |
GO:0097309 |
cap1 mRNA methylation(GO:0097309) |
| 0.2 |
1.4 |
GO:0051036 |
regulation of endosome size(GO:0051036) |
| 0.2 |
0.8 |
GO:0048711 |
positive regulation of astrocyte differentiation(GO:0048711) |
| 0.2 |
1.2 |
GO:0048069 |
eye pigmentation(GO:0048069) |
| 0.2 |
0.8 |
GO:0046726 |
positive regulation by virus of viral protein levels in host cell(GO:0046726) |
| 0.2 |
1.0 |
GO:0031666 |
positive regulation of lipopolysaccharide-mediated signaling pathway(GO:0031666) |
| 0.2 |
0.6 |
GO:1901029 |
negative regulation of mitochondrial outer membrane permeabilization involved in apoptotic signaling pathway(GO:1901029) |
| 0.2 |
1.8 |
GO:0070050 |
neuron cellular homeostasis(GO:0070050) |
| 0.2 |
0.2 |
GO:0030656 |
regulation of vitamin metabolic process(GO:0030656) |
| 0.2 |
0.8 |
GO:0032026 |
response to magnesium ion(GO:0032026) |
| 0.2 |
0.8 |
GO:0060045 |
positive regulation of cardiac muscle cell proliferation(GO:0060045) |
| 0.2 |
1.8 |
GO:0071803 |
positive regulation of podosome assembly(GO:0071803) |
| 0.2 |
0.8 |
GO:0002317 |
plasma cell differentiation(GO:0002317) |
| 0.2 |
1.0 |
GO:0015803 |
branched-chain amino acid transport(GO:0015803) leucine transport(GO:0015820) |
| 0.2 |
1.2 |
GO:0044375 |
regulation of peroxisome size(GO:0044375) |
| 0.2 |
0.8 |
GO:0046909 |
intermembrane transport(GO:0046909) |
| 0.2 |
0.8 |
GO:0032962 |
positive regulation of inositol trisphosphate biosynthetic process(GO:0032962) |
| 0.2 |
1.2 |
GO:0043568 |
positive regulation of insulin-like growth factor receptor signaling pathway(GO:0043568) |
| 0.2 |
0.4 |
GO:0071394 |
cellular response to testosterone stimulus(GO:0071394) |
| 0.2 |
0.4 |
GO:1904154 |
positive regulation of retrograde protein transport, ER to cytosol(GO:1904154) |
| 0.2 |
0.8 |
GO:0060709 |
glycogen cell differentiation involved in embryonic placenta development(GO:0060709) |
| 0.2 |
1.5 |
GO:0021514 |
ventral spinal cord interneuron differentiation(GO:0021514) |
| 0.2 |
0.4 |
GO:1903334 |
positive regulation of protein folding(GO:1903334) |
| 0.2 |
0.9 |
GO:0032471 |
negative regulation of endoplasmic reticulum calcium ion concentration(GO:0032471) |
| 0.2 |
0.8 |
GO:1900533 |
medium-chain fatty-acyl-CoA catabolic process(GO:0036114) fatty-acyl-CoA catabolic process(GO:0036115) long-chain fatty-acyl-CoA catabolic process(GO:0036116) palmitic acid metabolic process(GO:1900533) palmitic acid biosynthetic process(GO:1900535) |
| 0.2 |
2.8 |
GO:0060707 |
trophoblast giant cell differentiation(GO:0060707) |
| 0.2 |
1.9 |
GO:1903333 |
negative regulation of protein folding(GO:1903333) |
| 0.2 |
0.2 |
GO:0061043 |
regulation of vascular wound healing(GO:0061043) |
| 0.2 |
1.3 |
GO:0006532 |
aspartate biosynthetic process(GO:0006532) |
| 0.2 |
0.9 |
GO:0046607 |
positive regulation of centrosome cycle(GO:0046607) |
| 0.2 |
0.6 |
GO:1904569 |
regulation of selenocysteine incorporation(GO:1904569) |
| 0.2 |
0.6 |
GO:2000314 |
negative regulation of fibroblast growth factor receptor signaling pathway involved in neural plate anterior/posterior pattern formation(GO:2000314) |
| 0.2 |
0.4 |
GO:0031069 |
hair follicle morphogenesis(GO:0031069) |
| 0.2 |
0.9 |
GO:0071294 |
cellular response to zinc ion(GO:0071294) |
| 0.2 |
0.4 |
GO:0010920 |
negative regulation of inositol phosphate biosynthetic process(GO:0010920) testosterone biosynthetic process(GO:0061370) regulation of testosterone biosynthetic process(GO:2000224) |
| 0.2 |
1.1 |
GO:0050860 |
negative regulation of T cell receptor signaling pathway(GO:0050860) |
| 0.2 |
2.0 |
GO:0060219 |
camera-type eye photoreceptor cell differentiation(GO:0060219) |
| 0.2 |
0.7 |
GO:0070589 |
cell wall mannoprotein biosynthetic process(GO:0000032) mannoprotein metabolic process(GO:0006056) mannoprotein biosynthetic process(GO:0006057) cell wall glycoprotein biosynthetic process(GO:0031506) cell wall biogenesis(GO:0042546) cell wall macromolecule metabolic process(GO:0044036) cell wall macromolecule biosynthetic process(GO:0044038) chain elongation of O-linked mannose residue(GO:0044845) cellular component macromolecule biosynthetic process(GO:0070589) cell wall organization or biogenesis(GO:0071554) |
| 0.2 |
0.4 |
GO:0019087 |
transformation of host cell by virus(GO:0019087) |
| 0.2 |
0.5 |
GO:0061743 |
motor learning(GO:0061743) |
| 0.2 |
0.9 |
GO:0005513 |
detection of calcium ion(GO:0005513) |
| 0.2 |
0.4 |
GO:2001206 |
positive regulation of osteoclast development(GO:2001206) |
| 0.2 |
0.5 |
GO:0019074 |
viral genome packaging(GO:0019072) viral RNA genome packaging(GO:0019074) |
| 0.2 |
1.3 |
GO:0043117 |
positive regulation of vascular permeability(GO:0043117) |
| 0.2 |
0.2 |
GO:0061198 |
positive regulation of receptor biosynthetic process(GO:0010870) fungiform papilla formation(GO:0061198) |
| 0.2 |
2.2 |
GO:0046697 |
decidualization(GO:0046697) |
| 0.2 |
1.4 |
GO:0031642 |
negative regulation of myelination(GO:0031642) |
| 0.2 |
0.7 |
GO:1902626 |
assembly of large subunit precursor of preribosome(GO:1902626) |
| 0.2 |
0.7 |
GO:0098915 |
membrane repolarization during ventricular cardiac muscle cell action potential(GO:0098915) |
| 0.2 |
1.1 |
GO:0071549 |
response to dexamethasone(GO:0071548) cellular response to dexamethasone stimulus(GO:0071549) |
| 0.2 |
0.7 |
GO:0071340 |
skeletal muscle acetylcholine-gated channel clustering(GO:0071340) |
| 0.2 |
1.2 |
GO:0021940 |
positive regulation of cerebellar granule cell precursor proliferation(GO:0021940) |
| 0.2 |
0.7 |
GO:0010759 |
positive regulation of macrophage chemotaxis(GO:0010759) |
| 0.2 |
0.5 |
GO:0033630 |
positive regulation of cell adhesion mediated by integrin(GO:0033630) |
| 0.2 |
0.7 |
GO:0051387 |
negative regulation of neurotrophin TRK receptor signaling pathway(GO:0051387) |
| 0.2 |
7.0 |
GO:0006749 |
glutathione metabolic process(GO:0006749) |
| 0.2 |
0.9 |
GO:0006348 |
chromatin silencing at telomere(GO:0006348) |
| 0.2 |
2.1 |
GO:0006851 |
mitochondrial calcium ion transport(GO:0006851) |
| 0.2 |
0.7 |
GO:0010940 |
positive regulation of necrotic cell death(GO:0010940) |
| 0.2 |
0.5 |
GO:0090285 |
negative regulation of protein glycosylation in Golgi(GO:0090285) |
| 0.2 |
1.4 |
GO:0046007 |
negative regulation of activated T cell proliferation(GO:0046007) |
| 0.2 |
0.9 |
GO:0042997 |
negative regulation of Golgi to plasma membrane protein transport(GO:0042997) |
| 0.2 |
1.4 |
GO:0032691 |
negative regulation of interleukin-1 beta production(GO:0032691) |
| 0.2 |
0.7 |
GO:0097501 |
stress response to metal ion(GO:0097501) |
| 0.2 |
0.9 |
GO:0030854 |
positive regulation of granulocyte differentiation(GO:0030854) |
| 0.2 |
0.5 |
GO:0006116 |
NADH oxidation(GO:0006116) |
| 0.2 |
3.2 |
GO:0022900 |
electron transport chain(GO:0022900) |
| 0.2 |
0.7 |
GO:0042373 |
vitamin K metabolic process(GO:0042373) |
| 0.2 |
1.0 |
GO:0045607 |
regulation of auditory receptor cell differentiation(GO:0045607) regulation of mechanoreceptor differentiation(GO:0045631) regulation of inner ear receptor cell differentiation(GO:2000980) |
| 0.2 |
2.5 |
GO:0032981 |
NADH dehydrogenase complex assembly(GO:0010257) mitochondrial respiratory chain complex I assembly(GO:0032981) mitochondrial respiratory chain complex I biogenesis(GO:0097031) |
| 0.2 |
1.2 |
GO:0006729 |
tetrahydrobiopterin biosynthetic process(GO:0006729) tetrahydrobiopterin metabolic process(GO:0046146) |
| 0.2 |
0.7 |
GO:0070345 |
negative regulation of fat cell proliferation(GO:0070345) |
| 0.2 |
1.3 |
GO:1900262 |
regulation of DNA-directed DNA polymerase activity(GO:1900262) positive regulation of DNA-directed DNA polymerase activity(GO:1900264) |
| 0.2 |
0.8 |
GO:0033136 |
serine phosphorylation of STAT3 protein(GO:0033136) serine phosphorylation of STAT protein(GO:0042501) |
| 0.2 |
0.2 |
GO:0046349 |
amino sugar biosynthetic process(GO:0046349) |
| 0.2 |
1.5 |
GO:0021527 |
spinal cord association neuron differentiation(GO:0021527) |
| 0.2 |
0.8 |
GO:0045578 |
negative regulation of B cell differentiation(GO:0045578) |
| 0.2 |
0.3 |
GO:0061144 |
alveolar secondary septum development(GO:0061144) |
| 0.2 |
0.7 |
GO:0021564 |
glossopharyngeal nerve development(GO:0021563) vagus nerve development(GO:0021564) |
| 0.2 |
1.8 |
GO:0061179 |
negative regulation of insulin secretion involved in cellular response to glucose stimulus(GO:0061179) |
| 0.2 |
0.5 |
GO:0060785 |
regulation of apoptosis involved in tissue homeostasis(GO:0060785) |
| 0.2 |
0.5 |
GO:1901421 |
positive regulation of response to alcohol(GO:1901421) |
| 0.2 |
0.3 |
GO:1901856 |
negative regulation of cellular respiration(GO:1901856) |
| 0.2 |
0.3 |
GO:0007158 |
neuron cell-cell adhesion(GO:0007158) |
| 0.2 |
1.1 |
GO:0071577 |
zinc II ion transmembrane transport(GO:0071577) |
| 0.2 |
0.6 |
GO:0090035 |
regulation of chaperone-mediated protein complex assembly(GO:0090034) positive regulation of chaperone-mediated protein complex assembly(GO:0090035) |
| 0.2 |
0.8 |
GO:0060347 |
heart trabecula formation(GO:0060347) |
| 0.2 |
0.5 |
GO:0072356 |
chromosome passenger complex localization to kinetochore(GO:0072356) |
| 0.2 |
0.3 |
GO:0021506 |
anterior neuropore closure(GO:0021506) neuropore closure(GO:0021995) |
| 0.2 |
2.6 |
GO:0046325 |
negative regulation of glucose import(GO:0046325) |
| 0.2 |
1.0 |
GO:0008343 |
adult feeding behavior(GO:0008343) |
| 0.2 |
1.0 |
GO:0016255 |
attachment of GPI anchor to protein(GO:0016255) |
| 0.2 |
0.5 |
GO:0072061 |
inner medullary collecting duct development(GO:0072061) |
| 0.2 |
1.4 |
GO:0045471 |
response to ethanol(GO:0045471) |
| 0.2 |
0.8 |
GO:0021993 |
initiation of neural tube closure(GO:0021993) |
| 0.2 |
0.2 |
GO:0051835 |
positive regulation of synapse structural plasticity(GO:0051835) |
| 0.2 |
1.3 |
GO:0034383 |
low-density lipoprotein particle clearance(GO:0034383) |
| 0.2 |
0.8 |
GO:0071361 |
cellular response to ethanol(GO:0071361) |
| 0.2 |
0.6 |
GO:0032486 |
Rap protein signal transduction(GO:0032486) |
| 0.2 |
0.8 |
GO:0042178 |
xenobiotic catabolic process(GO:0042178) |
| 0.2 |
2.2 |
GO:0046597 |
negative regulation of viral entry into host cell(GO:0046597) |
| 0.2 |
2.0 |
GO:0060009 |
Sertoli cell development(GO:0060009) |
| 0.2 |
0.5 |
GO:0051892 |
regulation of cardioblast differentiation(GO:0051890) negative regulation of cardioblast differentiation(GO:0051892) |
| 0.2 |
1.1 |
GO:1901162 |
serotonin biosynthetic process(GO:0042427) primary amino compound biosynthetic process(GO:1901162) |
| 0.2 |
0.3 |
GO:0051684 |
maintenance of Golgi location(GO:0051684) |
| 0.2 |
0.9 |
GO:0043983 |
histone H4-K12 acetylation(GO:0043983) |
| 0.2 |
0.3 |
GO:0072216 |
positive regulation of metanephros development(GO:0072216) |
| 0.2 |
0.5 |
GO:0051030 |
snRNA transport(GO:0051030) |
| 0.2 |
1.2 |
GO:0048642 |
negative regulation of skeletal muscle tissue development(GO:0048642) |
| 0.2 |
0.6 |
GO:0070525 |
tRNA threonylcarbamoyladenosine metabolic process(GO:0070525) |
| 0.2 |
2.3 |
GO:1901186 |
positive regulation of ERBB signaling pathway(GO:1901186) |
| 0.1 |
1.5 |
GO:0070940 |
dephosphorylation of RNA polymerase II C-terminal domain(GO:0070940) |
| 0.1 |
0.6 |
GO:0036462 |
TRAIL-activated apoptotic signaling pathway(GO:0036462) |
| 0.1 |
1.5 |
GO:0032000 |
positive regulation of fatty acid beta-oxidation(GO:0032000) |
| 0.1 |
0.6 |
GO:0045039 |
protein import into mitochondrial inner membrane(GO:0045039) chaperone-mediated protein transport(GO:0072321) |
| 0.1 |
0.9 |
GO:0010883 |
regulation of lipid storage(GO:0010883) |
| 0.1 |
0.9 |
GO:0030579 |
ubiquitin-dependent SMAD protein catabolic process(GO:0030579) |
| 0.1 |
0.9 |
GO:0034983 |
peptidyl-lysine deacetylation(GO:0034983) |
| 0.1 |
2.8 |
GO:0070670 |
response to interleukin-4(GO:0070670) |
| 0.1 |
1.2 |
GO:0007351 |
tripartite regional subdivision(GO:0007351) anterior/posterior axis specification, embryo(GO:0008595) |
| 0.1 |
0.6 |
GO:0006049 |
UDP-N-acetylglucosamine catabolic process(GO:0006049) |
| 0.1 |
0.4 |
GO:0006657 |
CDP-choline pathway(GO:0006657) |
| 0.1 |
0.3 |
GO:0018171 |
peptidyl-cysteine oxidation(GO:0018171) |
| 0.1 |
0.7 |
GO:1900027 |
regulation of ruffle assembly(GO:1900027) |
| 0.1 |
0.6 |
GO:0040018 |
positive regulation of multicellular organism growth(GO:0040018) |
| 0.1 |
0.6 |
GO:0010735 |
positive regulation of transcription via serum response element binding(GO:0010735) |
| 0.1 |
1.3 |
GO:0015868 |
purine ribonucleotide transport(GO:0015868) |
| 0.1 |
2.0 |
GO:0006388 |
tRNA splicing, via endonucleolytic cleavage and ligation(GO:0006388) |
| 0.1 |
0.3 |
GO:0033762 |
response to glucagon(GO:0033762) |
| 0.1 |
1.1 |
GO:0009083 |
branched-chain amino acid catabolic process(GO:0009083) |
| 0.1 |
0.4 |
GO:0071941 |
nitrogen cycle metabolic process(GO:0071941) |
| 0.1 |
1.0 |
GO:0071800 |
podosome assembly(GO:0071800) |
| 0.1 |
1.7 |
GO:0048240 |
sperm capacitation(GO:0048240) |
| 0.1 |
0.4 |
GO:0018298 |
protein-chromophore linkage(GO:0018298) |
| 0.1 |
0.8 |
GO:0043518 |
negative regulation of DNA damage response, signal transduction by p53 class mediator(GO:0043518) |
| 0.1 |
0.6 |
GO:0000447 |
endonucleolytic cleavage in ITS1 to separate SSU-rRNA from 5.8S rRNA and LSU-rRNA from tricistronic rRNA transcript (SSU-rRNA, 5.8S rRNA, LSU-rRNA)(GO:0000447) |
| 0.1 |
0.8 |
GO:0018344 |
protein geranylgeranylation(GO:0018344) |
| 0.1 |
0.5 |
GO:0002337 |
B-1a B cell differentiation(GO:0002337) |
| 0.1 |
1.0 |
GO:0000478 |
endonucleolytic cleavage involved in rRNA processing(GO:0000478) |
| 0.1 |
0.3 |
GO:0032717 |
negative regulation of interleukin-8 production(GO:0032717) |
| 0.1 |
0.1 |
GO:0071863 |
cell proliferation in bone marrow(GO:0071838) regulation of cell proliferation in bone marrow(GO:0071863) positive regulation of cell proliferation in bone marrow(GO:0071864) |
| 0.1 |
0.4 |
GO:1904491 |
protein localization to ciliary transition zone(GO:1904491) |
| 0.1 |
0.4 |
GO:0035552 |
oxidative single-stranded DNA demethylation(GO:0035552) |
| 0.1 |
1.9 |
GO:0046498 |
S-adenosylhomocysteine metabolic process(GO:0046498) |
| 0.1 |
0.7 |
GO:0051085 |
chaperone mediated protein folding requiring cofactor(GO:0051085) |
| 0.1 |
0.3 |
GO:0034310 |
primary alcohol catabolic process(GO:0034310) |
| 0.1 |
2.1 |
GO:0035873 |
lactate transport(GO:0015727) lactate transmembrane transport(GO:0035873) plasma membrane lactate transport(GO:0035879) |
| 0.1 |
1.1 |
GO:0071763 |
nuclear membrane organization(GO:0071763) |
| 0.1 |
1.1 |
GO:0018026 |
peptidyl-lysine monomethylation(GO:0018026) |
| 0.1 |
2.1 |
GO:0043248 |
proteasome assembly(GO:0043248) |
| 0.1 |
0.6 |
GO:0036035 |
osteoclast development(GO:0036035) |
| 0.1 |
1.0 |
GO:0090084 |
negative regulation of inclusion body assembly(GO:0090084) |
| 0.1 |
1.0 |
GO:0043535 |
regulation of blood vessel endothelial cell migration(GO:0043535) |
| 0.1 |
0.9 |
GO:0035563 |
positive regulation of chromatin binding(GO:0035563) |
| 0.1 |
1.2 |
GO:0006817 |
phosphate ion transport(GO:0006817) |
| 0.1 |
0.1 |
GO:0039536 |
negative regulation of RIG-I signaling pathway(GO:0039536) |
| 0.1 |
1.8 |
GO:0071260 |
cellular response to mechanical stimulus(GO:0071260) |
| 0.1 |
2.3 |
GO:0006471 |
protein ADP-ribosylation(GO:0006471) |
| 0.1 |
0.6 |
GO:0071494 |
cellular response to UV-C(GO:0071494) |
| 0.1 |
0.3 |
GO:0042517 |
positive regulation of tyrosine phosphorylation of Stat3 protein(GO:0042517) |
| 0.1 |
0.9 |
GO:0018126 |
protein hydroxylation(GO:0018126) |
| 0.1 |
0.9 |
GO:0000103 |
sulfate assimilation(GO:0000103) |
| 0.1 |
1.4 |
GO:1904851 |
positive regulation of establishment of protein localization to telomere(GO:1904851) |
| 0.1 |
0.4 |
GO:0048563 |
post-embryonic organ morphogenesis(GO:0048563) |
| 0.1 |
0.7 |
GO:0006013 |
mannose metabolic process(GO:0006013) |
| 0.1 |
1.5 |
GO:0051764 |
actin crosslink formation(GO:0051764) |
| 0.1 |
1.0 |
GO:0070633 |
transepithelial transport(GO:0070633) |
| 0.1 |
0.9 |
GO:0006621 |
protein retention in ER lumen(GO:0006621) maintenance of protein localization in endoplasmic reticulum(GO:0035437) |
| 0.1 |
1.0 |
GO:0006020 |
inositol metabolic process(GO:0006020) |
| 0.1 |
1.0 |
GO:0007016 |
cytoskeletal anchoring at plasma membrane(GO:0007016) |
| 0.1 |
1.6 |
GO:0009437 |
carnitine metabolic process(GO:0009437) |
| 0.1 |
1.1 |
GO:0042558 |
pteridine-containing compound metabolic process(GO:0042558) |
| 0.1 |
0.2 |
GO:0003096 |
renal sodium ion transport(GO:0003096) |
| 0.1 |
0.6 |
GO:0045176 |
apical protein localization(GO:0045176) |
| 0.1 |
1.4 |
GO:0001945 |
lymph vessel development(GO:0001945) |
| 0.1 |
0.4 |
GO:0003057 |
regulation of the force of heart contraction by chemical signal(GO:0003057) |
| 0.1 |
1.1 |
GO:0001539 |
cilium or flagellum-dependent cell motility(GO:0001539) cilium-dependent cell motility(GO:0060285) |
| 0.1 |
0.8 |
GO:0001990 |
regulation of systemic arterial blood pressure by hormone(GO:0001990) |
| 0.1 |
1.3 |
GO:0060539 |
diaphragm development(GO:0060539) |
| 0.1 |
0.5 |
GO:0071816 |
protein insertion into ER membrane(GO:0045048) tail-anchored membrane protein insertion into ER membrane(GO:0071816) |
| 0.1 |
0.8 |
GO:0032462 |
regulation of protein homooligomerization(GO:0032462) |
| 0.1 |
1.5 |
GO:0036342 |
post-anal tail morphogenesis(GO:0036342) |
| 0.1 |
0.5 |
GO:0015888 |
thiamine transport(GO:0015888) |
| 0.1 |
0.5 |
GO:0030576 |
Cajal body organization(GO:0030576) |
| 0.1 |
0.6 |
GO:0006563 |
L-serine metabolic process(GO:0006563) |
| 0.1 |
0.5 |
GO:0045606 |
positive regulation of epidermal cell differentiation(GO:0045606) |
| 0.1 |
0.5 |
GO:0016557 |
peroxisome membrane biogenesis(GO:0016557) |
| 0.1 |
0.9 |
GO:0044406 |
adhesion of symbiont to host(GO:0044406) |
| 0.1 |
1.6 |
GO:0051044 |
positive regulation of membrane protein ectodomain proteolysis(GO:0051044) |
| 0.1 |
2.1 |
GO:0051973 |
positive regulation of telomerase activity(GO:0051973) |
| 0.1 |
0.1 |
GO:0046135 |
pyrimidine nucleoside catabolic process(GO:0046135) |
| 0.1 |
2.5 |
GO:1902692 |
regulation of neuroblast proliferation(GO:1902692) |
| 0.1 |
0.9 |
GO:0010867 |
positive regulation of triglyceride biosynthetic process(GO:0010867) positive regulation of triglyceride metabolic process(GO:0090208) |
| 0.1 |
0.3 |
GO:1990253 |
cellular response to leucine starvation(GO:1990253) |
| 0.1 |
1.4 |
GO:0000184 |
nuclear-transcribed mRNA catabolic process, nonsense-mediated decay(GO:0000184) |
| 0.1 |
0.3 |
GO:0009414 |
response to water deprivation(GO:0009414) |
| 0.1 |
0.6 |
GO:0006517 |
protein deglycosylation(GO:0006517) |
| 0.1 |
0.4 |
GO:0019673 |
GDP-mannose metabolic process(GO:0019673) |
| 0.1 |
0.3 |
GO:0021523 |
somatic motor neuron differentiation(GO:0021523) |
| 0.1 |
1.4 |
GO:0006754 |
ATP biosynthetic process(GO:0006754) |
| 0.1 |
2.7 |
GO:0048701 |
embryonic cranial skeleton morphogenesis(GO:0048701) |
| 0.1 |
0.4 |
GO:0060914 |
heart formation(GO:0060914) |
| 0.1 |
0.6 |
GO:0042538 |
hyperosmotic salinity response(GO:0042538) |
| 0.1 |
0.3 |
GO:0007144 |
female meiosis I(GO:0007144) |
| 0.1 |
2.0 |
GO:0071539 |
protein localization to centrosome(GO:0071539) |
| 0.1 |
0.7 |
GO:0031119 |
tRNA pseudouridine synthesis(GO:0031119) |
| 0.1 |
1.4 |
GO:0014741 |
negative regulation of cardiac muscle hypertrophy(GO:0010614) negative regulation of muscle hypertrophy(GO:0014741) |
| 0.1 |
0.5 |
GO:0070125 |
mitochondrial translational elongation(GO:0070125) |
| 0.1 |
1.3 |
GO:0015936 |
coenzyme A metabolic process(GO:0015936) |
| 0.1 |
3.4 |
GO:0031122 |
cytoplasmic microtubule organization(GO:0031122) |
| 0.1 |
0.3 |
GO:2000574 |
regulation of microtubule motor activity(GO:2000574) |
| 0.1 |
0.6 |
GO:0034393 |
positive regulation of smooth muscle cell apoptotic process(GO:0034393) |
| 0.1 |
0.5 |
GO:0001834 |
trophectodermal cell proliferation(GO:0001834) |
| 0.1 |
0.7 |
GO:0045003 |
DNA recombinase assembly(GO:0000730) double-strand break repair via synthesis-dependent strand annealing(GO:0045003) |
| 0.1 |
0.3 |
GO:0006420 |
arginyl-tRNA aminoacylation(GO:0006420) |
| 0.1 |
0.4 |
GO:0060352 |
cell adhesion molecule production(GO:0060352) |
| 0.1 |
0.5 |
GO:0045163 |
clustering of voltage-gated potassium channels(GO:0045163) |
| 0.1 |
4.6 |
GO:0055013 |
cardiac muscle cell development(GO:0055013) |
| 0.1 |
0.7 |
GO:0016576 |
histone dephosphorylation(GO:0016576) |
| 0.1 |
0.3 |
GO:0007128 |
M phase(GO:0000279) meiotic prophase I(GO:0007128) prophase(GO:0051324) meiotic cell cycle phase(GO:0098762) meiosis I cell cycle phase(GO:0098764) |
| 0.1 |
0.6 |
GO:1900025 |
negative regulation of substrate adhesion-dependent cell spreading(GO:1900025) |
| 0.1 |
0.1 |
GO:0016125 |
sterol metabolic process(GO:0016125) |
| 0.1 |
1.5 |
GO:0060441 |
epithelial tube branching involved in lung morphogenesis(GO:0060441) |
| 0.1 |
3.0 |
GO:0006270 |
DNA replication initiation(GO:0006270) |
| 0.1 |
1.0 |
GO:0001516 |
prostaglandin biosynthetic process(GO:0001516) prostanoid biosynthetic process(GO:0046457) |
| 0.1 |
0.4 |
GO:0021914 |
smoothened signaling pathway involved in ventral spinal cord patterning(GO:0021910) negative regulation of smoothened signaling pathway involved in ventral spinal cord patterning(GO:0021914) |
| 0.1 |
0.2 |
GO:0072224 |
metanephric glomerulus development(GO:0072224) |
| 0.1 |
1.0 |
GO:0022027 |
interkinetic nuclear migration(GO:0022027) |
| 0.1 |
0.4 |
GO:0006438 |
valyl-tRNA aminoacylation(GO:0006438) |
| 0.1 |
0.7 |
GO:1903427 |
negative regulation of reactive oxygen species biosynthetic process(GO:1903427) |
| 0.1 |
1.9 |
GO:0001706 |
endoderm formation(GO:0001706) |
| 0.1 |
0.7 |
GO:0019915 |
lipid storage(GO:0019915) |
| 0.1 |
2.7 |
GO:0035082 |
axoneme assembly(GO:0035082) |
| 0.1 |
0.5 |
GO:0072429 |
response to cell cycle checkpoint signaling(GO:0072396) response to DNA integrity checkpoint signaling(GO:0072402) response to DNA damage checkpoint signaling(GO:0072423) response to intra-S DNA damage checkpoint signaling(GO:0072429) |
| 0.1 |
0.4 |
GO:1902166 |
negative regulation of intrinsic apoptotic signaling pathway in response to DNA damage by p53 class mediator(GO:1902166) |
| 0.1 |
0.1 |
GO:1902953 |
positive regulation of ER to Golgi vesicle-mediated transport(GO:1902953) |
| 0.1 |
0.3 |
GO:0060439 |
trachea morphogenesis(GO:0060439) trachea formation(GO:0060440) regulation of Golgi inheritance(GO:0090170) positive regulation of production of miRNAs involved in gene silencing by miRNA(GO:1903800) |
| 0.1 |
0.9 |
GO:0001886 |
endothelial cell morphogenesis(GO:0001886) |
| 0.1 |
0.4 |
GO:0006297 |
nucleotide-excision repair, DNA gap filling(GO:0006297) |
| 0.1 |
0.4 |
GO:0097494 |
regulation of vesicle size(GO:0097494) |
| 0.1 |
0.6 |
GO:1904667 |
negative regulation of ubiquitin protein ligase activity(GO:1904667) |
| 0.1 |
0.4 |
GO:2001046 |
positive regulation of integrin-mediated signaling pathway(GO:2001046) |
| 0.1 |
1.0 |
GO:0035721 |
intraciliary retrograde transport(GO:0035721) |
| 0.1 |
0.9 |
GO:0006670 |
sphingosine metabolic process(GO:0006670) |
| 0.1 |
0.3 |
GO:0043029 |
T cell homeostasis(GO:0043029) |
| 0.1 |
1.5 |
GO:0035456 |
response to interferon-beta(GO:0035456) |
| 0.1 |
0.4 |
GO:0031536 |
positive regulation of exit from mitosis(GO:0031536) |
| 0.1 |
0.2 |
GO:0034729 |
histone H3-K79 methylation(GO:0034729) |
| 0.1 |
0.3 |
GO:0035909 |
aorta morphogenesis(GO:0035909) |
| 0.1 |
0.2 |
GO:0006369 |
termination of RNA polymerase II transcription(GO:0006369) |
| 0.1 |
0.6 |
GO:0006003 |
fructose 2,6-bisphosphate metabolic process(GO:0006003) |
| 0.1 |
1.2 |
GO:2000060 |
positive regulation of protein ubiquitination involved in ubiquitin-dependent protein catabolic process(GO:2000060) |
| 0.1 |
1.1 |
GO:0046855 |
phosphorylated carbohydrate dephosphorylation(GO:0046838) inositol phosphate dephosphorylation(GO:0046855) |
| 0.1 |
0.4 |
GO:0009109 |
coenzyme catabolic process(GO:0009109) |
| 0.1 |
1.1 |
GO:0007566 |
embryo implantation(GO:0007566) |
| 0.1 |
0.3 |
GO:1903977 |
positive regulation of Schwann cell migration(GO:1900149) positive regulation of glial cell migration(GO:1903977) |
| 0.1 |
0.4 |
GO:0060670 |
branching involved in labyrinthine layer morphogenesis(GO:0060670) |
| 0.1 |
0.3 |
GO:0045719 |
negative regulation of glycogen biosynthetic process(GO:0045719) negative regulation of glycogen metabolic process(GO:0070874) |
| 0.1 |
1.8 |
GO:1902653 |
cholesterol biosynthetic process(GO:0006695) secondary alcohol biosynthetic process(GO:1902653) |
| 0.1 |
0.6 |
GO:0002478 |
antigen processing and presentation of exogenous peptide antigen(GO:0002478) |
| 0.1 |
1.1 |
GO:0050832 |
defense response to fungus(GO:0050832) |
| 0.1 |
0.4 |
GO:0046784 |
viral mRNA export from host cell nucleus(GO:0046784) |
| 0.1 |
0.5 |
GO:0099625 |
regulation of ventricular cardiac muscle cell membrane repolarization(GO:0060307) ventricular cardiac muscle cell membrane repolarization(GO:0099625) |
| 0.1 |
0.5 |
GO:0006144 |
purine nucleobase metabolic process(GO:0006144) |
| 0.1 |
2.1 |
GO:0043297 |
apical junction assembly(GO:0043297) |
| 0.1 |
0.2 |
GO:0060340 |
positive regulation of type I interferon-mediated signaling pathway(GO:0060340) |
| 0.1 |
0.2 |
GO:1904468 |
negative regulation of tumor necrosis factor secretion(GO:1904468) |
| 0.1 |
2.7 |
GO:0032728 |
positive regulation of interferon-beta production(GO:0032728) |
| 0.1 |
0.3 |
GO:0060561 |
apoptotic process involved in morphogenesis(GO:0060561) |
| 0.1 |
0.3 |
GO:1903966 |
monounsaturated fatty acid metabolic process(GO:1903964) monounsaturated fatty acid biosynthetic process(GO:1903966) |
| 0.1 |
1.2 |
GO:0000305 |
response to oxygen radical(GO:0000305) |
| 0.1 |
0.2 |
GO:0071550 |
death-inducing signaling complex assembly(GO:0071550) |
| 0.1 |
0.5 |
GO:0015015 |
heparan sulfate proteoglycan biosynthetic process, enzymatic modification(GO:0015015) |
| 0.1 |
1.6 |
GO:0045116 |
protein neddylation(GO:0045116) |
| 0.1 |
0.2 |
GO:0046398 |
UDP-glucuronate biosynthetic process(GO:0006065) UDP-glucuronate metabolic process(GO:0046398) |
| 0.1 |
1.2 |
GO:0019228 |
neuronal action potential(GO:0019228) |
| 0.1 |
0.4 |
GO:0072656 |
maintenance of protein location in mitochondrion(GO:0072656) |
| 0.1 |
0.2 |
GO:0032430 |
positive regulation of phospholipase A2 activity(GO:0032430) |
| 0.1 |
2.0 |
GO:0031146 |
SCF-dependent proteasomal ubiquitin-dependent protein catabolic process(GO:0031146) |
| 0.1 |
0.2 |
GO:0035234 |
ectopic germ cell programmed cell death(GO:0035234) |
| 0.1 |
1.7 |
GO:0051592 |
response to calcium ion(GO:0051592) |
| 0.1 |
0.6 |
GO:0006265 |
DNA topological change(GO:0006265) |
| 0.1 |
2.1 |
GO:2000816 |
negative regulation of mitotic sister chromatid segregation(GO:0033048) negative regulation of mitotic metaphase/anaphase transition(GO:0045841) mitotic spindle checkpoint(GO:0071174) negative regulation of metaphase/anaphase transition of cell cycle(GO:1902100) negative regulation of mitotic sister chromatid separation(GO:2000816) |
| 0.1 |
0.2 |
GO:0045204 |
MAPK export from nucleus(GO:0045204) |
| 0.1 |
0.2 |
GO:0070314 |
G1 to G0 transition(GO:0070314) |
| 0.1 |
0.5 |
GO:1902042 |
negative regulation of extrinsic apoptotic signaling pathway via death domain receptors(GO:1902042) |
| 0.1 |
0.3 |
GO:0042790 |
transcription of nuclear large rRNA transcript from RNA polymerase I promoter(GO:0042790) |
| 0.1 |
0.4 |
GO:0032815 |
negative regulation of natural killer cell activation(GO:0032815) |
| 0.1 |
0.7 |
GO:0045577 |
regulation of B cell differentiation(GO:0045577) |
| 0.1 |
0.2 |
GO:2000152 |
regulation of protein K48-linked deubiquitination(GO:1903093) negative regulation of protein K48-linked deubiquitination(GO:1903094) regulation of ubiquitin-specific protease activity(GO:2000152) negative regulation of ubiquitin-specific protease activity(GO:2000157) |
| 0.1 |
1.2 |
GO:0034389 |
lipid particle organization(GO:0034389) |
| 0.1 |
0.8 |
GO:0030575 |
nuclear body organization(GO:0030575) |
| 0.1 |
1.1 |
GO:0010971 |
positive regulation of G2/M transition of mitotic cell cycle(GO:0010971) positive regulation of cell cycle G2/M phase transition(GO:1902751) |
| 0.1 |
0.2 |
GO:0001543 |
ovarian follicle rupture(GO:0001543) |
| 0.1 |
0.8 |
GO:0006610 |
ribosomal protein import into nucleus(GO:0006610) |
| 0.1 |
0.2 |
GO:0051409 |
response to nitrosative stress(GO:0051409) cellular response to nitrosative stress(GO:0071500) |
| 0.1 |
2.2 |
GO:0061077 |
chaperone-mediated protein folding(GO:0061077) |
| 0.1 |
0.3 |
GO:0017183 |
peptidyl-diphthamide metabolic process(GO:0017182) peptidyl-diphthamide biosynthetic process from peptidyl-histidine(GO:0017183) |
| 0.1 |
0.4 |
GO:0043137 |
DNA replication, removal of RNA primer(GO:0043137) |
| 0.1 |
5.9 |
GO:0006633 |
fatty acid biosynthetic process(GO:0006633) |
| 0.1 |
2.9 |
GO:0006506 |
GPI anchor biosynthetic process(GO:0006506) |
| 0.1 |
0.6 |
GO:0070831 |
basement membrane assembly(GO:0070831) |
| 0.1 |
0.2 |
GO:1902310 |
positive regulation of peptidyl-serine dephosphorylation(GO:1902310) |
| 0.1 |
0.1 |
GO:0008626 |
granzyme-mediated apoptotic signaling pathway(GO:0008626) |
| 0.1 |
1.9 |
GO:0038061 |
NIK/NF-kappaB signaling(GO:0038061) |
| 0.1 |
0.5 |
GO:0015862 |
uridine transport(GO:0015862) |
| 0.1 |
0.2 |
GO:0051481 |
negative regulation of cytosolic calcium ion concentration(GO:0051481) |
| 0.1 |
0.7 |
GO:0035751 |
regulation of lysosomal lumen pH(GO:0035751) |
| 0.1 |
0.7 |
GO:0097345 |
mitochondrial outer membrane permeabilization(GO:0097345) |
| 0.1 |
0.2 |
GO:0010724 |
regulation of definitive erythrocyte differentiation(GO:0010724) |
| 0.1 |
0.3 |
GO:0006451 |
selenocysteine incorporation(GO:0001514) translational readthrough(GO:0006451) |
| 0.1 |
0.4 |
GO:0071955 |
recycling endosome to Golgi transport(GO:0071955) |
| 0.1 |
0.8 |
GO:0009649 |
entrainment of circadian clock(GO:0009649) |
| 0.1 |
0.1 |
GO:0002200 |
somatic diversification of immune receptors(GO:0002200) |
| 0.1 |
0.3 |
GO:0060252 |
positive regulation of glial cell proliferation(GO:0060252) |
| 0.1 |
0.8 |
GO:1990126 |
retrograde transport, endosome to plasma membrane(GO:1990126) |
| 0.1 |
0.1 |
GO:0009642 |
response to light intensity(GO:0009642) |
| 0.1 |
0.3 |
GO:0017144 |
drug metabolic process(GO:0017144) |
| 0.1 |
0.9 |
GO:0051496 |
positive regulation of stress fiber assembly(GO:0051496) |
| 0.1 |
0.1 |
GO:0031468 |
nuclear envelope reassembly(GO:0031468) |
| 0.1 |
0.5 |
GO:0051683 |
establishment of Golgi localization(GO:0051683) |
| 0.1 |
0.5 |
GO:2001224 |
positive regulation of neuron migration(GO:2001224) |
| 0.1 |
0.1 |
GO:0006693 |
prostanoid metabolic process(GO:0006692) prostaglandin metabolic process(GO:0006693) |
| 0.1 |
0.7 |
GO:0050884 |
neuromuscular process controlling posture(GO:0050884) |
| 0.1 |
0.3 |
GO:1904721 |
regulation of mRNA cleavage(GO:0031437) negative regulation of mRNA cleavage(GO:0031438) negative regulation of immunoglobulin secretion(GO:0051025) regulation of endoribonuclease activity(GO:0060699) negative regulation of ribonuclease activity(GO:0060701) negative regulation of endoribonuclease activity(GO:0060702) regulation of mRNA endonucleolytic cleavage involved in unfolded protein response(GO:1904720) negative regulation of mRNA endonucleolytic cleavage involved in unfolded protein response(GO:1904721) |
| 0.1 |
0.5 |
GO:0002931 |
response to ischemia(GO:0002931) |
| 0.1 |
0.7 |
GO:0006516 |
glycoprotein catabolic process(GO:0006516) |
| 0.1 |
0.2 |
GO:1903273 |
regulation of sodium ion export(GO:1903273) positive regulation of sodium ion export(GO:1903275) regulation of sodium ion export from cell(GO:1903276) positive regulation of sodium ion export from cell(GO:1903278) |
| 0.1 |
0.9 |
GO:0006096 |
glycolytic process(GO:0006096) ATP generation from ADP(GO:0006757) |
| 0.1 |
0.5 |
GO:0097034 |
mitochondrial respiratory chain complex IV assembly(GO:0033617) mitochondrial respiratory chain complex IV biogenesis(GO:0097034) |
| 0.1 |
0.6 |
GO:0043482 |
pigment accumulation(GO:0043476) cellular pigment accumulation(GO:0043482) |
| 0.1 |
2.1 |
GO:0030490 |
maturation of SSU-rRNA(GO:0030490) |
| 0.1 |
0.7 |
GO:0006337 |
nucleosome disassembly(GO:0006337) protein-DNA complex disassembly(GO:0032986) |
| 0.1 |
0.3 |
GO:0060841 |
venous blood vessel development(GO:0060841) |
| 0.1 |
1.5 |
GO:0034314 |
Arp2/3 complex-mediated actin nucleation(GO:0034314) |
| 0.1 |
0.5 |
GO:0032020 |
ISG15-protein conjugation(GO:0032020) |
| 0.1 |
0.7 |
GO:0034453 |
microtubule anchoring(GO:0034453) |
| 0.1 |
0.9 |
GO:0070584 |
mitochondrion morphogenesis(GO:0070584) |
| 0.1 |
0.2 |
GO:0090110 |
cargo loading into COPII-coated vesicle(GO:0090110) regulation of cargo loading into COPII-coated vesicle(GO:1901301) |
| 0.1 |
1.4 |
GO:0010718 |
positive regulation of epithelial to mesenchymal transition(GO:0010718) |
| 0.1 |
0.4 |
GO:0010459 |
negative regulation of heart rate(GO:0010459) |
| 0.1 |
0.8 |
GO:1901984 |
negative regulation of protein acetylation(GO:1901984) |
| 0.1 |
0.3 |
GO:0042135 |
neurotransmitter catabolic process(GO:0042135) |
| 0.1 |
1.5 |
GO:0006220 |
pyrimidine nucleotide metabolic process(GO:0006220) |
| 0.1 |
0.2 |
GO:2000504 |
positive regulation of blood vessel remodeling(GO:2000504) |
| 0.1 |
0.6 |
GO:0001676 |
long-chain fatty acid metabolic process(GO:0001676) |
| 0.1 |
0.4 |
GO:0043567 |
regulation of insulin-like growth factor receptor signaling pathway(GO:0043567) |
| 0.1 |
0.1 |
GO:0048102 |
autophagic cell death(GO:0048102) |
| 0.1 |
0.8 |
GO:0006301 |
postreplication repair(GO:0006301) |
| 0.1 |
0.4 |
GO:0043653 |
mitochondrial fragmentation involved in apoptotic process(GO:0043653) |
| 0.1 |
0.4 |
GO:2000767 |
positive regulation of cytoplasmic translation(GO:2000767) |
| 0.1 |
0.2 |
GO:0044778 |
meiotic DNA integrity checkpoint(GO:0044778) |
| 0.1 |
0.6 |
GO:0001522 |
pseudouridine synthesis(GO:0001522) |
| 0.1 |
0.3 |
GO:0051893 |
regulation of focal adhesion assembly(GO:0051893) regulation of cell-substrate junction assembly(GO:0090109) regulation of adherens junction organization(GO:1903391) |
| 0.1 |
0.3 |
GO:0046685 |
response to arsenic-containing substance(GO:0046685) |
| 0.1 |
0.3 |
GO:1900745 |
positive regulation of p38MAPK cascade(GO:1900745) |
| 0.1 |
0.7 |
GO:1900087 |
positive regulation of G1/S transition of mitotic cell cycle(GO:1900087) |
| 0.1 |
0.3 |
GO:0051014 |
actin filament severing(GO:0051014) |
| 0.1 |
0.3 |
GO:0019695 |
choline metabolic process(GO:0019695) |
| 0.1 |
3.6 |
GO:0042273 |
ribosomal large subunit biogenesis(GO:0042273) |
| 0.1 |
0.3 |
GO:1902993 |
positive regulation of beta-amyloid formation(GO:1902004) positive regulation of amyloid precursor protein catabolic process(GO:1902993) |
| 0.1 |
0.3 |
GO:0031547 |
brain-derived neurotrophic factor receptor signaling pathway(GO:0031547) |
| 0.1 |
0.6 |
GO:0031648 |
protein destabilization(GO:0031648) |
| 0.1 |
0.4 |
GO:0006264 |
mitochondrial DNA replication(GO:0006264) |
| 0.1 |
0.1 |
GO:0052428 |
modulation of molecular function in other organism(GO:0044359) negative regulation of molecular function in other organism(GO:0044362) negative regulation of molecular function in other organism involved in symbiotic interaction(GO:0052204) modulation of molecular function in other organism involved in symbiotic interaction(GO:0052205) negative regulation by host of symbiont molecular function(GO:0052405) modification by host of symbiont molecular function(GO:0052428) |
| 0.1 |
0.7 |
GO:1901998 |
toxin transport(GO:1901998) |
| 0.1 |
0.1 |
GO:0006290 |
pyrimidine dimer repair(GO:0006290) |
| 0.1 |
0.7 |
GO:1902857 |
positive regulation of nonmotile primary cilium assembly(GO:1902857) |
| 0.1 |
0.2 |
GO:0015786 |
UDP-glucose transport(GO:0015786) |
| 0.1 |
2.1 |
GO:0051289 |
protein homotetramerization(GO:0051289) |
| 0.1 |
0.2 |
GO:1900121 |
negative regulation of receptor binding(GO:1900121) |
| 0.1 |
0.4 |
GO:0052646 |
alditol phosphate metabolic process(GO:0052646) |
| 0.1 |
0.9 |
GO:0071425 |
hematopoietic stem cell proliferation(GO:0071425) |
| 0.1 |
0.3 |
GO:0031958 |
corticosteroid receptor signaling pathway(GO:0031958) |
| 0.1 |
0.3 |
GO:0060706 |
cell differentiation involved in embryonic placenta development(GO:0060706) |
| 0.1 |
0.6 |
GO:0045747 |
positive regulation of Notch signaling pathway(GO:0045747) |
| 0.1 |
0.1 |
GO:0070365 |
hepatocyte differentiation(GO:0070365) |
| 0.1 |
1.2 |
GO:0009062 |
fatty acid catabolic process(GO:0009062) |
| 0.1 |
0.6 |
GO:0034244 |
negative regulation of transcription elongation from RNA polymerase II promoter(GO:0034244) |
| 0.1 |
0.4 |
GO:0003341 |
cilium movement(GO:0003341) |
| 0.1 |
0.4 |
GO:0036297 |
interstrand cross-link repair(GO:0036297) |
| 0.1 |
0.3 |
GO:0006767 |
water-soluble vitamin metabolic process(GO:0006767) |
| 0.1 |
0.9 |
GO:0045026 |
plasma membrane fusion(GO:0045026) |
| 0.1 |
0.1 |
GO:0032380 |
regulation of intracellular lipid transport(GO:0032377) regulation of intracellular sterol transport(GO:0032380) regulation of intracellular cholesterol transport(GO:0032383) |
| 0.1 |
0.7 |
GO:0030901 |
midbrain development(GO:0030901) |
| 0.1 |
0.9 |
GO:0071277 |
cellular response to calcium ion(GO:0071277) |
| 0.1 |
0.2 |
GO:0035469 |
determination of pancreatic left/right asymmetry(GO:0035469) |
| 0.1 |
0.1 |
GO:0006027 |
glycosaminoglycan catabolic process(GO:0006027) |
| 0.1 |
0.3 |
GO:0015812 |
gamma-aminobutyric acid transport(GO:0015812) |
| 0.1 |
0.3 |
GO:0002031 |
G-protein coupled receptor internalization(GO:0002031) |
| 0.0 |
0.7 |
GO:0014003 |
oligodendrocyte development(GO:0014003) |
| 0.0 |
0.3 |
GO:0048680 |
positive regulation of axon regeneration(GO:0048680) |
| 0.0 |
0.0 |
GO:0045617 |
negative regulation of keratinocyte differentiation(GO:0045617) |
| 0.0 |
0.2 |
GO:0006531 |
aspartate metabolic process(GO:0006531) |
| 0.0 |
0.2 |
GO:0007616 |
long-term memory(GO:0007616) |
| 0.0 |
1.6 |
GO:0000387 |
spliceosomal snRNP assembly(GO:0000387) |
| 0.0 |
0.5 |
GO:0048662 |
negative regulation of smooth muscle cell proliferation(GO:0048662) |
| 0.0 |
0.2 |
GO:0051189 |
Mo-molybdopterin cofactor biosynthetic process(GO:0006777) Mo-molybdopterin cofactor metabolic process(GO:0019720) molybdopterin cofactor biosynthetic process(GO:0032324) molybdopterin cofactor metabolic process(GO:0043545) prosthetic group metabolic process(GO:0051189) |
| 0.0 |
1.1 |
GO:0003073 |
regulation of systemic arterial blood pressure(GO:0003073) |
| 0.0 |
0.1 |
GO:0002755 |
MyD88-dependent toll-like receptor signaling pathway(GO:0002755) |
| 0.0 |
0.2 |
GO:0000469 |
cleavage involved in rRNA processing(GO:0000469) |
| 0.0 |
0.5 |
GO:0033539 |
fatty acid beta-oxidation using acyl-CoA dehydrogenase(GO:0033539) |
| 0.0 |
0.3 |
GO:0006287 |
base-excision repair, gap-filling(GO:0006287) |
| 0.0 |
0.2 |
GO:0003382 |
epithelial cell morphogenesis(GO:0003382) |
| 0.0 |
0.2 |
GO:0006598 |
polyamine catabolic process(GO:0006598) spermine catabolic process(GO:0046208) |
| 0.0 |
0.3 |
GO:0035542 |
regulation of SNARE complex assembly(GO:0035542) |
| 0.0 |
0.2 |
GO:0045218 |
zonula adherens maintenance(GO:0045218) |
| 0.0 |
0.3 |
GO:0009303 |
rRNA transcription(GO:0009303) |
| 0.0 |
0.1 |
GO:0035845 |
photoreceptor cell outer segment organization(GO:0035845) |
| 0.0 |
0.2 |
GO:0033572 |
transferrin transport(GO:0033572) |
| 0.0 |
0.8 |
GO:0048025 |
negative regulation of mRNA splicing, via spliceosome(GO:0048025) |
| 0.0 |
0.1 |
GO:0010793 |
regulation of mRNA export from nucleus(GO:0010793) regulation of ribonucleoprotein complex localization(GO:2000197) |
| 0.0 |
1.0 |
GO:0048255 |
mRNA stabilization(GO:0048255) |
| 0.0 |
0.2 |
GO:1903963 |
arachidonic acid secretion(GO:0050482) arachidonate transport(GO:1903963) |
| 0.0 |
0.3 |
GO:0006488 |
dolichol-linked oligosaccharide biosynthetic process(GO:0006488) |
| 0.0 |
0.2 |
GO:0042219 |
cellular modified amino acid catabolic process(GO:0042219) |
| 0.0 |
2.7 |
GO:0071229 |
cellular response to acid chemical(GO:0071229) |
| 0.0 |
0.1 |
GO:0061009 |
common bile duct development(GO:0061009) |
| 0.0 |
0.2 |
GO:0030168 |
platelet activation(GO:0030168) |
| 0.0 |
0.1 |
GO:0036120 |
cellular response to platelet-derived growth factor stimulus(GO:0036120) |
| 0.0 |
0.3 |
GO:0034773 |
histone H4-K20 trimethylation(GO:0034773) |
| 0.0 |
0.4 |
GO:0045662 |
negative regulation of myoblast differentiation(GO:0045662) |
| 0.0 |
0.2 |
GO:0090207 |
regulation of triglyceride metabolic process(GO:0090207) |
| 0.0 |
0.3 |
GO:0060674 |
placenta blood vessel development(GO:0060674) |
| 0.0 |
0.2 |
GO:0044387 |
negative regulation of protein kinase activity by regulation of protein phosphorylation(GO:0044387) |
| 0.0 |
0.5 |
GO:0006298 |
mismatch repair(GO:0006298) |
| 0.0 |
2.9 |
GO:0008654 |
phospholipid biosynthetic process(GO:0008654) |
| 0.0 |
1.1 |
GO:0042073 |
intraciliary transport(GO:0042073) |
| 0.0 |
0.7 |
GO:0045838 |
positive regulation of membrane potential(GO:0045838) |
| 0.0 |
0.1 |
GO:0044804 |
nucleophagy(GO:0044804) |
| 0.0 |
0.2 |
GO:0023021 |
termination of signal transduction(GO:0023021) termination of G-protein coupled receptor signaling pathway(GO:0038032) |
| 0.0 |
0.7 |
GO:0048745 |
smooth muscle tissue development(GO:0048745) |
| 0.0 |
0.3 |
GO:0006560 |
proline metabolic process(GO:0006560) |
| 0.0 |
0.2 |
GO:0033147 |
negative regulation of intracellular estrogen receptor signaling pathway(GO:0033147) |
| 0.0 |
0.2 |
GO:0046684 |
response to pyrethroid(GO:0046684) |
| 0.0 |
2.9 |
GO:0051028 |
mRNA transport(GO:0051028) |
| 0.0 |
0.4 |
GO:0002021 |
response to dietary excess(GO:0002021) |
| 0.0 |
0.1 |
GO:0097150 |
neuronal stem cell population maintenance(GO:0097150) |
| 0.0 |
0.4 |
GO:0030865 |
cortical cytoskeleton organization(GO:0030865) |
| 0.0 |
0.5 |
GO:0031952 |
regulation of protein autophosphorylation(GO:0031952) |
| 0.0 |
0.2 |
GO:0048873 |
homeostasis of number of cells within a tissue(GO:0048873) |
| 0.0 |
0.4 |
GO:0048172 |
regulation of short-term neuronal synaptic plasticity(GO:0048172) |
| 0.0 |
0.3 |
GO:0006353 |
DNA-templated transcription, termination(GO:0006353) |
| 0.0 |
0.1 |
GO:0006450 |
regulation of translational fidelity(GO:0006450) |
| 0.0 |
0.7 |
GO:0045333 |
cellular respiration(GO:0045333) |
| 0.0 |
0.1 |
GO:0045117 |
azole transport(GO:0045117) |
| 0.0 |
0.6 |
GO:0031063 |
regulation of histone deacetylation(GO:0031063) |
| 0.0 |
0.2 |
GO:1902108 |
regulation of mitochondrial membrane permeability involved in apoptotic process(GO:1902108) |
| 0.0 |
0.3 |
GO:0007097 |
nuclear migration(GO:0007097) |
| 0.0 |
0.1 |
GO:0045217 |
cell-cell junction maintenance(GO:0045217) |
| 0.0 |
0.1 |
GO:0031509 |
telomeric heterochromatin assembly(GO:0031509) negative regulation of chromosome condensation(GO:1902340) |
| 0.0 |
0.3 |
GO:0006509 |
membrane protein ectodomain proteolysis(GO:0006509) |
| 0.0 |
0.2 |
GO:0019884 |
antigen processing and presentation of exogenous antigen(GO:0019884) |
| 0.0 |
0.1 |
GO:0019509 |
L-methionine biosynthetic process from methylthioadenosine(GO:0019509) |
| 0.0 |
0.3 |
GO:0046856 |
phospholipid dephosphorylation(GO:0046839) phosphatidylinositol dephosphorylation(GO:0046856) |
| 0.0 |
0.1 |
GO:0042256 |
mature ribosome assembly(GO:0042256) |
| 0.0 |
0.3 |
GO:0072673 |
lamellipodium morphogenesis(GO:0072673) |
| 0.0 |
0.1 |
GO:0009880 |
embryonic pattern specification(GO:0009880) |
| 0.0 |
0.5 |
GO:0070527 |
platelet aggregation(GO:0070527) |
| 0.0 |
1.5 |
GO:0043062 |
extracellular matrix organization(GO:0030198) extracellular structure organization(GO:0043062) |
| 0.0 |
0.1 |
GO:0014050 |
negative regulation of glutamate secretion(GO:0014050) |
| 0.0 |
0.2 |
GO:1904063 |
negative regulation of cation transmembrane transport(GO:1904063) |
| 0.0 |
0.1 |
GO:0030033 |
microvillus assembly(GO:0030033) |
| 0.0 |
0.4 |
GO:0005978 |
glycogen biosynthetic process(GO:0005978) glucan biosynthetic process(GO:0009250) |
| 0.0 |
0.4 |
GO:0034063 |
stress granule assembly(GO:0034063) |
| 0.0 |
0.2 |
GO:0043162 |
ubiquitin-dependent protein catabolic process via the multivesicular body sorting pathway(GO:0043162) |
| 0.0 |
0.2 |
GO:0035269 |
protein O-linked mannosylation(GO:0035269) |
| 0.0 |
0.1 |
GO:0031167 |
rRNA methylation(GO:0031167) |
| 0.0 |
0.0 |
GO:0060192 |
negative regulation of lipase activity(GO:0060192) |
| 0.0 |
0.2 |
GO:0035886 |
vascular smooth muscle cell differentiation(GO:0035886) |
| 0.0 |
0.2 |
GO:0014912 |
negative regulation of smooth muscle cell migration(GO:0014912) |
| 0.0 |
0.1 |
GO:0051694 |
pointed-end actin filament capping(GO:0051694) |
| 0.0 |
0.4 |
GO:0001837 |
epithelial to mesenchymal transition(GO:0001837) |
| 0.0 |
0.1 |
GO:0006895 |
Golgi to endosome transport(GO:0006895) |
| 0.0 |
0.1 |
GO:0051697 |
protein delipidation(GO:0051697) |
| 0.0 |
0.0 |
GO:0021756 |
subpallium development(GO:0021544) striatum development(GO:0021756) |
| 0.0 |
0.2 |
GO:0043124 |
negative regulation of I-kappaB kinase/NF-kappaB signaling(GO:0043124) |
| 0.0 |
0.0 |
GO:0072718 |
response to cisplatin(GO:0072718) |
| 0.0 |
0.3 |
GO:0016180 |
snRNA processing(GO:0016180) |
| 0.0 |
0.3 |
GO:0048488 |
synaptic vesicle endocytosis(GO:0048488) |
| 0.0 |
0.1 |
GO:0010470 |
regulation of gastrulation(GO:0010470) |
| 0.0 |
0.0 |
GO:2001181 |
regulation of T-helper 2 cell cytokine production(GO:2000551) positive regulation of T-helper 2 cell cytokine production(GO:2000553) positive regulation of interleukin-10 secretion(GO:2001181) |
| 0.0 |
0.1 |
GO:0001570 |
vasculogenesis(GO:0001570) |
| 0.0 |
0.5 |
GO:0043038 |
amino acid activation(GO:0043038) tRNA aminoacylation(GO:0043039) |
| 0.0 |
0.0 |
GO:0042510 |
tyrosine phosphorylation of Stat1 protein(GO:0042508) regulation of tyrosine phosphorylation of Stat1 protein(GO:0042510) positive regulation of tyrosine phosphorylation of Stat1 protein(GO:0042511) |
| 0.0 |
0.1 |
GO:0043403 |
skeletal muscle tissue regeneration(GO:0043403) |
| 0.0 |
0.1 |
GO:0032515 |
negative regulation of phosphoprotein phosphatase activity(GO:0032515) |
| 0.0 |
0.0 |
GO:0048861 |
leukemia inhibitory factor signaling pathway(GO:0048861) |
| 0.0 |
0.2 |
GO:0048661 |
positive regulation of smooth muscle cell proliferation(GO:0048661) |
| 0.0 |
0.1 |
GO:1903146 |
regulation of mitophagy(GO:1903146) |
| 0.0 |
0.3 |
GO:0042475 |
odontogenesis of dentin-containing tooth(GO:0042475) |
| 0.0 |
0.1 |
GO:0051725 |
protein de-ADP-ribosylation(GO:0051725) |
| 0.0 |
0.0 |
GO:0061515 |
myeloid cell development(GO:0061515) |
| 0.0 |
0.1 |
GO:0006004 |
fucose metabolic process(GO:0006004) |
| 0.0 |
0.1 |
GO:0043278 |
response to isoquinoline alkaloid(GO:0014072) response to morphine(GO:0043278) |
| 0.0 |
0.2 |
GO:0007271 |
synaptic transmission, cholinergic(GO:0007271) |
| 0.0 |
0.1 |
GO:2000480 |
regulation of cAMP-dependent protein kinase activity(GO:2000479) negative regulation of cAMP-dependent protein kinase activity(GO:2000480) |
| 0.0 |
0.1 |
GO:0040034 |
regulation of development, heterochronic(GO:0040034) |
| 0.0 |
0.1 |
GO:0032688 |
negative regulation of interferon-beta production(GO:0032688) |
| 0.0 |
0.1 |
GO:0000729 |
DNA double-strand break processing(GO:0000729) |
| 0.0 |
0.2 |
GO:2000785 |
regulation of autophagosome assembly(GO:2000785) |
| 0.0 |
0.2 |
GO:0001959 |
regulation of cytokine-mediated signaling pathway(GO:0001959) |
| 0.0 |
0.0 |
GO:0035521 |
monoubiquitinated histone deubiquitination(GO:0035521) monoubiquitinated histone H2A deubiquitination(GO:0035522) |
| 0.0 |
0.1 |
GO:0030968 |
endoplasmic reticulum unfolded protein response(GO:0030968) |
| 0.0 |
0.1 |
GO:0048659 |
smooth muscle cell proliferation(GO:0048659) |
| 0.0 |
0.0 |
GO:0046622 |
positive regulation of organ growth(GO:0046622) |
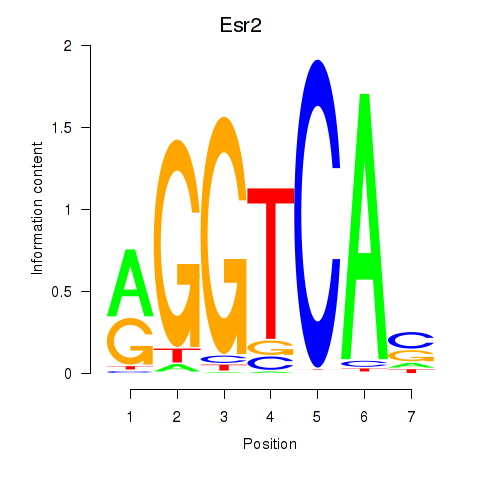

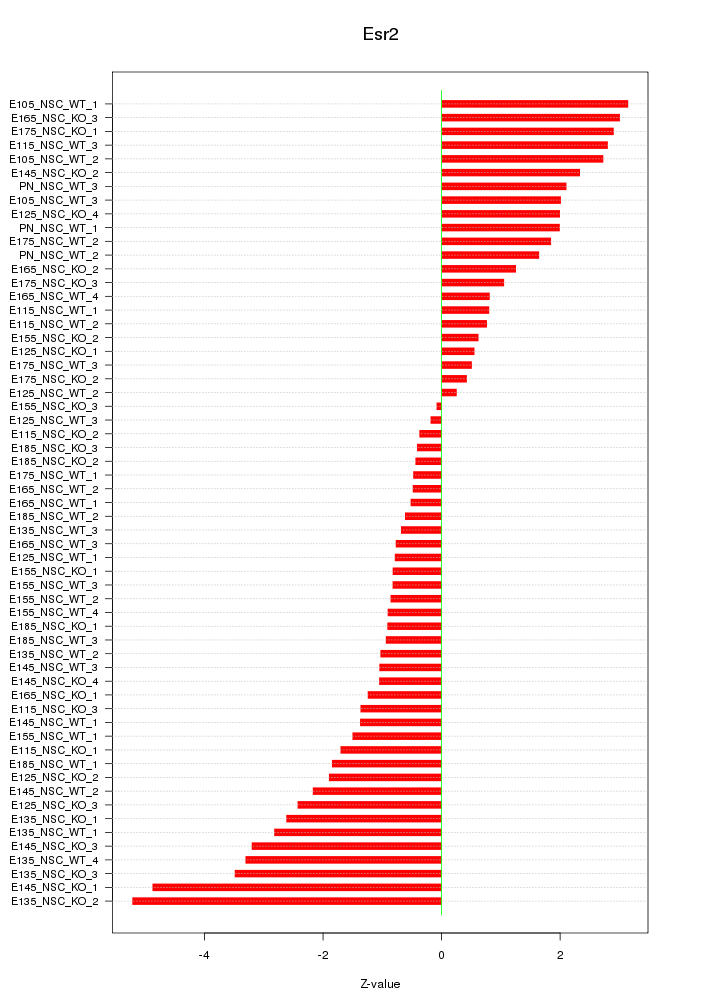

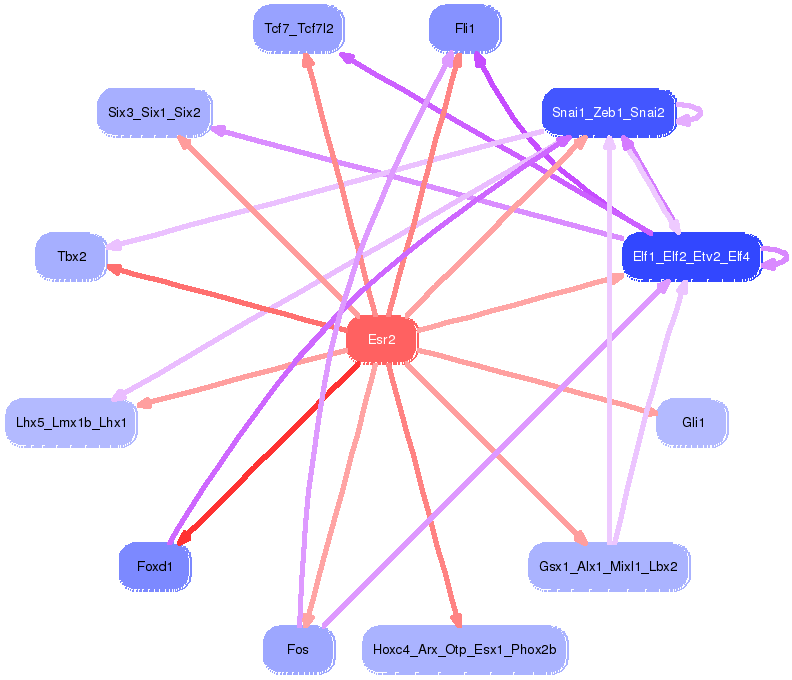