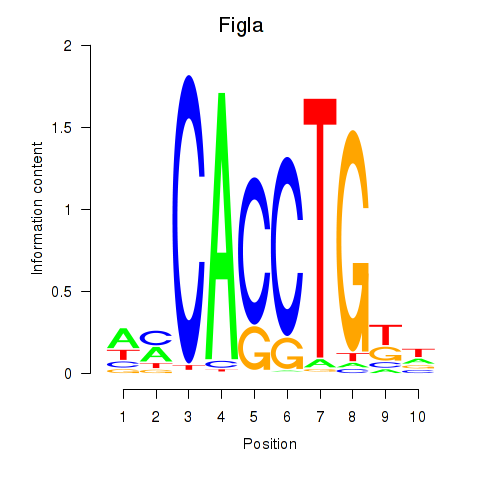
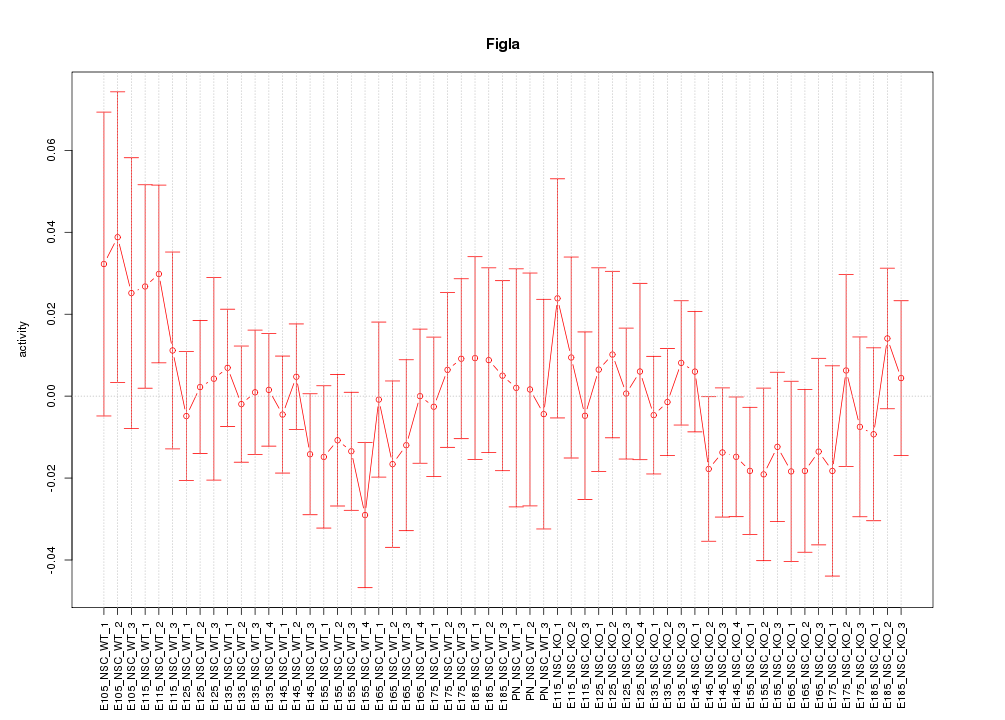
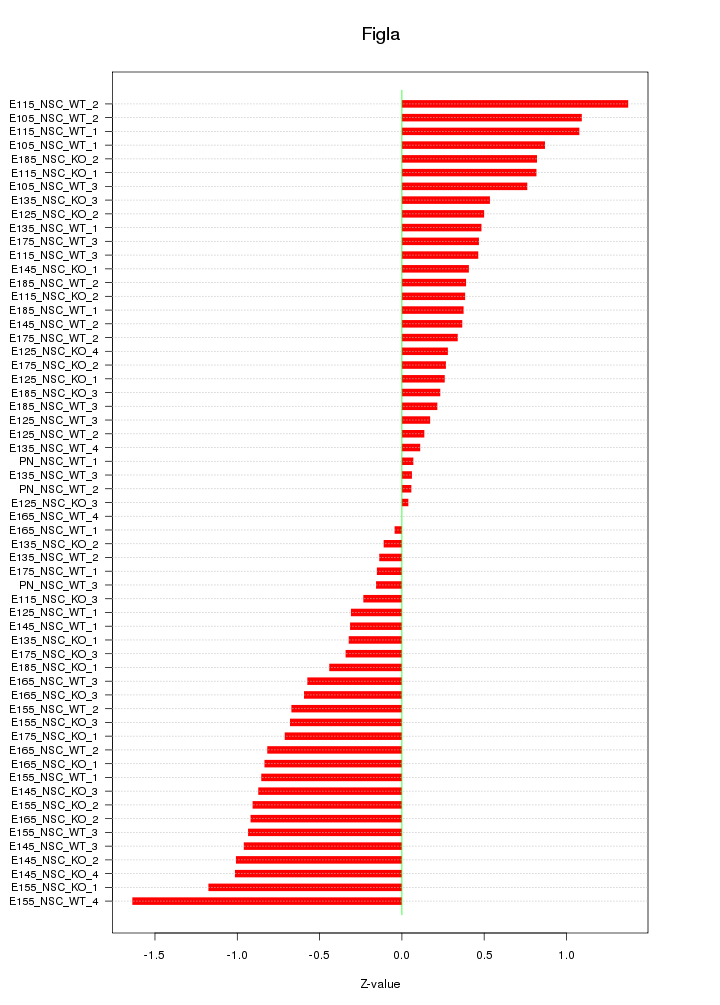
Motif ID: Figla
Z-value: 0.646
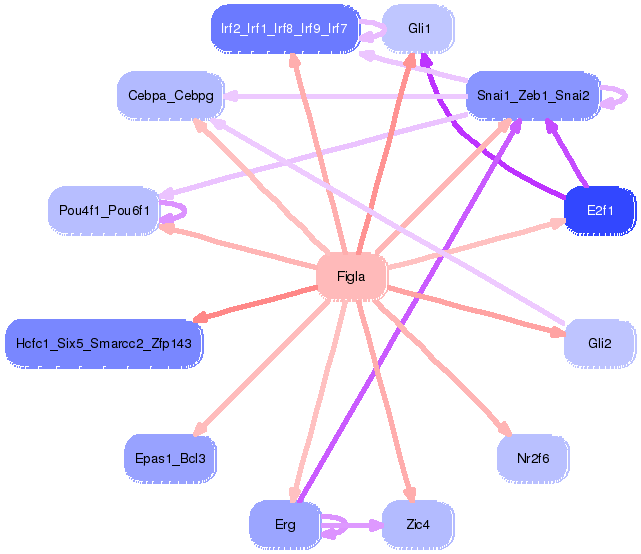
Transcription factors associated with Figla:
| Gene Symbol | Entrez ID | Gene Name |
|---|---|---|
| Figla | ENSMUSG00000030001.3 | Figla |

Top targets:
Gene overrepresentation in biological_process category:
| Log-likelihood per target | Total log-likelihood | Term | Description |
|---|---|---|---|
| 3.0 | 8.9 | GO:0006601 | creatine biosynthetic process(GO:0006601) |
| 2.2 | 6.5 | GO:0036292 | DNA rewinding(GO:0036292) |
| 1.7 | 6.9 | GO:0060032 | notochord regression(GO:0060032) |
| 0.9 | 2.8 | GO:0016332 | establishment or maintenance of polarity of embryonic epithelium(GO:0016332) |
| 0.9 | 2.8 | GO:1904274 | tricellular tight junction assembly(GO:1904274) |
| 0.8 | 5.6 | GO:0000320 | re-entry into mitotic cell cycle(GO:0000320) |
| 0.8 | 3.1 | GO:0032439 | endosome localization(GO:0032439) |
| 0.7 | 2.2 | GO:1904879 | positive regulation of calcium ion transmembrane transport via high voltage-gated calcium channel(GO:1904879) |
| 0.7 | 2.7 | GO:0051311 | spindle assembly involved in female meiosis(GO:0007056) meiotic metaphase plate congression(GO:0051311) |
| 0.7 | 2.1 | GO:2000564 | regulation of MyD88-dependent toll-like receptor signaling pathway(GO:0034124) CD8-positive, alpha-beta T cell proliferation(GO:0035740) negative regulation of regulatory T cell differentiation(GO:0045590) regulation of CD8-positive, alpha-beta T cell proliferation(GO:2000564) |
| 0.6 | 3.0 | GO:0010993 | regulation of ubiquitin homeostasis(GO:0010993) free ubiquitin chain polymerization(GO:0010994) |
| 0.6 | 2.4 | GO:0043987 | histone H3-S10 phosphorylation(GO:0043987) |
| 0.6 | 2.4 | GO:0046391 | 5-phosphoribose 1-diphosphate biosynthetic process(GO:0006015) 5-phosphoribose 1-diphosphate metabolic process(GO:0046391) |
| 0.6 | 2.9 | GO:0070125 | mitochondrial translational elongation(GO:0070125) |
| 0.5 | 2.1 | GO:2001271 | negative regulation of cysteine-type endopeptidase activity involved in execution phase of apoptosis(GO:2001271) |
| 0.5 | 2.7 | GO:0071205 | clustering of voltage-gated potassium channels(GO:0045163) protein localization to juxtaparanode region of axon(GO:0071205) |
| 0.5 | 2.1 | GO:0031581 | hemidesmosome assembly(GO:0031581) |
| 0.5 | 1.5 | GO:1901420 | negative regulation of response to alcohol(GO:1901420) |
| 0.5 | 1.4 | GO:2000314 | negative regulation of fibroblast growth factor receptor signaling pathway involved in neural plate anterior/posterior pattern formation(GO:2000314) |
| 0.5 | 1.4 | GO:1902202 | regulation of hepatocyte growth factor receptor signaling pathway(GO:1902202) |
| 0.4 | 2.2 | GO:0071500 | cellular response to nitrosative stress(GO:0071500) |
| 0.4 | 4.8 | GO:0014842 | regulation of skeletal muscle satellite cell proliferation(GO:0014842) |
| 0.4 | 4.8 | GO:0048733 | sebaceous gland development(GO:0048733) |
| 0.4 | 1.8 | GO:1902031 | regulation of NADP metabolic process(GO:1902031) |
| 0.4 | 1.1 | GO:0030167 | proteoglycan catabolic process(GO:0030167) |
| 0.3 | 2.0 | GO:0089711 | L-glutamate transmembrane transport(GO:0089711) |
| 0.3 | 2.0 | GO:0046826 | negative regulation of protein export from nucleus(GO:0046826) |
| 0.3 | 1.6 | GO:0003223 | ventricular compact myocardium morphogenesis(GO:0003223) proprioception(GO:0019230) |
| 0.3 | 2.1 | GO:2000491 | positive regulation of hepatic stellate cell activation(GO:2000491) |
| 0.3 | 1.1 | GO:1903181 | regulation of dopamine biosynthetic process(GO:1903179) positive regulation of dopamine biosynthetic process(GO:1903181) |
| 0.3 | 2.6 | GO:0018065 | protein-cofactor linkage(GO:0018065) |
| 0.2 | 0.7 | GO:0003199 | endocardial cushion to mesenchymal transition involved in heart valve formation(GO:0003199) |
| 0.2 | 0.7 | GO:0036500 | ATF6-mediated unfolded protein response(GO:0036500) |
| 0.2 | 7.9 | GO:0050873 | brown fat cell differentiation(GO:0050873) |
| 0.2 | 0.2 | GO:1901630 | negative regulation of presynaptic membrane organization(GO:1901630) |
| 0.2 | 3.0 | GO:0006268 | DNA unwinding involved in DNA replication(GO:0006268) |
| 0.2 | 1.1 | GO:0075525 | viral translational termination-reinitiation(GO:0075525) |
| 0.2 | 1.6 | GO:0090209 | negative regulation of triglyceride metabolic process(GO:0090209) |
| 0.2 | 2.5 | GO:0060539 | diaphragm development(GO:0060539) |
| 0.2 | 1.3 | GO:2000210 | positive regulation of anoikis(GO:2000210) |
| 0.2 | 2.0 | GO:0090527 | actin filament reorganization(GO:0090527) |
| 0.2 | 0.8 | GO:1990379 | lipid transport across blood brain barrier(GO:1990379) |
| 0.2 | 1.1 | GO:0003383 | apical constriction(GO:0003383) |
| 0.2 | 0.6 | GO:1900275 | negative regulation of phospholipase activity(GO:0010519) negative regulation of phospholipase C activity(GO:1900275) |
| 0.2 | 1.1 | GO:0048630 | skeletal muscle tissue growth(GO:0048630) |
| 0.2 | 1.3 | GO:0071294 | cellular response to zinc ion(GO:0071294) |
| 0.2 | 6.8 | GO:0045746 | negative regulation of Notch signaling pathway(GO:0045746) |
| 0.2 | 0.9 | GO:0061052 | negative regulation of cell growth involved in cardiac muscle cell development(GO:0061052) |
| 0.2 | 1.6 | GO:0015868 | purine ribonucleotide transport(GO:0015868) |
| 0.2 | 1.4 | GO:0016338 | calcium-independent cell-cell adhesion via plasma membrane cell-adhesion molecules(GO:0016338) |
| 0.2 | 0.7 | GO:0070345 | negative regulation of fat cell proliferation(GO:0070345) negative regulation of transcription involved in G1/S transition of mitotic cell cycle(GO:0071930) |
| 0.2 | 0.9 | GO:0045759 | negative regulation of action potential(GO:0045759) |
| 0.2 | 5.7 | GO:0045747 | positive regulation of Notch signaling pathway(GO:0045747) |
| 0.2 | 1.2 | GO:0006703 | estrogen biosynthetic process(GO:0006703) |
| 0.2 | 0.2 | GO:0038163 | thrombopoietin-mediated signaling pathway(GO:0038163) |
| 0.2 | 1.5 | GO:0030322 | stabilization of membrane potential(GO:0030322) |
| 0.2 | 0.5 | GO:0002842 | T cell mediated immune response to tumor cell(GO:0002424) regulation of T cell mediated immune response to tumor cell(GO:0002840) positive regulation of T cell mediated immune response to tumor cell(GO:0002842) |
| 0.1 | 1.2 | GO:0032020 | ISG15-protein conjugation(GO:0032020) |
| 0.1 | 1.5 | GO:0030539 | male genitalia development(GO:0030539) plasminogen activation(GO:0031639) |
| 0.1 | 0.4 | GO:0035574 | histone H4-K20 demethylation(GO:0035574) |
| 0.1 | 2.3 | GO:0007202 | activation of phospholipase C activity(GO:0007202) |
| 0.1 | 1.2 | GO:0036158 | outer dynein arm assembly(GO:0036158) |
| 0.1 | 0.4 | GO:0060023 | soft palate development(GO:0060023) |
| 0.1 | 2.5 | GO:0034142 | toll-like receptor 4 signaling pathway(GO:0034142) |
| 0.1 | 1.6 | GO:0050965 | detection of temperature stimulus involved in sensory perception(GO:0050961) detection of temperature stimulus involved in sensory perception of pain(GO:0050965) |
| 0.1 | 3.5 | GO:0060445 | branching involved in salivary gland morphogenesis(GO:0060445) |
| 0.1 | 0.4 | GO:0006432 | phenylalanyl-tRNA aminoacylation(GO:0006432) |
| 0.1 | 1.2 | GO:0043518 | negative regulation of DNA damage response, signal transduction by p53 class mediator(GO:0043518) |
| 0.1 | 1.1 | GO:0090557 | establishment of endothelial intestinal barrier(GO:0090557) |
| 0.1 | 0.3 | GO:0035063 | nuclear speck organization(GO:0035063) |
| 0.1 | 0.3 | GO:1903026 | negative regulation of RNA polymerase II regulatory region sequence-specific DNA binding(GO:1903026) positive regulation of oxidative stress-induced neuron intrinsic apoptotic signaling pathway(GO:1903378) |
| 0.1 | 1.3 | GO:0048642 | negative regulation of skeletal muscle tissue development(GO:0048642) |
| 0.1 | 0.9 | GO:0034498 | early endosome to Golgi transport(GO:0034498) |
| 0.1 | 0.4 | GO:0090220 | meiotic telomere clustering(GO:0045141) chromosome localization to nuclear envelope involved in homologous chromosome segregation(GO:0090220) |
| 0.1 | 0.9 | GO:0071157 | negative regulation of cell cycle arrest(GO:0071157) |
| 0.1 | 0.2 | GO:0006116 | NADH oxidation(GO:0006116) glycerol-3-phosphate catabolic process(GO:0046168) |
| 0.1 | 0.7 | GO:1902231 | positive regulation of intrinsic apoptotic signaling pathway in response to DNA damage(GO:1902231) |
| 0.1 | 0.4 | GO:0030035 | microspike assembly(GO:0030035) |
| 0.1 | 0.3 | GO:0045039 | protein import into mitochondrial inner membrane(GO:0045039) |
| 0.1 | 0.7 | GO:0070886 | positive regulation of NFAT protein import into nucleus(GO:0051533) positive regulation of calcineurin-NFAT signaling cascade(GO:0070886) |
| 0.1 | 0.5 | GO:0018026 | peptidyl-lysine monomethylation(GO:0018026) |
| 0.1 | 3.9 | GO:0051489 | regulation of filopodium assembly(GO:0051489) |
| 0.1 | 1.1 | GO:0016188 | synaptic vesicle maturation(GO:0016188) |
| 0.1 | 0.3 | GO:0042045 | epithelial fluid transport(GO:0042045) |
| 0.1 | 1.3 | GO:0070979 | protein K11-linked ubiquitination(GO:0070979) |
| 0.1 | 0.3 | GO:0060528 | secretory columnal luminar epithelial cell differentiation involved in prostate glandular acinus development(GO:0060528) |
| 0.0 | 0.8 | GO:0010719 | negative regulation of epithelial to mesenchymal transition(GO:0010719) |
| 0.0 | 1.5 | GO:0051973 | positive regulation of telomerase activity(GO:0051973) |
| 0.0 | 1.4 | GO:0006739 | NADP metabolic process(GO:0006739) |
| 0.0 | 1.1 | GO:0043171 | peptide catabolic process(GO:0043171) |
| 0.0 | 0.8 | GO:0007614 | short-term memory(GO:0007614) |
| 0.0 | 0.3 | GO:0008616 | queuosine biosynthetic process(GO:0008616) queuosine metabolic process(GO:0046116) |
| 0.0 | 3.9 | GO:2000045 | regulation of G1/S transition of mitotic cell cycle(GO:2000045) |
| 0.0 | 0.3 | GO:0045056 | transcytosis(GO:0045056) |
| 0.0 | 0.4 | GO:0007602 | phototransduction(GO:0007602) |
| 0.0 | 0.1 | GO:0035616 | histone H2B conserved C-terminal lysine deubiquitination(GO:0035616) |
| 0.0 | 0.5 | GO:0071260 | cellular response to mechanical stimulus(GO:0071260) |
| 0.0 | 0.1 | GO:0060768 | epithelial cell proliferation involved in prostate gland development(GO:0060767) regulation of epithelial cell proliferation involved in prostate gland development(GO:0060768) negative regulation of epithelial cell proliferation involved in prostate gland development(GO:0060770) |
| 0.0 | 0.1 | GO:0045607 | regulation of auditory receptor cell differentiation(GO:0045607) regulation of mechanoreceptor differentiation(GO:0045631) regulation of inner ear receptor cell differentiation(GO:2000980) |
| 0.0 | 0.3 | GO:0043619 | regulation of transcription from RNA polymerase II promoter in response to oxidative stress(GO:0043619) |
| 0.0 | 0.4 | GO:0014002 | astrocyte development(GO:0014002) |
| 0.0 | 0.2 | GO:0090050 | regulation of skeletal muscle fiber development(GO:0048742) positive regulation of cell migration involved in sprouting angiogenesis(GO:0090050) |
| 0.0 | 1.1 | GO:0048747 | muscle fiber development(GO:0048747) |
| 0.0 | 0.7 | GO:0060706 | cell differentiation involved in embryonic placenta development(GO:0060706) |
| 0.0 | 0.8 | GO:0001954 | positive regulation of cell-matrix adhesion(GO:0001954) |
| 0.0 | 0.8 | GO:0031572 | G2 DNA damage checkpoint(GO:0031572) |
| 0.0 | 0.3 | GO:0032291 | central nervous system myelination(GO:0022010) axon ensheathment in central nervous system(GO:0032291) |
| 0.0 | 0.3 | GO:0045838 | positive regulation of membrane potential(GO:0045838) |
| 0.0 | 2.2 | GO:0000910 | cytokinesis(GO:0000910) |
| 0.0 | 1.0 | GO:0006367 | transcription initiation from RNA polymerase II promoter(GO:0006367) |
| 0.0 | 1.6 | GO:0051297 | centrosome organization(GO:0051297) |
| 0.0 | 0.1 | GO:0030854 | positive regulation of granulocyte differentiation(GO:0030854) |
| 0.0 | 0.0 | GO:0071285 | cellular response to lithium ion(GO:0071285) |
| 0.0 | 0.5 | GO:0035329 | hippo signaling(GO:0035329) |
| 0.0 | 0.6 | GO:0051591 | response to cAMP(GO:0051591) |
| 0.0 | 0.3 | GO:0007205 | protein kinase C-activating G-protein coupled receptor signaling pathway(GO:0007205) |
| 0.0 | 0.3 | GO:0007064 | mitotic sister chromatid cohesion(GO:0007064) |
| 0.0 | 0.1 | GO:0031547 | brain-derived neurotrophic factor receptor signaling pathway(GO:0031547) |
| 0.0 | 0.0 | GO:0042796 | snRNA transcription from RNA polymerase III promoter(GO:0042796) |
| 0.0 | 1.6 | GO:0002244 | hematopoietic progenitor cell differentiation(GO:0002244) |
| 0.0 | 5.2 | GO:0051301 | cell division(GO:0051301) |
| 0.0 | 0.7 | GO:0042633 | molting cycle(GO:0042303) hair cycle(GO:0042633) |
| 0.0 | 0.1 | GO:0032060 | bleb assembly(GO:0032060) |
| 0.0 | 0.0 | GO:1901858 | regulation of mitochondrial DNA metabolic process(GO:1901858) |
Gene overrepresentation in cellular_component category:
| Log-likelihood per target | Total log-likelihood | Term | Description |
|---|---|---|---|
| 1.0 | 3.9 | GO:0008537 | proteasome activator complex(GO:0008537) |
| 0.9 | 2.6 | GO:1990423 | RZZ complex(GO:1990423) |
| 0.7 | 5.0 | GO:0097197 | tetraspanin-enriched microdomain(GO:0097197) |
| 0.7 | 2.0 | GO:0044614 | nuclear pore cytoplasmic filaments(GO:0044614) |
| 0.6 | 2.4 | GO:0000942 | condensed nuclear chromosome outer kinetochore(GO:0000942) |
| 0.6 | 2.4 | GO:0002189 | ribose phosphate diphosphokinase complex(GO:0002189) |
| 0.5 | 6.9 | GO:0097542 | ciliary tip(GO:0097542) |
| 0.5 | 3.1 | GO:0045179 | apical cortex(GO:0045179) |
| 0.5 | 3.0 | GO:0046696 | lipopolysaccharide receptor complex(GO:0046696) |
| 0.5 | 2.9 | GO:0061689 | tricellular tight junction(GO:0061689) |
| 0.4 | 1.3 | GO:0031074 | nucleocytoplasmic shuttling complex(GO:0031074) |
| 0.3 | 1.5 | GO:0035189 | Rb-E2F complex(GO:0035189) |
| 0.3 | 0.9 | GO:0030905 | retromer, tubulation complex(GO:0030905) |
| 0.3 | 2.7 | GO:0072687 | meiotic spindle(GO:0072687) |
| 0.2 | 0.8 | GO:0005594 | collagen type IX trimer(GO:0005594) |
| 0.2 | 3.0 | GO:0042555 | MCM complex(GO:0042555) |
| 0.2 | 1.0 | GO:0000125 | PCAF complex(GO:0000125) |
| 0.2 | 4.3 | GO:0005680 | anaphase-promoting complex(GO:0005680) |
| 0.2 | 6.5 | GO:0043596 | nuclear replication fork(GO:0043596) |
| 0.1 | 0.7 | GO:0071556 | integral component of cytoplasmic side of endoplasmic reticulum membrane(GO:0071458) integral component of lumenal side of endoplasmic reticulum membrane(GO:0071556) lumenal side of endoplasmic reticulum membrane(GO:0098553) |
| 0.1 | 1.1 | GO:0033269 | internode region of axon(GO:0033269) |
| 0.1 | 0.7 | GO:1990357 | terminal web(GO:1990357) |
| 0.1 | 5.6 | GO:0000307 | cyclin-dependent protein kinase holoenzyme complex(GO:0000307) |
| 0.1 | 9.0 | GO:0005758 | mitochondrial intermembrane space(GO:0005758) |
| 0.1 | 4.0 | GO:0030673 | axolemma(GO:0030673) |
| 0.1 | 0.8 | GO:0070552 | BRISC complex(GO:0070552) |
| 0.1 | 1.1 | GO:0005892 | acetylcholine-gated channel complex(GO:0005892) |
| 0.1 | 2.8 | GO:0005689 | U12-type spliceosomal complex(GO:0005689) |
| 0.1 | 2.2 | GO:0002102 | podosome(GO:0002102) |
| 0.1 | 1.2 | GO:0005922 | connexon complex(GO:0005922) |
| 0.1 | 0.3 | GO:1990452 | Parkin-FBXW7-Cul1 ubiquitin ligase complex(GO:1990452) |
| 0.1 | 3.9 | GO:0016459 | myosin complex(GO:0016459) |
| 0.1 | 4.8 | GO:0031594 | neuromuscular junction(GO:0031594) |
| 0.1 | 0.9 | GO:0005852 | eukaryotic translation initiation factor 3 complex(GO:0005852) |
| 0.1 | 0.3 | GO:0034709 | methylosome(GO:0034709) |
| 0.0 | 1.8 | GO:0016592 | mediator complex(GO:0016592) |
| 0.0 | 1.2 | GO:0034451 | centriolar satellite(GO:0034451) |
| 0.0 | 0.2 | GO:0009331 | glycerol-3-phosphate dehydrogenase complex(GO:0009331) |
| 0.0 | 0.2 | GO:0035749 | myelin sheath adaxonal region(GO:0035749) |
| 0.0 | 4.7 | GO:0030496 | midbody(GO:0030496) |
| 0.0 | 2.3 | GO:0030864 | cortical actin cytoskeleton(GO:0030864) |
| 0.0 | 1.1 | GO:0035869 | ciliary transition zone(GO:0035869) |
| 0.0 | 6.2 | GO:0005938 | cell cortex(GO:0005938) |
| 0.0 | 0.4 | GO:0098643 | fibrillar collagen trimer(GO:0005583) banded collagen fibril(GO:0098643) |
| 0.0 | 0.5 | GO:0005736 | DNA-directed RNA polymerase I complex(GO:0005736) |
| 0.0 | 2.1 | GO:0005884 | actin filament(GO:0005884) |
| 0.0 | 0.4 | GO:0031430 | M band(GO:0031430) |
| 0.0 | 2.6 | GO:0000793 | condensed chromosome(GO:0000793) |
| 0.0 | 1.9 | GO:0031225 | anchored component of membrane(GO:0031225) |
| 0.0 | 1.7 | GO:0016605 | PML body(GO:0016605) |
| 0.0 | 0.8 | GO:0030964 | mitochondrial respiratory chain complex I(GO:0005747) NADH dehydrogenase complex(GO:0030964) respiratory chain complex I(GO:0045271) |
| 0.0 | 1.9 | GO:0010008 | endosome membrane(GO:0010008) |
| 0.0 | 3.7 | GO:0009897 | external side of plasma membrane(GO:0009897) |
| 0.0 | 0.5 | GO:0005923 | bicellular tight junction(GO:0005923) occluding junction(GO:0070160) |
| 0.0 | 1.0 | GO:0016528 | sarcoplasm(GO:0016528) |
| 0.0 | 0.1 | GO:0043218 | compact myelin(GO:0043218) |
| 0.0 | 0.4 | GO:0030175 | filopodium(GO:0030175) |
| 0.0 | 3.1 | GO:0005759 | mitochondrial matrix(GO:0005759) |
| 0.0 | 0.7 | GO:0030173 | integral component of Golgi membrane(GO:0030173) |
| 0.0 | 0.2 | GO:0008250 | oligosaccharyltransferase complex(GO:0008250) |
| 0.0 | 4.8 | GO:0000790 | nuclear chromatin(GO:0000790) |
| 0.0 | 1.5 | GO:0016607 | nuclear speck(GO:0016607) |
| 0.0 | 0.4 | GO:0005834 | heterotrimeric G-protein complex(GO:0005834) |
Gene overrepresentation in molecular_function category:
| Log-likelihood per target | Total log-likelihood | Term | Description |
|---|---|---|---|
| 1.2 | 3.6 | GO:0030368 | interleukin-17 receptor activity(GO:0030368) |
| 0.6 | 1.8 | GO:0004471 | malic enzyme activity(GO:0004470) malate dehydrogenase (decarboxylating) (NAD+) activity(GO:0004471) |
| 0.6 | 2.4 | GO:0004749 | ribose phosphate diphosphokinase activity(GO:0004749) |
| 0.5 | 6.5 | GO:0036310 | annealing helicase activity(GO:0036310) |
| 0.5 | 3.9 | GO:0061133 | endopeptidase activator activity(GO:0061133) |
| 0.5 | 2.4 | GO:0005113 | patched binding(GO:0005113) |
| 0.5 | 1.4 | GO:0005171 | hepatocyte growth factor receptor binding(GO:0005171) |
| 0.4 | 2.2 | GO:0086056 | voltage-gated calcium channel activity involved in AV node cell action potential(GO:0086056) |
| 0.4 | 2.6 | GO:0004852 | uroporphyrinogen-III synthase activity(GO:0004852) |
| 0.4 | 1.3 | GO:0030171 | voltage-gated proton channel activity(GO:0030171) |
| 0.4 | 1.1 | GO:0070052 | collagen V binding(GO:0070052) |
| 0.3 | 8.9 | GO:0016769 | transferase activity, transferring nitrogenous groups(GO:0016769) |
| 0.3 | 1.2 | GO:0015501 | glutamate:sodium symporter activity(GO:0015501) |
| 0.3 | 6.1 | GO:0070064 | proline-rich region binding(GO:0070064) |
| 0.2 | 1.2 | GO:0004839 | ubiquitin activating enzyme activity(GO:0004839) |
| 0.2 | 0.7 | GO:0033829 | O-fucosylpeptide 3-beta-N-acetylglucosaminyltransferase activity(GO:0033829) |
| 0.2 | 0.9 | GO:1990460 | leptin receptor binding(GO:1990460) |
| 0.2 | 2.3 | GO:0016004 | phospholipase activator activity(GO:0016004) lipase activator activity(GO:0060229) |
| 0.2 | 2.1 | GO:0008889 | glycerophosphodiester phosphodiesterase activity(GO:0008889) |
| 0.2 | 3.0 | GO:0001530 | lipopolysaccharide binding(GO:0001530) |
| 0.2 | 2.5 | GO:0015197 | peptide transporter activity(GO:0015197) |
| 0.2 | 2.8 | GO:0030228 | lipoprotein particle receptor activity(GO:0030228) |
| 0.2 | 0.5 | GO:0001565 | phorbol ester receptor activity(GO:0001565) non-kinase phorbol ester receptor activity(GO:0001566) |
| 0.2 | 1.4 | GO:0003958 | NADPH-hemoprotein reductase activity(GO:0003958) |
| 0.2 | 1.2 | GO:0004303 | estradiol 17-beta-dehydrogenase activity(GO:0004303) |
| 0.1 | 2.6 | GO:0008307 | structural constituent of muscle(GO:0008307) |
| 0.1 | 0.4 | GO:0035575 | histone demethylase activity (H4-K20 specific)(GO:0035575) |
| 0.1 | 1.5 | GO:0022841 | potassium ion leak channel activity(GO:0022841) |
| 0.1 | 0.3 | GO:0050816 | phosphothreonine binding(GO:0050816) |
| 0.1 | 1.2 | GO:0005243 | gap junction channel activity(GO:0005243) |
| 0.1 | 1.1 | GO:0004889 | acetylcholine-activated cation-selective channel activity(GO:0004889) |
| 0.1 | 0.9 | GO:0008420 | CTD phosphatase activity(GO:0008420) |
| 0.1 | 2.9 | GO:0003746 | translation elongation factor activity(GO:0003746) |
| 0.1 | 1.1 | GO:0050897 | cobalt ion binding(GO:0050897) |
| 0.1 | 0.4 | GO:0004826 | phenylalanine-tRNA ligase activity(GO:0004826) |
| 0.1 | 10.2 | GO:0003705 | transcription factor activity, RNA polymerase II distal enhancer sequence-specific binding(GO:0003705) |
| 0.1 | 1.6 | GO:0008353 | RNA polymerase II carboxy-terminal domain kinase activity(GO:0008353) |
| 0.1 | 0.2 | GO:0004368 | glycerol-3-phosphate dehydrogenase activity(GO:0004368) |
| 0.1 | 3.0 | GO:0008748 | N-ethylmaleimide reductase activity(GO:0008748) reduced coenzyme F420 dehydrogenase activity(GO:0043738) sulfur oxygenase reductase activity(GO:0043826) malolactic enzyme activity(GO:0043883) epoxyqueuosine reductase activity(GO:0052693) |
| 0.1 | 0.7 | GO:0042500 | aspartic endopeptidase activity, intramembrane cleaving(GO:0042500) |
| 0.1 | 3.9 | GO:0030507 | spectrin binding(GO:0030507) |
| 0.1 | 3.0 | GO:0004003 | ATP-dependent DNA helicase activity(GO:0004003) |
| 0.1 | 3.0 | GO:0061631 | ubiquitin conjugating enzyme activity(GO:0061631) |
| 0.1 | 0.8 | GO:0043236 | laminin binding(GO:0043236) |
| 0.1 | 1.5 | GO:0042605 | peptide antigen binding(GO:0042605) |
| 0.1 | 1.1 | GO:0070006 | metalloaminopeptidase activity(GO:0070006) |
| 0.1 | 1.1 | GO:0030506 | ankyrin binding(GO:0030506) |
| 0.1 | 2.1 | GO:0043027 | cysteine-type endopeptidase inhibitor activity involved in apoptotic process(GO:0043027) |
| 0.1 | 0.8 | GO:0005313 | L-glutamate transmembrane transporter activity(GO:0005313) |
| 0.1 | 2.0 | GO:0008536 | Ran GTPase binding(GO:0008536) |
| 0.0 | 1.6 | GO:0030276 | clathrin binding(GO:0030276) |
| 0.0 | 0.3 | GO:0004013 | adenosylhomocysteinase activity(GO:0004013) trialkylsulfonium hydrolase activity(GO:0016802) |
| 0.0 | 1.9 | GO:0005109 | frizzled binding(GO:0005109) |
| 0.0 | 1.3 | GO:0003887 | DNA-directed DNA polymerase activity(GO:0003887) |
| 0.0 | 1.1 | GO:0019706 | protein-cysteine S-palmitoyltransferase activity(GO:0019706) |
| 0.0 | 1.3 | GO:0030332 | cyclin binding(GO:0030332) |
| 0.0 | 3.6 | GO:0004222 | metalloendopeptidase activity(GO:0004222) |
| 0.0 | 0.2 | GO:0010997 | anaphase-promoting complex binding(GO:0010997) |
| 0.0 | 0.3 | GO:0008479 | queuine tRNA-ribosyltransferase activity(GO:0008479) |
| 0.0 | 0.7 | GO:0050253 | prenylcysteine methylesterase activity(GO:0010296) 1-oxa-2-oxocycloheptane lactonase activity(GO:0018731) sulfolactone hydrolase activity(GO:0018732) butyrolactone hydrolase activity(GO:0018734) endosulfan lactone lactonase activity(GO:0034892) L-ascorbate 6-phosphate lactonase activity(GO:0035460) Ser-tRNA(Thr) hydrolase activity(GO:0043905) Ala-tRNA(Pro) hydrolase activity(GO:0043906) Cys-tRNA(Pro) hydrolase activity(GO:0043907) Ser(Gly)-tRNA(Ala) hydrolase activity(GO:0043908) all-trans-retinyl-palmitate hydrolase, all-trans-retinol forming activity(GO:0047376) retinyl-palmitate esterase activity(GO:0050253) mannosyl-oligosaccharide 1,6-alpha-mannosidase activity(GO:0052767) mannosyl-oligosaccharide 1,3-alpha-mannosidase activity(GO:0052768) methyl indole-3-acetate esterase activity(GO:0080030) methyl salicylate esterase activity(GO:0080031) methyl jasmonate esterase activity(GO:0080032) |
| 0.0 | 0.1 | GO:0019966 | interleukin-1 binding(GO:0019966) |
| 0.0 | 0.5 | GO:0005540 | hyaluronic acid binding(GO:0005540) |
| 0.0 | 0.5 | GO:0001054 | RNA polymerase I activity(GO:0001054) |
| 0.0 | 0.8 | GO:0005164 | tumor necrosis factor receptor binding(GO:0005164) |
| 0.0 | 1.6 | GO:0004879 | RNA polymerase II transcription factor activity, ligand-activated sequence-specific DNA binding(GO:0004879) transcription factor activity, direct ligand regulated sequence-specific DNA binding(GO:0098531) |
| 0.0 | 6.3 | GO:0003924 | GTPase activity(GO:0003924) |
| 0.0 | 2.4 | GO:0002039 | p53 binding(GO:0002039) |
| 0.0 | 1.1 | GO:0032266 | phosphatidylinositol-3-phosphate binding(GO:0032266) |
| 0.0 | 0.8 | GO:0050136 | NADH dehydrogenase (ubiquinone) activity(GO:0008137) NADH dehydrogenase (quinone) activity(GO:0050136) |
| 0.0 | 0.3 | GO:0004143 | diacylglycerol kinase activity(GO:0004143) |
| 0.0 | 4.2 | GO:0005525 | GTP binding(GO:0005525) |
| 0.0 | 3.4 | GO:0017137 | Rab GTPase binding(GO:0017137) |
| 0.0 | 0.6 | GO:0051059 | NF-kappaB binding(GO:0051059) |
| 0.0 | 4.5 | GO:0003729 | mRNA binding(GO:0003729) |
| 0.0 | 0.3 | GO:0050750 | low-density lipoprotein particle receptor binding(GO:0050750) |
| 0.0 | 6.8 | GO:0000978 | RNA polymerase II core promoter proximal region sequence-specific DNA binding(GO:0000978) |
| 0.0 | 0.7 | GO:0033613 | activating transcription factor binding(GO:0033613) |
| 0.0 | 0.2 | GO:0004579 | dolichyl-diphosphooligosaccharide-protein glycotransferase activity(GO:0004579) |
| 0.0 | 1.0 | GO:0004402 | histone acetyltransferase activity(GO:0004402) |
| 0.0 | 0.9 | GO:0003743 | translation initiation factor activity(GO:0003743) |
| 0.0 | 0.1 | GO:0008808 | cardiolipin synthase activity(GO:0008808) phosphatidyltransferase activity(GO:0030572) |
| 0.0 | 0.1 | GO:0048403 | brain-derived neurotrophic factor binding(GO:0048403) |
| 0.0 | 0.8 | GO:0005548 | phospholipid transporter activity(GO:0005548) |
| 0.0 | 0.3 | GO:0008327 | methyl-CpG binding(GO:0008327) |
| 0.0 | 0.8 | GO:0019842 | vitamin binding(GO:0019842) |
| 0.0 | 0.7 | GO:0001047 | core promoter binding(GO:0001047) |
| 0.0 | 0.1 | GO:0030898 | actin-dependent ATPase activity(GO:0030898) |