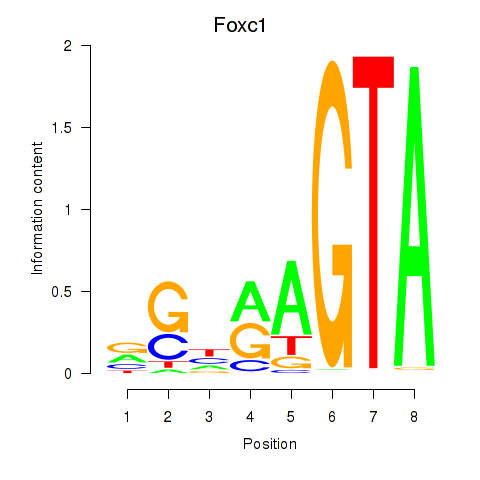
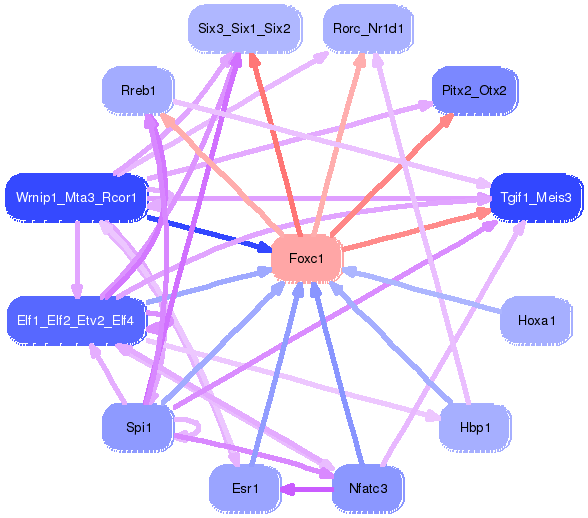
Motif ID: Foxc1
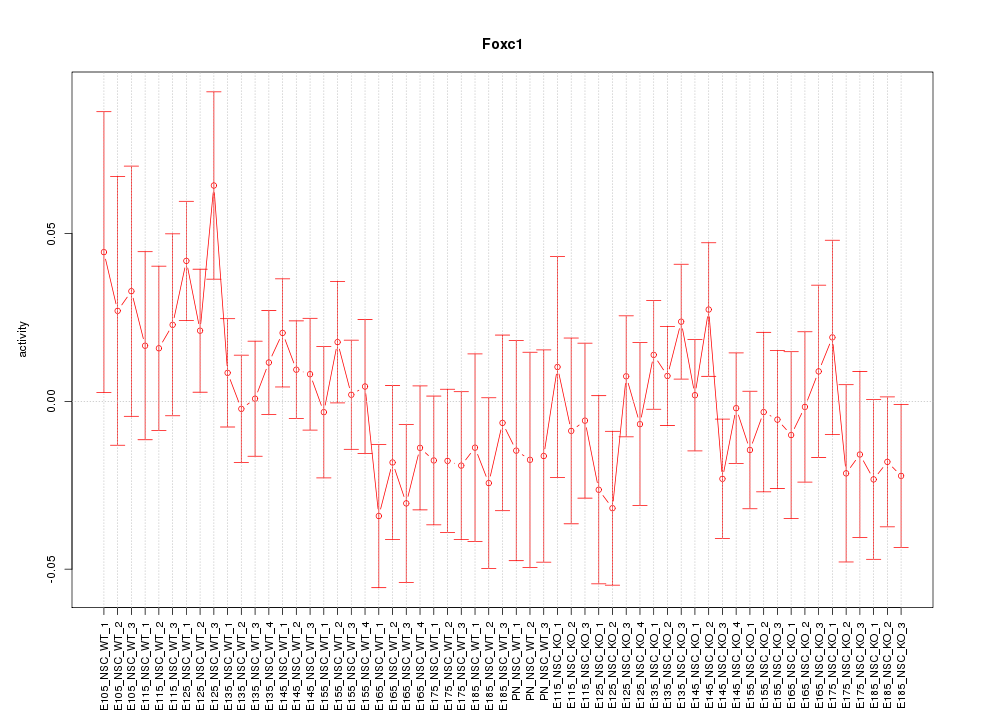
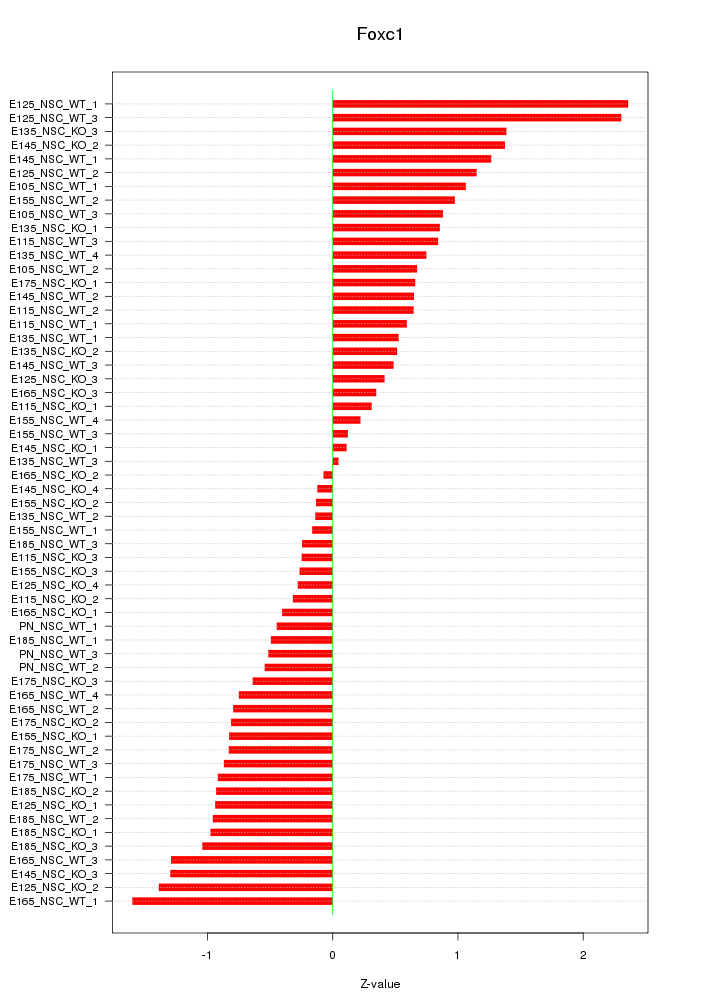
Z-value: 0.875
Transcription factors associated with Foxc1:
| Gene Symbol | Entrez ID | Gene Name |
|---|---|---|
| Foxc1 | ENSMUSG00000050295.2 | Foxc1 |
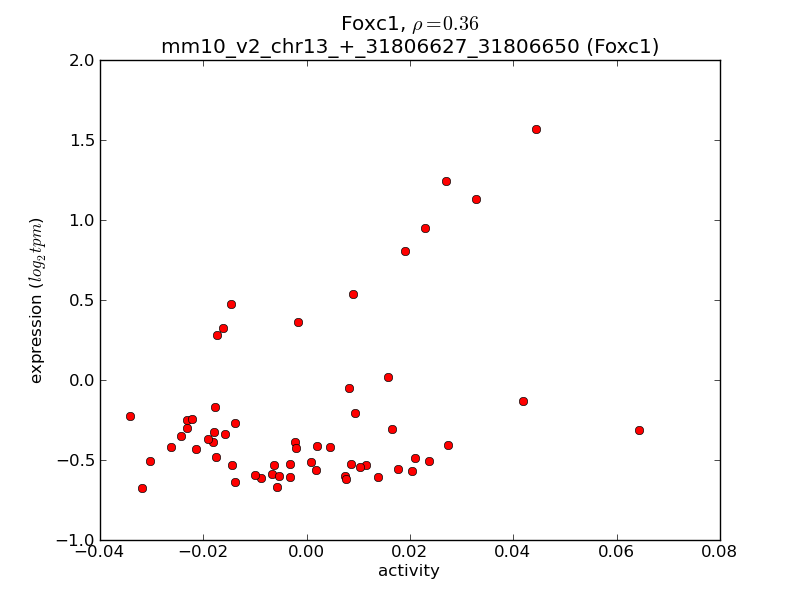
Activity-expression correlation:
| Gene Symbol | Promoter | Pearson corr. coef. | P-value | Plot |
|---|---|---|---|---|
| Foxc1 | mm10_v2_chr13_+_31806627_31806650 | 0.36 | 5.1e-03 | Click! |

Top targets:
Gene overrepresentation in biological_process category:
| Log-likelihood per target | Total log-likelihood | Term | Description |
|---|---|---|---|
| 1.9 | 5.6 | GO:0008582 | regulation of synaptic growth at neuromuscular junction(GO:0008582) |
| 1.5 | 6.1 | GO:0071105 | response to interleukin-9(GO:0071104) response to interleukin-11(GO:0071105) |
| 1.3 | 6.4 | GO:0060414 | aorta smooth muscle tissue morphogenesis(GO:0060414) |
| 1.2 | 3.5 | GO:0006931 | substrate-dependent cell migration, cell attachment to substrate(GO:0006931) calcium-independent cell-matrix adhesion(GO:0007161) |
| 1.1 | 4.5 | GO:0046552 | eye photoreceptor cell fate commitment(GO:0042706) photoreceptor cell fate commitment(GO:0046552) |
| 0.9 | 2.8 | GO:0036118 | hyaluranon cable assembly(GO:0036118) regulation of hyaluranon cable assembly(GO:1900104) positive regulation of hyaluranon cable assembly(GO:1900106) |
| 0.8 | 4.2 | GO:0071205 | clustering of voltage-gated potassium channels(GO:0045163) protein localization to juxtaparanode region of axon(GO:0071205) |
| 0.8 | 2.5 | GO:1990046 | positive regulation of mitochondrial DNA replication(GO:0090297) regulation of cardiolipin metabolic process(GO:1900208) positive regulation of cardiolipin metabolic process(GO:1900210) stress-induced mitochondrial fusion(GO:1990046) |
| 0.7 | 2.9 | GO:0003430 | growth plate cartilage chondrocyte growth(GO:0003430) |
| 0.6 | 1.7 | GO:0002014 | vasoconstriction of artery involved in ischemic response to lowering of systemic arterial blood pressure(GO:0002014) |
| 0.5 | 2.1 | GO:0007056 | spindle assembly involved in female meiosis(GO:0007056) positive regulation of oocyte development(GO:0060282) |
| 0.5 | 3.7 | GO:0072539 | T-helper 17 cell differentiation(GO:0072539) |
| 0.4 | 1.7 | GO:0045343 | MHC class I biosynthetic process(GO:0045341) regulation of MHC class I biosynthetic process(GO:0045343) positive regulation of MHC class I biosynthetic process(GO:0045345) |
| 0.4 | 1.2 | GO:0036091 | positive regulation of transcription from RNA polymerase II promoter in response to oxidative stress(GO:0036091) |
| 0.3 | 1.7 | GO:0006369 | termination of RNA polymerase II transcription(GO:0006369) |
| 0.3 | 1.1 | GO:0071475 | cellular hyperosmotic salinity response(GO:0071475) |
| 0.3 | 0.8 | GO:0060315 | negative regulation of ryanodine-sensitive calcium-release channel activity(GO:0060315) |
| 0.3 | 4.2 | GO:0048387 | negative regulation of retinoic acid receptor signaling pathway(GO:0048387) |
| 0.3 | 3.5 | GO:0001731 | formation of translation preinitiation complex(GO:0001731) |
| 0.2 | 2.0 | GO:0033601 | positive regulation of mammary gland epithelial cell proliferation(GO:0033601) regulation of wound healing, spreading of epidermal cells(GO:1903689) |
| 0.2 | 1.5 | GO:0003065 | positive regulation of heart rate by epinephrine(GO:0003065) |
| 0.2 | 1.5 | GO:0042535 | positive regulation of tumor necrosis factor biosynthetic process(GO:0042535) |
| 0.2 | 5.5 | GO:0042104 | positive regulation of activated T cell proliferation(GO:0042104) |
| 0.2 | 1.4 | GO:0051694 | pointed-end actin filament capping(GO:0051694) |
| 0.2 | 0.7 | GO:0032513 | negative regulation of protein phosphatase type 2B activity(GO:0032513) |
| 0.2 | 1.2 | GO:0046909 | intermembrane transport(GO:0046909) |
| 0.2 | 3.1 | GO:0032515 | negative regulation of phosphoprotein phosphatase activity(GO:0032515) |
| 0.2 | 1.2 | GO:0006177 | GMP biosynthetic process(GO:0006177) |
| 0.2 | 0.8 | GO:1900740 | regulation of protein insertion into mitochondrial membrane involved in apoptotic signaling pathway(GO:1900739) positive regulation of protein insertion into mitochondrial membrane involved in apoptotic signaling pathway(GO:1900740) |
| 0.2 | 1.7 | GO:0035520 | monoubiquitinated protein deubiquitination(GO:0035520) |
| 0.2 | 1.1 | GO:2000672 | negative regulation of motor neuron apoptotic process(GO:2000672) |
| 0.2 | 2.5 | GO:0042178 | xenobiotic catabolic process(GO:0042178) |
| 0.1 | 2.5 | GO:0070286 | axonemal dynein complex assembly(GO:0070286) |
| 0.1 | 0.7 | GO:0051890 | regulation of cardioblast differentiation(GO:0051890) |
| 0.1 | 1.2 | GO:0030854 | positive regulation of granulocyte differentiation(GO:0030854) |
| 0.1 | 0.9 | GO:0090086 | negative regulation of protein deubiquitination(GO:0090086) |
| 0.1 | 0.5 | GO:0001550 | ovarian cumulus expansion(GO:0001550) fused antrum stage(GO:0048165) |
| 0.1 | 1.7 | GO:0034390 | smooth muscle cell apoptotic process(GO:0034390) regulation of smooth muscle cell apoptotic process(GO:0034391) |
| 0.1 | 0.3 | GO:2000642 | negative regulation of early endosome to late endosome transport(GO:2000642) |
| 0.1 | 3.5 | GO:0031146 | SCF-dependent proteasomal ubiquitin-dependent protein catabolic process(GO:0031146) |
| 0.1 | 2.0 | GO:0015985 | energy coupled proton transport, down electrochemical gradient(GO:0015985) ATP synthesis coupled proton transport(GO:0015986) |
| 0.1 | 0.3 | GO:1901491 | negative regulation of lymphangiogenesis(GO:1901491) |
| 0.1 | 1.7 | GO:0051131 | chaperone-mediated protein complex assembly(GO:0051131) |
| 0.1 | 0.4 | GO:0090273 | regulation of somatostatin secretion(GO:0090273) |
| 0.1 | 1.3 | GO:0001946 | lymphangiogenesis(GO:0001946) lymph vessel morphogenesis(GO:0036303) |
| 0.1 | 1.2 | GO:0034389 | lipid particle organization(GO:0034389) |
| 0.1 | 0.7 | GO:0009650 | UV protection(GO:0009650) |
| 0.1 | 0.9 | GO:0048096 | chromatin-mediated maintenance of transcription(GO:0048096) |
| 0.1 | 3.0 | GO:0045668 | negative regulation of osteoblast differentiation(GO:0045668) |
| 0.1 | 1.2 | GO:0070208 | protein heterotrimerization(GO:0070208) |
| 0.1 | 1.4 | GO:0032011 | ARF protein signal transduction(GO:0032011) regulation of ARF protein signal transduction(GO:0032012) |
| 0.1 | 0.4 | GO:0043416 | regulation of skeletal muscle tissue regeneration(GO:0043416) |
| 0.1 | 0.2 | GO:0070345 | negative regulation of fat cell proliferation(GO:0070345) |
| 0.1 | 0.7 | GO:0045671 | negative regulation of osteoclast differentiation(GO:0045671) |
| 0.1 | 0.2 | GO:0002572 | pro-T cell differentiation(GO:0002572) |
| 0.0 | 0.9 | GO:0043486 | histone exchange(GO:0043486) |
| 0.0 | 1.2 | GO:1903846 | positive regulation of transforming growth factor beta receptor signaling pathway(GO:0030511) positive regulation of cellular response to transforming growth factor beta stimulus(GO:1903846) |
| 0.0 | 0.5 | GO:0019243 | methylglyoxal catabolic process to D-lactate via S-lactoyl-glutathione(GO:0019243) methylglyoxal catabolic process(GO:0051596) methylglyoxal catabolic process to lactate(GO:0061727) |
| 0.0 | 0.9 | GO:0032968 | positive regulation of transcription elongation from RNA polymerase II promoter(GO:0032968) |
| 0.0 | 0.2 | GO:0036324 | vascular endothelial growth factor receptor-2 signaling pathway(GO:0036324) |
| 0.0 | 0.2 | GO:0070989 | oxidative demethylation(GO:0070989) |
| 0.0 | 1.1 | GO:0010107 | potassium ion import(GO:0010107) |
| 0.0 | 0.3 | GO:0032625 | interleukin-21 production(GO:0032625) interleukin-21 secretion(GO:0072619) |
| 0.0 | 1.4 | GO:0048255 | mRNA stabilization(GO:0048255) |
| 0.0 | 0.9 | GO:0050829 | defense response to Gram-negative bacterium(GO:0050829) |
| 0.0 | 5.5 | GO:0010466 | negative regulation of peptidase activity(GO:0010466) |
| 0.0 | 2.1 | GO:0042632 | cholesterol homeostasis(GO:0042632) sterol homeostasis(GO:0055092) |
| 0.0 | 3.3 | GO:0007605 | sensory perception of sound(GO:0007605) |
| 0.0 | 2.3 | GO:0009636 | response to toxic substance(GO:0009636) |
| 0.0 | 0.6 | GO:0034067 | protein localization to Golgi apparatus(GO:0034067) |
| 0.0 | 0.3 | GO:0032486 | Rap protein signal transduction(GO:0032486) |
| 0.0 | 0.4 | GO:0042417 | dopamine metabolic process(GO:0042417) |
| 0.0 | 1.0 | GO:0002209 | behavioral fear response(GO:0001662) behavioral defense response(GO:0002209) |
| 0.0 | 0.7 | GO:0051220 | cytoplasmic sequestering of protein(GO:0051220) |
| 0.0 | 1.6 | GO:0098792 | xenophagy(GO:0098792) |
| 0.0 | 0.2 | GO:0015937 | coenzyme A biosynthetic process(GO:0015937) |
| 0.0 | 0.3 | GO:0015991 | energy coupled proton transmembrane transport, against electrochemical gradient(GO:0015988) ATP hydrolysis coupled proton transport(GO:0015991) ATP hydrolysis coupled transmembrane transport(GO:0090662) |
| 0.0 | 0.3 | GO:0070584 | mitochondrion morphogenesis(GO:0070584) |
| 0.0 | 1.7 | GO:0030218 | erythrocyte differentiation(GO:0030218) |
| 0.0 | 0.4 | GO:0031365 | N-terminal protein amino acid modification(GO:0031365) |
| 0.0 | 0.2 | GO:0035563 | positive regulation of chromatin binding(GO:0035563) |
| 0.0 | 0.0 | GO:0061743 | motor learning(GO:0061743) |
Gene overrepresentation in cellular_component category:
| Log-likelihood per target | Total log-likelihood | Term | Description |
|---|---|---|---|
| 1.2 | 3.5 | GO:0005577 | fibrinogen complex(GO:0005577) |
| 0.7 | 2.1 | GO:0042585 | germinal vesicle(GO:0042585) |
| 0.5 | 6.4 | GO:0098643 | fibrillar collagen trimer(GO:0005583) banded collagen fibril(GO:0098643) |
| 0.4 | 1.2 | GO:1990037 | Lewy body core(GO:1990037) |
| 0.3 | 0.8 | GO:0042584 | chromaffin granule membrane(GO:0042584) |
| 0.3 | 0.8 | GO:0034457 | Mpp10 complex(GO:0034457) |
| 0.2 | 3.2 | GO:0000164 | protein phosphatase type 1 complex(GO:0000164) |
| 0.2 | 1.7 | GO:0060293 | P granule(GO:0043186) pole plasm(GO:0045495) germ plasm(GO:0060293) |
| 0.2 | 0.9 | GO:0019815 | B cell receptor complex(GO:0019815) |
| 0.2 | 1.1 | GO:0043564 | Ku70:Ku80 complex(GO:0043564) |
| 0.2 | 2.5 | GO:0042101 | T cell receptor complex(GO:0042101) |
| 0.2 | 1.2 | GO:0044613 | nuclear pore central transport channel(GO:0044613) Flemming body(GO:0090543) |
| 0.2 | 1.5 | GO:0005862 | muscle thin filament tropomyosin(GO:0005862) |
| 0.1 | 2.0 | GO:0045263 | proton-transporting ATP synthase complex, coupling factor F(o)(GO:0045263) |
| 0.1 | 0.4 | GO:0005899 | insulin receptor complex(GO:0005899) |
| 0.1 | 1.2 | GO:0032591 | dendritic spine membrane(GO:0032591) |
| 0.1 | 1.6 | GO:0031229 | integral component of nuclear inner membrane(GO:0005639) intrinsic component of nuclear inner membrane(GO:0031229) |
| 0.1 | 0.8 | GO:0016281 | eukaryotic translation initiation factor 4F complex(GO:0016281) |
| 0.1 | 1.4 | GO:0005865 | striated muscle thin filament(GO:0005865) |
| 0.1 | 1.7 | GO:0044224 | juxtaparanode region of axon(GO:0044224) |
| 0.1 | 3.1 | GO:0032420 | stereocilium(GO:0032420) |
| 0.1 | 0.9 | GO:0048188 | MLL3/4 complex(GO:0044666) Set1C/COMPASS complex(GO:0048188) |
| 0.1 | 2.6 | GO:0016235 | aggresome(GO:0016235) |
| 0.1 | 0.3 | GO:0070876 | SOSS complex(GO:0070876) |
| 0.1 | 1.3 | GO:0002102 | podosome(GO:0002102) |
| 0.1 | 0.2 | GO:1990032 | parallel fiber(GO:1990032) |
| 0.0 | 0.7 | GO:0033017 | sarcoplasmic reticulum membrane(GO:0033017) |
| 0.0 | 1.3 | GO:0016234 | inclusion body(GO:0016234) |
| 0.0 | 0.3 | GO:0033180 | proton-transporting V-type ATPase, V1 domain(GO:0033180) |
| 0.0 | 2.1 | GO:0005791 | rough endoplasmic reticulum(GO:0005791) |
| 0.0 | 1.9 | GO:0005758 | mitochondrial intermembrane space(GO:0005758) |
| 0.0 | 9.6 | GO:0005667 | transcription factor complex(GO:0005667) |
| 0.0 | 1.3 | GO:0000932 | cytoplasmic mRNA processing body(GO:0000932) |
| 0.0 | 2.5 | GO:0036064 | ciliary basal body(GO:0036064) |
| 0.0 | 0.1 | GO:0070022 | transforming growth factor beta receptor homodimeric complex(GO:0070022) |
| 0.0 | 1.4 | GO:0005844 | polysome(GO:0005844) |
| 0.0 | 1.8 | GO:0030864 | cortical actin cytoskeleton(GO:0030864) |
| 0.0 | 0.2 | GO:0000124 | SAGA complex(GO:0000124) |
| 0.0 | 0.3 | GO:0005922 | connexon complex(GO:0005922) |
| 0.0 | 0.8 | GO:0045171 | intercellular bridge(GO:0045171) |
| 0.0 | 11.0 | GO:0005615 | extracellular space(GO:0005615) |
Gene overrepresentation in molecular_function category:
| Log-likelihood per target | Total log-likelihood | Term | Description |
|---|---|---|---|
| 0.9 | 3.7 | GO:0008142 | oxysterol binding(GO:0008142) |
| 0.9 | 2.8 | GO:0050501 | hyaluronan synthase activity(GO:0050501) |
| 0.8 | 2.5 | GO:1901611 | phosphatidylglycerol binding(GO:1901611) cardiolipin binding(GO:1901612) |
| 0.8 | 6.1 | GO:0050693 | LBD domain binding(GO:0050693) |
| 0.6 | 3.5 | GO:0045340 | mercury ion binding(GO:0045340) |
| 0.5 | 3.9 | GO:0031995 | insulin-like growth factor II binding(GO:0031995) |
| 0.4 | 6.4 | GO:0048407 | platelet-derived growth factor binding(GO:0048407) |
| 0.4 | 1.2 | GO:0019966 | interleukin-1 binding(GO:0019966) |
| 0.3 | 3.1 | GO:0004865 | protein serine/threonine phosphatase inhibitor activity(GO:0004865) |
| 0.3 | 1.6 | GO:0035381 | extracellular ATP-gated cation channel activity(GO:0004931) ATP-gated ion channel activity(GO:0035381) |
| 0.3 | 1.2 | GO:0003938 | IMP dehydrogenase activity(GO:0003938) |
| 0.3 | 1.2 | GO:0051425 | PTB domain binding(GO:0051425) |
| 0.3 | 2.1 | GO:0035174 | histone serine kinase activity(GO:0035174) |
| 0.3 | 1.2 | GO:0016018 | cyclosporin A binding(GO:0016018) |
| 0.3 | 0.8 | GO:0030519 | snoRNP binding(GO:0030519) |
| 0.2 | 1.7 | GO:0048101 | calcium- and calmodulin-regulated 3',5'-cyclic-GMP phosphodiesterase activity(GO:0048101) |
| 0.2 | 4.2 | GO:0070410 | co-SMAD binding(GO:0070410) |
| 0.2 | 1.7 | GO:1990446 | U1 snRNP binding(GO:1990446) |
| 0.2 | 0.7 | GO:0004096 | aminoacylase activity(GO:0004046) catalase activity(GO:0004096) |
| 0.2 | 1.4 | GO:0005523 | tropomyosin binding(GO:0005523) |
| 0.2 | 0.6 | GO:0047760 | butyrate-CoA ligase activity(GO:0047760) |
| 0.1 | 2.9 | GO:0003708 | retinoic acid receptor activity(GO:0003708) |
| 0.1 | 0.9 | GO:0019211 | phosphatase activator activity(GO:0019211) |
| 0.1 | 6.0 | GO:0004867 | serine-type endopeptidase inhibitor activity(GO:0004867) |
| 0.1 | 2.5 | GO:0070402 | NADPH binding(GO:0070402) |
| 0.1 | 0.9 | GO:1990188 | euchromatin binding(GO:1990188) |
| 0.1 | 1.1 | GO:0051575 | 5'-deoxyribose-5-phosphate lyase activity(GO:0051575) |
| 0.1 | 0.9 | GO:0034046 | poly(G) binding(GO:0034046) |
| 0.1 | 1.2 | GO:0043522 | leucine zipper domain binding(GO:0043522) |
| 0.1 | 0.4 | GO:0004427 | inorganic diphosphatase activity(GO:0004427) |
| 0.1 | 0.7 | GO:0050815 | phosphoserine binding(GO:0050815) |
| 0.1 | 1.0 | GO:0008190 | eukaryotic initiation factor 4E binding(GO:0008190) |
| 0.1 | 2.0 | GO:0005159 | insulin-like growth factor receptor binding(GO:0005159) |
| 0.1 | 0.2 | GO:0004140 | dephospho-CoA kinase activity(GO:0004140) |
| 0.1 | 0.5 | GO:0005025 | transforming growth factor beta receptor activity, type I(GO:0005025) |
| 0.1 | 0.9 | GO:0034987 | immunoglobulin receptor binding(GO:0034987) |
| 0.1 | 1.5 | GO:0009931 | calcium-dependent protein serine/threonine kinase activity(GO:0009931) |
| 0.1 | 0.7 | GO:0048185 | activin binding(GO:0048185) |
| 0.1 | 3.3 | GO:0003743 | translation initiation factor activity(GO:0003743) |
| 0.1 | 0.7 | GO:0010314 | phosphatidylinositol-5-phosphate binding(GO:0010314) |
| 0.1 | 0.5 | GO:0004416 | hydroxyacylglutathione hydrolase activity(GO:0004416) |
| 0.1 | 1.1 | GO:0005242 | inward rectifier potassium channel activity(GO:0005242) |
| 0.1 | 1.5 | GO:0043014 | alpha-tubulin binding(GO:0043014) |
| 0.0 | 5.1 | GO:0002020 | protease binding(GO:0002020) |
| 0.0 | 0.9 | GO:0070628 | proteasome binding(GO:0070628) |
| 0.0 | 3.7 | GO:0000979 | RNA polymerase II core promoter sequence-specific DNA binding(GO:0000979) |
| 0.0 | 1.7 | GO:0001205 | transcriptional activator activity, RNA polymerase II distal enhancer sequence-specific binding(GO:0001205) |
| 0.0 | 0.2 | GO:0070579 | methylcytosine dioxygenase activity(GO:0070579) |
| 0.0 | 1.4 | GO:0005086 | ARF guanyl-nucleotide exchange factor activity(GO:0005086) |
| 0.0 | 3.2 | GO:0008172 | S-methyltransferase activity(GO:0008172) |
| 0.0 | 8.0 | GO:0001077 | transcriptional activator activity, RNA polymerase II core promoter proximal region sequence-specific binding(GO:0001077) |
| 0.0 | 0.1 | GO:0008157 | protein phosphatase 1 binding(GO:0008157) |
| 0.0 | 0.2 | GO:0035662 | Toll-like receptor 4 binding(GO:0035662) |
| 0.0 | 0.9 | GO:0051879 | Hsp90 protein binding(GO:0051879) |
| 0.0 | 0.7 | GO:0031492 | nucleosomal DNA binding(GO:0031492) |
| 0.0 | 0.3 | GO:0031078 | histone deacetylase activity (H3-K14 specific)(GO:0031078) NAD-dependent histone deacetylase activity (H3-K14 specific)(GO:0032041) |
| 0.0 | 1.4 | GO:0003730 | mRNA 3'-UTR binding(GO:0003730) |
| 0.0 | 2.0 | GO:0015078 | hydrogen ion transmembrane transporter activity(GO:0015078) |
| 0.0 | 1.7 | GO:0004843 | thiol-dependent ubiquitin-specific protease activity(GO:0004843) |
| 0.0 | 0.8 | GO:0030971 | receptor tyrosine kinase binding(GO:0030971) |
| 0.0 | 0.3 | GO:0016805 | dipeptidase activity(GO:0016805) |
| 0.0 | 3.5 | GO:0003735 | structural constituent of ribosome(GO:0003735) |
| 0.0 | 1.3 | GO:0008083 | growth factor activity(GO:0008083) |
| 0.0 | 0.1 | GO:0035615 | clathrin adaptor activity(GO:0035615) endocytic adaptor activity(GO:0098748) |
| 0.0 | 0.8 | GO:0051082 | unfolded protein binding(GO:0051082) |
| 0.0 | 1.1 | GO:0051087 | chaperone binding(GO:0051087) |
| 0.0 | 2.0 | GO:0051015 | actin filament binding(GO:0051015) |
| 0.0 | 0.2 | GO:0070530 | K63-linked polyubiquitin binding(GO:0070530) |
| 0.0 | 0.3 | GO:0004869 | cysteine-type endopeptidase inhibitor activity(GO:0004869) |