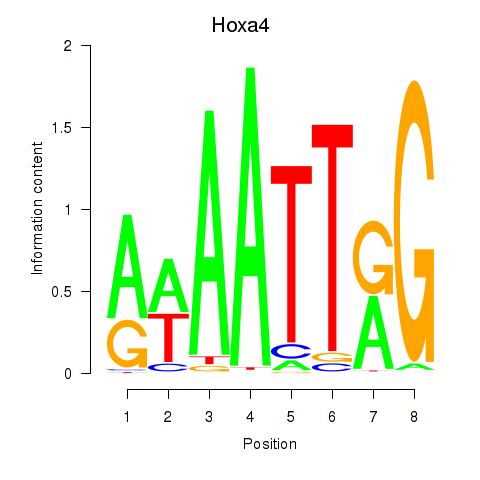
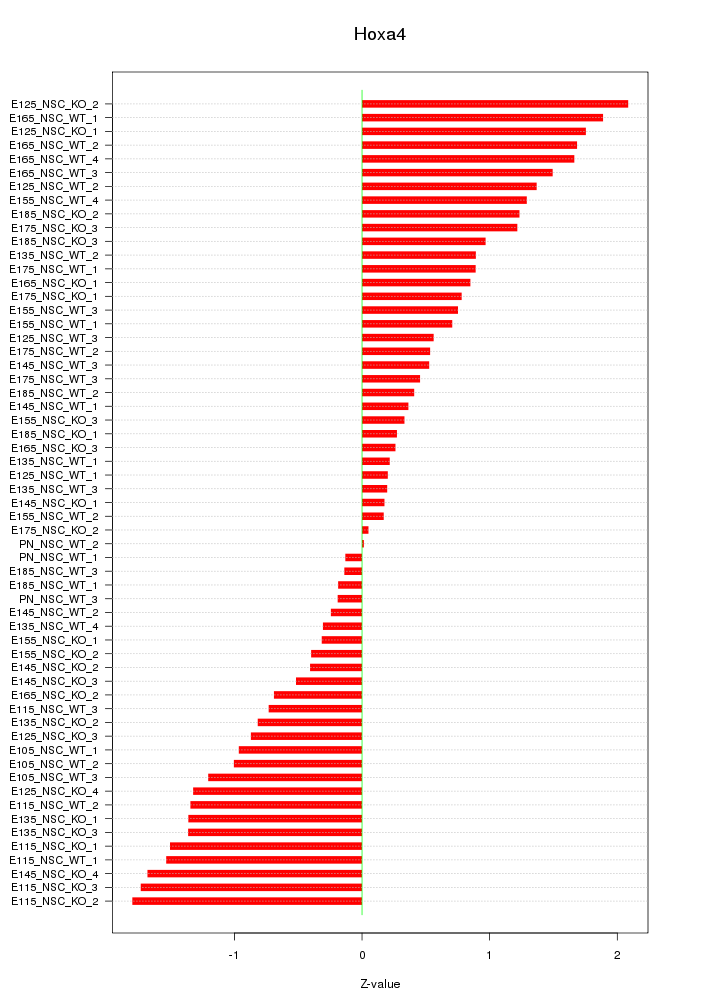
Motif ID: Hoxa4
Z-value: 1.007
Transcription factors associated with Hoxa4:
| Gene Symbol | Entrez ID | Gene Name |
|---|---|---|
| Hoxa4 | ENSMUSG00000000942.10 | Hoxa4 |


Top targets:
Gene overrepresentation in biological_process category:
| Log-likelihood per target | Total log-likelihood | Term | Description |
|---|---|---|---|
| 3.7 | 11.1 | GO:0021893 | cerebral cortex GABAergic interneuron fate commitment(GO:0021893) |
| 2.5 | 7.4 | GO:0001928 | regulation of exocyst assembly(GO:0001928) |
| 1.6 | 17.6 | GO:0042572 | retinol metabolic process(GO:0042572) |
| 1.3 | 3.8 | GO:2001139 | negative regulation of postsynaptic membrane organization(GO:1901627) negative regulation of dendritic spine maintenance(GO:1902951) negative regulation of phospholipid efflux(GO:1902999) regulation of lipid transport across blood brain barrier(GO:1903000) negative regulation of lipid transport across blood brain barrier(GO:1903001) positive regulation of lipid transport across blood brain barrier(GO:1903002) negative regulation of phospholipid transport(GO:2001139) |
| 1.1 | 3.4 | GO:0072092 | ureteric bud invasion(GO:0072092) |
| 1.0 | 7.0 | GO:0060666 | dichotomous subdivision of terminal units involved in salivary gland branching(GO:0060666) |
| 0.9 | 2.7 | GO:0086046 | membrane depolarization during SA node cell action potential(GO:0086046) |
| 0.7 | 4.4 | GO:0072318 | clathrin coat disassembly(GO:0072318) |
| 0.7 | 8.0 | GO:0051386 | regulation of neurotrophin TRK receptor signaling pathway(GO:0051386) |
| 0.7 | 6.8 | GO:0071372 | cellular response to follicle-stimulating hormone stimulus(GO:0071372) |
| 0.6 | 3.1 | GO:0046684 | response to pyrethroid(GO:0046684) |
| 0.6 | 2.3 | GO:0051562 | negative regulation of mitochondrial calcium ion concentration(GO:0051562) |
| 0.5 | 3.6 | GO:0009449 | gamma-aminobutyric acid biosynthetic process(GO:0009449) |
| 0.5 | 1.4 | GO:0019401 | alditol biosynthetic process(GO:0019401) |
| 0.5 | 21.5 | GO:0001919 | regulation of receptor recycling(GO:0001919) |
| 0.4 | 0.8 | GO:0001543 | ovarian follicle rupture(GO:0001543) |
| 0.3 | 1.0 | GO:0001830 | trophectodermal cell fate commitment(GO:0001830) |
| 0.3 | 1.4 | GO:0002674 | negative regulation of acute inflammatory response(GO:0002674) |
| 0.3 | 1.3 | GO:1903031 | regulation of microtubule plus-end binding(GO:1903031) positive regulation of microtubule plus-end binding(GO:1903033) |
| 0.3 | 3.0 | GO:0002862 | negative regulation of inflammatory response to antigenic stimulus(GO:0002862) |
| 0.3 | 1.3 | GO:0060745 | mammary gland branching involved in pregnancy(GO:0060745) |
| 0.3 | 2.2 | GO:1903025 | regulation of RNA polymerase II regulatory region sequence-specific DNA binding(GO:1903025) |
| 0.3 | 1.1 | GO:0033540 | fatty acid beta-oxidation using acyl-CoA oxidase(GO:0033540) |
| 0.3 | 1.8 | GO:0060267 | positive regulation of respiratory burst(GO:0060267) |
| 0.3 | 1.8 | GO:0006621 | protein retention in ER lumen(GO:0006621) |
| 0.2 | 1.0 | GO:0010917 | negative regulation of mitochondrial membrane potential(GO:0010917) |
| 0.2 | 0.7 | GO:0090425 | hepatocyte cell migration(GO:0002194) branching involved in pancreas morphogenesis(GO:0061114) acinar cell differentiation(GO:0090425) positive regulation of forebrain neuron differentiation(GO:2000979) |
| 0.2 | 2.9 | GO:0021942 | radial glia guided migration of Purkinje cell(GO:0021942) |
| 0.2 | 2.2 | GO:1900112 | regulation of histone H3-K9 trimethylation(GO:1900112) negative regulation of histone H3-K9 trimethylation(GO:1900113) |
| 0.2 | 2.4 | GO:1901621 | negative regulation of smoothened signaling pathway involved in dorsal/ventral neural tube patterning(GO:1901621) |
| 0.2 | 1.3 | GO:0048934 | peripheral nervous system neuron differentiation(GO:0048934) peripheral nervous system neuron development(GO:0048935) |
| 0.2 | 3.6 | GO:0006744 | ubiquinone biosynthetic process(GO:0006744) |
| 0.2 | 15.5 | GO:0007156 | homophilic cell adhesion via plasma membrane adhesion molecules(GO:0007156) |
| 0.2 | 5.0 | GO:0006089 | lactate metabolic process(GO:0006089) |
| 0.2 | 2.0 | GO:0010650 | positive regulation of cell communication by electrical coupling(GO:0010650) positive regulation of membrane depolarization during cardiac muscle cell action potential(GO:1900827) |
| 0.2 | 2.4 | GO:0032570 | response to progesterone(GO:0032570) |
| 0.2 | 14.1 | GO:0051965 | positive regulation of synapse assembly(GO:0051965) |
| 0.2 | 2.0 | GO:0043084 | penile erection(GO:0043084) |
| 0.2 | 6.5 | GO:0048843 | negative regulation of axon extension involved in axon guidance(GO:0048843) |
| 0.2 | 1.3 | GO:0090244 | Wnt signaling pathway involved in somitogenesis(GO:0090244) |
| 0.2 | 1.1 | GO:0021684 | cerebellar granular layer formation(GO:0021684) cerebellar granule cell differentiation(GO:0021707) |
| 0.2 | 2.9 | GO:0061050 | regulation of cell growth involved in cardiac muscle cell development(GO:0061050) |
| 0.1 | 2.2 | GO:0042759 | long-chain fatty acid biosynthetic process(GO:0042759) |
| 0.1 | 0.3 | GO:0061144 | alveolar secondary septum development(GO:0061144) |
| 0.1 | 6.6 | GO:0030901 | midbrain development(GO:0030901) |
| 0.1 | 3.1 | GO:0007097 | nuclear migration(GO:0007097) |
| 0.1 | 4.9 | GO:0006376 | mRNA splice site selection(GO:0006376) |
| 0.1 | 0.2 | GO:0032829 | regulation of CD4-positive, CD25-positive, alpha-beta regulatory T cell differentiation(GO:0032829) |
| 0.1 | 0.8 | GO:0046085 | adenosine metabolic process(GO:0046085) |
| 0.1 | 1.1 | GO:0044144 | regulation of growth of symbiont in host(GO:0044126) modulation of growth of symbiont involved in interaction with host(GO:0044144) |
| 0.1 | 0.9 | GO:2000671 | regulation of motor neuron apoptotic process(GO:2000671) |
| 0.1 | 6.4 | GO:0030032 | lamellipodium assembly(GO:0030032) |
| 0.1 | 5.4 | GO:0035914 | skeletal muscle cell differentiation(GO:0035914) |
| 0.1 | 0.6 | GO:0060059 | embryonic retina morphogenesis in camera-type eye(GO:0060059) |
| 0.1 | 1.2 | GO:0045653 | negative regulation of megakaryocyte differentiation(GO:0045653) |
| 0.1 | 0.2 | GO:1904263 | positive regulation of TORC1 signaling(GO:1904263) |
| 0.1 | 2.0 | GO:0015991 | energy coupled proton transmembrane transport, against electrochemical gradient(GO:0015988) ATP hydrolysis coupled proton transport(GO:0015991) ATP hydrolysis coupled transmembrane transport(GO:0090662) |
| 0.1 | 0.3 | GO:0044314 | protein K27-linked ubiquitination(GO:0044314) |
| 0.1 | 1.0 | GO:0001553 | luteinization(GO:0001553) |
| 0.1 | 1.0 | GO:0034389 | lipid particle organization(GO:0034389) |
| 0.1 | 0.7 | GO:0007190 | activation of adenylate cyclase activity(GO:0007190) |
| 0.1 | 0.6 | GO:0006120 | mitochondrial electron transport, NADH to ubiquinone(GO:0006120) |
| 0.1 | 1.4 | GO:0000027 | ribosomal large subunit assembly(GO:0000027) |
| 0.0 | 0.8 | GO:0051044 | positive regulation of membrane protein ectodomain proteolysis(GO:0051044) |
| 0.0 | 0.8 | GO:0001783 | B cell apoptotic process(GO:0001783) |
| 0.0 | 2.4 | GO:0008542 | visual learning(GO:0008542) |
| 0.0 | 4.0 | GO:0072332 | intrinsic apoptotic signaling pathway by p53 class mediator(GO:0072332) |
| 0.0 | 1.7 | GO:0090162 | establishment of epithelial cell polarity(GO:0090162) |
| 0.0 | 1.7 | GO:0071300 | cellular response to retinoic acid(GO:0071300) |
| 0.0 | 3.4 | GO:0031532 | actin cytoskeleton reorganization(GO:0031532) |
| 0.0 | 2.8 | GO:0010923 | negative regulation of phosphatase activity(GO:0010923) |
| 0.0 | 1.5 | GO:0030835 | negative regulation of actin filament depolymerization(GO:0030835) |
| 0.0 | 0.3 | GO:0000712 | resolution of meiotic recombination intermediates(GO:0000712) |
| 0.0 | 0.6 | GO:0032011 | ARF protein signal transduction(GO:0032011) regulation of ARF protein signal transduction(GO:0032012) |
| 0.0 | 5.7 | GO:0042787 | protein ubiquitination involved in ubiquitin-dependent protein catabolic process(GO:0042787) |
| 0.0 | 0.2 | GO:0033574 | response to testosterone(GO:0033574) |
| 0.0 | 0.7 | GO:0071480 | cellular response to gamma radiation(GO:0071480) |
| 0.0 | 2.0 | GO:0050852 | T cell receptor signaling pathway(GO:0050852) |
| 0.0 | 0.6 | GO:0016556 | mRNA modification(GO:0016556) |
| 0.0 | 1.2 | GO:0045454 | cell redox homeostasis(GO:0045454) |
| 0.0 | 2.3 | GO:0008360 | regulation of cell shape(GO:0008360) |
| 0.0 | 0.6 | GO:0051592 | response to calcium ion(GO:0051592) |
| 0.0 | 0.1 | GO:0002361 | CD4-positive, CD25-positive, alpha-beta regulatory T cell differentiation(GO:0002361) |
Gene overrepresentation in cellular_component category:
| Log-likelihood per target | Total log-likelihood | Term | Description |
|---|---|---|---|
| 2.0 | 12.1 | GO:0044308 | axonal spine(GO:0044308) |
| 1.3 | 3.8 | GO:0034363 | intermediate-density lipoprotein particle(GO:0034363) |
| 0.6 | 2.5 | GO:0042105 | alpha-beta T cell receptor complex(GO:0042105) |
| 0.6 | 9.5 | GO:0032279 | asymmetric synapse(GO:0032279) |
| 0.3 | 2.7 | GO:1990454 | L-type voltage-gated calcium channel complex(GO:1990454) |
| 0.3 | 1.8 | GO:0097524 | sperm plasma membrane(GO:0097524) |
| 0.3 | 1.8 | GO:0000836 | ER ubiquitin ligase complex(GO:0000835) Hrd1p ubiquitin ligase complex(GO:0000836) |
| 0.2 | 2.0 | GO:0033180 | proton-transporting V-type ATPase, V1 domain(GO:0033180) |
| 0.2 | 3.1 | GO:0034706 | voltage-gated sodium channel complex(GO:0001518) sodium channel complex(GO:0034706) |
| 0.1 | 4.8 | GO:0048786 | presynaptic active zone(GO:0048786) |
| 0.1 | 1.7 | GO:0005952 | cAMP-dependent protein kinase complex(GO:0005952) |
| 0.1 | 0.3 | GO:0071821 | FANCM-MHF complex(GO:0071821) |
| 0.1 | 2.0 | GO:0014731 | spectrin-associated cytoskeleton(GO:0014731) |
| 0.1 | 6.3 | GO:0005791 | rough endoplasmic reticulum(GO:0005791) |
| 0.1 | 2.4 | GO:0035371 | microtubule plus-end(GO:0035371) |
| 0.1 | 2.2 | GO:0005721 | pericentric heterochromatin(GO:0005721) |
| 0.1 | 7.8 | GO:0042641 | actomyosin(GO:0042641) |
| 0.1 | 1.0 | GO:0005614 | interstitial matrix(GO:0005614) |
| 0.1 | 1.3 | GO:0030877 | beta-catenin destruction complex(GO:0030877) |
| 0.1 | 3.4 | GO:0005871 | kinesin complex(GO:0005871) |
| 0.1 | 21.6 | GO:0005911 | cell-cell junction(GO:0005911) |
| 0.1 | 1.0 | GO:0016327 | apicolateral plasma membrane(GO:0016327) |
| 0.0 | 3.0 | GO:0031463 | Cul3-RING ubiquitin ligase complex(GO:0031463) |
| 0.0 | 1.8 | GO:0030315 | T-tubule(GO:0030315) |
| 0.0 | 12.0 | GO:0045211 | postsynaptic membrane(GO:0045211) |
| 0.0 | 0.2 | GO:1990130 | Iml1 complex(GO:1990130) |
| 0.0 | 1.6 | GO:0005788 | endoplasmic reticulum lumen(GO:0005788) |
| 0.0 | 0.6 | GO:0034663 | endoplasmic reticulum chaperone complex(GO:0034663) |
| 0.0 | 2.0 | GO:0030667 | secretory granule membrane(GO:0030667) |
| 0.0 | 0.3 | GO:0005641 | nuclear envelope lumen(GO:0005641) |
| 0.0 | 0.8 | GO:0005834 | heterotrimeric G-protein complex(GO:0005834) |
| 0.0 | 3.5 | GO:0060076 | excitatory synapse(GO:0060076) |
| 0.0 | 1.1 | GO:0000139 | Golgi membrane(GO:0000139) |
| 0.0 | 0.2 | GO:0033017 | sarcoplasmic reticulum membrane(GO:0033017) |
| 0.0 | 1.9 | GO:0030027 | lamellipodium(GO:0030027) |
| 0.0 | 1.1 | GO:0005778 | peroxisomal membrane(GO:0005778) microbody membrane(GO:0031903) |
| 0.0 | 1.9 | GO:0045202 | synapse(GO:0045202) |
| 0.0 | 1.1 | GO:0022625 | cytosolic large ribosomal subunit(GO:0022625) |
| 0.0 | 6.0 | GO:0030425 | dendrite(GO:0030425) |
| 0.0 | 0.3 | GO:0005902 | microvillus(GO:0005902) |
Gene overrepresentation in molecular_function category:
| Log-likelihood per target | Total log-likelihood | Term | Description |
|---|---|---|---|
| 3.1 | 21.6 | GO:0004971 | AMPA glutamate receptor activity(GO:0004971) |
| 2.3 | 16.1 | GO:0052650 | NADP-retinol dehydrogenase activity(GO:0052650) |
| 1.3 | 3.8 | GO:0046911 | hydroxyapatite binding(GO:0046848) metal chelating activity(GO:0046911) phosphatidylcholine-sterol O-acyltransferase activator activity(GO:0060228) |
| 0.9 | 6.8 | GO:0005004 | GPI-linked ephrin receptor activity(GO:0005004) |
| 0.6 | 7.0 | GO:0038191 | neuropilin binding(GO:0038191) |
| 0.5 | 2.2 | GO:0019911 | structural constituent of myelin sheath(GO:0019911) |
| 0.5 | 3.6 | GO:0004351 | glutamate decarboxylase activity(GO:0004351) |
| 0.5 | 2.7 | GO:0086007 | voltage-gated calcium channel activity involved in cardiac muscle cell action potential(GO:0086007) |
| 0.4 | 1.3 | GO:0005030 | neurotrophin receptor activity(GO:0005030) |
| 0.4 | 1.3 | GO:0031798 | type 1 metabotropic glutamate receptor binding(GO:0031798) RNA polymerase II transcription factor activity, estrogen-activated sequence-specific DNA binding(GO:0038052) |
| 0.4 | 7.4 | GO:0030275 | LRR domain binding(GO:0030275) |
| 0.3 | 1.4 | GO:0008967 | phosphoglycolate phosphatase activity(GO:0008967) |
| 0.3 | 1.7 | GO:0004691 | cAMP-dependent protein kinase activity(GO:0004691) |
| 0.3 | 2.4 | GO:0004416 | hydroxyacylglutathione hydrolase activity(GO:0004416) |
| 0.3 | 4.0 | GO:0044323 | retinoic acid-responsive element binding(GO:0044323) |
| 0.2 | 3.4 | GO:0008574 | ATP-dependent microtubule motor activity, plus-end-directed(GO:0008574) |
| 0.2 | 1.4 | GO:0046975 | histone methyltransferase activity (H3-K36 specific)(GO:0046975) |
| 0.2 | 6.5 | GO:0030215 | semaphorin receptor binding(GO:0030215) |
| 0.2 | 3.3 | GO:0008599 | protein phosphatase type 1 regulator activity(GO:0008599) |
| 0.2 | 1.1 | GO:0016401 | palmitoyl-CoA oxidase activity(GO:0016401) |
| 0.2 | 3.1 | GO:0031402 | sodium ion binding(GO:0031402) |
| 0.2 | 1.8 | GO:0047372 | acylglycerol lipase activity(GO:0047372) |
| 0.1 | 1.2 | GO:0001227 | transcriptional repressor activity, RNA polymerase II transcription regulatory region sequence-specific binding(GO:0001227) |
| 0.1 | 3.0 | GO:0015035 | protein disulfide oxidoreductase activity(GO:0015035) |
| 0.1 | 0.5 | GO:0034714 | type III transforming growth factor beta receptor binding(GO:0034714) |
| 0.1 | 2.2 | GO:0051864 | histone demethylase activity (H3-K36 specific)(GO:0051864) |
| 0.1 | 5.4 | GO:0005158 | insulin receptor binding(GO:0005158) |
| 0.1 | 2.1 | GO:0050750 | low-density lipoprotein particle receptor binding(GO:0050750) |
| 0.1 | 4.9 | GO:0045296 | cadherin binding(GO:0045296) |
| 0.1 | 2.0 | GO:0005184 | neuropeptide hormone activity(GO:0005184) |
| 0.1 | 1.1 | GO:0015248 | sterol transporter activity(GO:0015248) |
| 0.1 | 0.2 | GO:0042030 | ATPase inhibitor activity(GO:0042030) |
| 0.1 | 0.7 | GO:0050692 | DBD domain binding(GO:0050692) |
| 0.1 | 2.0 | GO:0046961 | proton-transporting ATPase activity, rotational mechanism(GO:0046961) |
| 0.1 | 1.7 | GO:0003785 | actin monomer binding(GO:0003785) |
| 0.1 | 3.1 | GO:0043531 | ADP binding(GO:0043531) |
| 0.1 | 1.1 | GO:0005234 | extracellular-glutamate-gated ion channel activity(GO:0005234) |
| 0.1 | 2.3 | GO:0005086 | ARF guanyl-nucleotide exchange factor activity(GO:0005086) |
| 0.1 | 0.8 | GO:0070064 | proline-rich region binding(GO:0070064) |
| 0.1 | 2.8 | GO:0001228 | transcriptional activator activity, RNA polymerase II transcription regulatory region sequence-specific binding(GO:0001228) |
| 0.1 | 0.3 | GO:0005166 | neurotrophin p75 receptor binding(GO:0005166) |
| 0.1 | 0.5 | GO:0052872 | 3-(3-hydroxyphenyl)propionate hydroxylase activity(GO:0008688) 4-chlorobenzaldehyde oxidase activity(GO:0018471) 3,5-xylenol methylhydroxylase activity(GO:0018630) phenylacetate hydroxylase activity(GO:0018631) 4-nitrophenol 4-monooxygenase activity(GO:0018632) dimethyl sulfide monooxygenase activity(GO:0018633) alpha-pinene monooxygenase [NADH] activity(GO:0018634) phenanthrene 9,10-monooxygenase activity(GO:0018636) 1-hydroxy-2-naphthoate hydroxylase activity(GO:0018637) toluene 4-monooxygenase activity(GO:0018638) xylene monooxygenase activity(GO:0018639) dibenzothiophene monooxygenase activity(GO:0018640) 6-hydroxy-3-methyl-2-oxo-1,2-dihydroquinoline 6-monooxygenase activity(GO:0018641) chlorophenol 4-monooxygenase activity(GO:0018642) carbon disulfide oxygenase activity(GO:0018643) toluene 2-monooxygenase activity(GO:0018644) 1-hydroxy-2-oxolimonene 1,2-monooxygenase activity(GO:0018646) phenanthrene 1,2-monooxygenase activity(GO:0018647) tetrahydrofuran hydroxylase activity(GO:0018649) styrene monooxygenase activity(GO:0018650) toluene-4-sulfonate monooxygenase activity(GO:0018651) toluene-sulfonate methyl-monooxygenase activity(GO:0018652) 3-methyl-2-oxo-1,2-dihydroquinoline 6-monooxygenase activity(GO:0018653) 2-hydroxy-phenylacetate hydroxylase activity(GO:0018654) 2-oxo-delta3-4,5,5-trimethylcyclopentenylacetyl-CoA 1,2-monooxygenase activity(GO:0018655) phenanthrene 3,4-monooxygenase activity(GO:0018656) toluene 3-monooxygenase activity(GO:0018657) 4-hydroxyphenylacetate,NADH:oxygen oxidoreductase (3-hydroxylating) activity(GO:0018660) limonene monooxygenase activity(GO:0019113) 2-methylnaphthalene hydroxylase activity(GO:0034526) 1-methylnaphthalene hydroxylase activity(GO:0034534) bisphenol A hydroxylase A activity(GO:0034560) salicylate 5-hydroxylase activity(GO:0034785) isobutylamine N-hydroxylase activity(GO:0034791) branched-chain dodecylbenzene sulfonate monooxygenase activity(GO:0034802) 3-HSA hydroxylase activity(GO:0034819) 4-hydroxypyridine-3-hydroxylase activity(GO:0034894) 2-octaprenyl-3-methyl-6-methoxy-1,4-benzoquinol hydroxylase activity(GO:0043719) 6-hydroxynicotinate 3-monooxygenase activity(GO:0043731) tocotrienol omega-hydroxylase activity(GO:0052872) thalianol hydroxylase activity(GO:0080014) |
| 0.0 | 0.8 | GO:0008253 | 5'-nucleotidase activity(GO:0008253) |
| 0.0 | 0.9 | GO:0008545 | JUN kinase kinase activity(GO:0008545) |
| 0.0 | 4.0 | GO:0002039 | p53 binding(GO:0002039) |
| 0.0 | 0.8 | GO:0004198 | calcium-dependent cysteine-type endopeptidase activity(GO:0004198) |
| 0.0 | 0.4 | GO:0003873 | 6-phosphofructo-2-kinase activity(GO:0003873) fructose-2,6-bisphosphate 2-phosphatase activity(GO:0004331) |
| 0.0 | 0.2 | GO:0051525 | NFAT protein binding(GO:0051525) |
| 0.0 | 4.4 | GO:0004725 | protein tyrosine phosphatase activity(GO:0004725) |
| 0.0 | 3.0 | GO:0004860 | protein kinase inhibitor activity(GO:0004860) |
| 0.0 | 0.8 | GO:0046965 | retinoid X receptor binding(GO:0046965) |
| 0.0 | 0.5 | GO:0043422 | protein kinase B binding(GO:0043422) |
| 0.0 | 1.7 | GO:0030276 | clathrin binding(GO:0030276) |
| 0.0 | 2.6 | GO:0001078 | transcriptional repressor activity, RNA polymerase II core promoter proximal region sequence-specific binding(GO:0001078) |
| 0.0 | 0.6 | GO:0050136 | NADH dehydrogenase (ubiquinone) activity(GO:0008137) NADH dehydrogenase (quinone) activity(GO:0050136) |
| 0.0 | 2.1 | GO:0002020 | protease binding(GO:0002020) |
| 0.0 | 4.3 | GO:0003735 | structural constituent of ribosome(GO:0003735) |
| 0.0 | 0.8 | GO:0005246 | calcium channel regulator activity(GO:0005246) |
| 0.0 | 7.3 | GO:0005509 | calcium ion binding(GO:0005509) |
| 0.0 | 0.7 | GO:0008528 | G-protein coupled peptide receptor activity(GO:0008528) |
| 0.0 | 0.6 | GO:0004497 | monooxygenase activity(GO:0004497) |
| 0.0 | 0.6 | GO:0030170 | pyridoxal phosphate binding(GO:0030170) |
| 0.0 | 0.3 | GO:0050681 | androgen receptor binding(GO:0050681) |
| 0.0 | 1.3 | GO:0017124 | SH3 domain binding(GO:0017124) |
| 0.0 | 2.3 | GO:0008017 | microtubule binding(GO:0008017) |