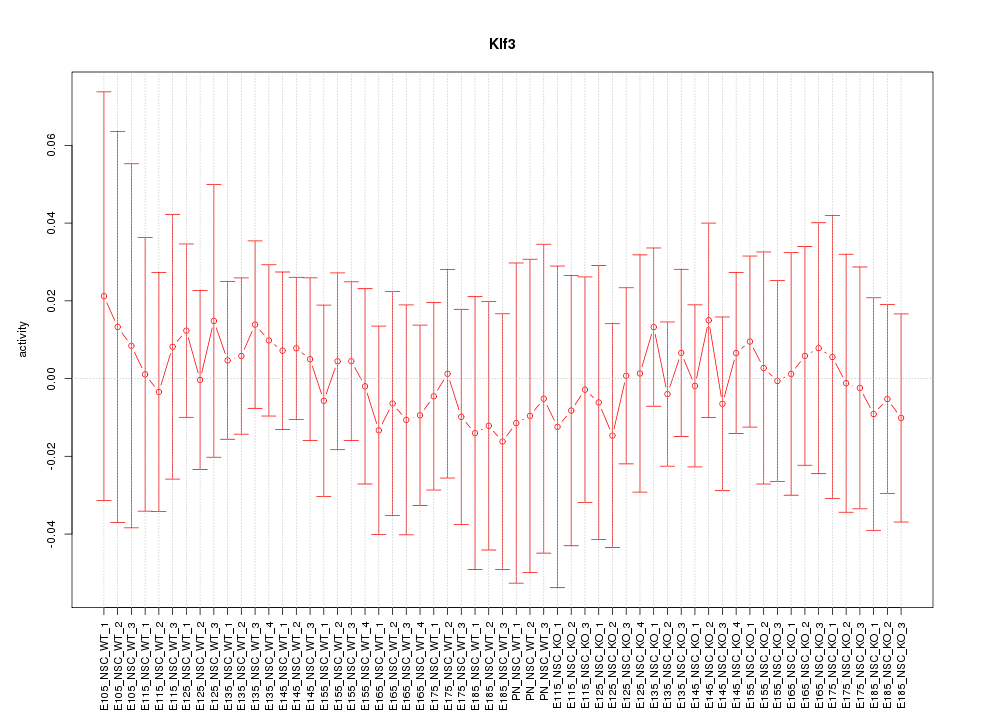
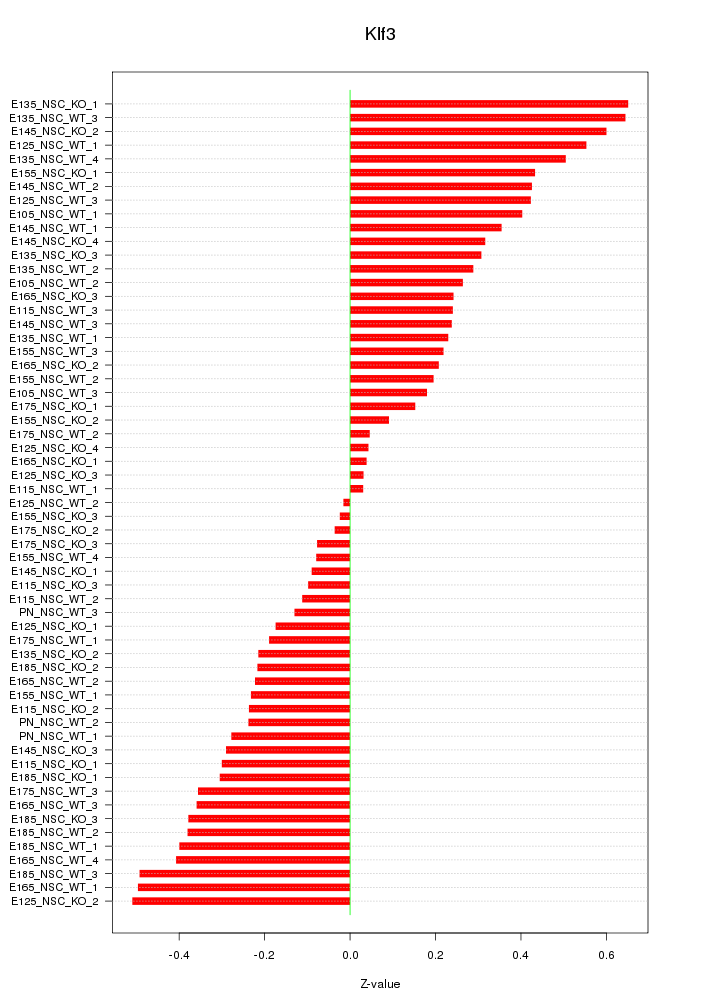
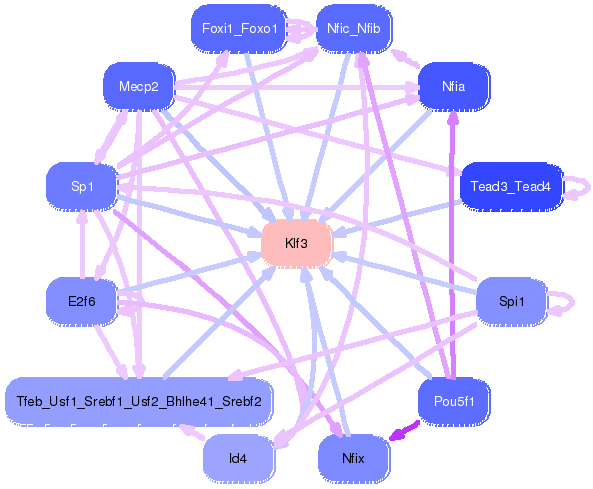
Motif ID: Klf3
Z-value: 0.313

Transcription factors associated with Klf3:
| Gene Symbol | Entrez ID | Gene Name |
|---|---|---|
| Klf3 | ENSMUSG00000029178.8 | Klf3 |
Activity-expression correlation:
| Gene Symbol | Promoter | Pearson corr. coef. | P-value | Plot |
|---|---|---|---|---|
| Klf3 | mm10_v2_chr5_+_64812336_64812350 | -0.55 | 6.6e-06 | Click! |

Top targets:
Gene overrepresentation in biological_process category:
| Log-likelihood per target | Total log-likelihood | Term | Description |
|---|---|---|---|
| 0.5 | 1.8 | GO:0071105 | response to interleukin-9(GO:0071104) response to interleukin-11(GO:0071105) |
| 0.1 | 2.0 | GO:0043567 | regulation of insulin-like growth factor receptor signaling pathway(GO:0043567) |
| 0.1 | 0.7 | GO:0016576 | histone dephosphorylation(GO:0016576) |
| 0.1 | 0.3 | GO:0071677 | positive regulation of mononuclear cell migration(GO:0071677) |
| 0.1 | 0.6 | GO:0007195 | adenylate cyclase-inhibiting dopamine receptor signaling pathway(GO:0007195) |
| 0.0 | 0.4 | GO:0007016 | cytoskeletal anchoring at plasma membrane(GO:0007016) |
| 0.0 | 0.7 | GO:0070979 | protein K11-linked ubiquitination(GO:0070979) |
| 0.0 | 2.2 | GO:0010466 | negative regulation of peptidase activity(GO:0010466) |
| 0.0 | 0.1 | GO:0006547 | histidine metabolic process(GO:0006547) |
Gene overrepresentation in cellular_component category:
| Log-likelihood per target | Total log-likelihood | Term | Description |
|---|---|---|---|
| 0.1 | 0.6 | GO:0031523 | Myb complex(GO:0031523) |
| 0.1 | 0.7 | GO:1990635 | proximal dendrite(GO:1990635) |
| 0.1 | 0.3 | GO:0031838 | haptoglobin-hemoglobin complex(GO:0031838) |
| 0.0 | 1.1 | GO:0002102 | podosome(GO:0002102) |
| 0.0 | 0.4 | GO:0005916 | fascia adherens(GO:0005916) |
| 0.0 | 0.3 | GO:0008540 | proteasome regulatory particle, base subcomplex(GO:0008540) cytosolic proteasome complex(GO:0031597) |
| 0.0 | 0.1 | GO:0042589 | zymogen granule membrane(GO:0042589) |
Gene overrepresentation in molecular_function category:
| Log-likelihood per target | Total log-likelihood | Term | Description |
|---|---|---|---|
| 0.3 | 2.0 | GO:0031995 | insulin-like growth factor II binding(GO:0031995) |
| 0.2 | 1.8 | GO:0050693 | LBD domain binding(GO:0050693) |
| 0.2 | 0.6 | GO:0034988 | Fc-gamma receptor I complex binding(GO:0034988) |
| 0.1 | 0.3 | GO:0031721 | haptoglobin binding(GO:0031720) hemoglobin alpha binding(GO:0031721) |
| 0.0 | 2.2 | GO:0004867 | serine-type endopeptidase inhibitor activity(GO:0004867) |
| 0.0 | 0.8 | GO:0005227 | calcium activated cation channel activity(GO:0005227) |
| 0.0 | 0.7 | GO:0001965 | G-protein alpha-subunit binding(GO:0001965) |
| 0.0 | 0.7 | GO:0061631 | ubiquitin conjugating enzyme activity(GO:0061631) |
| 0.0 | 0.1 | GO:0016841 | ammonia-lyase activity(GO:0016841) |