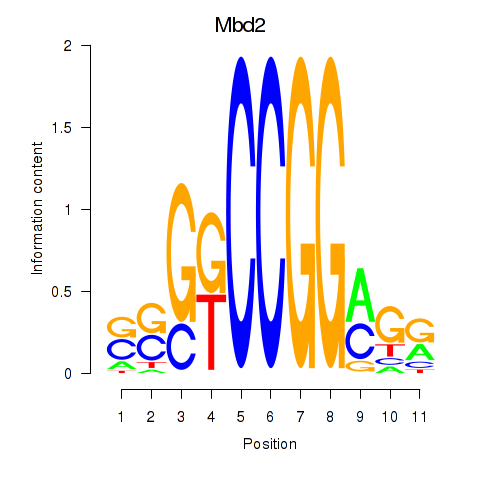
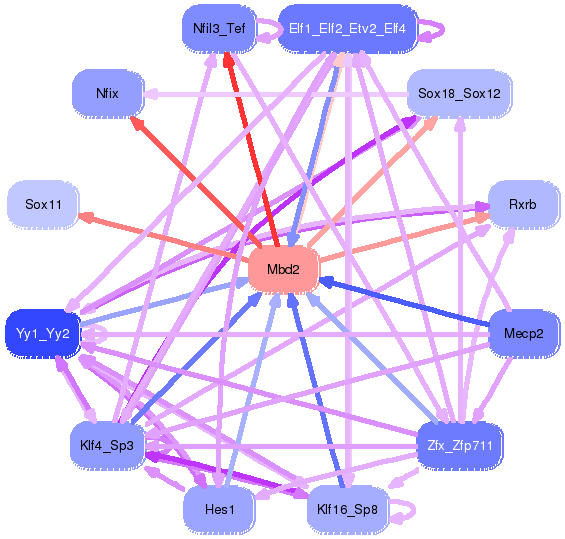
Motif ID: Mbd2
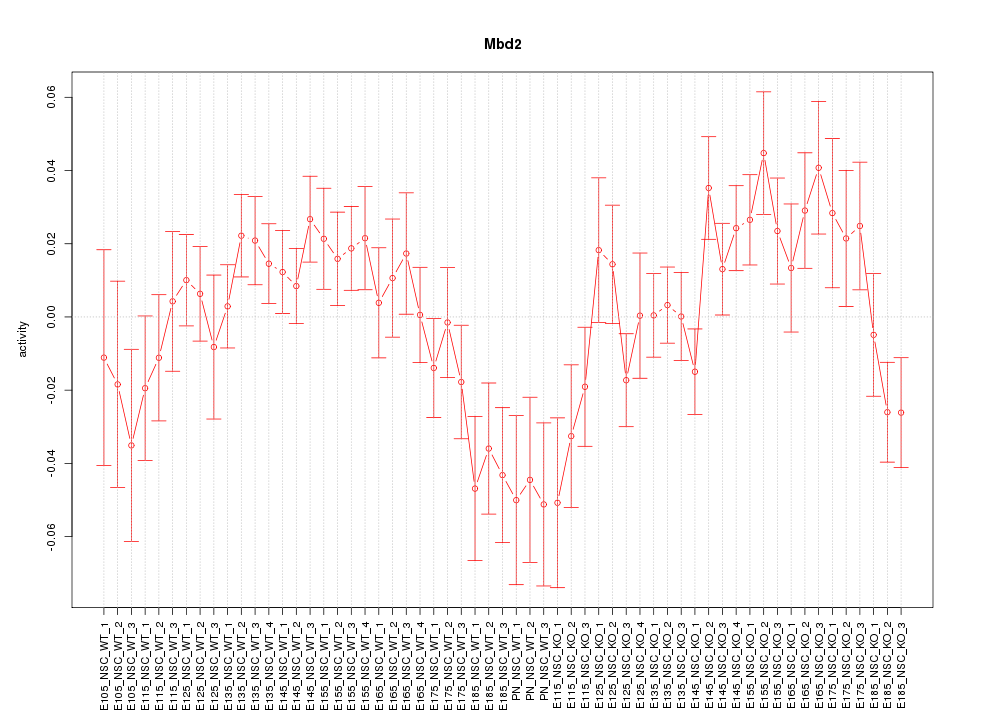
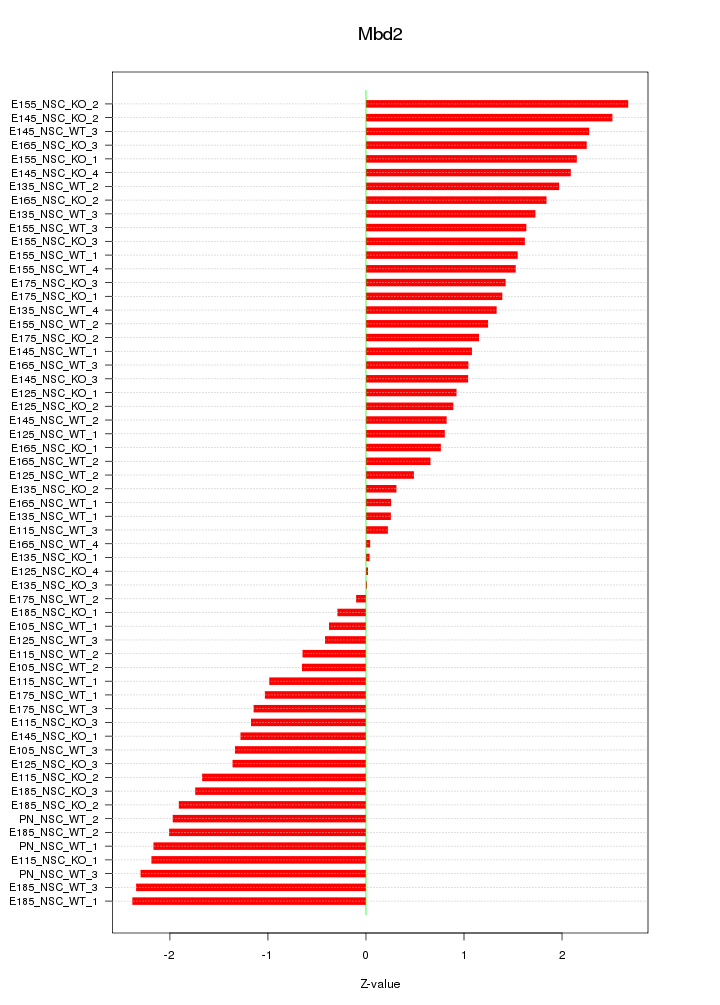
Z-value: 1.450
Transcription factors associated with Mbd2:
| Gene Symbol | Entrez ID | Gene Name |
|---|---|---|
| Mbd2 | ENSMUSG00000024513.10 | Mbd2 |
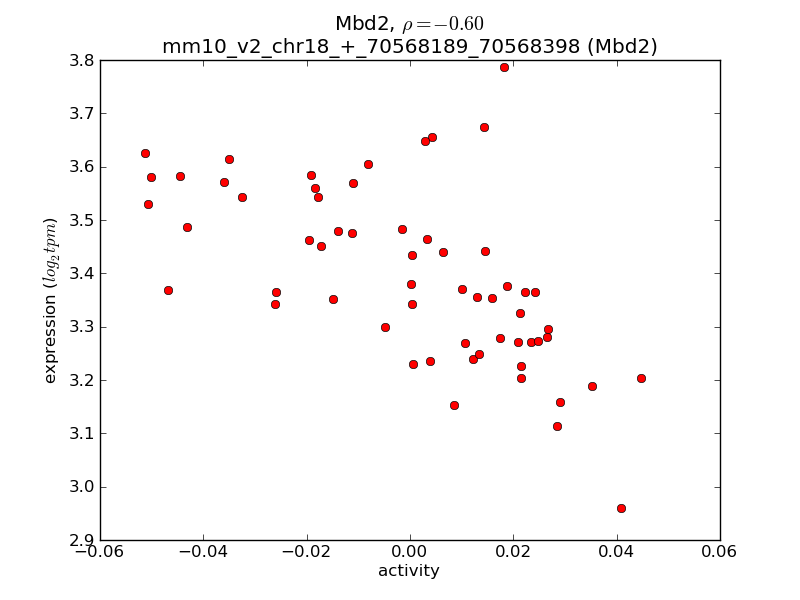
Activity-expression correlation:
| Gene Symbol | Promoter | Pearson corr. coef. | P-value | Plot |
|---|---|---|---|---|
| Mbd2 | mm10_v2_chr18_+_70568189_70568398 | -0.60 | 4.1e-07 | Click! |

Top targets:
Gene overrepresentation in biological_process category:
| Log-likelihood per target | Total log-likelihood | Term | Description |
|---|---|---|---|
| 4.9 | 29.3 | GO:0021773 | striatal medium spiny neuron differentiation(GO:0021773) |
| 2.2 | 8.8 | GO:0021586 | pons maturation(GO:0021586) |
| 1.9 | 21.3 | GO:1901250 | regulation of lung goblet cell differentiation(GO:1901249) negative regulation of lung goblet cell differentiation(GO:1901250) |
| 1.9 | 30.5 | GO:1900454 | positive regulation of long term synaptic depression(GO:1900454) |
| 1.9 | 5.6 | GO:0086046 | membrane depolarization during SA node cell action potential(GO:0086046) |
| 1.7 | 19.2 | GO:0023041 | neuronal signal transduction(GO:0023041) |
| 1.4 | 4.3 | GO:0045110 | intermediate filament bundle assembly(GO:0045110) |
| 1.3 | 3.9 | GO:0060023 | soft palate development(GO:0060023) |
| 1.3 | 5.2 | GO:0072344 | rescue of stalled ribosome(GO:0072344) |
| 1.3 | 6.5 | GO:0036324 | vascular endothelial growth factor receptor-2 signaling pathway(GO:0036324) |
| 1.3 | 5.1 | GO:0032227 | negative regulation of synaptic transmission, dopaminergic(GO:0032227) |
| 1.3 | 5.1 | GO:2000551 | regulation of T-helper 2 cell cytokine production(GO:2000551) positive regulation of T-helper 2 cell cytokine production(GO:2000553) |
| 1.2 | 3.7 | GO:0021849 | neuroblast division in subventricular zone(GO:0021849) |
| 1.1 | 4.3 | GO:0007228 | positive regulation of hh target transcription factor activity(GO:0007228) |
| 1.0 | 4.1 | GO:0046726 | positive regulation by virus of viral protein levels in host cell(GO:0046726) |
| 1.0 | 4.0 | GO:0046898 | response to cycloheximide(GO:0046898) |
| 0.9 | 2.7 | GO:0038003 | opioid receptor signaling pathway(GO:0038003) regulation of opioid receptor signaling pathway(GO:2000474) |
| 0.8 | 2.3 | GO:0072070 | establishment or maintenance of polarity of embryonic epithelium(GO:0016332) loop of Henle development(GO:0072070) metanephric loop of Henle development(GO:0072236) |
| 0.7 | 2.9 | GO:0043973 | histone H3-K4 acetylation(GO:0043973) |
| 0.7 | 2.2 | GO:2000744 | anterior head development(GO:0097065) regulation of anterior head development(GO:2000742) positive regulation of anterior head development(GO:2000744) |
| 0.7 | 2.1 | GO:1902174 | positive regulation of keratinocyte apoptotic process(GO:1902174) |
| 0.7 | 2.1 | GO:0018103 | protein C-linked glycosylation(GO:0018103) peptidyl-tryptophan modification(GO:0018211) protein C-linked glycosylation via tryptophan(GO:0018317) protein C-linked glycosylation via 2'-alpha-mannosyl-L-tryptophan(GO:0018406) |
| 0.7 | 4.0 | GO:0051013 | microtubule severing(GO:0051013) |
| 0.7 | 2.7 | GO:0010626 | negative regulation of Schwann cell proliferation(GO:0010626) |
| 0.6 | 3.2 | GO:0051365 | cellular response to potassium ion starvation(GO:0051365) |
| 0.6 | 3.1 | GO:0070535 | histone H2A K63-linked ubiquitination(GO:0070535) |
| 0.6 | 5.0 | GO:0038031 | non-canonical Wnt signaling pathway via JNK cascade(GO:0038031) |
| 0.6 | 3.1 | GO:2001025 | positive regulation of response to drug(GO:2001025) |
| 0.6 | 1.8 | GO:0001193 | maintenance of transcriptional fidelity during DNA-templated transcription elongation(GO:0001192) maintenance of transcriptional fidelity during DNA-templated transcription elongation from RNA polymerase II promoter(GO:0001193) |
| 0.6 | 3.0 | GO:0070459 | prolactin secretion(GO:0070459) |
| 0.6 | 2.4 | GO:0060709 | glycogen cell differentiation involved in embryonic placenta development(GO:0060709) |
| 0.6 | 2.3 | GO:2001137 | positive regulation of endocytic recycling(GO:2001137) |
| 0.6 | 1.7 | GO:0044849 | estrous cycle(GO:0044849) |
| 0.5 | 1.6 | GO:0060596 | mammary placode formation(GO:0060596) |
| 0.5 | 4.4 | GO:0001922 | B-1 B cell homeostasis(GO:0001922) |
| 0.5 | 4.1 | GO:0033564 | anterior/posterior axon guidance(GO:0033564) |
| 0.5 | 2.9 | GO:0071955 | recycling endosome to Golgi transport(GO:0071955) |
| 0.5 | 2.4 | GO:0021993 | initiation of neural tube closure(GO:0021993) |
| 0.5 | 4.2 | GO:0071318 | cellular response to ATP(GO:0071318) |
| 0.4 | 4.5 | GO:0030322 | stabilization of membrane potential(GO:0030322) |
| 0.4 | 5.3 | GO:0033574 | response to testosterone(GO:0033574) |
| 0.4 | 5.9 | GO:0021684 | cerebellar granular layer formation(GO:0021684) cerebellar granule cell differentiation(GO:0021707) |
| 0.4 | 5.8 | GO:0032486 | Rap protein signal transduction(GO:0032486) |
| 0.4 | 0.8 | GO:0060743 | epithelial cell maturation involved in prostate gland development(GO:0060743) |
| 0.4 | 6.5 | GO:0031340 | positive regulation of vesicle fusion(GO:0031340) |
| 0.4 | 1.9 | GO:0016266 | O-glycan processing(GO:0016266) |
| 0.4 | 1.9 | GO:1902683 | regulation of receptor localization to synapse(GO:1902683) |
| 0.3 | 1.0 | GO:0035574 | histone H4-K20 demethylation(GO:0035574) |
| 0.3 | 1.0 | GO:0072531 | pyrimidine-containing compound transmembrane transport(GO:0072531) |
| 0.3 | 4.5 | GO:0051764 | actin crosslink formation(GO:0051764) |
| 0.3 | 9.2 | GO:0061099 | negative regulation of protein tyrosine kinase activity(GO:0061099) |
| 0.3 | 1.4 | GO:0021914 | negative regulation of smoothened signaling pathway involved in ventral spinal cord patterning(GO:0021914) |
| 0.3 | 2.2 | GO:0051534 | negative regulation of NFAT protein import into nucleus(GO:0051534) |
| 0.3 | 1.1 | GO:0071692 | protein localization to extracellular region(GO:0071692) maintenance of protein location in extracellular region(GO:0071694) |
| 0.3 | 1.4 | GO:0035331 | negative regulation of hippo signaling(GO:0035331) |
| 0.3 | 3.5 | GO:0043252 | sodium-independent organic anion transport(GO:0043252) |
| 0.3 | 7.9 | GO:0071353 | cellular response to interleukin-4(GO:0071353) |
| 0.3 | 1.6 | GO:2000672 | negative regulation of motor neuron apoptotic process(GO:2000672) |
| 0.3 | 5.8 | GO:0055012 | ventricular cardiac muscle cell differentiation(GO:0055012) |
| 0.3 | 2.8 | GO:0006610 | ribosomal protein import into nucleus(GO:0006610) |
| 0.3 | 1.3 | GO:1900122 | positive regulation of receptor binding(GO:1900122) |
| 0.2 | 25.4 | GO:0050885 | neuromuscular process controlling balance(GO:0050885) |
| 0.2 | 0.7 | GO:0046881 | sperm ejaculation(GO:0042713) positive regulation of follicle-stimulating hormone secretion(GO:0046881) |
| 0.2 | 4.7 | GO:0031115 | negative regulation of microtubule polymerization(GO:0031115) |
| 0.2 | 5.2 | GO:0048505 | regulation of timing of cell differentiation(GO:0048505) |
| 0.2 | 3.7 | GO:0032957 | inositol trisphosphate metabolic process(GO:0032957) |
| 0.2 | 3.2 | GO:0007190 | activation of adenylate cyclase activity(GO:0007190) |
| 0.2 | 1.4 | GO:0072610 | interleukin-12 secretion(GO:0072610) regulation of interleukin-12 secretion(GO:2001182) positive regulation of interleukin-12 secretion(GO:2001184) |
| 0.2 | 0.7 | GO:0019401 | alditol biosynthetic process(GO:0019401) |
| 0.2 | 4.3 | GO:0050650 | chondroitin sulfate proteoglycan biosynthetic process(GO:0050650) |
| 0.2 | 1.1 | GO:0090666 | scaRNA localization to Cajal body(GO:0090666) |
| 0.2 | 3.3 | GO:0048172 | regulation of short-term neuronal synaptic plasticity(GO:0048172) |
| 0.2 | 5.5 | GO:0095500 | acetylcholine receptor signaling pathway(GO:0095500) postsynaptic signal transduction(GO:0098926) signal transduction involved in cellular response to ammonium ion(GO:1903831) response to acetylcholine(GO:1905144) cellular response to acetylcholine(GO:1905145) |
| 0.2 | 1.4 | GO:0035405 | regulation of germinal center formation(GO:0002634) histone-threonine phosphorylation(GO:0035405) |
| 0.2 | 5.1 | GO:0043496 | regulation of protein homodimerization activity(GO:0043496) |
| 0.2 | 1.8 | GO:0051014 | actin filament severing(GO:0051014) |
| 0.2 | 9.0 | GO:0031572 | G2 DNA damage checkpoint(GO:0031572) |
| 0.2 | 3.9 | GO:0001574 | ganglioside biosynthetic process(GO:0001574) |
| 0.2 | 2.3 | GO:0070933 | histone H4 deacetylation(GO:0070933) |
| 0.2 | 3.4 | GO:0021535 | cell migration in hindbrain(GO:0021535) |
| 0.2 | 0.7 | GO:0048007 | antigen processing and presentation of lipid antigen via MHC class Ib(GO:0048003) antigen processing and presentation, exogenous lipid antigen via MHC class Ib(GO:0048007) |
| 0.2 | 2.8 | GO:0045717 | negative regulation of fatty acid biosynthetic process(GO:0045717) |
| 0.2 | 2.9 | GO:0001516 | prostaglandin biosynthetic process(GO:0001516) prostanoid biosynthetic process(GO:0046457) |
| 0.2 | 3.0 | GO:2000311 | regulation of alpha-amino-3-hydroxy-5-methyl-4-isoxazole propionate selective glutamate receptor activity(GO:2000311) |
| 0.2 | 0.8 | GO:0003057 | regulation of the force of heart contraction by chemical signal(GO:0003057) |
| 0.2 | 2.9 | GO:0046069 | cGMP catabolic process(GO:0046069) |
| 0.2 | 6.9 | GO:0035418 | protein localization to synapse(GO:0035418) |
| 0.2 | 0.6 | GO:2001286 | regulation of caveolin-mediated endocytosis(GO:2001286) |
| 0.1 | 0.4 | GO:0030167 | proteoglycan catabolic process(GO:0030167) |
| 0.1 | 1.1 | GO:0006362 | transcription elongation from RNA polymerase I promoter(GO:0006362) |
| 0.1 | 2.3 | GO:0045671 | negative regulation of osteoclast differentiation(GO:0045671) |
| 0.1 | 2.2 | GO:1903861 | regulation of dendrite extension(GO:1903859) positive regulation of dendrite extension(GO:1903861) |
| 0.1 | 1.7 | GO:0030828 | positive regulation of cGMP biosynthetic process(GO:0030828) |
| 0.1 | 9.3 | GO:0061178 | regulation of insulin secretion involved in cellular response to glucose stimulus(GO:0061178) |
| 0.1 | 4.6 | GO:1901385 | regulation of voltage-gated calcium channel activity(GO:1901385) |
| 0.1 | 3.3 | GO:0016578 | histone deubiquitination(GO:0016578) |
| 0.1 | 2.6 | GO:0044804 | nucleophagy(GO:0044804) |
| 0.1 | 0.5 | GO:0034184 | positive regulation of maintenance of sister chromatid cohesion(GO:0034093) positive regulation of maintenance of mitotic sister chromatid cohesion(GO:0034184) |
| 0.1 | 1.0 | GO:0021960 | anterior commissure morphogenesis(GO:0021960) |
| 0.1 | 1.0 | GO:0090050 | positive regulation of cell migration involved in sprouting angiogenesis(GO:0090050) negative regulation of NIK/NF-kappaB signaling(GO:1901223) |
| 0.1 | 0.4 | GO:0060576 | intestinal epithelial cell development(GO:0060576) |
| 0.1 | 0.7 | GO:0045075 | interleukin-12 biosynthetic process(GO:0042090) regulation of interleukin-12 biosynthetic process(GO:0045075) |
| 0.1 | 1.0 | GO:0009404 | toxin metabolic process(GO:0009404) |
| 0.1 | 1.0 | GO:0033148 | positive regulation of intracellular estrogen receptor signaling pathway(GO:0033148) |
| 0.1 | 1.9 | GO:0032757 | positive regulation of interleukin-8 production(GO:0032757) |
| 0.1 | 0.9 | GO:0097286 | iron ion import(GO:0097286) |
| 0.1 | 0.8 | GO:0042118 | endothelial cell activation(GO:0042118) |
| 0.1 | 0.5 | GO:0030263 | apoptotic chromosome condensation(GO:0030263) |
| 0.1 | 5.5 | GO:0070936 | protein K48-linked ubiquitination(GO:0070936) |
| 0.1 | 0.3 | GO:2000398 | regulation of T cell differentiation in thymus(GO:0033081) regulation of thymocyte aggregation(GO:2000398) |
| 0.1 | 1.5 | GO:0048268 | clathrin coat assembly(GO:0048268) |
| 0.1 | 3.8 | GO:0045921 | positive regulation of exocytosis(GO:0045921) |
| 0.1 | 2.2 | GO:0045453 | bone resorption(GO:0045453) |
| 0.1 | 1.1 | GO:0007183 | SMAD protein complex assembly(GO:0007183) |
| 0.1 | 3.2 | GO:0055013 | cardiac muscle cell development(GO:0055013) |
| 0.1 | 0.9 | GO:0090141 | positive regulation of mitochondrial fission(GO:0090141) |
| 0.1 | 0.3 | GO:0060689 | cell differentiation involved in salivary gland development(GO:0060689) |
| 0.1 | 1.2 | GO:0035335 | peptidyl-tyrosine dephosphorylation(GO:0035335) |
| 0.1 | 0.7 | GO:0006614 | SRP-dependent cotranslational protein targeting to membrane(GO:0006614) |
| 0.1 | 2.1 | GO:1904893 | negative regulation of JAK-STAT cascade(GO:0046426) negative regulation of STAT cascade(GO:1904893) |
| 0.1 | 0.3 | GO:0045721 | negative regulation of gluconeogenesis(GO:0045721) |
| 0.1 | 0.5 | GO:0006370 | 7-methylguanosine mRNA capping(GO:0006370) |
| 0.1 | 2.8 | GO:0046626 | regulation of insulin receptor signaling pathway(GO:0046626) |
| 0.0 | 0.5 | GO:0010718 | positive regulation of epithelial to mesenchymal transition(GO:0010718) |
| 0.0 | 2.6 | GO:0051965 | positive regulation of synapse assembly(GO:0051965) |
| 0.0 | 4.2 | GO:0008203 | cholesterol metabolic process(GO:0008203) |
| 0.0 | 1.4 | GO:0000002 | mitochondrial genome maintenance(GO:0000002) |
| 0.0 | 0.8 | GO:0043968 | histone H2A acetylation(GO:0043968) |
| 0.0 | 5.7 | GO:0035023 | regulation of Rho protein signal transduction(GO:0035023) |
| 0.0 | 0.3 | GO:0007296 | vitellogenesis(GO:0007296) |
| 0.0 | 1.5 | GO:0010830 | regulation of myotube differentiation(GO:0010830) |
| 0.0 | 0.2 | GO:0060178 | regulation of exocyst localization(GO:0060178) |
| 0.0 | 1.1 | GO:0008333 | endosome to lysosome transport(GO:0008333) |
| 0.0 | 1.3 | GO:0048278 | vesicle docking(GO:0048278) |
| 0.0 | 0.3 | GO:1990090 | response to nerve growth factor(GO:1990089) cellular response to nerve growth factor stimulus(GO:1990090) |
| 0.0 | 1.2 | GO:0007019 | microtubule depolymerization(GO:0007019) |
| 0.0 | 0.4 | GO:0070200 | establishment of protein localization to telomere(GO:0070200) |
| 0.0 | 0.1 | GO:0006049 | UDP-N-acetylglucosamine catabolic process(GO:0006049) |
| 0.0 | 0.4 | GO:0031112 | positive regulation of microtubule polymerization or depolymerization(GO:0031112) |
| 0.0 | 0.2 | GO:0042048 | olfactory behavior(GO:0042048) |
| 0.0 | 0.2 | GO:0000395 | mRNA 5'-splice site recognition(GO:0000395) |
| 0.0 | 0.8 | GO:0050982 | detection of mechanical stimulus(GO:0050982) |
| 0.0 | 3.6 | GO:0007160 | cell-matrix adhesion(GO:0007160) |
| 0.0 | 0.1 | GO:0072675 | osteoclast fusion(GO:0072675) |
| 0.0 | 3.8 | GO:0008654 | phospholipid biosynthetic process(GO:0008654) |
| 0.0 | 0.5 | GO:0010762 | regulation of fibroblast migration(GO:0010762) |
| 0.0 | 0.8 | GO:0000184 | nuclear-transcribed mRNA catabolic process, nonsense-mediated decay(GO:0000184) |
| 0.0 | 0.7 | GO:0045773 | positive regulation of axon extension(GO:0045773) |
| 0.0 | 3.4 | GO:0006457 | protein folding(GO:0006457) |
| 0.0 | 1.9 | GO:0098792 | xenophagy(GO:0098792) |
| 0.0 | 0.7 | GO:0016925 | protein sumoylation(GO:0016925) |
| 0.0 | 0.1 | GO:1903378 | positive regulation of oxidative stress-induced neuron intrinsic apoptotic signaling pathway(GO:1903378) |
| 0.0 | 3.4 | GO:0048545 | response to steroid hormone(GO:0048545) |
| 0.0 | 0.4 | GO:0031146 | SCF-dependent proteasomal ubiquitin-dependent protein catabolic process(GO:0031146) |
Gene overrepresentation in cellular_component category:
| Log-likelihood per target | Total log-likelihood | Term | Description |
|---|---|---|---|
| 2.9 | 8.8 | GO:0016533 | cyclin-dependent protein kinase 5 holoenzyme complex(GO:0016533) |
| 2.7 | 26.7 | GO:0045298 | tubulin complex(GO:0045298) |
| 1.8 | 9.1 | GO:0030314 | junctional membrane complex(GO:0030314) |
| 1.6 | 6.5 | GO:1990032 | parallel fiber(GO:1990032) |
| 0.9 | 5.1 | GO:0045179 | apical cortex(GO:0045179) |
| 0.8 | 7.2 | GO:0000813 | ESCRT I complex(GO:0000813) |
| 0.8 | 2.3 | GO:0020018 | ciliary pocket(GO:0020016) ciliary pocket membrane(GO:0020018) |
| 0.6 | 11.9 | GO:0000159 | protein phosphatase type 2A complex(GO:0000159) |
| 0.5 | 3.1 | GO:1990635 | proximal dendrite(GO:1990635) |
| 0.5 | 4.1 | GO:0097136 | Bcl-2 family protein complex(GO:0097136) |
| 0.5 | 4.3 | GO:0005883 | neurofilament(GO:0005883) |
| 0.5 | 20.2 | GO:0032281 | AMPA glutamate receptor complex(GO:0032281) |
| 0.4 | 4.9 | GO:1990909 | Wnt signalosome(GO:1990909) |
| 0.4 | 18.1 | GO:0005891 | voltage-gated calcium channel complex(GO:0005891) |
| 0.4 | 10.7 | GO:0071565 | nBAF complex(GO:0071565) |
| 0.4 | 6.9 | GO:0099738 | cell cortex region(GO:0099738) |
| 0.4 | 4.7 | GO:0031105 | septin complex(GO:0031105) |
| 0.4 | 4.2 | GO:0070938 | contractile ring(GO:0070938) |
| 0.4 | 2.7 | GO:0044326 | dendritic spine membrane(GO:0032591) dendritic spine neck(GO:0044326) |
| 0.3 | 1.7 | GO:0035867 | alphav-beta3 integrin-IGF-1-IGF1R complex(GO:0035867) |
| 0.3 | 2.8 | GO:0030285 | integral component of synaptic vesicle membrane(GO:0030285) intrinsic component of synaptic vesicle membrane(GO:0098563) |
| 0.2 | 0.7 | GO:0034673 | inhibin-betaglycan-ActRII complex(GO:0034673) |
| 0.2 | 2.8 | GO:0000124 | SAGA complex(GO:0000124) |
| 0.2 | 6.0 | GO:0097038 | perinuclear endoplasmic reticulum(GO:0097038) |
| 0.2 | 8.6 | GO:0030672 | synaptic vesicle membrane(GO:0030672) exocytic vesicle membrane(GO:0099501) |
| 0.2 | 1.9 | GO:0032279 | asymmetric synapse(GO:0032279) |
| 0.2 | 0.8 | GO:0032777 | Piccolo NuA4 histone acetyltransferase complex(GO:0032777) |
| 0.1 | 0.6 | GO:1990452 | Parkin-FBXW7-Cul1 ubiquitin ligase complex(GO:1990452) |
| 0.1 | 4.1 | GO:0032809 | neuronal cell body membrane(GO:0032809) |
| 0.1 | 0.7 | GO:0044294 | dendritic growth cone(GO:0044294) |
| 0.1 | 6.5 | GO:0031201 | SNARE complex(GO:0031201) |
| 0.1 | 15.1 | GO:0070382 | exocytic vesicle(GO:0070382) |
| 0.1 | 1.8 | GO:0005665 | DNA-directed RNA polymerase II, core complex(GO:0005665) |
| 0.1 | 5.4 | GO:0030173 | integral component of Golgi membrane(GO:0030173) |
| 0.1 | 1.1 | GO:0005832 | chaperonin-containing T-complex(GO:0005832) |
| 0.1 | 0.5 | GO:0048476 | Holliday junction resolvase complex(GO:0048476) |
| 0.1 | 8.8 | GO:0030175 | filopodium(GO:0030175) |
| 0.1 | 5.8 | GO:0008076 | voltage-gated potassium channel complex(GO:0008076) |
| 0.1 | 3.2 | GO:0005790 | smooth endoplasmic reticulum(GO:0005790) |
| 0.1 | 1.8 | GO:0048786 | presynaptic active zone(GO:0048786) |
| 0.1 | 0.4 | GO:0070876 | SOSS complex(GO:0070876) |
| 0.1 | 19.2 | GO:0000139 | Golgi membrane(GO:0000139) |
| 0.1 | 1.1 | GO:0001527 | microfibril(GO:0001527) |
| 0.1 | 1.0 | GO:0044666 | MLL3/4 complex(GO:0044666) |
| 0.1 | 0.5 | GO:0000125 | PCAF complex(GO:0000125) |
| 0.1 | 9.7 | GO:0031225 | anchored component of membrane(GO:0031225) |
| 0.1 | 0.8 | GO:0000805 | X chromosome(GO:0000805) |
| 0.1 | 4.7 | GO:0072686 | mitotic spindle(GO:0072686) |
| 0.1 | 2.6 | GO:0000407 | pre-autophagosomal structure(GO:0000407) |
| 0.1 | 1.6 | GO:0035371 | microtubule plus-end(GO:0035371) |
| 0.1 | 1.1 | GO:0001650 | fibrillar center(GO:0001650) |
| 0.1 | 1.9 | GO:0051233 | spindle midzone(GO:0051233) |
| 0.1 | 1.4 | GO:0097610 | cleavage furrow(GO:0032154) cell surface furrow(GO:0097610) |
| 0.1 | 0.5 | GO:0034518 | mRNA cap binding complex(GO:0005845) RNA cap binding complex(GO:0034518) |
| 0.1 | 1.1 | GO:0035327 | transcriptionally active chromatin(GO:0035327) |
| 0.1 | 0.3 | GO:0045334 | clathrin-coated endocytic vesicle(GO:0045334) |
| 0.1 | 5.8 | GO:0005814 | centriole(GO:0005814) |
| 0.1 | 2.5 | GO:0005776 | autophagosome(GO:0005776) |
| 0.1 | 0.7 | GO:0030123 | AP-3 adaptor complex(GO:0030123) |
| 0.1 | 1.5 | GO:0030131 | clathrin adaptor complex(GO:0030131) |
| 0.1 | 0.5 | GO:0061574 | ASAP complex(GO:0061574) |
| 0.1 | 3.0 | GO:0009925 | basal plasma membrane(GO:0009925) |
| 0.1 | 0.1 | GO:0016514 | SWI/SNF complex(GO:0016514) |
| 0.1 | 4.4 | GO:0001725 | stress fiber(GO:0001725) contractile actin filament bundle(GO:0097517) |
| 0.0 | 1.8 | GO:0045335 | phagocytic vesicle(GO:0045335) |
| 0.0 | 1.9 | GO:0044450 | microtubule organizing center part(GO:0044450) |
| 0.0 | 2.5 | GO:0010494 | cytoplasmic stress granule(GO:0010494) |
| 0.0 | 2.4 | GO:0036064 | ciliary basal body(GO:0036064) |
| 0.0 | 0.7 | GO:0035102 | PRC1 complex(GO:0035102) |
| 0.0 | 1.6 | GO:0005637 | nuclear inner membrane(GO:0005637) |
| 0.0 | 0.8 | GO:0016580 | Sin3 complex(GO:0016580) |
| 0.0 | 1.8 | GO:0031519 | PcG protein complex(GO:0031519) |
| 0.0 | 3.1 | GO:0043204 | perikaryon(GO:0043204) |
| 0.0 | 2.3 | GO:0044452 | nucleolar part(GO:0044452) |
| 0.0 | 1.2 | GO:0005905 | clathrin-coated pit(GO:0005905) |
| 0.0 | 0.7 | GO:0034707 | chloride channel complex(GO:0034707) |
| 0.0 | 0.5 | GO:0030139 | endocytic vesicle(GO:0030139) |
| 0.0 | 0.5 | GO:0016581 | NuRD complex(GO:0016581) CHD-type complex(GO:0090545) |
| 0.0 | 5.2 | GO:0097060 | synaptic membrane(GO:0097060) |
| 0.0 | 0.8 | GO:0016592 | mediator complex(GO:0016592) |
| 0.0 | 0.7 | GO:0035861 | site of double-strand break(GO:0035861) |
| 0.0 | 0.8 | GO:0005882 | intermediate filament(GO:0005882) |
| 0.0 | 11.5 | GO:0030529 | intracellular ribonucleoprotein complex(GO:0030529) ribonucleoprotein complex(GO:1990904) |
| 0.0 | 0.3 | GO:0016459 | myosin complex(GO:0016459) |
| 0.0 | 0.2 | GO:0031901 | early endosome membrane(GO:0031901) |
| 0.0 | 1.9 | GO:0005764 | lytic vacuole(GO:0000323) lysosome(GO:0005764) |
| 0.0 | 1.8 | GO:0098852 | lysosomal membrane(GO:0005765) lytic vacuole membrane(GO:0098852) |
Gene overrepresentation in molecular_function category:
| Log-likelihood per target | Total log-likelihood | Term | Description |
|---|---|---|---|
| 2.0 | 8.2 | GO:0008332 | low voltage-gated calcium channel activity(GO:0008332) |
| 1.5 | 6.0 | GO:0047389 | glycerophosphocholine phosphodiesterase activity(GO:0047389) |
| 1.3 | 7.8 | GO:0008467 | [heparan sulfate]-glucosamine 3-sulfotransferase 1 activity(GO:0008467) |
| 1.2 | 9.8 | GO:0030550 | acetylcholine receptor inhibitor activity(GO:0030550) |
| 1.2 | 26.7 | GO:0034185 | apolipoprotein binding(GO:0034185) |
| 1.1 | 4.5 | GO:0035374 | chondroitin sulfate binding(GO:0035374) |
| 0.9 | 6.5 | GO:0035662 | Toll-like receptor 4 binding(GO:0035662) |
| 0.9 | 15.9 | GO:0050811 | GABA receptor binding(GO:0050811) |
| 0.9 | 4.4 | GO:0008269 | JAK pathway signal transduction adaptor activity(GO:0008269) |
| 0.9 | 11.9 | GO:0008601 | protein phosphatase type 2A regulator activity(GO:0008601) |
| 0.7 | 5.8 | GO:0030375 | thyroid hormone receptor coactivator activity(GO:0030375) |
| 0.7 | 2.9 | GO:0050220 | prostaglandin-E synthase activity(GO:0050220) |
| 0.7 | 9.9 | GO:0008331 | high voltage-gated calcium channel activity(GO:0008331) |
| 0.7 | 4.1 | GO:0005042 | netrin receptor activity(GO:0005042) |
| 0.7 | 4.1 | GO:0015018 | galactosylgalactosylxylosylprotein 3-beta-glucuronosyltransferase activity(GO:0015018) |
| 0.6 | 5.1 | GO:0043559 | insulin binding(GO:0043559) |
| 0.6 | 3.8 | GO:0003828 | alpha-N-acetylneuraminate alpha-2,8-sialyltransferase activity(GO:0003828) |
| 0.6 | 11.5 | GO:0050321 | tau-protein kinase activity(GO:0050321) |
| 0.6 | 2.3 | GO:1902379 | chemoattractant activity involved in axon guidance(GO:1902379) |
| 0.6 | 1.7 | GO:0030249 | guanylate cyclase regulator activity(GO:0030249) |
| 0.6 | 2.3 | GO:0034739 | histone deacetylase activity (H4-K16 specific)(GO:0034739) |
| 0.6 | 22.8 | GO:0001540 | beta-amyloid binding(GO:0001540) |
| 0.5 | 4.3 | GO:0015643 | toxic substance binding(GO:0015643) |
| 0.5 | 3.2 | GO:0008294 | calcium- and calmodulin-responsive adenylate cyclase activity(GO:0008294) |
| 0.5 | 4.1 | GO:0051434 | BH3 domain binding(GO:0051434) |
| 0.5 | 3.5 | GO:0015198 | oligopeptide transporter activity(GO:0015198) |
| 0.5 | 1.4 | GO:0035402 | histone kinase activity (H3-T11 specific)(GO:0035402) |
| 0.4 | 4.5 | GO:0022841 | potassium ion leak channel activity(GO:0022841) |
| 0.4 | 6.8 | GO:0001222 | transcription corepressor binding(GO:0001222) |
| 0.4 | 1.1 | GO:0031755 | endothelial differentiation G-protein coupled receptor binding(GO:0031753) Edg-2 lysophosphatidic acid receptor binding(GO:0031755) |
| 0.4 | 5.8 | GO:0043008 | ATP-dependent protein binding(GO:0043008) |
| 0.4 | 2.5 | GO:0008440 | inositol-1,4,5-trisphosphate 3-kinase activity(GO:0008440) |
| 0.3 | 1.0 | GO:0035575 | histone demethylase activity (H4-K20 specific)(GO:0035575) |
| 0.3 | 2.9 | GO:0030274 | LIM domain binding(GO:0030274) |
| 0.3 | 1.0 | GO:0050827 | toxin receptor binding(GO:0050827) |
| 0.3 | 2.1 | GO:0061665 | SUMO ligase activity(GO:0061665) |
| 0.3 | 2.7 | GO:0031749 | D2 dopamine receptor binding(GO:0031749) |
| 0.3 | 8.5 | GO:0071889 | 14-3-3 protein binding(GO:0071889) |
| 0.2 | 1.4 | GO:0045545 | syndecan binding(GO:0045545) |
| 0.2 | 1.1 | GO:0001165 | RNA polymerase I upstream control element sequence-specific DNA binding(GO:0001165) |
| 0.2 | 5.8 | GO:0005251 | delayed rectifier potassium channel activity(GO:0005251) |
| 0.2 | 0.8 | GO:0001011 | transcription factor activity, sequence-specific DNA binding, RNA polymerase recruiting(GO:0001011) transcription factor activity, TFIIB-class binding(GO:0001087) |
| 0.2 | 1.3 | GO:0032184 | SUMO polymer binding(GO:0032184) |
| 0.2 | 0.9 | GO:0016724 | ferroxidase activity(GO:0004322) oxidoreductase activity, oxidizing metal ions, oxygen as acceptor(GO:0016724) |
| 0.2 | 0.7 | GO:0008967 | phosphoglycolate phosphatase activity(GO:0008967) |
| 0.2 | 2.7 | GO:0051765 | inositol tetrakisphosphate kinase activity(GO:0051765) inositol trisphosphate kinase activity(GO:0051766) |
| 0.2 | 2.9 | GO:0030553 | cGMP binding(GO:0030553) |
| 0.2 | 6.5 | GO:0005544 | calcium-dependent phospholipid binding(GO:0005544) |
| 0.2 | 7.4 | GO:0045499 | chemorepellent activity(GO:0045499) |
| 0.1 | 0.4 | GO:0070052 | collagen V binding(GO:0070052) |
| 0.1 | 0.7 | GO:0017002 | activin-activated receptor activity(GO:0017002) |
| 0.1 | 3.1 | GO:0001784 | phosphotyrosine binding(GO:0001784) |
| 0.1 | 6.0 | GO:0001105 | RNA polymerase II transcription coactivator activity(GO:0001105) |
| 0.1 | 2.6 | GO:0003841 | 1-acylglycerol-3-phosphate O-acyltransferase activity(GO:0003841) |
| 0.1 | 0.5 | GO:0010385 | double-stranded methylated DNA binding(GO:0010385) |
| 0.1 | 1.6 | GO:0051864 | histone demethylase activity (H3-K36 specific)(GO:0051864) |
| 0.1 | 6.8 | GO:0048365 | Rac GTPase binding(GO:0048365) |
| 0.1 | 2.6 | GO:0043425 | bHLH transcription factor binding(GO:0043425) |
| 0.1 | 14.8 | GO:0001078 | transcriptional repressor activity, RNA polymerase II core promoter proximal region sequence-specific binding(GO:0001078) |
| 0.1 | 5.0 | GO:0030374 | ligand-dependent nuclear receptor transcription coactivator activity(GO:0030374) |
| 0.1 | 5.6 | GO:0019003 | GDP binding(GO:0019003) |
| 0.1 | 2.5 | GO:0008157 | protein phosphatase 1 binding(GO:0008157) |
| 0.1 | 1.9 | GO:0004653 | polypeptide N-acetylgalactosaminyltransferase activity(GO:0004653) |
| 0.1 | 2.7 | GO:0003746 | translation elongation factor activity(GO:0003746) |
| 0.1 | 1.7 | GO:0061631 | ubiquitin conjugating enzyme activity(GO:0061631) ubiquitin-like protein conjugating enzyme activity(GO:0061650) |
| 0.1 | 0.2 | GO:0050510 | N-acetylgalactosaminyl-proteoglycan 3-beta-glucuronosyltransferase activity(GO:0050510) |
| 0.1 | 7.8 | GO:0005089 | Rho guanyl-nucleotide exchange factor activity(GO:0005089) |
| 0.1 | 1.4 | GO:0005545 | 1-phosphatidylinositol binding(GO:0005545) |
| 0.1 | 3.0 | GO:0045502 | dynein binding(GO:0045502) |
| 0.1 | 6.1 | GO:0051087 | chaperone binding(GO:0051087) |
| 0.1 | 1.3 | GO:0017160 | Ral GTPase binding(GO:0017160) |
| 0.1 | 0.7 | GO:0032183 | SUMO binding(GO:0032183) |
| 0.1 | 1.0 | GO:0015215 | nucleotide transmembrane transporter activity(GO:0015215) |
| 0.1 | 3.6 | GO:0003707 | steroid hormone receptor activity(GO:0003707) |
| 0.0 | 0.4 | GO:0098505 | G-rich strand telomeric DNA binding(GO:0098505) |
| 0.0 | 12.5 | GO:0001077 | transcriptional activator activity, RNA polymerase II core promoter proximal region sequence-specific binding(GO:0001077) |
| 0.0 | 0.8 | GO:0005123 | death receptor binding(GO:0005123) |
| 0.0 | 1.0 | GO:0005245 | voltage-gated calcium channel activity(GO:0005245) |
| 0.0 | 2.2 | GO:0005246 | calcium channel regulator activity(GO:0005246) |
| 0.0 | 1.7 | GO:0008536 | Ran GTPase binding(GO:0008536) |
| 0.0 | 4.2 | GO:0031072 | heat shock protein binding(GO:0031072) |
| 0.0 | 1.3 | GO:0034945 | dihydrolipoamide branched chain acyltransferase activity(GO:0004147) palmitoleoyl [acyl-carrier-protein]-dependent acyltransferase activity(GO:0008951) serine O-acyltransferase activity(GO:0016412) O-succinyltransferase activity(GO:0016750) S-succinyltransferase activity(GO:0016751) sinapoyltransferase activity(GO:0016752) O-sinapoyltransferase activity(GO:0016753) peptidyl-lysine N6-myristoyltransferase activity(GO:0018030) peptidyl-lysine N6-palmitoyltransferase activity(GO:0018031) benzoyl acetate-CoA thiolase activity(GO:0018711) 3-hydroxybutyryl-CoA thiolase activity(GO:0018712) 3-ketopimelyl-CoA thiolase activity(GO:0018713) N-palmitoyltransferase activity(GO:0019105) acyl-CoA N-acyltransferase activity(GO:0019186) protein-cysteine S-myristoyltransferase activity(GO:0019705) glucosaminyl-phosphotidylinositol O-acyltransferase activity(GO:0032216) ergosterol O-acyltransferase activity(GO:0034737) lanosterol O-acyltransferase activity(GO:0034738) naphthyl-2-oxomethyl-succinyl-CoA succinyl transferase activity(GO:0034848) 2,4,4-trimethyl-3-oxopentanoyl-CoA 2-C-propanoyl transferase activity(GO:0034851) 2-methylhexanoyl-CoA C-acetyltransferase activity(GO:0034915) butyryl-CoA 2-C-propionyltransferase activity(GO:0034919) 2,6-dimethyl-5-methylene-3-oxo-heptanoyl-CoA C-acetyltransferase activity(GO:0034945) L-2-aminoadipate N-acetyltransferase activity(GO:0043741) keto acid formate lyase activity(GO:0043806) azetidine-2-carboxylic acid acetyltransferase activity(GO:0046941) peptidyl-lysine N-acetyltransferase activity, acting on acetyl phosphate as donor(GO:0052858) acetyl-CoA:L-lysine N6-acetyltransferase(GO:0090595) |
| 0.0 | 0.8 | GO:0004407 | histone deacetylase activity(GO:0004407) |
| 0.0 | 1.8 | GO:0003899 | DNA-directed RNA polymerase activity(GO:0003899) |
| 0.0 | 2.5 | GO:0003730 | mRNA 3'-UTR binding(GO:0003730) |
| 0.0 | 1.2 | GO:0017017 | MAP kinase tyrosine/serine/threonine phosphatase activity(GO:0017017) |
| 0.0 | 1.6 | GO:0035496 | UDP-glucose:glycoprotein glucosyltransferase activity(GO:0003980) O antigen polymerase activity(GO:0008755) lipopolysaccharide-1,6-galactosyltransferase activity(GO:0008921) cellulose synthase activity(GO:0016759) 9-phenanthrol UDP-glucuronosyltransferase activity(GO:0018715) 1-phenanthrol glycosyltransferase activity(GO:0018716) 9-phenanthrol glycosyltransferase activity(GO:0018717) 1,2-dihydroxy-phenanthrene glycosyltransferase activity(GO:0018718) phenanthrol glycosyltransferase activity(GO:0019112) alpha-1,2-galactosyltransferase activity(GO:0031278) dolichyl pyrophosphate Man7GlcNAc2 alpha-1,3-glucosyltransferase activity(GO:0033556) endogalactosaminidase activity(GO:0033931) lipopolysaccharide-1,5-galactosyltransferase activity(GO:0035496) dolichyl pyrophosphate Glc1Man9GlcNAc2 alpha-1,3-glucosyltransferase activity(GO:0042283) inositol phosphoceramide synthase activity(GO:0045140) alpha-(1->3)-fucosyltransferase activity(GO:0046920) indole-3-butyrate beta-glucosyltransferase activity(GO:0052638) salicylic acid glucosyltransferase (ester-forming) activity(GO:0052639) salicylic acid glucosyltransferase (glucoside-forming) activity(GO:0052640) benzoic acid glucosyltransferase activity(GO:0052641) chondroitin hydrolase activity(GO:0052757) dolichyl-pyrophosphate Man7GlcNAc2 alpha-1,6-mannosyltransferase activity(GO:0052824) cytokinin 9-beta-glucosyltransferase activity(GO:0080062) |
| 0.0 | 1.1 | GO:0005086 | ARF guanyl-nucleotide exchange factor activity(GO:0005086) |
| 0.0 | 0.1 | GO:0042610 | CD8 receptor binding(GO:0042610) |
| 0.0 | 0.1 | GO:0003827 | alpha-1,3-mannosylglycoprotein 2-beta-N-acetylglucosaminyltransferase activity(GO:0003827) |
| 0.0 | 0.8 | GO:0001104 | RNA polymerase II transcription cofactor activity(GO:0001104) |
| 0.0 | 1.1 | GO:0017048 | Rho GTPase binding(GO:0017048) |
| 0.0 | 5.5 | GO:0000287 | magnesium ion binding(GO:0000287) |
| 0.0 | 2.4 | GO:0001228 | transcriptional activator activity, RNA polymerase II transcription regulatory region sequence-specific binding(GO:0001228) |
| 0.0 | 10.8 | GO:0005509 | calcium ion binding(GO:0005509) |
| 0.0 | 1.3 | GO:0004402 | histone acetyltransferase activity(GO:0004402) |
| 0.0 | 5.5 | GO:0061659 | ubiquitin-like protein ligase activity(GO:0061659) |
| 0.0 | 4.4 | GO:0008017 | microtubule binding(GO:0008017) |
| 0.0 | 0.7 | GO:0017112 | Rab guanyl-nucleotide exchange factor activity(GO:0017112) |
| 0.0 | 0.3 | GO:0031404 | chloride ion binding(GO:0031404) |
| 0.0 | 0.2 | GO:0031491 | nucleosome binding(GO:0031491) |
| 0.0 | 0.1 | GO:0016176 | superoxide-generating NADPH oxidase activator activity(GO:0016176) |
| 0.0 | 0.7 | GO:0018024 | histone-lysine N-methyltransferase activity(GO:0018024) |
| 0.0 | 1.4 | GO:0030674 | protein binding, bridging(GO:0030674) |
| 0.0 | 0.7 | GO:0005254 | chloride channel activity(GO:0005254) |
| 0.0 | 4.6 | GO:0004674 | protein serine/threonine kinase activity(GO:0004674) |