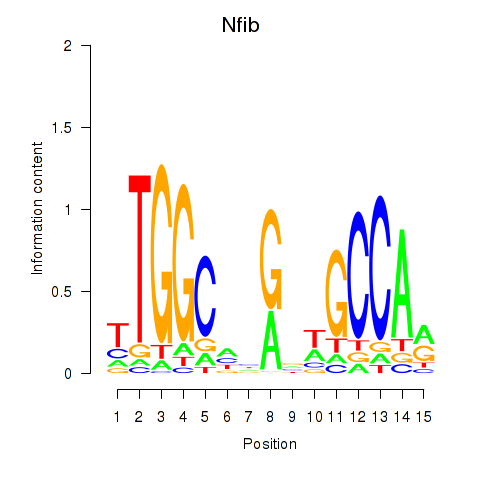
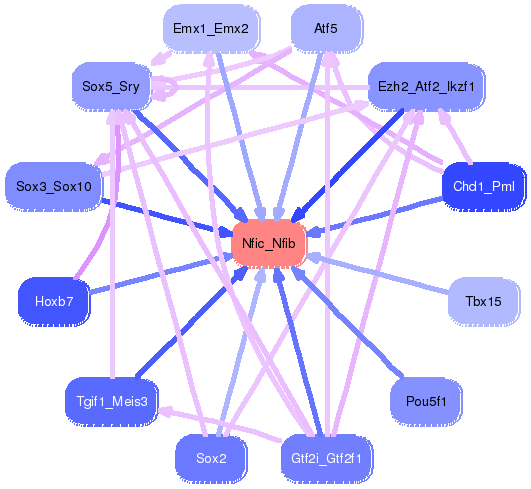
Motif ID: Nfic_Nfib
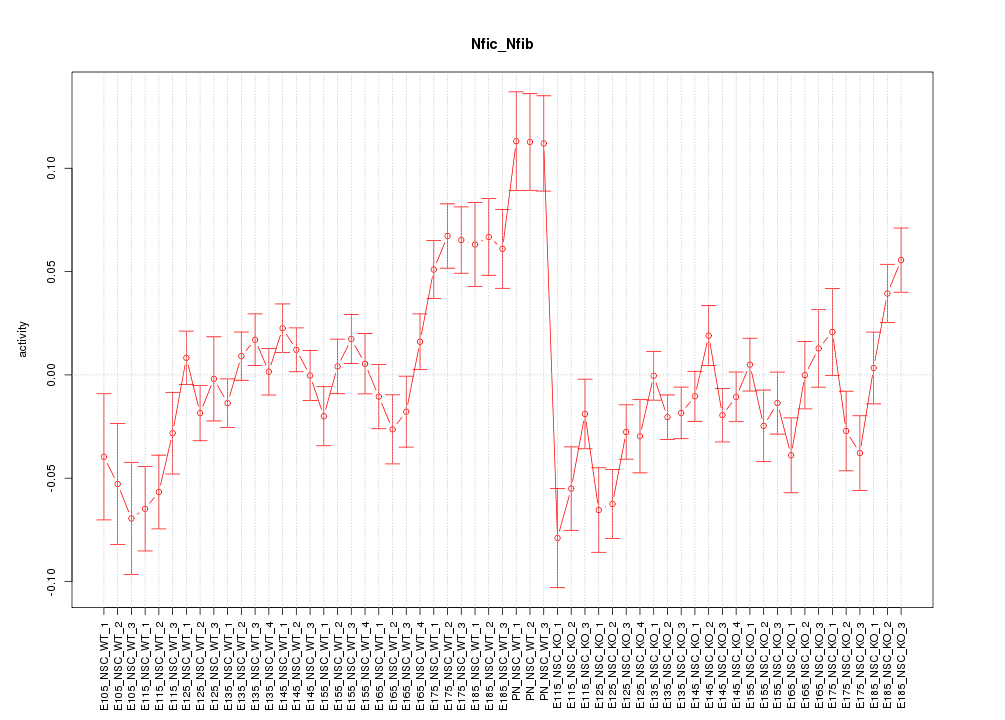
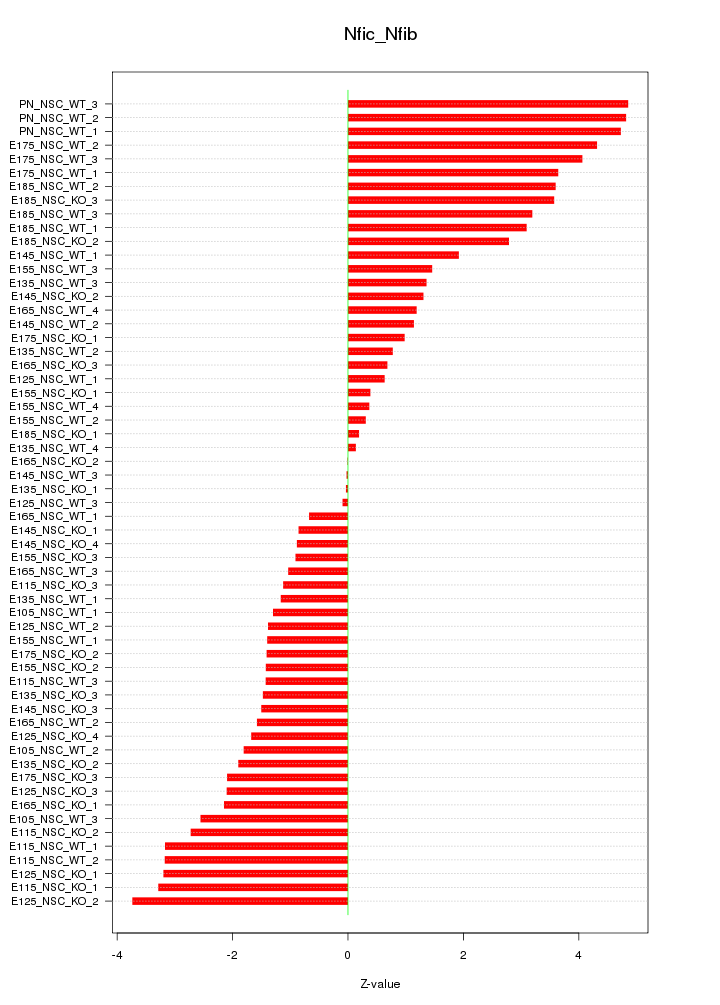
Z-value: 2.267

Transcription factors associated with Nfic_Nfib:
| Gene Symbol | Entrez ID | Gene Name |
|---|---|---|
| Nfib | ENSMUSG00000008575.11 | Nfib |
| Nfic | ENSMUSG00000055053.11 | Nfic |
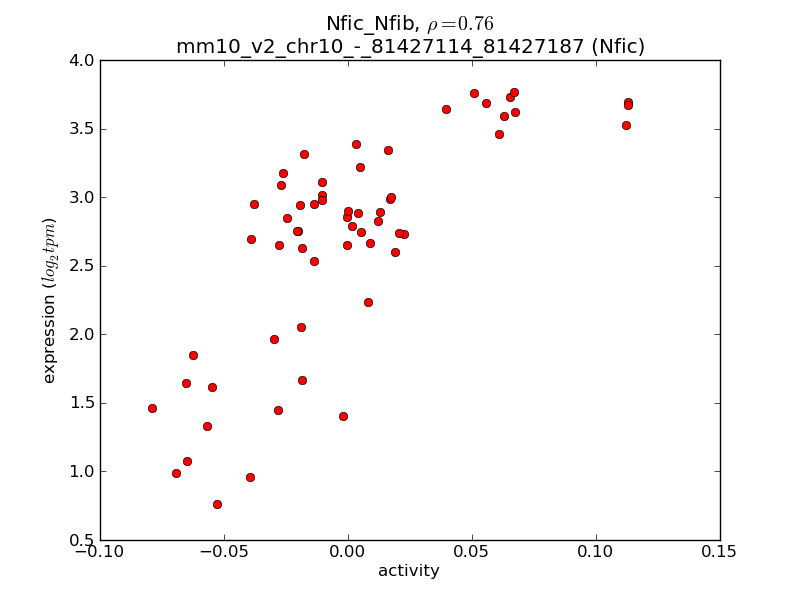
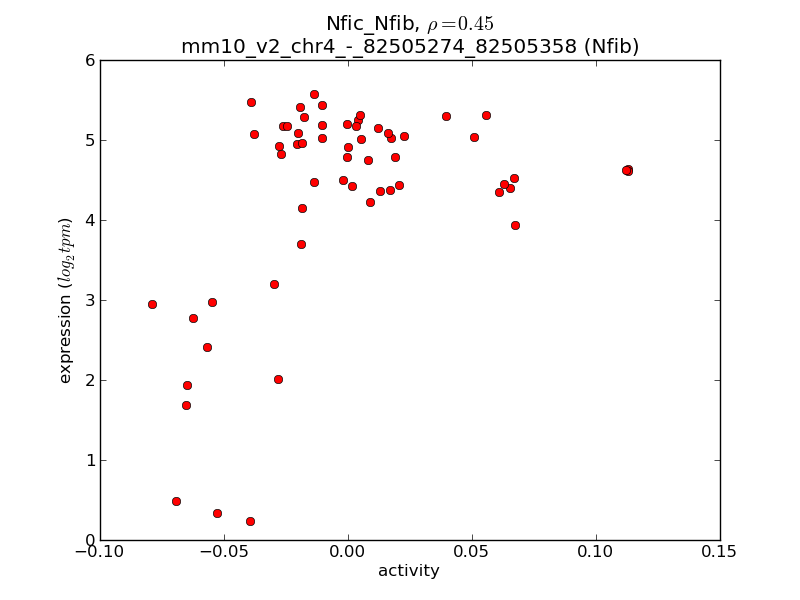
Activity-expression correlation:
| Gene Symbol | Promoter | Pearson corr. coef. | P-value | Plot |
|---|---|---|---|---|
| Nfic | mm10_v2_chr10_-_81427114_81427187 | 0.76 | 1.8e-12 | Click! |
| Nfib | mm10_v2_chr4_-_82505274_82505358 | 0.45 | 3.3e-04 | Click! |

Top targets:
Gene overrepresentation in biological_process category:
| Log-likelihood per target | Total log-likelihood | Term | Description |
|---|---|---|---|
| 12.3 | 61.6 | GO:2000255 | negative regulation of male germ cell proliferation(GO:2000255) |
| 12.1 | 60.4 | GO:0051045 | negative regulation of membrane protein ectodomain proteolysis(GO:0051045) |
| 8.0 | 47.8 | GO:1902847 | macrophage proliferation(GO:0061517) microglial cell proliferation(GO:0061518) regulation of neuronal signal transduction(GO:1902847) positive regulation of tau-protein kinase activity(GO:1902949) |
| 6.0 | 29.9 | GO:1900085 | negative regulation of peptidyl-tyrosine autophosphorylation(GO:1900085) |
| 5.9 | 59.5 | GO:0030388 | fructose 1,6-bisphosphate metabolic process(GO:0030388) |
| 5.9 | 47.0 | GO:0070314 | G1 to G0 transition(GO:0070314) |
| 5.9 | 23.5 | GO:0019372 | lipoxygenase pathway(GO:0019372) |
| 4.5 | 13.5 | GO:0051933 | amino acid neurotransmitter reuptake(GO:0051933) glutamate reuptake(GO:0051935) |
| 4.3 | 13.0 | GO:0006682 | galactosylceramide biosynthetic process(GO:0006682) galactolipid biosynthetic process(GO:0019375) |
| 4.3 | 25.9 | GO:0010624 | regulation of Schwann cell proliferation(GO:0010624) |
| 4.0 | 27.7 | GO:0051611 | negative regulation of neurotransmitter uptake(GO:0051581) serotonin uptake(GO:0051610) regulation of serotonin uptake(GO:0051611) negative regulation of serotonin uptake(GO:0051612) |
| 3.8 | 26.8 | GO:0015840 | urea transport(GO:0015840) urea transmembrane transport(GO:0071918) |
| 3.7 | 14.9 | GO:0010046 | arginine biosynthetic process(GO:0006526) response to mycotoxin(GO:0010046) |
| 3.6 | 10.8 | GO:0043465 | regulation of fermentation(GO:0043465) negative regulation of fermentation(GO:1901003) |
| 3.3 | 6.7 | GO:0019401 | alditol biosynthetic process(GO:0019401) |
| 3.2 | 12.8 | GO:0043415 | positive regulation of skeletal muscle tissue regeneration(GO:0043415) |
| 3.1 | 18.5 | GO:0032804 | negative regulation of low-density lipoprotein particle receptor catabolic process(GO:0032804) |
| 3.0 | 17.9 | GO:0060718 | chorionic trophoblast cell differentiation(GO:0060718) |
| 2.5 | 7.6 | GO:0006533 | aspartate catabolic process(GO:0006533) D-amino acid catabolic process(GO:0019478) |
| 2.4 | 24.0 | GO:0009404 | toxin metabolic process(GO:0009404) |
| 2.4 | 7.1 | GO:0019074 | viral genome packaging(GO:0019072) viral RNA genome packaging(GO:0019074) |
| 2.3 | 20.6 | GO:0042940 | D-amino acid transport(GO:0042940) |
| 2.3 | 20.4 | GO:0061088 | sequestering of zinc ion(GO:0032119) regulation of sequestering of zinc ion(GO:0061088) |
| 2.1 | 37.6 | GO:0060134 | prepulse inhibition(GO:0060134) |
| 2.1 | 10.4 | GO:0070166 | enamel mineralization(GO:0070166) |
| 2.0 | 5.9 | GO:0034035 | purine ribonucleoside bisphosphate metabolic process(GO:0034035) |
| 1.8 | 3.6 | GO:0071603 | endothelial cell-cell adhesion(GO:0071603) |
| 1.8 | 9.0 | GO:1902947 | regulation of tau-protein kinase activity(GO:1902947) |
| 1.8 | 5.3 | GO:0006553 | lysine metabolic process(GO:0006553) |
| 1.7 | 15.4 | GO:0006691 | leukotriene metabolic process(GO:0006691) |
| 1.6 | 4.9 | GO:1904139 | microglial cell migration(GO:1904124) regulation of microglial cell migration(GO:1904139) |
| 1.4 | 4.2 | GO:0030070 | insulin processing(GO:0030070) |
| 1.3 | 5.3 | GO:0051708 | intracellular transport of viral protein in host cell(GO:0019060) symbiont intracellular protein transport in host(GO:0030581) cytosol to ER transport(GO:0046967) intracellular protein transport in other organism involved in symbiotic interaction(GO:0051708) |
| 1.3 | 12.9 | GO:0046415 | urate metabolic process(GO:0046415) |
| 1.3 | 23.2 | GO:0032060 | bleb assembly(GO:0032060) |
| 1.3 | 3.9 | GO:0043988 | histone H3-S28 phosphorylation(GO:0043988) |
| 1.3 | 7.5 | GO:0061343 | cell adhesion involved in heart morphogenesis(GO:0061343) |
| 1.3 | 6.3 | GO:0036151 | phosphatidylcholine acyl-chain remodeling(GO:0036151) |
| 1.2 | 2.5 | GO:1901204 | regulation of adrenergic receptor signaling pathway involved in heart process(GO:1901204) |
| 1.1 | 11.4 | GO:0031639 | plasminogen activation(GO:0031639) |
| 1.1 | 29.5 | GO:0033622 | integrin activation(GO:0033622) |
| 1.1 | 3.3 | GO:0003032 | detection of oxygen(GO:0003032) |
| 1.1 | 5.4 | GO:0042167 | heme catabolic process(GO:0042167) pigment catabolic process(GO:0046149) |
| 1.0 | 3.0 | GO:0003195 | tricuspid valve development(GO:0003175) tricuspid valve morphogenesis(GO:0003186) tricuspid valve formation(GO:0003195) right ventricular cardiac muscle tissue morphogenesis(GO:0003221) |
| 1.0 | 4.0 | GO:0044565 | dendritic cell proliferation(GO:0044565) |
| 1.0 | 2.9 | GO:0070649 | meiotic chromosome movement towards spindle pole(GO:0016344) formin-nucleated actin cable assembly(GO:0070649) |
| 1.0 | 6.7 | GO:0061002 | negative regulation of dendritic spine morphogenesis(GO:0061002) |
| 0.9 | 5.4 | GO:0006123 | mitochondrial electron transport, cytochrome c to oxygen(GO:0006123) |
| 0.8 | 4.2 | GO:0030240 | skeletal muscle thin filament assembly(GO:0030240) |
| 0.8 | 3.3 | GO:0071449 | cellular response to lipid hydroperoxide(GO:0071449) |
| 0.8 | 2.4 | GO:0034162 | toll-like receptor 9 signaling pathway(GO:0034162) |
| 0.8 | 2.4 | GO:2000598 | regulation of cyclin catabolic process(GO:2000598) negative regulation of cyclin catabolic process(GO:2000599) |
| 0.7 | 12.0 | GO:0021891 | olfactory bulb interneuron development(GO:0021891) |
| 0.7 | 4.5 | GO:0035428 | hexose transmembrane transport(GO:0035428) |
| 0.7 | 17.7 | GO:0006910 | phagocytosis, recognition(GO:0006910) |
| 0.7 | 5.1 | GO:2001199 | negative regulation of dendritic cell differentiation(GO:2001199) |
| 0.7 | 20.2 | GO:0010866 | regulation of triglyceride biosynthetic process(GO:0010866) |
| 0.7 | 2.1 | GO:0042264 | peptidyl-aspartic acid hydroxylation(GO:0042264) |
| 0.7 | 4.1 | GO:0071455 | cellular response to increased oxygen levels(GO:0036295) response to increased oxygen levels(GO:0036296) response to hyperoxia(GO:0055093) cellular response to hyperoxia(GO:0071455) |
| 0.7 | 4.7 | GO:0001880 | Mullerian duct regression(GO:0001880) |
| 0.7 | 1.3 | GO:0006566 | threonine metabolic process(GO:0006566) |
| 0.6 | 6.7 | GO:2000653 | regulation of genetic imprinting(GO:2000653) |
| 0.6 | 6.7 | GO:0061032 | visceral serous pericardium development(GO:0061032) |
| 0.6 | 5.8 | GO:0019885 | antigen processing and presentation of endogenous peptide antigen via MHC class I(GO:0019885) |
| 0.5 | 26.6 | GO:0048678 | response to axon injury(GO:0048678) |
| 0.5 | 3.1 | GO:0021814 | cell motility involved in cerebral cortex radial glia guided migration(GO:0021814) |
| 0.5 | 2.0 | GO:0035093 | spermatogenesis, exchange of chromosomal proteins(GO:0035093) |
| 0.5 | 2.0 | GO:0098912 | membrane depolarization during atrial cardiac muscle cell action potential(GO:0098912) |
| 0.5 | 3.0 | GO:0009169 | purine nucleoside monophosphate catabolic process(GO:0009128) ribonucleoside monophosphate catabolic process(GO:0009158) purine ribonucleoside monophosphate catabolic process(GO:0009169) |
| 0.5 | 4.3 | GO:0071493 | elastic fiber assembly(GO:0048251) cellular response to UV-B(GO:0071493) |
| 0.5 | 5.3 | GO:0032000 | positive regulation of fatty acid beta-oxidation(GO:0032000) |
| 0.5 | 4.2 | GO:0051409 | response to nitrosative stress(GO:0051409) |
| 0.5 | 1.4 | GO:0038095 | positive regulation of mast cell cytokine production(GO:0032765) Fc-epsilon receptor signaling pathway(GO:0038095) |
| 0.5 | 4.5 | GO:0042118 | endothelial cell activation(GO:0042118) |
| 0.4 | 5.3 | GO:0090244 | Wnt signaling pathway involved in somitogenesis(GO:0090244) |
| 0.4 | 1.7 | GO:0033580 | protein glycosylation at cell surface(GO:0033575) protein galactosylation at cell surface(GO:0033580) protein galactosylation(GO:0042125) |
| 0.4 | 8.8 | GO:0051965 | positive regulation of synapse assembly(GO:0051965) |
| 0.4 | 1.2 | GO:0019085 | early viral transcription(GO:0019085) |
| 0.4 | 4.1 | GO:0071578 | zinc II ion transmembrane import(GO:0071578) |
| 0.4 | 1.2 | GO:0030210 | heparin biosynthetic process(GO:0030210) |
| 0.4 | 1.2 | GO:0070488 | neutrophil aggregation(GO:0070488) |
| 0.4 | 3.8 | GO:1902231 | positive regulation of intrinsic apoptotic signaling pathway in response to DNA damage(GO:1902231) |
| 0.4 | 4.8 | GO:0046697 | decidualization(GO:0046697) |
| 0.4 | 12.8 | GO:0051930 | regulation of sensory perception of pain(GO:0051930) regulation of sensory perception(GO:0051931) |
| 0.4 | 1.1 | GO:1901420 | negative regulation of response to alcohol(GO:1901420) |
| 0.3 | 1.9 | GO:0006537 | glutamate biosynthetic process(GO:0006537) |
| 0.3 | 1.2 | GO:0072365 | regulation of cellular ketone metabolic process by negative regulation of transcription from RNA polymerase II promoter(GO:0072365) |
| 0.3 | 9.8 | GO:0050873 | brown fat cell differentiation(GO:0050873) |
| 0.3 | 5.6 | GO:2000001 | regulation of DNA damage checkpoint(GO:2000001) |
| 0.3 | 4.6 | GO:0051447 | negative regulation of meiotic cell cycle(GO:0051447) |
| 0.3 | 1.6 | GO:2001185 | regulation of CD8-positive, alpha-beta T cell activation(GO:2001185) |
| 0.3 | 1.6 | GO:1900028 | negative regulation of ruffle assembly(GO:1900028) |
| 0.2 | 3.8 | GO:0032793 | positive regulation of CREB transcription factor activity(GO:0032793) |
| 0.2 | 14.8 | GO:0048747 | muscle fiber development(GO:0048747) |
| 0.2 | 0.9 | GO:0060907 | positive regulation of macrophage cytokine production(GO:0060907) |
| 0.2 | 0.4 | GO:0010872 | regulation of cholesterol esterification(GO:0010872) |
| 0.2 | 4.5 | GO:0046185 | aldehyde catabolic process(GO:0046185) |
| 0.2 | 7.8 | GO:0060395 | SMAD protein signal transduction(GO:0060395) |
| 0.2 | 1.3 | GO:0014745 | negative regulation of muscle adaptation(GO:0014745) |
| 0.2 | 1.4 | GO:0006646 | phosphatidylethanolamine biosynthetic process(GO:0006646) |
| 0.2 | 3.3 | GO:0006182 | cGMP biosynthetic process(GO:0006182) |
| 0.2 | 12.7 | GO:0051865 | protein autoubiquitination(GO:0051865) |
| 0.2 | 4.0 | GO:0048268 | clathrin coat assembly(GO:0048268) |
| 0.2 | 7.2 | GO:0019915 | lipid storage(GO:0019915) |
| 0.2 | 4.6 | GO:0002089 | lens morphogenesis in camera-type eye(GO:0002089) |
| 0.2 | 1.9 | GO:0014887 | muscle hypertrophy in response to stress(GO:0003299) cardiac muscle adaptation(GO:0014887) cardiac muscle hypertrophy in response to stress(GO:0014898) |
| 0.2 | 1.0 | GO:0001980 | regulation of systemic arterial blood pressure by ischemic conditions(GO:0001980) |
| 0.2 | 9.2 | GO:0006970 | response to osmotic stress(GO:0006970) |
| 0.2 | 5.9 | GO:0000038 | very long-chain fatty acid metabolic process(GO:0000038) |
| 0.2 | 0.9 | GO:0097186 | amelogenesis(GO:0097186) |
| 0.2 | 3.8 | GO:0032011 | ARF protein signal transduction(GO:0032011) regulation of ARF protein signal transduction(GO:0032012) |
| 0.1 | 0.6 | GO:0006570 | tyrosine metabolic process(GO:0006570) ventricular zone neuroblast division(GO:0021847) |
| 0.1 | 11.9 | GO:0007601 | visual perception(GO:0007601) |
| 0.1 | 2.5 | GO:0006044 | N-acetylglucosamine metabolic process(GO:0006044) |
| 0.1 | 1.7 | GO:0031274 | pseudopodium assembly(GO:0031269) regulation of pseudopodium assembly(GO:0031272) positive regulation of pseudopodium assembly(GO:0031274) |
| 0.1 | 1.7 | GO:0060481 | lobar bronchus epithelium development(GO:0060481) |
| 0.1 | 1.3 | GO:0031937 | positive regulation of chromatin silencing(GO:0031937) |
| 0.1 | 1.8 | GO:0010388 | cullin deneddylation(GO:0010388) |
| 0.1 | 0.7 | GO:2000664 | positive regulation of interleukin-5 secretion(GO:2000664) positive regulation of interleukin-13 secretion(GO:2000667) |
| 0.1 | 0.8 | GO:0006995 | cellular response to nitrogen starvation(GO:0006995) cellular response to nitrogen levels(GO:0043562) |
| 0.1 | 0.8 | GO:2000194 | regulation of female gonad development(GO:2000194) |
| 0.1 | 2.6 | GO:0043171 | peptide catabolic process(GO:0043171) |
| 0.1 | 1.2 | GO:2000114 | regulation of establishment of cell polarity(GO:2000114) |
| 0.1 | 0.7 | GO:0006701 | progesterone biosynthetic process(GO:0006701) |
| 0.1 | 0.3 | GO:0072531 | pyrimidine-containing compound transmembrane transport(GO:0072531) |
| 0.1 | 1.3 | GO:0050860 | negative regulation of T cell receptor signaling pathway(GO:0050860) |
| 0.1 | 1.3 | GO:0032516 | positive regulation of phosphoprotein phosphatase activity(GO:0032516) |
| 0.1 | 0.2 | GO:0090271 | positive regulation of fibroblast growth factor production(GO:0090271) |
| 0.1 | 2.7 | GO:0060325 | face morphogenesis(GO:0060325) |
| 0.1 | 1.4 | GO:0050982 | detection of mechanical stimulus(GO:0050982) |
| 0.1 | 0.2 | GO:1903966 | monounsaturated fatty acid metabolic process(GO:1903964) monounsaturated fatty acid biosynthetic process(GO:1903966) |
| 0.1 | 3.4 | GO:0042475 | odontogenesis of dentin-containing tooth(GO:0042475) |
| 0.1 | 3.0 | GO:0003341 | cilium movement(GO:0003341) |
| 0.1 | 0.4 | GO:0061029 | eyelid development in camera-type eye(GO:0061029) |
| 0.1 | 0.8 | GO:0001672 | regulation of chromatin assembly or disassembly(GO:0001672) |
| 0.1 | 0.2 | GO:0032713 | negative regulation of interleukin-4 production(GO:0032713) |
| 0.0 | 1.8 | GO:0006635 | fatty acid beta-oxidation(GO:0006635) |
| 0.0 | 0.4 | GO:0034551 | respiratory chain complex III assembly(GO:0017062) mitochondrial respiratory chain complex III assembly(GO:0034551) mitochondrial respiratory chain complex III biogenesis(GO:0097033) |
| 0.0 | 1.3 | GO:0097320 | membrane tubulation(GO:0097320) |
| 0.0 | 0.3 | GO:0034143 | regulation of toll-like receptor 4 signaling pathway(GO:0034143) |
| 0.0 | 0.4 | GO:0001975 | response to amphetamine(GO:0001975) response to amine(GO:0014075) |
| 0.0 | 0.6 | GO:0051974 | negative regulation of telomerase activity(GO:0051974) |
| 0.0 | 3.4 | GO:0042552 | myelination(GO:0042552) |
| 0.0 | 0.1 | GO:0044339 | canonical Wnt signaling pathway involved in osteoblast differentiation(GO:0044339) |
| 0.0 | 3.6 | GO:0043149 | contractile actin filament bundle assembly(GO:0030038) stress fiber assembly(GO:0043149) |
| 0.0 | 0.4 | GO:0014823 | response to activity(GO:0014823) |
| 0.0 | 0.1 | GO:0019336 | phenol-containing compound catabolic process(GO:0019336) hormone catabolic process(GO:0042447) |
| 0.0 | 0.9 | GO:0046329 | negative regulation of JNK cascade(GO:0046329) |
| 0.0 | 0.5 | GO:0021681 | cerebellar granular layer development(GO:0021681) |
| 0.0 | 0.6 | GO:0048147 | negative regulation of fibroblast proliferation(GO:0048147) |
| 0.0 | 0.6 | GO:0001574 | ganglioside biosynthetic process(GO:0001574) |
| 0.0 | 0.7 | GO:0070979 | protein K11-linked ubiquitination(GO:0070979) |
| 0.0 | 0.5 | GO:0055072 | iron ion homeostasis(GO:0055072) |
| 0.0 | 2.2 | GO:0051225 | spindle assembly(GO:0051225) |
| 0.0 | 0.0 | GO:0072008 | glomerular mesangial cell differentiation(GO:0072008) glomerular mesangial cell development(GO:0072144) metanephric glomerular mesangium development(GO:0072223) metanephric glomerular mesangial cell proliferation involved in metanephros development(GO:0072262) |
| 0.0 | 2.8 | GO:0007219 | Notch signaling pathway(GO:0007219) |
| 0.0 | 1.0 | GO:0016064 | immunoglobulin mediated immune response(GO:0016064) |
| 0.0 | 0.3 | GO:0070884 | regulation of calcineurin-NFAT signaling cascade(GO:0070884) |
| 0.0 | 2.9 | GO:0006906 | vesicle fusion(GO:0006906) |
| 0.0 | 0.7 | GO:0051438 | regulation of ubiquitin-protein transferase activity(GO:0051438) |
| 0.0 | 0.2 | GO:0006206 | pyrimidine nucleobase metabolic process(GO:0006206) |
| 0.0 | 3.7 | GO:0048863 | stem cell differentiation(GO:0048863) |
| 0.0 | 0.8 | GO:0010508 | positive regulation of autophagy(GO:0010508) |
| 0.0 | 0.0 | GO:2000124 | regulation of endocannabinoid signaling pathway(GO:2000124) |
| 0.0 | 0.1 | GO:0010606 | positive regulation of cytoplasmic mRNA processing body assembly(GO:0010606) |
Gene overrepresentation in cellular_component category:
| Log-likelihood per target | Total log-likelihood | Term | Description |
|---|---|---|---|
| 6.8 | 47.8 | GO:0034366 | spherical high-density lipoprotein particle(GO:0034366) neurofibrillary tangle(GO:0097418) |
| 6.5 | 25.9 | GO:0097450 | astrocyte end-foot(GO:0097450) |
| 4.9 | 14.8 | GO:0005595 | collagen type XII trimer(GO:0005595) anchoring collagen complex(GO:0030934) |
| 4.4 | 13.1 | GO:1990667 | PCSK9-AnxA2 complex(GO:1990667) |
| 4.3 | 12.9 | GO:0071953 | elastic fiber(GO:0071953) |
| 2.9 | 26.3 | GO:0097449 | astrocyte projection(GO:0097449) |
| 2.0 | 29.9 | GO:0034098 | VCP-NPL4-UFD1 AAA ATPase complex(GO:0034098) |
| 1.6 | 4.9 | GO:1990682 | CSF1-CSF1R complex(GO:1990682) |
| 1.4 | 4.2 | GO:0017109 | glutamate-cysteine ligase complex(GO:0017109) |
| 1.0 | 3.0 | GO:0036156 | inner dynein arm(GO:0036156) |
| 1.0 | 12.8 | GO:0070852 | cell body fiber(GO:0070852) |
| 0.9 | 5.6 | GO:0032299 | ribonuclease H2 complex(GO:0032299) |
| 0.9 | 3.4 | GO:0043259 | laminin-10 complex(GO:0043259) |
| 0.8 | 5.3 | GO:0042825 | TAP complex(GO:0042825) |
| 0.7 | 56.9 | GO:0005791 | rough endoplasmic reticulum(GO:0005791) |
| 0.7 | 5.4 | GO:0005751 | mitochondrial respiratory chain complex IV(GO:0005751) |
| 0.7 | 4.6 | GO:0033391 | chromatoid body(GO:0033391) |
| 0.5 | 5.4 | GO:0030128 | clathrin coat of endocytic vesicle(GO:0030128) clathrin-coated endocytic vesicle membrane(GO:0030669) |
| 0.4 | 4.5 | GO:0044327 | dendritic spine head(GO:0044327) |
| 0.4 | 3.4 | GO:0033269 | internode region of axon(GO:0033269) |
| 0.4 | 2.1 | GO:0032541 | cortical endoplasmic reticulum(GO:0032541) |
| 0.4 | 5.4 | GO:0012510 | trans-Golgi network transport vesicle membrane(GO:0012510) |
| 0.4 | 16.4 | GO:0044297 | cell body(GO:0044297) |
| 0.4 | 3.3 | GO:0008074 | guanylate cyclase complex, soluble(GO:0008074) |
| 0.4 | 1.8 | GO:0030314 | junctional membrane complex(GO:0030314) |
| 0.3 | 10.6 | GO:0097440 | apical dendrite(GO:0097440) |
| 0.3 | 10.0 | GO:0030673 | axolemma(GO:0030673) |
| 0.3 | 2.9 | GO:0000813 | ESCRT I complex(GO:0000813) |
| 0.3 | 1.3 | GO:0036454 | insulin-like growth factor binding protein complex(GO:0016942) growth factor complex(GO:0036454) insulin-like growth factor ternary complex(GO:0042567) |
| 0.3 | 12.4 | GO:0031902 | late endosome membrane(GO:0031902) |
| 0.3 | 5.3 | GO:0032593 | insulin-responsive compartment(GO:0032593) |
| 0.3 | 4.0 | GO:0005952 | cAMP-dependent protein kinase complex(GO:0005952) |
| 0.3 | 4.2 | GO:0031045 | dense core granule(GO:0031045) |
| 0.3 | 6.7 | GO:0002102 | podosome(GO:0002102) |
| 0.2 | 5.3 | GO:0030877 | beta-catenin destruction complex(GO:0030877) |
| 0.2 | 19.2 | GO:0097060 | synaptic membrane(GO:0097060) |
| 0.2 | 15.8 | GO:0005581 | collagen trimer(GO:0005581) |
| 0.2 | 5.8 | GO:0016581 | NuRD complex(GO:0016581) CHD-type complex(GO:0090545) |
| 0.2 | 17.0 | GO:0005604 | basement membrane(GO:0005604) |
| 0.2 | 22.0 | GO:0005814 | centriole(GO:0005814) |
| 0.2 | 0.6 | GO:1990879 | CST complex(GO:1990879) |
| 0.2 | 37.3 | GO:0030017 | sarcomere(GO:0030017) |
| 0.2 | 0.8 | GO:0032839 | dendrite cytoplasm(GO:0032839) |
| 0.2 | 6.3 | GO:0043292 | contractile fiber(GO:0043292) |
| 0.2 | 13.6 | GO:0005901 | caveola(GO:0005901) |
| 0.1 | 26.5 | GO:0005777 | peroxisome(GO:0005777) microbody(GO:0042579) |
| 0.1 | 6.1 | GO:0005788 | endoplasmic reticulum lumen(GO:0005788) |
| 0.1 | 3.6 | GO:0005921 | gap junction(GO:0005921) |
| 0.1 | 14.2 | GO:0042383 | sarcolemma(GO:0042383) |
| 0.1 | 6.7 | GO:0005844 | polysome(GO:0005844) |
| 0.1 | 5.2 | GO:0005811 | lipid particle(GO:0005811) |
| 0.1 | 0.6 | GO:0070847 | core mediator complex(GO:0070847) |
| 0.1 | 1.7 | GO:0044217 | other organism(GO:0044215) other organism cell(GO:0044216) other organism part(GO:0044217) |
| 0.1 | 5.2 | GO:0031012 | extracellular matrix(GO:0031012) |
| 0.1 | 1.0 | GO:0001527 | microfibril(GO:0001527) |
| 0.1 | 11.7 | GO:0045121 | membrane raft(GO:0045121) membrane microdomain(GO:0098857) |
| 0.1 | 4.4 | GO:0005793 | endoplasmic reticulum-Golgi intermediate compartment(GO:0005793) |
| 0.1 | 40.2 | GO:0030424 | axon(GO:0030424) |
| 0.1 | 4.0 | GO:0005905 | clathrin-coated pit(GO:0005905) |
| 0.1 | 1.2 | GO:0035327 | transcriptionally active chromatin(GO:0035327) |
| 0.1 | 25.8 | GO:0043025 | neuronal cell body(GO:0043025) |
| 0.1 | 47.5 | GO:0005615 | extracellular space(GO:0005615) |
| 0.1 | 22.1 | GO:0005743 | mitochondrial inner membrane(GO:0005743) |
| 0.1 | 0.7 | GO:0031462 | Cul2-RING ubiquitin ligase complex(GO:0031462) |
| 0.1 | 1.3 | GO:0030864 | cortical actin cytoskeleton(GO:0030864) |
| 0.0 | 1.8 | GO:0008180 | COP9 signalosome(GO:0008180) |
| 0.0 | 2.9 | GO:0005884 | actin filament(GO:0005884) |
| 0.0 | 2.9 | GO:0008021 | synaptic vesicle(GO:0008021) |
| 0.0 | 0.3 | GO:0031527 | filopodium membrane(GO:0031527) |
| 0.0 | 0.4 | GO:0035686 | sperm fibrous sheath(GO:0035686) |
| 0.0 | 115.8 | GO:0016021 | integral component of membrane(GO:0016021) |
| 0.0 | 2.5 | GO:0017053 | transcriptional repressor complex(GO:0017053) |
| 0.0 | 0.4 | GO:0044666 | MLL3/4 complex(GO:0044666) |
| 0.0 | 0.7 | GO:0005680 | anaphase-promoting complex(GO:0005680) |
| 0.0 | 0.8 | GO:0000314 | organellar small ribosomal subunit(GO:0000314) mitochondrial small ribosomal subunit(GO:0005763) |
| 0.0 | 1.3 | GO:0031234 | extrinsic component of cytoplasmic side of plasma membrane(GO:0031234) |
| 0.0 | 0.1 | GO:0031251 | PAN complex(GO:0031251) |
| 0.0 | 1.8 | GO:0005938 | cell cortex(GO:0005938) |
| 0.0 | 0.6 | GO:0000932 | cytoplasmic mRNA processing body(GO:0000932) |
Gene overrepresentation in molecular_function category:
| Log-likelihood per target | Total log-likelihood | Term | Description |
|---|---|---|---|
| 15.4 | 61.6 | GO:0004667 | prostaglandin-D synthase activity(GO:0004667) |
| 10.2 | 61.5 | GO:0004332 | fructose-bisphosphate aldolase activity(GO:0004332) |
| 6.0 | 29.9 | GO:0070320 | inward rectifier potassium channel inhibitor activity(GO:0070320) |
| 4.8 | 24.0 | GO:0004499 | N,N-dimethylaniline monooxygenase activity(GO:0004499) |
| 4.6 | 60.4 | GO:0008191 | metalloendopeptidase inhibitor activity(GO:0008191) |
| 4.5 | 13.5 | GO:0015272 | ATP-activated inward rectifier potassium channel activity(GO:0015272) |
| 4.5 | 26.8 | GO:0015265 | urea channel activity(GO:0015265) |
| 3.6 | 10.8 | GO:0008521 | acetyl-CoA transporter activity(GO:0008521) |
| 3.4 | 10.1 | GO:0015143 | urate transmembrane transporter activity(GO:0015143) salt transmembrane transporter activity(GO:1901702) |
| 3.3 | 13.1 | GO:0004859 | phospholipase inhibitor activity(GO:0004859) phospholipase A2 inhibitor activity(GO:0019834) |
| 3.0 | 12.2 | GO:0001733 | galactosylceramide sulfotransferase activity(GO:0001733) |
| 2.7 | 16.4 | GO:0019841 | retinol binding(GO:0019841) |
| 2.6 | 12.8 | GO:0001640 | adenylate cyclase inhibiting G-protein coupled glutamate receptor activity(GO:0001640) |
| 2.5 | 10.2 | GO:0003884 | D-amino-acid oxidase activity(GO:0003884) aspartate oxidase activity(GO:0015922) |
| 2.5 | 10.0 | GO:0015501 | glutamate:sodium symporter activity(GO:0015501) |
| 2.3 | 2.3 | GO:0070915 | lysophosphatidic acid receptor activity(GO:0070915) |
| 2.2 | 6.7 | GO:0008131 | primary amine oxidase activity(GO:0008131) |
| 2.1 | 47.8 | GO:0051787 | misfolded protein binding(GO:0051787) |
| 2.1 | 30.8 | GO:0008430 | selenium binding(GO:0008430) |
| 1.7 | 6.7 | GO:0008967 | phosphoglycolate phosphatase activity(GO:0008967) |
| 1.7 | 14.9 | GO:0015643 | toxic substance binding(GO:0015643) |
| 1.6 | 6.3 | GO:0030156 | benzodiazepine receptor binding(GO:0030156) |
| 1.4 | 4.2 | GO:0004357 | glutamate-cysteine ligase activity(GO:0004357) |
| 1.3 | 5.4 | GO:0004074 | biliverdin reductase activity(GO:0004074) |
| 1.3 | 5.3 | GO:0023029 | peptide antigen-transporting ATPase activity(GO:0015433) MHC class Ib protein binding(GO:0023029) tapasin binding(GO:0046980) |
| 1.3 | 5.3 | GO:0016647 | oxidoreductase activity, acting on the CH-NH group of donors, oxygen as acceptor(GO:0016647) |
| 1.3 | 3.9 | GO:0035175 | histone kinase activity (H3-S10 specific)(GO:0035175) |
| 1.2 | 4.8 | GO:0004921 | interleukin-11 receptor activity(GO:0004921) interleukin-11 binding(GO:0019970) |
| 1.2 | 7.1 | GO:0009374 | biotin binding(GO:0009374) |
| 1.1 | 4.5 | GO:0001011 | transcription factor activity, sequence-specific DNA binding, RNA polymerase recruiting(GO:0001011) transcription factor activity, TFIIB-class binding(GO:0001087) |
| 1.1 | 3.3 | GO:0005534 | galactose binding(GO:0005534) |
| 1.0 | 38.7 | GO:0005504 | fatty acid binding(GO:0005504) |
| 0.9 | 24.5 | GO:0005385 | zinc ion transmembrane transporter activity(GO:0005385) |
| 0.9 | 4.5 | GO:0004030 | aldehyde dehydrogenase [NAD(P)+] activity(GO:0004030) |
| 0.9 | 7.0 | GO:0018741 | alkyl sulfatase activity(GO:0018741) endosulfan hemisulfate sulfatase activity(GO:0034889) endosulfan sulfate hydrolase activity(GO:0034902) |
| 0.9 | 3.4 | GO:0019911 | structural constituent of myelin sheath(GO:0019911) |
| 0.9 | 18.0 | GO:0005520 | insulin-like growth factor binding(GO:0005520) |
| 0.8 | 10.6 | GO:0022889 | L-serine transmembrane transporter activity(GO:0015194) serine transmembrane transporter activity(GO:0022889) |
| 0.7 | 5.9 | GO:0004779 | sulfate adenylyltransferase activity(GO:0004779) |
| 0.7 | 5.6 | GO:0004523 | RNA-DNA hybrid ribonuclease activity(GO:0004523) |
| 0.7 | 16.7 | GO:0030506 | ankyrin binding(GO:0030506) |
| 0.7 | 4.1 | GO:0005138 | interleukin-6 receptor binding(GO:0005138) |
| 0.7 | 4.0 | GO:0004691 | cAMP-dependent protein kinase activity(GO:0004691) |
| 0.6 | 1.3 | GO:0098634 | protein binding involved in cell-matrix adhesion(GO:0098634) collagen binding involved in cell-matrix adhesion(GO:0098639) |
| 0.6 | 5.4 | GO:0048406 | nerve growth factor binding(GO:0048406) |
| 0.6 | 2.4 | GO:0050436 | microfibril binding(GO:0050436) |
| 0.5 | 56.8 | GO:0005178 | integrin binding(GO:0005178) |
| 0.5 | 3.8 | GO:0005004 | GPI-linked ephrin receptor activity(GO:0005004) |
| 0.5 | 1.4 | GO:0031798 | type 1 metabotropic glutamate receptor binding(GO:0031798) |
| 0.4 | 1.3 | GO:0008732 | threonine aldolase activity(GO:0004793) L-allo-threonine aldolase activity(GO:0008732) |
| 0.4 | 17.7 | GO:0045309 | protein phosphorylated amino acid binding(GO:0045309) |
| 0.4 | 8.5 | GO:0043539 | protein serine/threonine kinase activator activity(GO:0043539) |
| 0.4 | 2.0 | GO:0086056 | voltage-gated calcium channel activity involved in cardiac muscle cell action potential(GO:0086007) voltage-gated calcium channel activity involved in AV node cell action potential(GO:0086056) |
| 0.4 | 7.5 | GO:0005104 | fibroblast growth factor receptor binding(GO:0005104) |
| 0.4 | 5.5 | GO:0001223 | transcription coactivator binding(GO:0001223) |
| 0.4 | 4.3 | GO:0031957 | very long-chain fatty acid-CoA ligase activity(GO:0031957) |
| 0.4 | 1.2 | GO:0010698 | acetyltransferase activator activity(GO:0010698) |
| 0.4 | 4.5 | GO:0005355 | glucose transmembrane transporter activity(GO:0005355) |
| 0.4 | 3.3 | GO:0004383 | guanylate cyclase activity(GO:0004383) |
| 0.4 | 7.8 | GO:0042056 | chemoattractant activity(GO:0042056) |
| 0.4 | 9.2 | GO:0001786 | phosphatidylserine binding(GO:0001786) |
| 0.4 | 1.8 | GO:0004165 | dodecenoyl-CoA delta-isomerase activity(GO:0004165) |
| 0.3 | 4.2 | GO:0050897 | cobalt ion binding(GO:0050897) |
| 0.3 | 13.0 | GO:0008748 | N-ethylmaleimide reductase activity(GO:0008748) reduced coenzyme F420 dehydrogenase activity(GO:0043738) sulfur oxygenase reductase activity(GO:0043826) malolactic enzyme activity(GO:0043883) epoxyqueuosine reductase activity(GO:0052693) |
| 0.3 | 1.7 | GO:0001849 | complement component C1q binding(GO:0001849) |
| 0.3 | 1.0 | GO:0030172 | troponin C binding(GO:0030172) |
| 0.3 | 1.7 | GO:0047276 | N-acetyllactosaminide 3-alpha-galactosyltransferase activity(GO:0047276) |
| 0.3 | 0.8 | GO:0030957 | Tat protein binding(GO:0030957) |
| 0.3 | 1.4 | GO:0004305 | ethanolamine kinase activity(GO:0004305) |
| 0.3 | 8.6 | GO:0005201 | extracellular matrix structural constituent(GO:0005201) |
| 0.3 | 1.6 | GO:0000774 | adenyl-nucleotide exchange factor activity(GO:0000774) |
| 0.2 | 0.7 | GO:0030368 | interleukin-17 receptor activity(GO:0030368) |
| 0.2 | 1.7 | GO:0001515 | opioid peptide activity(GO:0001515) |
| 0.2 | 5.4 | GO:0016676 | cytochrome-c oxidase activity(GO:0004129) heme-copper terminal oxidase activity(GO:0015002) oxidoreductase activity, acting on a heme group of donors, oxygen as acceptor(GO:0016676) |
| 0.2 | 3.3 | GO:0004602 | glutathione peroxidase activity(GO:0004602) |
| 0.2 | 22.2 | GO:0042626 | ATPase activity, coupled to transmembrane movement of substances(GO:0042626) |
| 0.2 | 5.3 | GO:0070016 | armadillo repeat domain binding(GO:0070016) |
| 0.2 | 9.0 | GO:0030971 | receptor tyrosine kinase binding(GO:0030971) |
| 0.2 | 0.9 | GO:0008273 | calcium, potassium:sodium antiporter activity(GO:0008273) |
| 0.2 | 11.4 | GO:0051219 | phosphoprotein binding(GO:0051219) |
| 0.2 | 6.6 | GO:0052771 | coenzyme F390-A hydrolase activity(GO:0052770) coenzyme F390-G hydrolase activity(GO:0052771) |
| 0.2 | 3.3 | GO:0003841 | 1-acylglycerol-3-phosphate O-acyltransferase activity(GO:0003841) lysophosphatidic acid acyltransferase activity(GO:0042171) |
| 0.2 | 5.3 | GO:0046875 | ephrin receptor binding(GO:0046875) |
| 0.2 | 2.6 | GO:0070006 | metalloaminopeptidase activity(GO:0070006) |
| 0.1 | 3.7 | GO:0005544 | calcium-dependent phospholipid binding(GO:0005544) |
| 0.1 | 9.3 | GO:0005080 | protein kinase C binding(GO:0005080) |
| 0.1 | 3.0 | GO:0008198 | ferrous iron binding(GO:0008198) |
| 0.1 | 0.4 | GO:0050827 | toxin receptor binding(GO:0050827) |
| 0.1 | 1.9 | GO:0004029 | aldehyde dehydrogenase (NAD) activity(GO:0004029) |
| 0.1 | 3.8 | GO:0005086 | ARF guanyl-nucleotide exchange factor activity(GO:0005086) |
| 0.1 | 2.0 | GO:0008349 | MAP kinase kinase kinase kinase activity(GO:0008349) |
| 0.1 | 2.5 | GO:0034930 | N-acetylglucosamine 6-O-sulfotransferase activity(GO:0001517) heparan sulfate 2-O-sulfotransferase activity(GO:0004394) HNK-1 sulfotransferase activity(GO:0016232) heparan sulfate 6-O-sulfotransferase activity(GO:0017095) trans-9R,10R-dihydrodiolphenanthrene sulfotransferase activity(GO:0018721) 1-phenanthrol sulfotransferase activity(GO:0018722) 3-phenanthrol sulfotransferase activity(GO:0018723) 4-phenanthrol sulfotransferase activity(GO:0018724) trans-3,4-dihydrodiolphenanthrene sulfotransferase activity(GO:0018725) 9-phenanthrol sulfotransferase activity(GO:0018726) 2-phenanthrol sulfotransferase activity(GO:0018727) phenanthrol sulfotransferase activity(GO:0019111) 1-hydroxypyrene sulfotransferase activity(GO:0034930) proteoglycan sulfotransferase activity(GO:0050698) cholesterol sulfotransferase activity(GO:0051922) hydroxyjasmonate sulfotransferase activity(GO:0080131) |
| 0.1 | 2.9 | GO:0004407 | histone deacetylase activity(GO:0004407) |
| 0.1 | 1.1 | GO:0102391 | decanoate--CoA ligase activity(GO:0102391) |
| 0.1 | 0.6 | GO:0005212 | structural constituent of eye lens(GO:0005212) |
| 0.1 | 10.5 | GO:0015293 | symporter activity(GO:0015293) |
| 0.1 | 0.6 | GO:0016863 | intramolecular oxidoreductase activity, transposing C=C bonds(GO:0016863) |
| 0.1 | 0.6 | GO:0003836 | beta-galactoside (CMP) alpha-2,3-sialyltransferase activity(GO:0003836) |
| 0.1 | 4.4 | GO:0003777 | microtubule motor activity(GO:0003777) |
| 0.1 | 3.3 | GO:0030170 | pyridoxal phosphate binding(GO:0030170) |
| 0.1 | 8.7 | GO:0017124 | SH3 domain binding(GO:0017124) |
| 0.1 | 11.6 | GO:0030246 | carbohydrate binding(GO:0030246) |
| 0.1 | 2.7 | GO:0004896 | cytokine receptor activity(GO:0004896) |
| 0.1 | 0.2 | GO:0032896 | palmitoyl-CoA 9-desaturase activity(GO:0032896) |
| 0.1 | 0.3 | GO:0015165 | pyrimidine nucleotide-sugar transmembrane transporter activity(GO:0015165) |
| 0.1 | 0.6 | GO:0010521 | telomerase inhibitor activity(GO:0010521) |
| 0.1 | 1.2 | GO:0005112 | Notch binding(GO:0005112) |
| 0.0 | 0.5 | GO:0102338 | fatty acid elongase activity(GO:0009922) 3-oxo-arachidoyl-CoA synthase activity(GO:0102336) 3-oxo-cerotoyl-CoA synthase activity(GO:0102337) 3-oxo-lignoceronyl-CoA synthase activity(GO:0102338) |
| 0.0 | 0.3 | GO:0034943 | acyl-CoA ligase activity(GO:0003996) 3-oxo-2-(2'-pentenyl)cyclopentane-1-octanoic acid CoA ligase activity(GO:0010435) 3-isopropenyl-6-oxoheptanoyl-CoA synthetase activity(GO:0018854) 2-oxo-delta3-4,5,5-trimethylcyclopentenylacetyl-CoA synthetase activity(GO:0018855) benzoyl acetate-CoA ligase activity(GO:0018856) 2,4-dichlorobenzoate-CoA ligase activity(GO:0018857) pivalate-CoA ligase activity(GO:0034783) cyclopropanecarboxylate-CoA ligase activity(GO:0034793) adipate-CoA ligase activity(GO:0034796) citronellyl-CoA ligase activity(GO:0034823) mentha-1,3-dione-CoA ligase activity(GO:0034841) thiophene-2-carboxylate-CoA ligase activity(GO:0034842) 2,4,4-trimethylpentanoate-CoA ligase activity(GO:0034865) cis-2-methyl-5-isopropylhexa-2,5-dienoate-CoA ligase activity(GO:0034942) trans-2-methyl-5-isopropylhexa-2,5-dienoate-CoA ligase activity(GO:0034943) branched-chain acyl-CoA synthetase (ADP-forming) activity(GO:0043759) aryl-CoA synthetase (ADP-forming) activity(GO:0043762) 3-hydroxypropionyl-CoA synthetase activity(GO:0043955) perillic acid:CoA ligase (ADP-forming) activity(GO:0052685) perillic acid:CoA ligase (AMP-forming) activity(GO:0052686) (3R)-3-isopropenyl-6-oxoheptanoate:CoA ligase (ADP-forming) activity(GO:0052687) (3R)-3-isopropenyl-6-oxoheptanoate:CoA ligase (AMP-forming) activity(GO:0052688) pristanate-CoA ligase activity(GO:0070251) malonyl-CoA synthetase activity(GO:0090409) |
| 0.0 | 1.7 | GO:0031593 | polyubiquitin binding(GO:0031593) |
| 0.0 | 0.7 | GO:0016746 | transferase activity, transferring acyl groups(GO:0016746) |
| 0.0 | 2.1 | GO:0016706 | oxidoreductase activity, acting on paired donors, with incorporation or reduction of molecular oxygen, 2-oxoglutarate as one donor, and incorporation of one atom each of oxygen into both donors(GO:0016706) |
| 0.0 | 1.4 | GO:0017112 | Rab guanyl-nucleotide exchange factor activity(GO:0017112) |
| 0.0 | 2.0 | GO:0035064 | methylated histone binding(GO:0035064) |
| 0.0 | 9.0 | GO:0061630 | ubiquitin protein ligase activity(GO:0061630) |
| 0.0 | 1.8 | GO:0020037 | heme binding(GO:0020037) |
| 0.0 | 4.7 | GO:0047485 | protein N-terminus binding(GO:0047485) |
| 0.0 | 0.5 | GO:0035380 | C-3 sterol dehydrogenase (C-4 sterol decarboxylase) activity(GO:0000252) mevaldate reductase activity(GO:0004495) gluconate dehydrogenase activity(GO:0008875) epoxide dehydrogenase activity(GO:0018451) 5-exo-hydroxycamphor dehydrogenase activity(GO:0018452) 2-hydroxytetrahydrofuran dehydrogenase activity(GO:0018453) acetoin dehydrogenase activity(GO:0019152) phenylcoumaran benzylic ether reductase activity(GO:0032442) D-xylose:NADP reductase activity(GO:0032866) L-arabinose:NADP reductase activity(GO:0032867) D-arabinitol dehydrogenase, D-ribulose forming (NADP+) activity(GO:0033709) (R)-(-)-1,2,3,4-tetrahydronaphthol dehydrogenase activity(GO:0034831) 3-hydroxymenthone dehydrogenase activity(GO:0034840) very long-chain-3-hydroxyacyl-CoA dehydrogenase activity(GO:0035380) dihydrotestosterone 17-beta-dehydrogenase activity(GO:0035410) (R)-2-hydroxyisocaproate dehydrogenase activity(GO:0043713) L-arabinose 1-dehydrogenase (NADP+) activity(GO:0044103) L-xylulose reductase (NAD+) activity(GO:0044105) 3-ketoglucose-reductase activity(GO:0048258) D-arabinitol dehydrogenase, D-xylulose forming (NADP+) activity(GO:0052677) |
| 0.0 | 0.2 | GO:0004579 | dolichyl-diphosphooligosaccharide-protein glycotransferase activity(GO:0004579) |
| 0.0 | 0.8 | GO:0030295 | protein kinase activator activity(GO:0030295) |
| 0.0 | 0.4 | GO:0042800 | histone methyltransferase activity (H3-K4 specific)(GO:0042800) |
| 0.0 | 0.9 | GO:0044824 | integrase activity(GO:0008907) T/G mismatch-specific endonuclease activity(GO:0043765) retroviral integrase activity(GO:0044823) retroviral 3' processing activity(GO:0044824) |
| 0.0 | 1.0 | GO:0019003 | GDP binding(GO:0019003) |
| 0.0 | 0.1 | GO:0008427 | calcium-dependent protein kinase inhibitor activity(GO:0008427) calcium-dependent protein kinase regulator activity(GO:0010858) |
| 0.0 | 0.3 | GO:0004497 | monooxygenase activity(GO:0004497) |
|
|
|
|