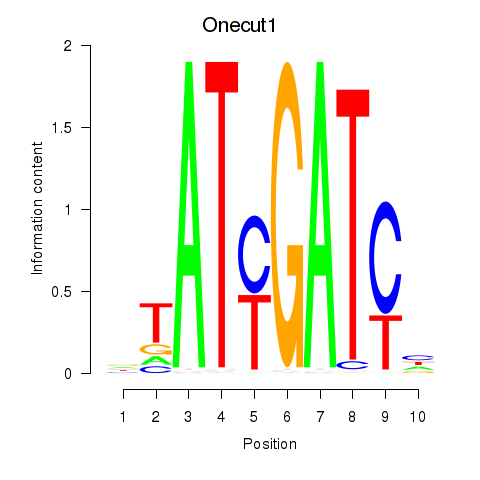
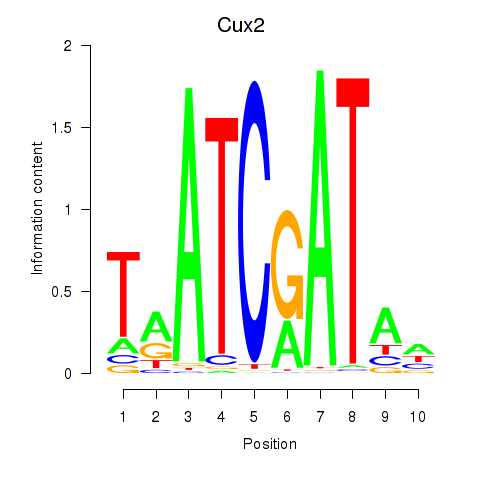
Motif ID: Onecut1_Cux2
Z-value: 1.197


Transcription factors associated with Onecut1_Cux2:
| Gene Symbol | Entrez ID | Gene Name |
|---|---|---|
| Cux2 | ENSMUSG00000042589.12 | Cux2 |
| Cux2 | ENSMUSG00000072641.1 | Cux2 |
| Onecut1 | ENSMUSG00000043013.9 | Onecut1 |
Activity-expression correlation:
| Gene Symbol | Promoter | Pearson corr. coef. | P-value | Plot |
|---|---|---|---|---|
| Onecut1 | mm10_v2_chr9_+_74861888_74861921 | 0.56 | 4.2e-06 | Click! |
| Cux2 | mm10_v2_chr5_-_122049822_122049882 | -0.14 | 3.1e-01 | Click! |
Top targets:
Gene overrepresentation in biological_process category:
| Log-likelihood per target | Total log-likelihood | Term | Description |
|---|---|---|---|
| 5.1 | 30.8 | GO:0021797 | forebrain anterior/posterior pattern specification(GO:0021797) |
| 4.3 | 13.0 | GO:0045110 | intermediate filament bundle assembly(GO:0045110) |
| 2.5 | 7.4 | GO:0045014 | detection of carbohydrate stimulus(GO:0009730) detection of hexose stimulus(GO:0009732) detection of monosaccharide stimulus(GO:0034287) carbon catabolite repression of transcription(GO:0045013) negative regulation of transcription by glucose(GO:0045014) detection of glucose(GO:0051594) |
| 2.1 | 6.4 | GO:0001869 | regulation of complement activation, lectin pathway(GO:0001868) negative regulation of complement activation, lectin pathway(GO:0001869) |
| 1.0 | 3.1 | GO:0031117 | positive regulation of microtubule depolymerization(GO:0031117) |
| 1.0 | 2.9 | GO:1900365 | positive regulation of mRNA polyadenylation(GO:1900365) |
| 0.9 | 4.7 | GO:0021965 | spinal cord ventral commissure morphogenesis(GO:0021965) |
| 0.8 | 22.9 | GO:0007617 | mating behavior(GO:0007617) multi-organism reproductive behavior(GO:0044705) |
| 0.6 | 3.8 | GO:0003383 | apical constriction(GO:0003383) |
| 0.6 | 4.0 | GO:0021555 | midbrain-hindbrain boundary morphogenesis(GO:0021555) |
| 0.5 | 4.0 | GO:0048625 | myoblast fate commitment(GO:0048625) |
| 0.5 | 8.4 | GO:0001833 | inner cell mass cell proliferation(GO:0001833) |
| 0.4 | 1.1 | GO:0006657 | CDP-choline pathway(GO:0006657) |
| 0.3 | 3.6 | GO:1901621 | negative regulation of smoothened signaling pathway involved in dorsal/ventral neural tube patterning(GO:1901621) |
| 0.3 | 2.4 | GO:0033353 | S-adenosylmethionine cycle(GO:0033353) |
| 0.3 | 1.7 | GO:0051639 | actin filament network formation(GO:0051639) |
| 0.3 | 2.9 | GO:2001256 | regulation of store-operated calcium entry(GO:2001256) |
| 0.3 | 23.8 | GO:0030032 | lamellipodium assembly(GO:0030032) |
| 0.3 | 1.8 | GO:0045650 | negative regulation of macrophage differentiation(GO:0045650) negative regulation of DNA damage checkpoint(GO:2000002) |
| 0.3 | 1.0 | GO:0031581 | hemidesmosome assembly(GO:0031581) |
| 0.2 | 1.6 | GO:0051461 | protein import into peroxisome matrix, docking(GO:0016560) regulation of corticotropin secretion(GO:0051459) positive regulation of corticotropin secretion(GO:0051461) |
| 0.2 | 2.9 | GO:0021869 | forebrain ventricular zone progenitor cell division(GO:0021869) |
| 0.2 | 3.0 | GO:0031507 | heterochromatin assembly(GO:0031507) |
| 0.2 | 0.8 | GO:0007262 | STAT protein import into nucleus(GO:0007262) |
| 0.2 | 1.4 | GO:0072539 | T-helper 17 cell differentiation(GO:0072539) |
| 0.2 | 13.5 | GO:0030512 | negative regulation of transforming growth factor beta receptor signaling pathway(GO:0030512) negative regulation of cellular response to transforming growth factor beta stimulus(GO:1903845) |
| 0.2 | 1.4 | GO:0035095 | behavioral response to nicotine(GO:0035095) |
| 0.2 | 0.9 | GO:0007258 | JUN phosphorylation(GO:0007258) |
| 0.1 | 0.9 | GO:0002051 | osteoblast fate commitment(GO:0002051) |
| 0.1 | 2.9 | GO:0045662 | negative regulation of myoblast differentiation(GO:0045662) |
| 0.1 | 0.9 | GO:0070544 | histone H3-K36 demethylation(GO:0070544) |
| 0.1 | 2.4 | GO:0006359 | regulation of transcription from RNA polymerase III promoter(GO:0006359) |
| 0.1 | 2.8 | GO:0000154 | rRNA modification(GO:0000154) |
| 0.1 | 0.5 | GO:1903847 | regulation of aorta morphogenesis(GO:1903847) positive regulation of aorta morphogenesis(GO:1903849) |
| 0.1 | 2.2 | GO:0071625 | vocalization behavior(GO:0071625) |
| 0.1 | 0.7 | GO:0033572 | transferrin transport(GO:0033572) |
| 0.1 | 0.4 | GO:1990118 | sodium ion import across plasma membrane(GO:0098719) sodium ion import into cell(GO:1990118) |
| 0.0 | 5.0 | GO:0007498 | mesoderm development(GO:0007498) |
| 0.0 | 0.9 | GO:0007614 | short-term memory(GO:0007614) |
| 0.0 | 1.9 | GO:0002066 | columnar/cuboidal epithelial cell development(GO:0002066) |
| 0.0 | 0.7 | GO:0032008 | positive regulation of TOR signaling(GO:0032008) |
| 0.0 | 1.0 | GO:0010507 | negative regulation of autophagy(GO:0010507) |
| 0.0 | 0.1 | GO:0097421 | liver regeneration(GO:0097421) |
| 0.0 | 2.5 | GO:0042787 | protein ubiquitination involved in ubiquitin-dependent protein catabolic process(GO:0042787) |
| 0.0 | 2.0 | GO:0030534 | adult behavior(GO:0030534) |
| 0.0 | 3.7 | GO:0006935 | chemotaxis(GO:0006935) taxis(GO:0042330) |
Gene overrepresentation in cellular_component category:
| Log-likelihood per target | Total log-likelihood | Term | Description |
|---|---|---|---|
| 4.3 | 13.0 | GO:0033596 | TSC1-TSC2 complex(GO:0033596) |
| 0.5 | 3.8 | GO:0033269 | internode region of axon(GO:0033269) |
| 0.4 | 4.0 | GO:0070369 | beta-catenin-TCF7L2 complex(GO:0070369) |
| 0.4 | 1.7 | GO:0032127 | dense core granule membrane(GO:0032127) |
| 0.4 | 4.7 | GO:0032584 | growth cone membrane(GO:0032584) |
| 0.4 | 1.6 | GO:0017071 | intracellular cyclic nucleotide activated cation channel complex(GO:0017071) |
| 0.4 | 2.8 | GO:0031428 | box C/D snoRNP complex(GO:0031428) |
| 0.3 | 0.9 | GO:0044302 | dentate gyrus mossy fiber(GO:0044302) |
| 0.3 | 3.0 | GO:0005677 | chromatin silencing complex(GO:0005677) |
| 0.2 | 25.4 | GO:0001725 | stress fiber(GO:0001725) contractile actin filament bundle(GO:0097517) |
| 0.2 | 1.8 | GO:0000347 | THO complex(GO:0000347) THO complex part of transcription export complex(GO:0000445) |
| 0.2 | 1.5 | GO:0000127 | transcription factor TFIIIC complex(GO:0000127) |
| 0.2 | 2.9 | GO:0043034 | costamere(GO:0043034) |
| 0.2 | 2.9 | GO:1990124 | messenger ribonucleoprotein complex(GO:1990124) |
| 0.1 | 1.3 | GO:0045298 | tubulin complex(GO:0045298) |
| 0.1 | 1.4 | GO:0005892 | acetylcholine-gated channel complex(GO:0005892) |
| 0.1 | 1.0 | GO:0030056 | hemidesmosome(GO:0030056) |
| 0.1 | 1.1 | GO:0042587 | glycogen granule(GO:0042587) |
| 0.1 | 6.6 | GO:0072562 | blood microparticle(GO:0072562) |
| 0.1 | 9.2 | GO:0000792 | heterochromatin(GO:0000792) |
| 0.1 | 0.4 | GO:0044308 | axonal spine(GO:0044308) |
| 0.1 | 0.7 | GO:0031931 | TORC1 complex(GO:0031931) |
| 0.1 | 0.3 | GO:1990726 | Lsm1-7-Pat1 complex(GO:1990726) |
| 0.0 | 4.4 | GO:0055037 | recycling endosome(GO:0055037) |
| 0.0 | 2.8 | GO:0030426 | growth cone(GO:0030426) |
| 0.0 | 2.9 | GO:0043679 | axon terminus(GO:0043679) |
| 0.0 | 0.9 | GO:0005637 | nuclear inner membrane(GO:0005637) |
| 0.0 | 1.9 | GO:0043296 | apical junction complex(GO:0043296) |
| 0.0 | 1.0 | GO:0031463 | Cul3-RING ubiquitin ligase complex(GO:0031463) |
| 0.0 | 97.2 | GO:0005634 | nucleus(GO:0005634) |
| 0.0 | 0.4 | GO:0045211 | postsynaptic membrane(GO:0045211) |
Gene overrepresentation in molecular_function category:
| Log-likelihood per target | Total log-likelihood | Term | Description |
|---|---|---|---|
| 1.0 | 7.1 | GO:0015016 | [heparan sulfate]-glucosamine N-sulfotransferase activity(GO:0015016) |
| 0.8 | 4.7 | GO:0005042 | netrin receptor activity(GO:0005042) |
| 0.5 | 13.0 | GO:0043274 | phospholipase binding(GO:0043274) |
| 0.4 | 2.9 | GO:0031802 | type 5 metabotropic glutamate receptor binding(GO:0031802) |
| 0.4 | 22.9 | GO:0001102 | RNA polymerase II activating transcription factor binding(GO:0001102) |
| 0.4 | 6.1 | GO:0001848 | complement binding(GO:0001848) |
| 0.3 | 2.4 | GO:0004013 | adenosylhomocysteinase activity(GO:0004013) trialkylsulfonium hydrolase activity(GO:0016802) |
| 0.3 | 1.4 | GO:0008142 | oxysterol binding(GO:0008142) |
| 0.3 | 1.6 | GO:0005052 | peroxisome matrix targeting signal-1 binding(GO:0005052) |
| 0.3 | 2.8 | GO:1990226 | histone methyltransferase binding(GO:1990226) |
| 0.2 | 2.9 | GO:0035925 | mRNA 3'-UTR AU-rich region binding(GO:0035925) |
| 0.2 | 0.9 | GO:0070878 | primary miRNA binding(GO:0070878) |
| 0.2 | 1.1 | GO:0004105 | choline-phosphate cytidylyltransferase activity(GO:0004105) |
| 0.2 | 6.4 | GO:0001205 | transcriptional activator activity, RNA polymerase II distal enhancer sequence-specific binding(GO:0001205) |
| 0.2 | 4.0 | GO:0045295 | gamma-catenin binding(GO:0045295) |
| 0.2 | 31.7 | GO:0001227 | transcriptional repressor activity, RNA polymerase II transcription regulatory region sequence-specific binding(GO:0001227) |
| 0.1 | 1.4 | GO:0004889 | acetylcholine-activated cation-selective channel activity(GO:0004889) |
| 0.1 | 3.8 | GO:0031435 | mitogen-activated protein kinase kinase kinase binding(GO:0031435) |
| 0.1 | 3.8 | GO:0032266 | phosphatidylinositol-3-phosphate binding(GO:0032266) |
| 0.1 | 3.7 | GO:0098811 | transcriptional activator activity, RNA polymerase II transcription factor binding(GO:0001190) transcriptional repressor activity, RNA polymerase II activating transcription factor binding(GO:0098811) |
| 0.1 | 24.9 | GO:0003779 | actin binding(GO:0003779) |
| 0.1 | 0.9 | GO:0051864 | histone demethylase activity (H3-K36 specific)(GO:0051864) |
| 0.1 | 1.5 | GO:0050694 | galactose 3-O-sulfotransferase activity(GO:0050694) |
| 0.0 | 1.7 | GO:0034945 | dihydrolipoamide branched chain acyltransferase activity(GO:0004147) palmitoleoyl [acyl-carrier-protein]-dependent acyltransferase activity(GO:0008951) serine O-acyltransferase activity(GO:0016412) O-succinyltransferase activity(GO:0016750) sinapoyltransferase activity(GO:0016752) O-sinapoyltransferase activity(GO:0016753) peptidyl-lysine N6-myristoyltransferase activity(GO:0018030) peptidyl-lysine N6-palmitoyltransferase activity(GO:0018031) benzoyl acetate-CoA thiolase activity(GO:0018711) 3-hydroxybutyryl-CoA thiolase activity(GO:0018712) 3-ketopimelyl-CoA thiolase activity(GO:0018713) N-palmitoyltransferase activity(GO:0019105) acyl-CoA N-acyltransferase activity(GO:0019186) protein-cysteine S-myristoyltransferase activity(GO:0019705) glucosaminyl-phosphotidylinositol O-acyltransferase activity(GO:0032216) ergosterol O-acyltransferase activity(GO:0034737) lanosterol O-acyltransferase activity(GO:0034738) naphthyl-2-oxomethyl-succinyl-CoA succinyl transferase activity(GO:0034848) 2,4,4-trimethyl-3-oxopentanoyl-CoA 2-C-propanoyl transferase activity(GO:0034851) 2-methylhexanoyl-CoA C-acetyltransferase activity(GO:0034915) butyryl-CoA 2-C-propionyltransferase activity(GO:0034919) 2,6-dimethyl-5-methylene-3-oxo-heptanoyl-CoA C-acetyltransferase activity(GO:0034945) L-2-aminoadipate N-acetyltransferase activity(GO:0043741) keto acid formate lyase activity(GO:0043806) azetidine-2-carboxylic acid acetyltransferase activity(GO:0046941) peptidyl-lysine N-acetyltransferase activity, acting on acetyl phosphate as donor(GO:0052858) acetyl-CoA:L-lysine N6-acetyltransferase(GO:0090595) |
| 0.0 | 0.4 | GO:0005451 | monovalent cation:proton antiporter activity(GO:0005451) sodium:proton antiporter activity(GO:0015385) potassium:proton antiporter activity(GO:0015386) |
| 0.0 | 4.6 | GO:0005125 | cytokine activity(GO:0005125) |
| 0.0 | 3.1 | GO:0048306 | calcium-dependent protein binding(GO:0048306) |
| 0.0 | 6.8 | GO:0003714 | transcription corepressor activity(GO:0003714) |
| 0.0 | 0.8 | GO:0042813 | Wnt-activated receptor activity(GO:0042813) |
| 0.0 | 0.8 | GO:0070491 | repressing transcription factor binding(GO:0070491) |
| 0.0 | 26.5 | GO:0043565 | sequence-specific DNA binding(GO:0043565) |
| 0.0 | 1.9 | GO:0035496 | UDP-glucose:glycoprotein glucosyltransferase activity(GO:0003980) O antigen polymerase activity(GO:0008755) lipopolysaccharide-1,6-galactosyltransferase activity(GO:0008921) cellulose synthase activity(GO:0016759) 9-phenanthrol UDP-glucuronosyltransferase activity(GO:0018715) 1-phenanthrol glycosyltransferase activity(GO:0018716) 9-phenanthrol glycosyltransferase activity(GO:0018717) 1,2-dihydroxy-phenanthrene glycosyltransferase activity(GO:0018718) phenanthrol glycosyltransferase activity(GO:0019112) alpha-1,2-galactosyltransferase activity(GO:0031278) dolichyl pyrophosphate Man7GlcNAc2 alpha-1,3-glucosyltransferase activity(GO:0033556) endogalactosaminidase activity(GO:0033931) lipopolysaccharide-1,5-galactosyltransferase activity(GO:0035496) dolichyl pyrophosphate Glc1Man9GlcNAc2 alpha-1,3-glucosyltransferase activity(GO:0042283) inositol phosphoceramide synthase activity(GO:0045140) alpha-(1->3)-fucosyltransferase activity(GO:0046920) indole-3-butyrate beta-glucosyltransferase activity(GO:0052638) salicylic acid glucosyltransferase (ester-forming) activity(GO:0052639) salicylic acid glucosyltransferase (glucoside-forming) activity(GO:0052640) benzoic acid glucosyltransferase activity(GO:0052641) chondroitin hydrolase activity(GO:0052757) dolichyl-pyrophosphate Man7GlcNAc2 alpha-1,6-mannosyltransferase activity(GO:0052824) cytokinin 9-beta-glucosyltransferase activity(GO:0080062) |
| 0.0 | 2.7 | GO:0004222 | metalloendopeptidase activity(GO:0004222) |
| 0.0 | 1.3 | GO:0005200 | structural constituent of cytoskeleton(GO:0005200) |
| 0.0 | 0.7 | GO:0004864 | protein phosphatase inhibitor activity(GO:0004864) |
| 0.0 | 1.5 | GO:0043774 | UDP-N-acetylmuramoylalanyl-D-glutamyl-2,6-diaminopimelate-D-alanyl-D-alanine ligase activity(GO:0008766) ribosomal S6-glutamic acid ligase activity(GO:0018169) coenzyme F420-0 gamma-glutamyl ligase activity(GO:0043773) coenzyme F420-2 alpha-glutamyl ligase activity(GO:0043774) protein-glycine ligase activity(GO:0070735) protein-glycine ligase activity, initiating(GO:0070736) protein-glycine ligase activity, elongating(GO:0070737) tubulin-glycine ligase activity(GO:0070738) |
| 0.0 | 19.5 | GO:0008270 | zinc ion binding(GO:0008270) |


