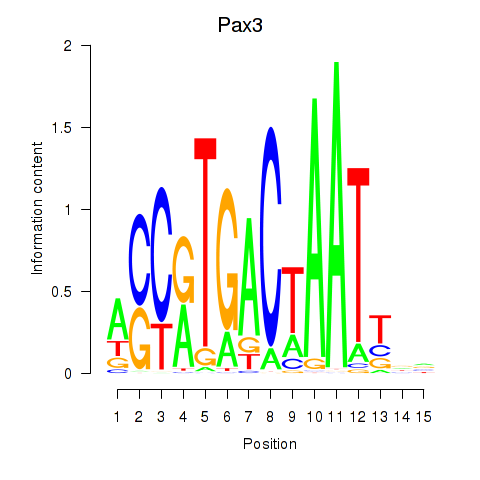
Motif ID: Pax3
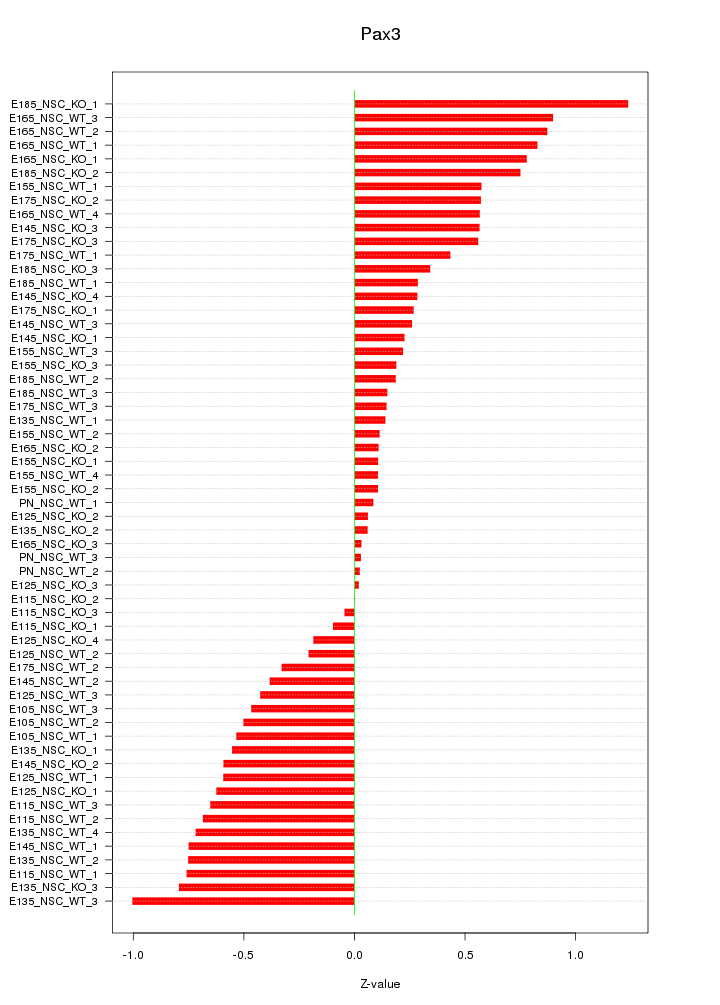
Z-value: 0.503
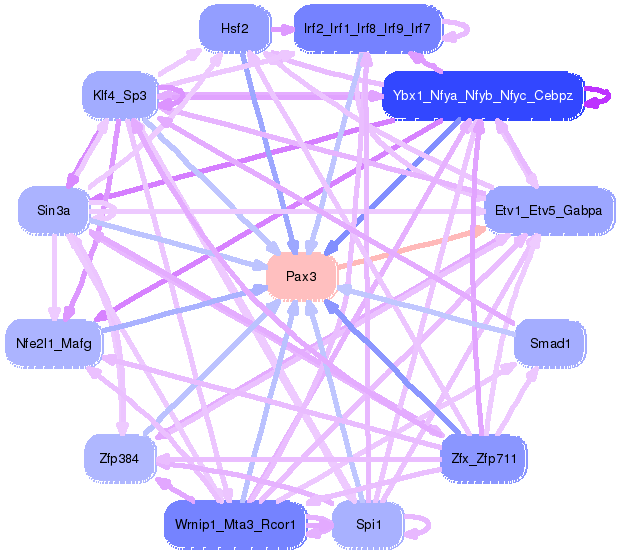
Transcription factors associated with Pax3:
| Gene Symbol | Entrez ID | Gene Name |
|---|---|---|
| Pax3 | ENSMUSG00000004872.9 | Pax3 |
Activity-expression correlation:
| Gene Symbol | Promoter | Pearson corr. coef. | P-value | Plot |
|---|---|---|---|---|
| Pax3 | mm10_v2_chr1_-_78197112_78197134 | -0.29 | 2.4e-02 | Click! |


Top targets:
Gene overrepresentation in biological_process category:
| Log-likelihood per target | Total log-likelihood | Term | Description |
|---|---|---|---|
| 0.6 | 2.8 | GO:1900095 | regulation of dosage compensation by inactivation of X chromosome(GO:1900095) |
| 0.5 | 1.9 | GO:0018307 | enzyme active site formation(GO:0018307) |
| 0.4 | 1.4 | GO:0032512 | regulation of protein phosphatase type 2B activity(GO:0032512) positive regulation of ryanodine-sensitive calcium-release channel activity(GO:0060316) |
| 0.2 | 0.5 | GO:1904139 | microglial cell migration(GO:1904124) regulation of microglial cell migration(GO:1904139) |
| 0.2 | 0.7 | GO:0070779 | D-aspartate transport(GO:0070777) D-aspartate import(GO:0070779) |
| 0.1 | 0.8 | GO:0032229 | positive regulation of gamma-aminobutyric acid secretion(GO:0014054) negative regulation of synaptic transmission, GABAergic(GO:0032229) |
| 0.1 | 3.9 | GO:0007638 | mechanosensory behavior(GO:0007638) |
| 0.1 | 0.6 | GO:0071638 | positive regulation of T-helper 1 cell differentiation(GO:0045627) negative regulation of monocyte chemotactic protein-1 production(GO:0071638) |
| 0.1 | 1.8 | GO:0006829 | zinc II ion transport(GO:0006829) |
| 0.0 | 0.4 | GO:0051534 | negative regulation of NFAT protein import into nucleus(GO:0051534) |
| 0.0 | 1.7 | GO:0034605 | cellular response to heat(GO:0034605) |
| 0.0 | 1.3 | GO:0061003 | positive regulation of dendritic spine morphogenesis(GO:0061003) |
| 0.0 | 1.4 | GO:0005978 | glycogen biosynthetic process(GO:0005978) glucan biosynthetic process(GO:0009250) |
| 0.0 | 2.7 | GO:2001237 | negative regulation of extrinsic apoptotic signaling pathway(GO:2001237) |
| 0.0 | 1.0 | GO:0003170 | heart valve development(GO:0003170) |
| 0.0 | 0.5 | GO:0007413 | axonal fasciculation(GO:0007413) |
Gene overrepresentation in cellular_component category:
| Log-likelihood per target | Total log-likelihood | Term | Description |
|---|---|---|---|
| 0.2 | 1.4 | GO:0042587 | glycogen granule(GO:0042587) |
| 0.1 | 0.8 | GO:0032983 | kainate selective glutamate receptor complex(GO:0032983) |
| 0.1 | 1.4 | GO:0005640 | nuclear outer membrane(GO:0005640) |
| 0.0 | 1.1 | GO:0034451 | centriolar satellite(GO:0034451) |
| 0.0 | 0.4 | GO:0030061 | mitochondrial crista(GO:0030061) |
| 0.0 | 0.7 | GO:0030673 | axolemma(GO:0030673) |
| 0.0 | 1.4 | GO:0016363 | nuclear matrix(GO:0016363) |
| 0.0 | 2.0 | GO:0030139 | endocytic vesicle(GO:0030139) |
| 0.0 | 0.5 | GO:0032809 | neuronal cell body membrane(GO:0032809) |
Gene overrepresentation in molecular_function category:
| Log-likelihood per target | Total log-likelihood | Term | Description |
|---|---|---|---|
| 0.4 | 1.3 | GO:0004686 | elongation factor-2 kinase activity(GO:0004686) |
| 0.4 | 1.9 | GO:0004792 | thiosulfate sulfurtransferase activity(GO:0004792) |
| 0.2 | 0.7 | GO:0015501 | glutamate:sodium symporter activity(GO:0015501) |
| 0.2 | 1.4 | GO:0043495 | protein anchor(GO:0043495) |
| 0.1 | 0.8 | GO:0015277 | kainate selective glutamate receptor activity(GO:0015277) |
| 0.1 | 0.5 | GO:0045028 | G-protein coupled nucleotide receptor activity(GO:0001608) G-protein coupled adenosine receptor activity(GO:0001609) G-protein coupled purinergic nucleotide receptor activity(GO:0045028) |
| 0.1 | 1.8 | GO:0005385 | zinc ion transmembrane transporter activity(GO:0005385) |
| 0.0 | 0.4 | GO:0030346 | protein phosphatase 2B binding(GO:0030346) |
| 0.0 | 2.7 | GO:0004702 | receptor signaling protein serine/threonine kinase activity(GO:0004702) |
| 0.0 | 1.4 | GO:0019888 | protein phosphatase regulator activity(GO:0019888) |
| 0.0 | 0.6 | GO:0005154 | epidermal growth factor receptor binding(GO:0005154) |
| 0.0 | 2.0 | GO:0017124 | SH3 domain binding(GO:0017124) |
| 0.0 | 3.9 | GO:0001077 | transcriptional activator activity, RNA polymerase II core promoter proximal region sequence-specific binding(GO:0001077) |