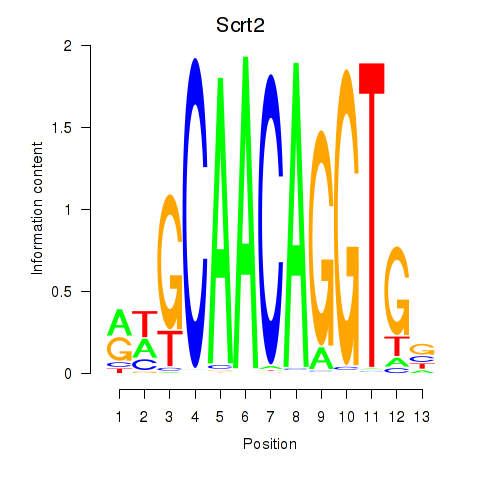
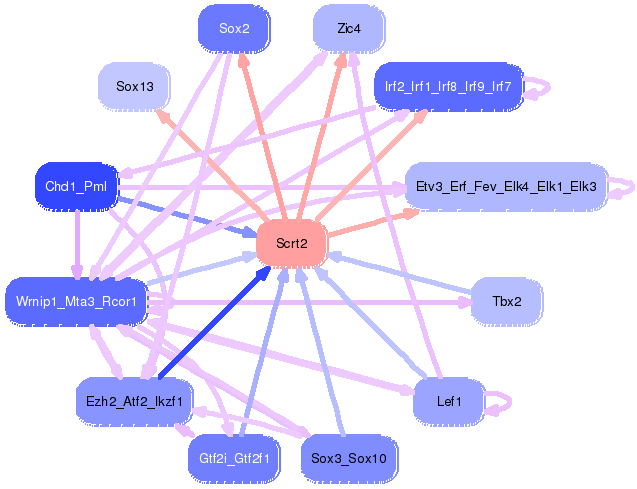
Motif ID: Scrt2
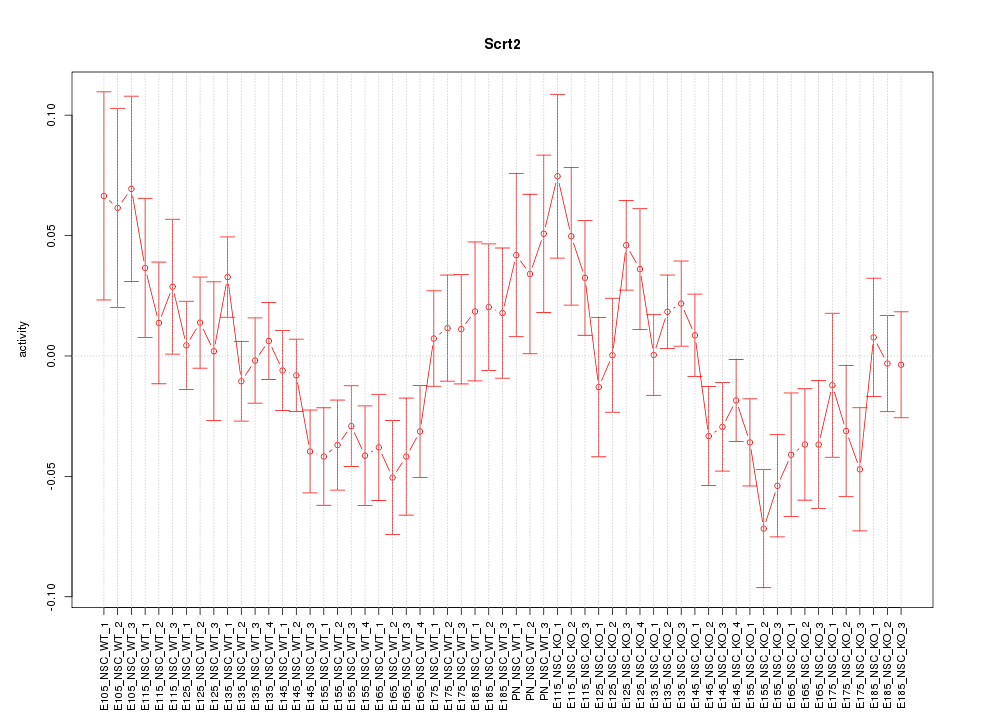
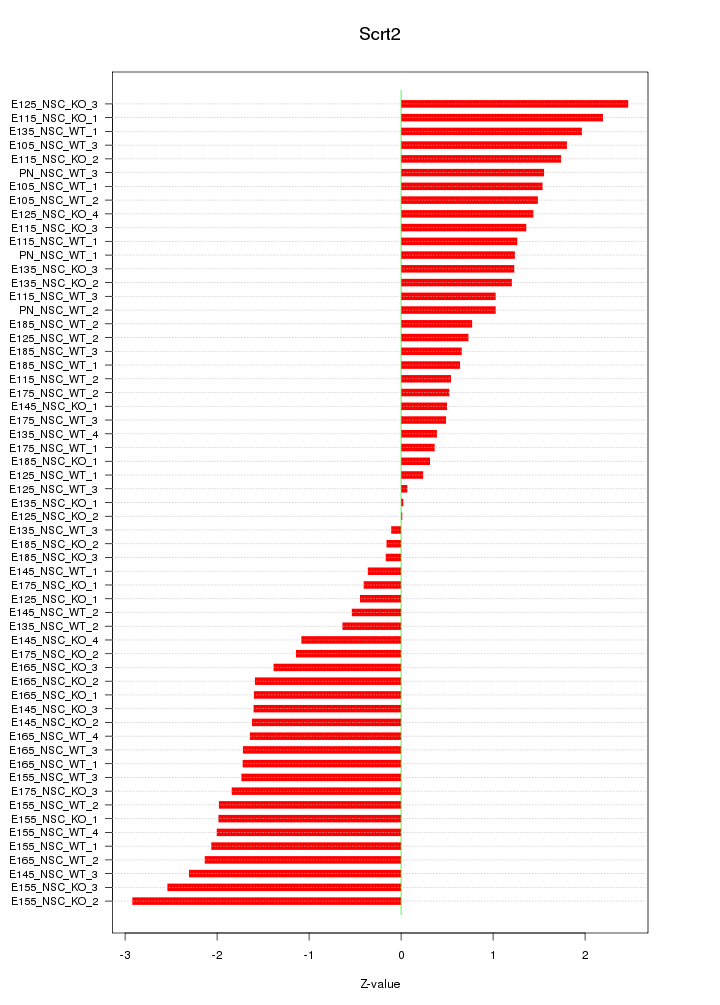
Z-value: 1.400
Transcription factors associated with Scrt2:
| Gene Symbol | Entrez ID | Gene Name |
|---|---|---|
| Scrt2 | ENSMUSG00000060257.2 | Scrt2 |
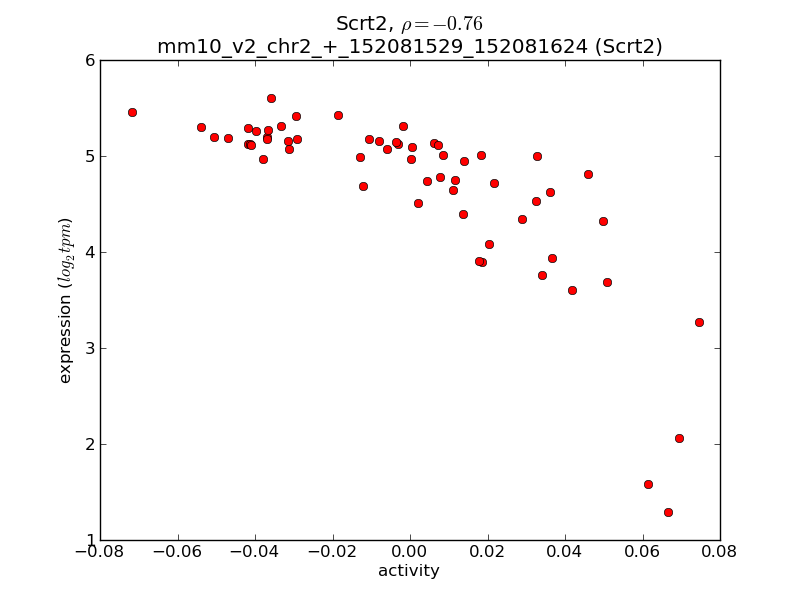
Activity-expression correlation:
| Gene Symbol | Promoter | Pearson corr. coef. | P-value | Plot |
|---|---|---|---|---|
| Scrt2 | mm10_v2_chr2_+_152081529_152081624 | -0.76 | 1.8e-12 | Click! |

Top targets:
Gene overrepresentation in biological_process category:
| Log-likelihood per target | Total log-likelihood | Term | Description |
|---|---|---|---|
| 10.9 | 32.8 | GO:1904274 | tricellular tight junction assembly(GO:1904274) |
| 6.0 | 18.0 | GO:0003104 | positive regulation of glomerular filtration(GO:0003104) cell communication by chemical coupling(GO:0010643) |
| 4.6 | 13.7 | GO:0086069 | desmosome assembly(GO:0002159) adherens junction maintenance(GO:0034334) intermediate filament bundle assembly(GO:0045110) maintenance of organ identity(GO:0048496) bundle of His cell to Purkinje myocyte communication(GO:0086069) |
| 2.2 | 6.6 | GO:2000564 | regulation of MyD88-dependent toll-like receptor signaling pathway(GO:0034124) CD8-positive, alpha-beta T cell proliferation(GO:0035740) negative regulation of regulatory T cell differentiation(GO:0045590) regulation of CD8-positive, alpha-beta T cell proliferation(GO:2000564) |
| 2.2 | 6.5 | GO:0044339 | canonical Wnt signaling pathway involved in osteoblast differentiation(GO:0044339) |
| 2.1 | 8.5 | GO:0032901 | positive regulation of neurotrophin production(GO:0032901) |
| 1.9 | 9.6 | GO:1903553 | positive regulation of extracellular exosome assembly(GO:1903553) |
| 1.8 | 5.5 | GO:0035696 | monocyte extravasation(GO:0035696) regulation of monocyte extravasation(GO:2000437) |
| 1.7 | 8.5 | GO:0010668 | ectodermal cell differentiation(GO:0010668) |
| 1.7 | 11.7 | GO:0071699 | olfactory placode formation(GO:0030910) olfactory placode development(GO:0071698) olfactory placode morphogenesis(GO:0071699) |
| 1.6 | 9.6 | GO:0060385 | axonogenesis involved in innervation(GO:0060385) |
| 1.3 | 9.1 | GO:0051461 | protein import into peroxisome matrix, docking(GO:0016560) regulation of corticotropin secretion(GO:0051459) positive regulation of corticotropin secretion(GO:0051461) |
| 1.2 | 2.5 | GO:0008065 | establishment of blood-nerve barrier(GO:0008065) |
| 1.1 | 5.5 | GO:0071985 | multivesicular body sorting pathway(GO:0071985) |
| 1.0 | 4.9 | GO:0015819 | lysine transport(GO:0015819) |
| 0.9 | 4.4 | GO:2000623 | regulation of nuclear-transcribed mRNA catabolic process, nonsense-mediated decay(GO:2000622) negative regulation of nuclear-transcribed mRNA catabolic process, nonsense-mediated decay(GO:2000623) |
| 0.9 | 2.6 | GO:1902498 | regulation of protein autoubiquitination(GO:1902498) |
| 0.9 | 7.7 | GO:0002318 | myeloid progenitor cell differentiation(GO:0002318) |
| 0.8 | 3.2 | GO:1901252 | regulation of intracellular transport of viral material(GO:1901252) |
| 0.8 | 4.6 | GO:0042866 | pyruvate biosynthetic process(GO:0042866) |
| 0.7 | 6.7 | GO:0010587 | miRNA catabolic process(GO:0010587) |
| 0.7 | 7.6 | GO:0060272 | embryonic skeletal joint morphogenesis(GO:0060272) |
| 0.7 | 3.4 | GO:2000298 | regulation of Rho-dependent protein serine/threonine kinase activity(GO:2000298) |
| 0.5 | 8.0 | GO:0036065 | fucosylation(GO:0036065) |
| 0.5 | 6.8 | GO:0046643 | regulation of gamma-delta T cell differentiation(GO:0045586) regulation of gamma-delta T cell activation(GO:0046643) |
| 0.5 | 5.1 | GO:0090557 | establishment of endothelial intestinal barrier(GO:0090557) |
| 0.5 | 10.6 | GO:0034142 | toll-like receptor 4 signaling pathway(GO:0034142) |
| 0.5 | 4.9 | GO:0035520 | monoubiquitinated protein deubiquitination(GO:0035520) |
| 0.5 | 10.6 | GO:0051044 | positive regulation of membrane protein ectodomain proteolysis(GO:0051044) |
| 0.5 | 14.6 | GO:0048791 | calcium ion-regulated exocytosis of neurotransmitter(GO:0048791) |
| 0.4 | 1.3 | GO:0061743 | motor learning(GO:0061743) |
| 0.4 | 4.9 | GO:0006268 | DNA unwinding involved in DNA replication(GO:0006268) |
| 0.4 | 5.2 | GO:0045187 | regulation of circadian sleep/wake cycle, sleep(GO:0045187) |
| 0.4 | 1.1 | GO:0048239 | negative regulation of DNA recombination at telomere(GO:0048239) regulation of DNA recombination at telomere(GO:0072695) |
| 0.4 | 9.3 | GO:1902043 | positive regulation of extrinsic apoptotic signaling pathway via death domain receptors(GO:1902043) |
| 0.4 | 1.8 | GO:0007171 | activation of transmembrane receptor protein tyrosine kinase activity(GO:0007171) |
| 0.3 | 2.4 | GO:1990118 | sodium ion import across plasma membrane(GO:0098719) sodium ion import into cell(GO:1990118) |
| 0.3 | 2.0 | GO:0060011 | Sertoli cell proliferation(GO:0060011) |
| 0.3 | 7.1 | GO:0008105 | asymmetric protein localization(GO:0008105) |
| 0.3 | 11.5 | GO:0042168 | heme metabolic process(GO:0042168) |
| 0.3 | 8.5 | GO:0001937 | negative regulation of endothelial cell proliferation(GO:0001937) |
| 0.2 | 6.5 | GO:0007214 | gamma-aminobutyric acid signaling pathway(GO:0007214) |
| 0.2 | 2.7 | GO:0032780 | negative regulation of ATPase activity(GO:0032780) |
| 0.2 | 4.1 | GO:0046597 | negative regulation of viral entry into host cell(GO:0046597) |
| 0.2 | 8.0 | GO:0050873 | brown fat cell differentiation(GO:0050873) |
| 0.2 | 2.5 | GO:0060052 | neurofilament cytoskeleton organization(GO:0060052) |
| 0.2 | 4.9 | GO:0034198 | cellular response to amino acid starvation(GO:0034198) |
| 0.2 | 2.8 | GO:0046599 | regulation of centriole replication(GO:0046599) |
| 0.1 | 0.8 | GO:0070562 | regulation of vitamin D receptor signaling pathway(GO:0070562) |
| 0.1 | 2.4 | GO:0016188 | synaptic vesicle maturation(GO:0016188) |
| 0.1 | 5.5 | GO:0048678 | response to axon injury(GO:0048678) |
| 0.1 | 2.8 | GO:0097345 | mitochondrial outer membrane permeabilization(GO:0097345) |
| 0.1 | 0.8 | GO:0000395 | mRNA 5'-splice site recognition(GO:0000395) |
| 0.1 | 1.0 | GO:0046548 | retinal rod cell development(GO:0046548) |
| 0.1 | 4.3 | GO:0007569 | cell aging(GO:0007569) |
| 0.1 | 1.5 | GO:1902230 | negative regulation of intrinsic apoptotic signaling pathway in response to DNA damage(GO:1902230) |
| 0.1 | 2.8 | GO:0045921 | positive regulation of exocytosis(GO:0045921) |
| 0.0 | 0.9 | GO:0048488 | synaptic vesicle endocytosis(GO:0048488) |
| 0.0 | 0.8 | GO:0019430 | removal of superoxide radicals(GO:0019430) |
| 0.0 | 3.8 | GO:0048839 | inner ear development(GO:0048839) |
| 0.0 | 0.9 | GO:0043001 | Golgi to plasma membrane protein transport(GO:0043001) |
| 0.0 | 1.8 | GO:0009636 | response to toxic substance(GO:0009636) |
| 0.0 | 1.2 | GO:0007605 | sensory perception of sound(GO:0007605) |
| 0.0 | 0.1 | GO:0071763 | nuclear membrane organization(GO:0071763) |
| 0.0 | 3.6 | GO:1902593 | protein import into nucleus(GO:0006606) protein targeting to nucleus(GO:0044744) single-organism nuclear import(GO:1902593) |
| 0.0 | 2.0 | GO:0007160 | cell-matrix adhesion(GO:0007160) |
Gene overrepresentation in cellular_component category:
| Log-likelihood per target | Total log-likelihood | Term | Description |
|---|---|---|---|
| 5.5 | 32.8 | GO:0061689 | tricellular tight junction(GO:0061689) |
| 2.3 | 9.1 | GO:0017071 | intracellular cyclic nucleotide activated cation channel complex(GO:0017071) |
| 2.1 | 8.5 | GO:0031092 | platelet alpha granule membrane(GO:0031092) |
| 1.8 | 18.0 | GO:0005916 | fascia adherens(GO:0005916) |
| 1.8 | 21.4 | GO:0030057 | desmosome(GO:0030057) |
| 1.8 | 10.6 | GO:0046696 | lipopolysaccharide receptor complex(GO:0046696) |
| 1.0 | 4.9 | GO:1990131 | EGO complex(GO:0034448) Gtr1-Gtr2 GTPase complex(GO:1990131) |
| 0.9 | 3.4 | GO:0070022 | transforming growth factor beta receptor homodimeric complex(GO:0070022) |
| 0.6 | 5.1 | GO:0046581 | intercellular canaliculus(GO:0046581) |
| 0.6 | 5.0 | GO:0035749 | myelin sheath adaxonal region(GO:0035749) |
| 0.6 | 7.6 | GO:0098643 | fibrillar collagen trimer(GO:0005583) banded collagen fibril(GO:0098643) |
| 0.4 | 6.5 | GO:1902710 | GABA receptor complex(GO:1902710) GABA-A receptor complex(GO:1902711) |
| 0.3 | 12.1 | GO:0043034 | costamere(GO:0043034) |
| 0.3 | 4.9 | GO:0042555 | MCM complex(GO:0042555) |
| 0.2 | 4.4 | GO:1990124 | messenger ribonucleoprotein complex(GO:1990124) |
| 0.2 | 11.9 | GO:0030667 | secretory granule membrane(GO:0030667) |
| 0.2 | 11.6 | GO:0005581 | collagen trimer(GO:0005581) |
| 0.2 | 2.8 | GO:0031430 | M band(GO:0031430) |
| 0.1 | 0.8 | GO:0005726 | perichromatin fibrils(GO:0005726) |
| 0.1 | 6.7 | GO:0010494 | cytoplasmic stress granule(GO:0010494) |
| 0.1 | 8.5 | GO:0005776 | autophagosome(GO:0005776) |
| 0.1 | 9.4 | GO:0005604 | basement membrane(GO:0005604) |
| 0.1 | 2.8 | GO:0031307 | integral component of mitochondrial outer membrane(GO:0031307) |
| 0.1 | 1.1 | GO:0000783 | telomere cap complex(GO:0000782) nuclear telomere cap complex(GO:0000783) |
| 0.1 | 2.6 | GO:0016581 | NuRD complex(GO:0016581) CHD-type complex(GO:0090545) |
| 0.1 | 0.8 | GO:0000243 | commitment complex(GO:0000243) |
| 0.1 | 15.0 | GO:0031012 | extracellular matrix(GO:0031012) |
| 0.1 | 4.3 | GO:0000118 | histone deacetylase complex(GO:0000118) |
| 0.0 | 15.3 | GO:0098793 | presynapse(GO:0098793) |
| 0.0 | 2.1 | GO:0005913 | cell-cell adherens junction(GO:0005913) |
| 0.0 | 7.1 | GO:0005802 | trans-Golgi network(GO:0005802) |
| 0.0 | 3.2 | GO:0031225 | anchored component of membrane(GO:0031225) |
| 0.0 | 2.4 | GO:0055037 | recycling endosome(GO:0055037) |
| 0.0 | 2.8 | GO:0005814 | centriole(GO:0005814) |
| 0.0 | 5.7 | GO:0000139 | Golgi membrane(GO:0000139) |
| 0.0 | 9.0 | GO:0005925 | focal adhesion(GO:0005925) |
| 0.0 | 8.8 | GO:0005667 | transcription factor complex(GO:0005667) |
| 0.0 | 3.6 | GO:0005759 | mitochondrial matrix(GO:0005759) |
| 0.0 | 2.0 | GO:0005741 | mitochondrial outer membrane(GO:0005741) |
| 0.0 | 1.0 | GO:0071013 | catalytic step 2 spliceosome(GO:0071013) |
Gene overrepresentation in molecular_function category:
| Log-likelihood per target | Total log-likelihood | Term | Description |
|---|---|---|---|
| 3.6 | 18.0 | GO:0071253 | connexin binding(GO:0071253) |
| 2.2 | 32.8 | GO:0030228 | lipoprotein particle receptor activity(GO:0030228) |
| 1.9 | 9.6 | GO:0070053 | thrombospondin receptor activity(GO:0070053) |
| 1.8 | 9.1 | GO:0005052 | peroxisome matrix targeting signal-1 binding(GO:0005052) |
| 1.5 | 4.6 | GO:0004743 | pyruvate kinase activity(GO:0004743) |
| 1.1 | 13.7 | GO:0045294 | alpha-catenin binding(GO:0045294) |
| 1.1 | 8.5 | GO:0048403 | brain-derived neurotrophic factor binding(GO:0048403) |
| 1.0 | 18.4 | GO:0035198 | miRNA binding(GO:0035198) |
| 0.8 | 10.6 | GO:0001530 | lipopolysaccharide binding(GO:0001530) |
| 0.7 | 10.6 | GO:0019855 | calcium channel inhibitor activity(GO:0019855) |
| 0.7 | 4.9 | GO:0015189 | L-ornithine transmembrane transporter activity(GO:0000064) arginine transmembrane transporter activity(GO:0015181) L-lysine transmembrane transporter activity(GO:0015189) |
| 0.6 | 7.2 | GO:0005161 | platelet-derived growth factor receptor binding(GO:0005161) |
| 0.5 | 7.6 | GO:0048407 | platelet-derived growth factor binding(GO:0048407) |
| 0.4 | 6.5 | GO:0004890 | GABA-A receptor activity(GO:0004890) |
| 0.3 | 22.6 | GO:0030276 | clathrin binding(GO:0030276) |
| 0.3 | 2.4 | GO:0005451 | monovalent cation:proton antiporter activity(GO:0005451) sodium:proton antiporter activity(GO:0015385) potassium:proton antiporter activity(GO:0015386) |
| 0.3 | 20.5 | GO:0005518 | collagen binding(GO:0005518) |
| 0.3 | 20.8 | GO:0048306 | calcium-dependent protein binding(GO:0048306) |
| 0.3 | 0.9 | GO:0019002 | GMP binding(GO:0019002) |
| 0.2 | 3.2 | GO:0008191 | metalloendopeptidase inhibitor activity(GO:0008191) |
| 0.2 | 4.4 | GO:0008266 | poly(U) RNA binding(GO:0008266) |
| 0.2 | 9.6 | GO:0001540 | beta-amyloid binding(GO:0001540) |
| 0.2 | 5.0 | GO:0004385 | guanylate kinase activity(GO:0004385) |
| 0.2 | 3.8 | GO:0016594 | glycine binding(GO:0016594) |
| 0.2 | 0.8 | GO:0004784 | superoxide dismutase activity(GO:0004784) oxidoreductase activity, acting on superoxide radicals as acceptor(GO:0016721) |
| 0.2 | 2.5 | GO:0002162 | dystroglycan binding(GO:0002162) |
| 0.1 | 2.0 | GO:0051400 | BH domain binding(GO:0051400) |
| 0.1 | 3.3 | GO:0019706 | protein-cysteine S-palmitoyltransferase activity(GO:0019706) |
| 0.1 | 7.7 | GO:0020037 | heme binding(GO:0020037) |
| 0.1 | 1.1 | GO:0098505 | G-rich strand telomeric DNA binding(GO:0098505) |
| 0.1 | 0.8 | GO:0034056 | estrogen response element binding(GO:0034056) |
| 0.1 | 4.9 | GO:0004003 | ATP-dependent DNA helicase activity(GO:0004003) |
| 0.1 | 3.6 | GO:0008536 | Ran GTPase binding(GO:0008536) |
| 0.1 | 5.1 | GO:0035496 | UDP-glucose:glycoprotein glucosyltransferase activity(GO:0003980) O antigen polymerase activity(GO:0008755) lipopolysaccharide-1,6-galactosyltransferase activity(GO:0008921) cellulose synthase activity(GO:0016759) 9-phenanthrol UDP-glucuronosyltransferase activity(GO:0018715) 1-phenanthrol glycosyltransferase activity(GO:0018716) 9-phenanthrol glycosyltransferase activity(GO:0018717) 1,2-dihydroxy-phenanthrene glycosyltransferase activity(GO:0018718) phenanthrol glycosyltransferase activity(GO:0019112) alpha-1,2-galactosyltransferase activity(GO:0031278) dolichyl pyrophosphate Man7GlcNAc2 alpha-1,3-glucosyltransferase activity(GO:0033556) endogalactosaminidase activity(GO:0033931) lipopolysaccharide-1,5-galactosyltransferase activity(GO:0035496) dolichyl pyrophosphate Glc1Man9GlcNAc2 alpha-1,3-glucosyltransferase activity(GO:0042283) inositol phosphoceramide synthase activity(GO:0045140) alpha-(1->3)-fucosyltransferase activity(GO:0046920) indole-3-butyrate beta-glucosyltransferase activity(GO:0052638) salicylic acid glucosyltransferase (ester-forming) activity(GO:0052639) salicylic acid glucosyltransferase (glucoside-forming) activity(GO:0052640) benzoic acid glucosyltransferase activity(GO:0052641) chondroitin hydrolase activity(GO:0052757) dolichyl-pyrophosphate Man7GlcNAc2 alpha-1,6-mannosyltransferase activity(GO:0052824) cytokinin 9-beta-glucosyltransferase activity(GO:0080062) |
| 0.1 | 7.7 | GO:0005178 | integrin binding(GO:0005178) |
| 0.1 | 11.8 | GO:0001085 | RNA polymerase II transcription factor binding(GO:0001085) |
| 0.1 | 15.8 | GO:0003924 | GTPase activity(GO:0003924) |
| 0.1 | 2.8 | GO:0004177 | aminopeptidase activity(GO:0004177) |
| 0.1 | 9.6 | GO:0051015 | actin filament binding(GO:0051015) |
| 0.0 | 7.8 | GO:0005516 | calmodulin binding(GO:0005516) |
| 0.0 | 8.5 | GO:0003714 | transcription corepressor activity(GO:0003714) |
| 0.0 | 19.6 | GO:0000977 | RNA polymerase II regulatory region sequence-specific DNA binding(GO:0000977) |
| 0.0 | 1.0 | GO:0015929 | hexosaminidase activity(GO:0015929) |
| 0.0 | 0.8 | GO:0036002 | pre-mRNA binding(GO:0036002) |
| 0.0 | 2.0 | GO:0008201 | heparin binding(GO:0008201) |
| 0.0 | 1.5 | GO:0008565 | protein transporter activity(GO:0008565) |
| 0.0 | 0.8 | GO:0008146 | sulfotransferase activity(GO:0008146) |
| 0.0 | 4.1 | GO:0043774 | UDP-N-acetylmuramoylalanyl-D-glutamyl-2,6-diaminopimelate-D-alanyl-D-alanine ligase activity(GO:0008766) ribosomal S6-glutamic acid ligase activity(GO:0018169) coenzyme F420-0 gamma-glutamyl ligase activity(GO:0043773) coenzyme F420-2 alpha-glutamyl ligase activity(GO:0043774) protein-glycine ligase activity(GO:0070735) protein-glycine ligase activity, initiating(GO:0070736) protein-glycine ligase activity, elongating(GO:0070737) tubulin-glycine ligase activity(GO:0070738) |
| 0.0 | 1.2 | GO:0101005 | thiol-dependent ubiquitinyl hydrolase activity(GO:0036459) ubiquitinyl hydrolase activity(GO:0101005) |