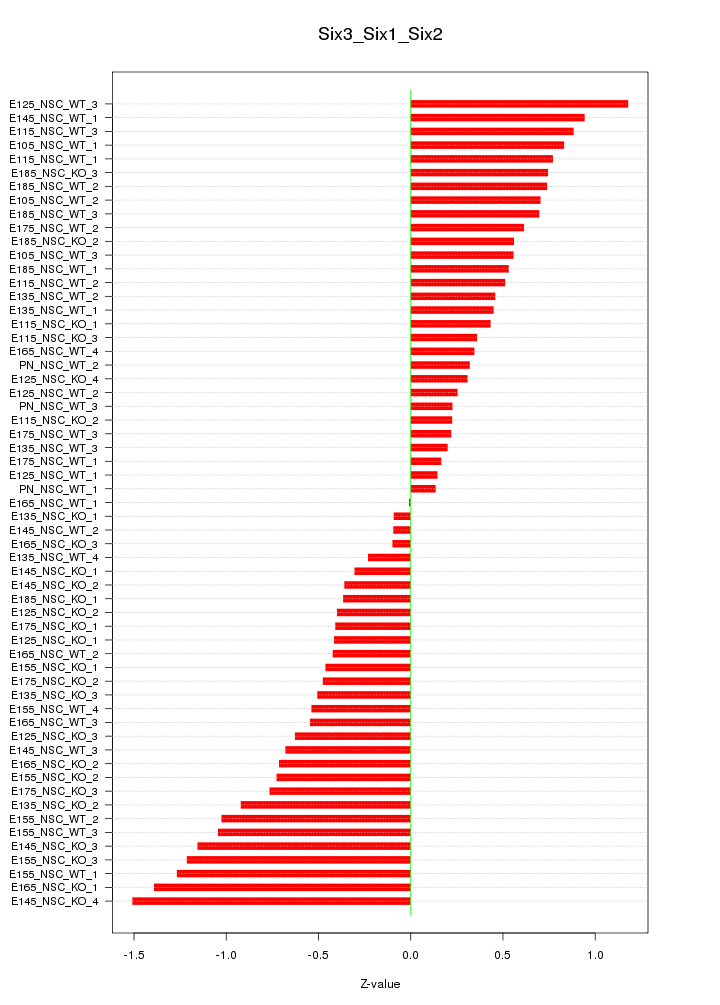
Motif ID: Six3_Six1_Six2
Z-value: 0.662
Transcription factors associated with Six3_Six1_Six2:
| Gene Symbol | Entrez ID | Gene Name |
|---|---|---|
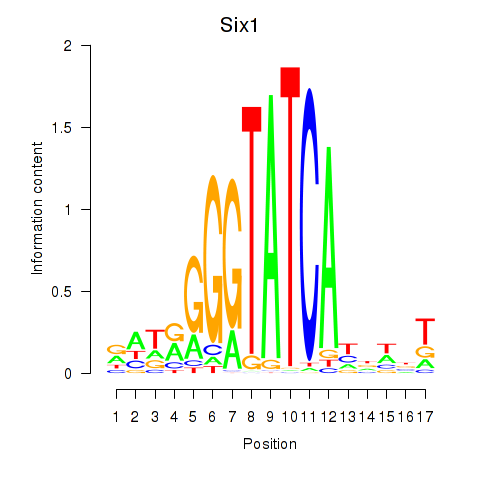
| Six1 | ENSMUSG00000051367.8 | Six1 |
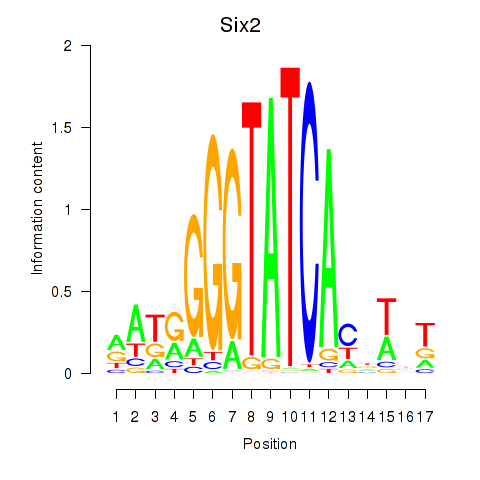
| Six2 | ENSMUSG00000024134.10 | Six2 |
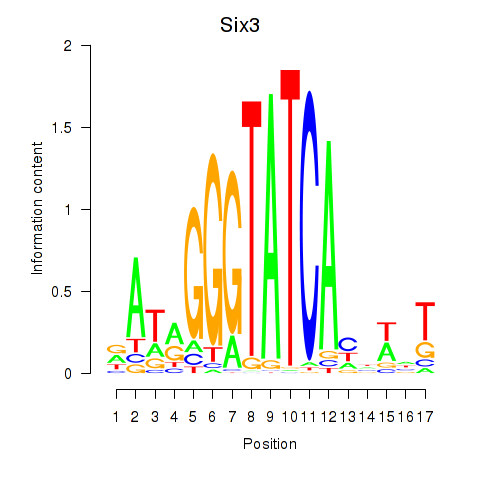
| Six3 | ENSMUSG00000038805.9 | Six3 |
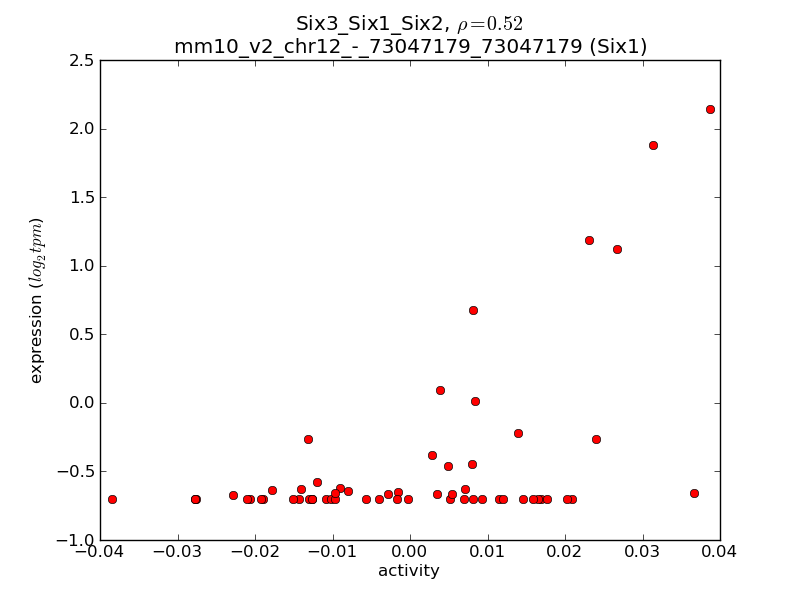
Activity-expression correlation:
| Gene Symbol | Promoter | Pearson corr. coef. | P-value | Plot |
|---|---|---|---|---|
| Six1 | mm10_v2_chr12_-_73047179_73047179 | 0.52 | 2.8e-05 | Click! |
| Six2 | mm10_v2_chr17_-_85688252_85688275 | 0.50 | 4.8e-05 | Click! |
| Six3 | mm10_v2_chr17_+_85620816_85620843 | 0.30 | 2.2e-02 | Click! |


Top targets:
Gene overrepresentation in biological_process category:
| Log-likelihood per target | Total log-likelihood | Term | Description |
|---|---|---|---|
| 1.0 | 3.1 | GO:0006097 | glyoxylate cycle(GO:0006097) |
| 1.0 | 3.9 | GO:0006776 | vitamin A metabolic process(GO:0006776) |
| 0.8 | 4.8 | GO:0021797 | forebrain anterior/posterior pattern specification(GO:0021797) |
| 0.6 | 3.2 | GO:0051661 | maintenance of centrosome location(GO:0051661) |
| 0.5 | 2.4 | GO:0007386 | compartment pattern specification(GO:0007386) |
| 0.4 | 2.4 | GO:0032713 | negative regulation of interleukin-4 production(GO:0032713) |
| 0.4 | 1.2 | GO:0048496 | maintenance of organ identity(GO:0048496) |
| 0.4 | 2.6 | GO:2000002 | negative regulation of DNA damage checkpoint(GO:2000002) |
| 0.4 | 1.1 | GO:0001193 | maintenance of transcriptional fidelity during DNA-templated transcription elongation(GO:0001192) maintenance of transcriptional fidelity during DNA-templated transcription elongation from RNA polymerase II promoter(GO:0001193) |
| 0.3 | 1.3 | GO:0048539 | bone marrow development(GO:0048539) |
| 0.3 | 0.9 | GO:0021698 | cerebellar cortex structural organization(GO:0021698) |
| 0.3 | 1.6 | GO:0072488 | ammonium transmembrane transport(GO:0072488) |
| 0.3 | 1.1 | GO:0070318 | positive regulation of G0 to G1 transition(GO:0070318) |
| 0.3 | 0.8 | GO:1990046 | positive regulation of mitochondrial DNA replication(GO:0090297) regulation of cardiolipin metabolic process(GO:1900208) positive regulation of cardiolipin metabolic process(GO:1900210) stress-induced mitochondrial fusion(GO:1990046) |
| 0.2 | 0.8 | GO:0031581 | hemidesmosome assembly(GO:0031581) |
| 0.2 | 0.5 | GO:0046032 | ADP catabolic process(GO:0046032) |
| 0.2 | 2.2 | GO:0048672 | positive regulation of collateral sprouting(GO:0048672) |
| 0.2 | 0.6 | GO:0019614 | catechol-containing compound catabolic process(GO:0019614) catecholamine catabolic process(GO:0042424) |
| 0.1 | 2.0 | GO:0030150 | protein import into mitochondrial matrix(GO:0030150) |
| 0.1 | 0.4 | GO:0071550 | death-inducing signaling complex assembly(GO:0071550) |
| 0.1 | 0.5 | GO:0097428 | protein maturation by iron-sulfur cluster transfer(GO:0097428) |
| 0.1 | 0.3 | GO:0060032 | notochord regression(GO:0060032) |
| 0.1 | 0.2 | GO:0001928 | regulation of exocyst assembly(GO:0001928) |
| 0.1 | 0.2 | GO:0002314 | germinal center B cell differentiation(GO:0002314) |
| 0.1 | 0.8 | GO:0050860 | negative regulation of T cell receptor signaling pathway(GO:0050860) |
| 0.0 | 5.2 | GO:0050885 | neuromuscular process controlling balance(GO:0050885) |
| 0.0 | 0.3 | GO:0036158 | outer dynein arm assembly(GO:0036158) |
| 0.0 | 3.0 | GO:0032526 | response to retinoic acid(GO:0032526) |
| 0.0 | 0.3 | GO:0061469 | regulation of type B pancreatic cell proliferation(GO:0061469) |
| 0.0 | 0.1 | GO:0007320 | insemination(GO:0007320) |
| 0.0 | 0.4 | GO:0010592 | positive regulation of lamellipodium assembly(GO:0010592) |
| 0.0 | 0.2 | GO:0070940 | dephosphorylation of RNA polymerase II C-terminal domain(GO:0070940) |
| 0.0 | 1.3 | GO:2000179 | positive regulation of neural precursor cell proliferation(GO:2000179) |
| 0.0 | 1.0 | GO:0031122 | cytoplasmic microtubule organization(GO:0031122) |
| 0.0 | 0.3 | GO:0016973 | poly(A)+ mRNA export from nucleus(GO:0016973) |
| 0.0 | 0.7 | GO:0007026 | negative regulation of microtubule depolymerization(GO:0007026) |
| 0.0 | 0.2 | GO:0006337 | nucleosome disassembly(GO:0006337) protein-DNA complex disassembly(GO:0032986) |
| 0.0 | 0.3 | GO:0033235 | positive regulation of protein sumoylation(GO:0033235) |
| 0.0 | 0.3 | GO:2000772 | regulation of cellular senescence(GO:2000772) |
Gene overrepresentation in cellular_component category:
| Log-likelihood per target | Total log-likelihood | Term | Description |
|---|---|---|---|
| 0.6 | 3.2 | GO:0036449 | microtubule minus-end(GO:0036449) |
| 0.4 | 1.2 | GO:0097543 | ciliary inversin compartment(GO:0097543) |
| 0.2 | 2.6 | GO:0005688 | U6 snRNP(GO:0005688) |
| 0.2 | 0.5 | GO:0032311 | angiogenin-PRI complex(GO:0032311) |
| 0.1 | 1.3 | GO:0061574 | ASAP complex(GO:0061574) |
| 0.1 | 7.7 | GO:0005881 | cytoplasmic microtubule(GO:0005881) |
| 0.1 | 0.8 | GO:0030056 | hemidesmosome(GO:0030056) |
| 0.1 | 1.1 | GO:0005665 | DNA-directed RNA polymerase II, core complex(GO:0005665) |
| 0.1 | 0.8 | GO:0042101 | T cell receptor complex(GO:0042101) |
| 0.0 | 0.9 | GO:0051233 | spindle midzone(GO:0051233) |
| 0.0 | 0.4 | GO:0031209 | SCAR complex(GO:0031209) |
| 0.0 | 0.8 | GO:0034451 | centriolar satellite(GO:0034451) |
| 0.0 | 0.3 | GO:0097542 | ciliary tip(GO:0097542) |
| 0.0 | 3.8 | GO:0000776 | kinetochore(GO:0000776) |
| 0.0 | 0.3 | GO:0042405 | nuclear inclusion body(GO:0042405) |
| 0.0 | 0.4 | GO:0031143 | pseudopodium(GO:0031143) |
| 0.0 | 0.5 | GO:0001741 | XY body(GO:0001741) |
| 0.0 | 1.1 | GO:0005801 | cis-Golgi network(GO:0005801) |
| 0.0 | 0.8 | GO:0001772 | immunological synapse(GO:0001772) |
| 0.0 | 0.2 | GO:0072669 | tRNA-splicing ligase complex(GO:0072669) |
| 0.0 | 1.1 | GO:0030173 | integral component of Golgi membrane(GO:0030173) |
| 0.0 | 0.2 | GO:0000145 | exocyst(GO:0000145) |
| 0.0 | 2.9 | GO:0005777 | peroxisome(GO:0005777) microbody(GO:0042579) |
| 0.0 | 0.2 | GO:0071564 | npBAF complex(GO:0071564) |
| 0.0 | 2.4 | GO:0009897 | external side of plasma membrane(GO:0009897) |
Gene overrepresentation in molecular_function category:
| Log-likelihood per target | Total log-likelihood | Term | Description |
|---|---|---|---|
| 1.0 | 3.1 | GO:0004450 | isocitrate dehydrogenase (NADP+) activity(GO:0004450) |
| 0.8 | 2.4 | GO:0033829 | O-fucosylpeptide 3-beta-N-acetylglucosaminyltransferase activity(GO:0033829) |
| 0.8 | 3.0 | GO:0008508 | bile acid:sodium symporter activity(GO:0008508) |
| 0.6 | 3.9 | GO:0019841 | retinol binding(GO:0019841) |
| 0.5 | 2.6 | GO:0030621 | U4 snRNA binding(GO:0030621) |
| 0.4 | 2.2 | GO:0070915 | lysophosphatidic acid receptor activity(GO:0070915) |
| 0.3 | 0.8 | GO:1901611 | phosphatidylglycerol binding(GO:1901611) cardiolipin binding(GO:1901612) |
| 0.2 | 0.6 | GO:0016206 | catechol O-methyltransferase activity(GO:0016206) |
| 0.1 | 1.6 | GO:0008519 | ammonium transmembrane transporter activity(GO:0008519) |
| 0.1 | 0.5 | GO:0008428 | ribonuclease inhibitor activity(GO:0008428) |
| 0.1 | 0.5 | GO:0047631 | adenosine-diphosphatase activity(GO:0043262) ADP-ribose diphosphatase activity(GO:0047631) |
| 0.1 | 0.2 | GO:0035673 | oligopeptide transmembrane transporter activity(GO:0035673) |
| 0.1 | 0.9 | GO:0008574 | ATP-dependent microtubule motor activity, plus-end-directed(GO:0008574) |
| 0.1 | 1.1 | GO:0005520 | insulin-like growth factor binding(GO:0005520) |
| 0.0 | 0.8 | GO:0008307 | structural constituent of muscle(GO:0008307) |
| 0.0 | 0.7 | GO:0005164 | tumor necrosis factor receptor binding(GO:0005164) |
| 0.0 | 1.1 | GO:0003899 | DNA-directed RNA polymerase activity(GO:0003899) |
| 0.0 | 4.8 | GO:0001227 | transcriptional repressor activity, RNA polymerase II transcription regulatory region sequence-specific binding(GO:0001227) |
| 0.0 | 2.0 | GO:0051087 | chaperone binding(GO:0051087) |
| 0.0 | 1.0 | GO:0005547 | phosphatidylinositol-3,4,5-trisphosphate binding(GO:0005547) |
| 0.0 | 0.5 | GO:0051537 | ferrous iron binding(GO:0008198) 2 iron, 2 sulfur cluster binding(GO:0051537) |
| 0.0 | 3.2 | GO:0005516 | calmodulin binding(GO:0005516) |
| 0.0 | 0.4 | GO:0031434 | mitogen-activated protein kinase kinase binding(GO:0031434) |
| 0.0 | 0.2 | GO:0016922 | ligand-dependent nuclear receptor binding(GO:0016922) |
| 0.0 | 0.3 | GO:0005487 | nucleocytoplasmic transporter activity(GO:0005487) |
|
|
|
|