| 7.6 |
22.9 |
GO:0030827 |
negative regulation of cGMP metabolic process(GO:0030824) negative regulation of cGMP biosynthetic process(GO:0030827) negative regulation of guanylate cyclase activity(GO:0031283) |
| 6.3 |
12.6 |
GO:2000344 |
positive regulation of acrosome reaction(GO:2000344) |
| 5.8 |
17.4 |
GO:0032430 |
positive regulation of phospholipase A2 activity(GO:0032430) activation of meiosis involved in egg activation(GO:0060466) |
| 5.5 |
16.6 |
GO:0043988 |
histone H3-S28 phosphorylation(GO:0043988) |
| 5.5 |
5.5 |
GO:0003383 |
apical constriction(GO:0003383) |
| 4.9 |
14.7 |
GO:0032915 |
positive regulation of transforming growth factor beta2 production(GO:0032915) |
| 4.7 |
4.7 |
GO:0014809 |
regulation of skeletal muscle contraction by regulation of release of sequestered calcium ion(GO:0014809) |
| 4.7 |
14.2 |
GO:0046959 |
habituation(GO:0046959) |
| 4.6 |
23.1 |
GO:0034441 |
plasma lipoprotein particle oxidation(GO:0034441) |
| 4.2 |
25.5 |
GO:0030643 |
cellular phosphate ion homeostasis(GO:0030643) cellular trivalent inorganic anion homeostasis(GO:0072502) |
| 4.1 |
16.4 |
GO:1903288 |
regulation of potassium ion import(GO:1903286) positive regulation of potassium ion import(GO:1903288) |
| 4.0 |
20.2 |
GO:0032485 |
regulation of Ral protein signal transduction(GO:0032485) |
| 4.0 |
15.9 |
GO:0032489 |
regulation of Cdc42 protein signal transduction(GO:0032489) |
| 3.9 |
19.7 |
GO:0010991 |
negative regulation of SMAD protein complex assembly(GO:0010991) |
| 3.9 |
3.9 |
GO:0043691 |
reverse cholesterol transport(GO:0043691) |
| 3.9 |
7.8 |
GO:0034380 |
high-density lipoprotein particle assembly(GO:0034380) |
| 3.8 |
11.5 |
GO:0046168 |
glycerol-3-phosphate catabolic process(GO:0046168) |
| 3.8 |
11.3 |
GO:0019074 |
viral genome packaging(GO:0019072) viral RNA genome packaging(GO:0019074) |
| 3.7 |
22.0 |
GO:0032229 |
negative regulation of synaptic transmission, GABAergic(GO:0032229) |
| 3.6 |
14.5 |
GO:2000427 |
positive regulation of apoptotic cell clearance(GO:2000427) |
| 3.6 |
14.4 |
GO:0003357 |
noradrenergic neuron differentiation(GO:0003357) |
| 3.6 |
24.9 |
GO:0014053 |
negative regulation of gamma-aminobutyric acid secretion(GO:0014053) |
| 3.4 |
47.3 |
GO:0021684 |
cerebellar granular layer formation(GO:0021684) cerebellar granule cell differentiation(GO:0021707) |
| 3.3 |
16.3 |
GO:0032429 |
regulation of phospholipase A2 activity(GO:0032429) |
| 3.3 |
16.3 |
GO:0007256 |
activation of JNKK activity(GO:0007256) |
| 3.2 |
19.4 |
GO:0046549 |
retinal cone cell development(GO:0046549) |
| 3.2 |
9.5 |
GO:0018103 |
protein C-linked glycosylation(GO:0018103) peptidyl-tryptophan modification(GO:0018211) protein C-linked glycosylation via tryptophan(GO:0018317) protein C-linked glycosylation via 2'-alpha-mannosyl-L-tryptophan(GO:0018406) |
| 3.1 |
9.4 |
GO:0048686 |
regulation of sprouting of injured axon(GO:0048686) regulation of axon extension involved in regeneration(GO:0048690) |
| 3.1 |
9.3 |
GO:0017055 |
negative regulation of RNA polymerase II transcriptional preinitiation complex assembly(GO:0017055) |
| 3.1 |
12.4 |
GO:0021586 |
pons maturation(GO:0021586) |
| 3.1 |
9.3 |
GO:0019482 |
beta-alanine metabolic process(GO:0019482) |
| 3.1 |
3.1 |
GO:0050915 |
sensory perception of sour taste(GO:0050915) |
| 3.1 |
49.1 |
GO:1900454 |
positive regulation of long term synaptic depression(GO:1900454) |
| 3.0 |
9.1 |
GO:0038095 |
Fc-epsilon receptor signaling pathway(GO:0038095) |
| 3.0 |
9.0 |
GO:0050975 |
sensory perception of touch(GO:0050975) |
| 3.0 |
21.1 |
GO:0070779 |
D-aspartate transport(GO:0070777) D-aspartate import(GO:0070779) |
| 3.0 |
6.0 |
GO:0097494 |
regulation of vesicle size(GO:0097494) |
| 3.0 |
9.0 |
GO:0007525 |
somatic muscle development(GO:0007525) |
| 3.0 |
3.0 |
GO:0060489 |
establishment of body hair or bristle planar orientation(GO:0048104) establishment of body hair planar orientation(GO:0048105) orthogonal dichotomous subdivision of terminal units involved in lung branching morphogenesis(GO:0060488) planar dichotomous subdivision of terminal units involved in lung branching morphogenesis(GO:0060489) lateral sprouting involved in lung morphogenesis(GO:0060490) |
| 3.0 |
11.9 |
GO:0035609 |
C-terminal protein deglutamylation(GO:0035609) |
| 2.9 |
8.8 |
GO:0032513 |
negative regulation of protein phosphatase type 2B activity(GO:0032513) |
| 2.9 |
2.9 |
GO:0038091 |
VEGF-activated platelet-derived growth factor receptor signaling pathway(GO:0038086) positive regulation of cell proliferation by VEGF-activated platelet derived growth factor receptor signaling pathway(GO:0038091) |
| 2.9 |
11.6 |
GO:2000795 |
negative regulation of epithelial cell proliferation involved in lung morphogenesis(GO:2000795) |
| 2.9 |
28.7 |
GO:0071468 |
cellular response to acidic pH(GO:0071468) |
| 2.9 |
8.6 |
GO:0050925 |
negative regulation of negative chemotaxis(GO:0050925) |
| 2.8 |
11.4 |
GO:1901204 |
regulation of adrenergic receptor signaling pathway involved in heart process(GO:1901204) |
| 2.8 |
14.1 |
GO:0051012 |
microtubule sliding(GO:0051012) |
| 2.8 |
11.3 |
GO:0009597 |
detection of virus(GO:0009597) |
| 2.8 |
11.2 |
GO:1904529 |
regulation of actin filament binding(GO:1904529) regulation of actin binding(GO:1904616) |
| 2.8 |
2.8 |
GO:0016080 |
synaptic vesicle targeting(GO:0016080) |
| 2.7 |
2.7 |
GO:0033602 |
negative regulation of dopamine secretion(GO:0033602) |
| 2.7 |
10.8 |
GO:0044268 |
multicellular organismal protein metabolic process(GO:0044268) |
| 2.7 |
8.0 |
GO:0007621 |
negative regulation of female receptivity(GO:0007621) |
| 2.7 |
10.7 |
GO:0032484 |
Ral protein signal transduction(GO:0032484) |
| 2.7 |
8.0 |
GO:0051611 |
negative regulation of neurotransmitter uptake(GO:0051581) serotonin uptake(GO:0051610) regulation of serotonin uptake(GO:0051611) negative regulation of serotonin uptake(GO:0051612) |
| 2.6 |
12.9 |
GO:1900170 |
negative regulation of glucocorticoid mediated signaling pathway(GO:1900170) |
| 2.6 |
7.7 |
GO:0072034 |
renal vesicle induction(GO:0072034) |
| 2.5 |
7.6 |
GO:1902083 |
negative regulation of peptidyl-cysteine S-nitrosylation(GO:1902083) |
| 2.5 |
2.5 |
GO:0070885 |
negative regulation of calcineurin-NFAT signaling cascade(GO:0070885) |
| 2.5 |
7.5 |
GO:1904685 |
positive regulation of metalloendopeptidase activity(GO:1904685) |
| 2.5 |
5.0 |
GO:0044331 |
cell-cell adhesion mediated by cadherin(GO:0044331) |
| 2.4 |
2.4 |
GO:0010046 |
response to mycotoxin(GO:0010046) |
| 2.4 |
4.9 |
GO:1903774 |
positive regulation of viral budding via host ESCRT complex(GO:1903774) |
| 2.4 |
9.7 |
GO:2000017 |
positive regulation of determination of dorsal identity(GO:2000017) |
| 2.4 |
21.4 |
GO:0071420 |
cellular response to histamine(GO:0071420) |
| 2.4 |
14.1 |
GO:1902669 |
positive regulation of axon extension involved in axon guidance(GO:0048842) positive regulation of axon guidance(GO:1902669) |
| 2.3 |
2.3 |
GO:1900673 |
olefin metabolic process(GO:1900673) |
| 2.3 |
25.3 |
GO:0048172 |
regulation of short-term neuronal synaptic plasticity(GO:0048172) |
| 2.3 |
6.8 |
GO:1900453 |
negative regulation of long term synaptic depression(GO:1900453) positive regulation of intracellular transport of viral material(GO:1901254) |
| 2.3 |
6.8 |
GO:1900452 |
regulation of long term synaptic depression(GO:1900452) |
| 2.3 |
9.1 |
GO:0070086 |
ubiquitin-dependent endocytosis(GO:0070086) |
| 2.2 |
6.7 |
GO:0060854 |
patterning of lymph vessels(GO:0060854) |
| 2.2 |
11.0 |
GO:0035093 |
spermatogenesis, exchange of chromosomal proteins(GO:0035093) |
| 2.2 |
6.6 |
GO:0072223 |
metanephric glomerular mesangium development(GO:0072223) metanephric glomerular mesangial cell proliferation involved in metanephros development(GO:0072262) |
| 2.2 |
13.2 |
GO:0035743 |
CD4-positive, alpha-beta T cell cytokine production(GO:0035743) T-helper 2 cell cytokine production(GO:0035745) |
| 2.2 |
19.8 |
GO:0010459 |
negative regulation of heart rate(GO:0010459) |
| 2.2 |
6.5 |
GO:0071873 |
response to norepinephrine(GO:0071873) |
| 2.2 |
6.5 |
GO:1900149 |
positive regulation of Schwann cell migration(GO:1900149) |
| 2.2 |
4.4 |
GO:0019732 |
antifungal humoral response(GO:0019732) |
| 2.2 |
10.9 |
GO:1902837 |
amino acid import into cell(GO:1902837) |
| 2.2 |
2.2 |
GO:0036091 |
positive regulation of transcription from RNA polymerase II promoter in response to oxidative stress(GO:0036091) |
| 2.2 |
2.2 |
GO:0031665 |
negative regulation of response to biotic stimulus(GO:0002832) negative regulation of lipopolysaccharide-mediated signaling pathway(GO:0031665) |
| 2.2 |
6.5 |
GO:0045163 |
clustering of voltage-gated potassium channels(GO:0045163) |
| 2.2 |
6.5 |
GO:1902528 |
regulation of protein linear polyubiquitination(GO:1902528) positive regulation of protein linear polyubiquitination(GO:1902530) |
| 2.1 |
12.9 |
GO:1903056 |
regulation of lens fiber cell differentiation(GO:1902746) positive regulation of lens fiber cell differentiation(GO:1902748) regulation of melanosome organization(GO:1903056) |
| 2.1 |
15.0 |
GO:0071361 |
cellular response to ethanol(GO:0071361) |
| 2.1 |
6.4 |
GO:0046881 |
positive regulation of follicle-stimulating hormone secretion(GO:0046881) |
| 2.1 |
6.4 |
GO:0009405 |
pathogenesis(GO:0009405) |
| 2.1 |
21.2 |
GO:0015812 |
gamma-aminobutyric acid transport(GO:0015812) |
| 2.1 |
4.2 |
GO:0043696 |
dedifferentiation(GO:0043696) cell dedifferentiation(GO:0043697) |
| 2.1 |
37.9 |
GO:0014047 |
glutamate secretion(GO:0014047) |
| 2.1 |
4.2 |
GO:0032227 |
negative regulation of synaptic transmission, dopaminergic(GO:0032227) |
| 2.1 |
10.5 |
GO:0009313 |
oligosaccharide catabolic process(GO:0009313) |
| 2.1 |
10.4 |
GO:0015871 |
choline transport(GO:0015871) |
| 2.1 |
16.6 |
GO:0016338 |
calcium-independent cell-cell adhesion via plasma membrane cell-adhesion molecules(GO:0016338) |
| 2.1 |
14.5 |
GO:0060762 |
regulation of branching involved in mammary gland duct morphogenesis(GO:0060762) |
| 2.1 |
2.1 |
GO:0090494 |
catecholamine uptake(GO:0090493) dopamine uptake(GO:0090494) |
| 2.1 |
6.2 |
GO:0006601 |
creatine biosynthetic process(GO:0006601) |
| 2.0 |
4.1 |
GO:0042940 |
D-amino acid transport(GO:0042940) |
| 2.0 |
8.1 |
GO:0051580 |
regulation of neurotransmitter uptake(GO:0051580) |
| 2.0 |
22.3 |
GO:0097688 |
AMPA glutamate receptor clustering(GO:0097113) glutamate receptor clustering(GO:0097688) |
| 2.0 |
6.1 |
GO:0021830 |
substrate-independent telencephalic tangential migration(GO:0021826) interneuron migration from the subpallium to the cortex(GO:0021830) substrate-independent telencephalic tangential interneuron migration(GO:0021843) |
| 2.0 |
6.1 |
GO:0002447 |
eosinophil activation involved in immune response(GO:0002278) eosinophil mediated immunity(GO:0002447) eosinophil degranulation(GO:0043308) |
| 2.0 |
2.0 |
GO:0090258 |
negative regulation of mitochondrial fission(GO:0090258) |
| 2.0 |
6.0 |
GO:0003349 |
epicardium-derived cardiac endothelial cell differentiation(GO:0003349) |
| 2.0 |
4.0 |
GO:0001928 |
regulation of exocyst assembly(GO:0001928) |
| 2.0 |
2.0 |
GO:1903061 |
regulation of protein lipidation(GO:1903059) positive regulation of protein lipidation(GO:1903061) |
| 1.9 |
5.8 |
GO:1904177 |
regulation of adipose tissue development(GO:1904177) |
| 1.9 |
5.7 |
GO:0021577 |
hindbrain structural organization(GO:0021577) cerebellum structural organization(GO:0021589) |
| 1.9 |
11.4 |
GO:0061092 |
regulation of phospholipid translocation(GO:0061091) positive regulation of phospholipid translocation(GO:0061092) |
| 1.9 |
5.7 |
GO:0070428 |
regulation of nucleotide-binding oligomerization domain containing 1 signaling pathway(GO:0070428) |
| 1.9 |
7.6 |
GO:0010891 |
negative regulation of sequestering of triglyceride(GO:0010891) |
| 1.9 |
9.4 |
GO:0007158 |
neuron cell-cell adhesion(GO:0007158) |
| 1.9 |
9.4 |
GO:0051684 |
maintenance of Golgi location(GO:0051684) |
| 1.9 |
7.5 |
GO:0014012 |
peripheral nervous system axon regeneration(GO:0014012) |
| 1.9 |
5.7 |
GO:0034447 |
very-low-density lipoprotein particle clearance(GO:0034447) |
| 1.9 |
11.3 |
GO:0070417 |
cellular response to cold(GO:0070417) |
| 1.9 |
9.4 |
GO:0003025 |
regulation of systemic arterial blood pressure by baroreceptor feedback(GO:0003025) |
| 1.9 |
1.9 |
GO:0046544 |
development of secondary male sexual characteristics(GO:0046544) |
| 1.9 |
7.5 |
GO:0060050 |
positive regulation of protein glycosylation(GO:0060050) |
| 1.9 |
1.9 |
GO:0097274 |
urea homeostasis(GO:0097274) |
| 1.9 |
11.2 |
GO:2000672 |
negative regulation of motor neuron apoptotic process(GO:2000672) |
| 1.9 |
7.4 |
GO:0036015 |
response to interleukin-3(GO:0036015) cellular response to interleukin-3(GO:0036016) |
| 1.8 |
9.2 |
GO:0018125 |
peptidyl-cysteine methylation(GO:0018125) |
| 1.8 |
29.5 |
GO:0032793 |
positive regulation of CREB transcription factor activity(GO:0032793) |
| 1.8 |
12.9 |
GO:2001023 |
regulation of response to drug(GO:2001023) |
| 1.8 |
1.8 |
GO:0031394 |
positive regulation of prostaglandin biosynthetic process(GO:0031394) positive regulation of unsaturated fatty acid biosynthetic process(GO:2001280) |
| 1.8 |
5.5 |
GO:0051542 |
elastin biosynthetic process(GO:0051542) |
| 1.8 |
3.7 |
GO:2001016 |
positive regulation of skeletal muscle cell differentiation(GO:2001016) |
| 1.8 |
10.9 |
GO:1903423 |
positive regulation of synaptic vesicle recycling(GO:1903423) |
| 1.8 |
5.4 |
GO:0008355 |
olfactory learning(GO:0008355) |
| 1.8 |
10.9 |
GO:0007021 |
tubulin complex assembly(GO:0007021) |
| 1.8 |
5.4 |
GO:0060161 |
positive regulation of dopamine receptor signaling pathway(GO:0060161) |
| 1.8 |
7.2 |
GO:0061428 |
negative regulation of transcription from RNA polymerase II promoter in response to hypoxia(GO:0061428) |
| 1.8 |
1.8 |
GO:0090218 |
positive regulation of lipid kinase activity(GO:0090218) |
| 1.8 |
7.2 |
GO:0051725 |
protein de-ADP-ribosylation(GO:0051725) |
| 1.8 |
14.3 |
GO:0009181 |
purine nucleoside diphosphate catabolic process(GO:0009137) purine ribonucleoside diphosphate catabolic process(GO:0009181) |
| 1.8 |
7.1 |
GO:1904451 |
regulation of hydrogen:potassium-exchanging ATPase activity(GO:1904451) positive regulation of hydrogen:potassium-exchanging ATPase activity(GO:1904453) |
| 1.8 |
10.7 |
GO:0002591 |
positive regulation of antigen processing and presentation of peptide antigen via MHC class I(GO:0002591) |
| 1.8 |
17.8 |
GO:0001956 |
positive regulation of neurotransmitter secretion(GO:0001956) |
| 1.8 |
3.5 |
GO:0034144 |
negative regulation of toll-like receptor 4 signaling pathway(GO:0034144) |
| 1.8 |
5.3 |
GO:0071492 |
cellular response to UV-A(GO:0071492) |
| 1.8 |
26.4 |
GO:0021902 |
commitment of neuronal cell to specific neuron type in forebrain(GO:0021902) |
| 1.8 |
7.0 |
GO:2000048 |
negative regulation of cell-cell adhesion mediated by cadherin(GO:2000048) |
| 1.7 |
8.7 |
GO:2000507 |
positive regulation of energy homeostasis(GO:2000507) |
| 1.7 |
1.7 |
GO:1902988 |
neurofibrillary tangle assembly(GO:1902988) regulation of neurofibrillary tangle assembly(GO:1902996) |
| 1.7 |
6.9 |
GO:2000211 |
regulation of glutamate metabolic process(GO:2000211) |
| 1.7 |
20.6 |
GO:2000480 |
negative regulation of cAMP-dependent protein kinase activity(GO:2000480) |
| 1.7 |
5.1 |
GO:0021891 |
olfactory bulb interneuron development(GO:0021891) |
| 1.7 |
17.1 |
GO:0007191 |
adenylate cyclase-activating dopamine receptor signaling pathway(GO:0007191) |
| 1.7 |
3.4 |
GO:0097155 |
fasciculation of sensory neuron axon(GO:0097155) |
| 1.7 |
3.4 |
GO:2000015 |
regulation of determination of dorsal identity(GO:2000015) |
| 1.7 |
3.4 |
GO:0072592 |
oxygen metabolic process(GO:0072592) |
| 1.7 |
28.5 |
GO:0071625 |
vocalization behavior(GO:0071625) |
| 1.7 |
38.4 |
GO:0032011 |
ARF protein signal transduction(GO:0032011) regulation of ARF protein signal transduction(GO:0032012) |
| 1.6 |
11.5 |
GO:0051823 |
regulation of synapse structural plasticity(GO:0051823) |
| 1.6 |
11.4 |
GO:0021894 |
cerebral cortex GABAergic interneuron development(GO:0021894) |
| 1.6 |
6.5 |
GO:0006842 |
tricarboxylic acid transport(GO:0006842) citrate transport(GO:0015746) |
| 1.6 |
8.1 |
GO:1902683 |
regulation of receptor localization to synapse(GO:1902683) |
| 1.6 |
11.2 |
GO:0030382 |
sperm mitochondrion organization(GO:0030382) |
| 1.6 |
3.2 |
GO:0010961 |
cellular magnesium ion homeostasis(GO:0010961) |
| 1.6 |
8.0 |
GO:2000189 |
positive regulation of cholesterol homeostasis(GO:2000189) |
| 1.6 |
4.8 |
GO:0097500 |
receptor localization to nonmotile primary cilium(GO:0097500) |
| 1.6 |
15.9 |
GO:0016322 |
neuron remodeling(GO:0016322) |
| 1.6 |
4.7 |
GO:0035934 |
corticosterone secretion(GO:0035934) |
| 1.6 |
1.6 |
GO:1904426 |
positive regulation of GTP binding(GO:1904426) |
| 1.6 |
9.4 |
GO:0048102 |
autophagic cell death(GO:0048102) |
| 1.6 |
4.7 |
GO:0046340 |
diacylglycerol catabolic process(GO:0046340) |
| 1.6 |
6.2 |
GO:1903587 |
regulation of blood vessel endothelial cell proliferation involved in sprouting angiogenesis(GO:1903587) |
| 1.6 |
10.9 |
GO:0032808 |
lacrimal gland development(GO:0032808) |
| 1.5 |
30.9 |
GO:0050650 |
chondroitin sulfate proteoglycan biosynthetic process(GO:0050650) |
| 1.5 |
10.8 |
GO:0016480 |
negative regulation of transcription from RNA polymerase III promoter(GO:0016480) |
| 1.5 |
4.6 |
GO:1903244 |
positive regulation of cardiac muscle adaptation(GO:0010615) positive regulation of cardiac muscle hypertrophy in response to stress(GO:1903244) |
| 1.5 |
4.6 |
GO:0021546 |
rhombomere development(GO:0021546) |
| 1.5 |
4.5 |
GO:0051541 |
elastin metabolic process(GO:0051541) |
| 1.5 |
7.5 |
GO:0071880 |
adenylate cyclase-activating adrenergic receptor signaling pathway(GO:0071880) |
| 1.5 |
7.5 |
GO:2001223 |
negative regulation of neuron migration(GO:2001223) |
| 1.5 |
10.4 |
GO:0021869 |
forebrain ventricular zone progenitor cell division(GO:0021869) |
| 1.5 |
7.4 |
GO:0070305 |
response to cGMP(GO:0070305) cellular response to cGMP(GO:0071321) |
| 1.5 |
8.9 |
GO:0032483 |
regulation of Rab protein signal transduction(GO:0032483) |
| 1.5 |
7.4 |
GO:0055091 |
phospholipid homeostasis(GO:0055091) |
| 1.4 |
1.4 |
GO:0016557 |
peroxisome membrane biogenesis(GO:0016557) |
| 1.4 |
23.1 |
GO:2000311 |
regulation of alpha-amino-3-hydroxy-5-methyl-4-isoxazole propionate selective glutamate receptor activity(GO:2000311) |
| 1.4 |
7.2 |
GO:0032482 |
Rab protein signal transduction(GO:0032482) |
| 1.4 |
5.8 |
GO:1903031 |
regulation of microtubule plus-end binding(GO:1903031) positive regulation of microtubule plus-end binding(GO:1903033) |
| 1.4 |
7.2 |
GO:0015803 |
branched-chain amino acid transport(GO:0015803) leucine transport(GO:0015820) |
| 1.4 |
4.3 |
GO:0060729 |
intestinal epithelial structure maintenance(GO:0060729) |
| 1.4 |
2.9 |
GO:0001922 |
B-1 B cell homeostasis(GO:0001922) |
| 1.4 |
5.7 |
GO:0061002 |
negative regulation of dendritic spine morphogenesis(GO:0061002) |
| 1.4 |
7.1 |
GO:1901679 |
nucleotide transmembrane transport(GO:1901679) |
| 1.4 |
4.2 |
GO:0060478 |
acrosomal vesicle exocytosis(GO:0060478) |
| 1.4 |
4.2 |
GO:0035928 |
rRNA import into mitochondrion(GO:0035928) |
| 1.4 |
12.6 |
GO:0042118 |
endothelial cell activation(GO:0042118) |
| 1.4 |
1.4 |
GO:0038165 |
oncostatin-M-mediated signaling pathway(GO:0038165) |
| 1.4 |
2.8 |
GO:0071677 |
positive regulation of mononuclear cell migration(GO:0071677) |
| 1.4 |
4.1 |
GO:0015910 |
peroxisomal long-chain fatty acid import(GO:0015910) |
| 1.4 |
1.4 |
GO:1903977 |
positive regulation of glial cell migration(GO:1903977) |
| 1.4 |
8.2 |
GO:0072321 |
chaperone-mediated protein transport(GO:0072321) |
| 1.4 |
8.1 |
GO:0033564 |
anterior/posterior axon guidance(GO:0033564) |
| 1.3 |
9.4 |
GO:0005513 |
detection of calcium ion(GO:0005513) |
| 1.3 |
4.0 |
GO:0014043 |
negative regulation of neuron maturation(GO:0014043) |
| 1.3 |
1.3 |
GO:0050703 |
interleukin-1 alpha production(GO:0032610) interleukin-1 alpha secretion(GO:0050703) |
| 1.3 |
4.0 |
GO:2001258 |
negative regulation of cation channel activity(GO:2001258) |
| 1.3 |
4.0 |
GO:1904742 |
regulation of telomeric DNA binding(GO:1904742) |
| 1.3 |
5.3 |
GO:0045144 |
meiotic sister chromatid segregation(GO:0045144) meiotic sister chromatid cohesion(GO:0051177) |
| 1.3 |
4.0 |
GO:0021837 |
motogenic signaling involved in postnatal olfactory bulb interneuron migration(GO:0021837) positive regulation of mitotic cell cycle DNA replication(GO:1903465) |
| 1.3 |
13.3 |
GO:0023041 |
neuronal signal transduction(GO:0023041) |
| 1.3 |
3.9 |
GO:0001920 |
negative regulation of receptor recycling(GO:0001920) |
| 1.3 |
3.9 |
GO:0003195 |
tricuspid valve development(GO:0003175) tricuspid valve morphogenesis(GO:0003186) tricuspid valve formation(GO:0003195) |
| 1.3 |
5.2 |
GO:0032804 |
negative regulation of low-density lipoprotein particle receptor catabolic process(GO:0032804) |
| 1.3 |
3.9 |
GO:0045204 |
MAPK export from nucleus(GO:0045204) |
| 1.3 |
5.2 |
GO:0097343 |
ripoptosome assembly(GO:0097343) ripoptosome assembly involved in necroptotic process(GO:1901026) |
| 1.3 |
3.9 |
GO:0046341 |
CDP-diacylglycerol metabolic process(GO:0046341) |
| 1.3 |
5.2 |
GO:0036515 |
serotonergic neuron axon guidance(GO:0036515) |
| 1.3 |
5.1 |
GO:1904425 |
negative regulation of GTP binding(GO:1904425) |
| 1.3 |
7.7 |
GO:1900112 |
regulation of histone H3-K9 trimethylation(GO:1900112) negative regulation of histone H3-K9 trimethylation(GO:1900113) |
| 1.3 |
16.5 |
GO:0034497 |
protein localization to pre-autophagosomal structure(GO:0034497) |
| 1.3 |
5.1 |
GO:0009449 |
gamma-aminobutyric acid biosynthetic process(GO:0009449) |
| 1.3 |
10.1 |
GO:2001135 |
regulation of endocytic recycling(GO:2001135) |
| 1.2 |
1.2 |
GO:0006990 |
positive regulation of transcription from RNA polymerase II promoter involved in unfolded protein response(GO:0006990) |
| 1.2 |
5.0 |
GO:0019355 |
nicotinamide nucleotide biosynthetic process from aspartate(GO:0019355) 'de novo' NAD biosynthetic process(GO:0034627) 'de novo' NAD biosynthetic process from aspartate(GO:0034628) |
| 1.2 |
5.0 |
GO:0007039 |
protein catabolic process in the vacuole(GO:0007039) |
| 1.2 |
3.7 |
GO:0071544 |
diphosphoinositol polyphosphate metabolic process(GO:0071543) diphosphoinositol polyphosphate catabolic process(GO:0071544) |
| 1.2 |
4.9 |
GO:0097298 |
regulation of nucleus size(GO:0097298) |
| 1.2 |
3.6 |
GO:0090325 |
regulation of locomotion involved in locomotory behavior(GO:0090325) negative regulation of locomotion involved in locomotory behavior(GO:0090327) |
| 1.2 |
9.7 |
GO:0044090 |
positive regulation of vacuole organization(GO:0044090) |
| 1.2 |
4.8 |
GO:0010820 |
regulation of T cell chemotaxis(GO:0010819) positive regulation of T cell chemotaxis(GO:0010820) |
| 1.2 |
10.7 |
GO:2000650 |
negative regulation of sodium ion transmembrane transporter activity(GO:2000650) |
| 1.2 |
7.2 |
GO:0061577 |
calcium ion transmembrane transport via high voltage-gated calcium channel(GO:0061577) |
| 1.2 |
5.9 |
GO:0070327 |
thyroid hormone transport(GO:0070327) |
| 1.2 |
5.9 |
GO:0090292 |
nuclear matrix organization(GO:0043578) nuclear matrix anchoring at nuclear membrane(GO:0090292) |
| 1.2 |
2.3 |
GO:2000821 |
regulation of grooming behavior(GO:2000821) |
| 1.2 |
7.0 |
GO:0060081 |
membrane hyperpolarization(GO:0060081) |
| 1.2 |
3.5 |
GO:0045213 |
neurotransmitter receptor metabolic process(GO:0045213) |
| 1.2 |
5.8 |
GO:0007379 |
segment specification(GO:0007379) |
| 1.1 |
1.1 |
GO:0097051 |
establishment of protein localization to endoplasmic reticulum membrane(GO:0097051) |
| 1.1 |
10.2 |
GO:0031340 |
positive regulation of vesicle fusion(GO:0031340) |
| 1.1 |
1.1 |
GO:1905005 |
regulation of epithelial to mesenchymal transition involved in endocardial cushion formation(GO:1905005) |
| 1.1 |
2.2 |
GO:0033159 |
negative regulation of protein import into nucleus, translocation(GO:0033159) |
| 1.1 |
2.2 |
GO:0021683 |
cerebellar granular layer morphogenesis(GO:0021683) |
| 1.1 |
6.7 |
GO:0002524 |
hypersensitivity(GO:0002524) |
| 1.1 |
11.1 |
GO:0035970 |
peptidyl-threonine dephosphorylation(GO:0035970) |
| 1.1 |
4.4 |
GO:0060134 |
prepulse inhibition(GO:0060134) |
| 1.1 |
3.3 |
GO:0071603 |
endothelial cell-cell adhesion(GO:0071603) |
| 1.1 |
14.2 |
GO:0045792 |
negative regulation of cell size(GO:0045792) |
| 1.1 |
3.3 |
GO:0071415 |
cellular response to caffeine(GO:0071313) cellular response to purine-containing compound(GO:0071415) |
| 1.1 |
7.6 |
GO:0090074 |
negative regulation of protein homodimerization activity(GO:0090074) |
| 1.1 |
2.2 |
GO:0045054 |
constitutive secretory pathway(GO:0045054) |
| 1.1 |
3.3 |
GO:0006682 |
galactosylceramide biosynthetic process(GO:0006682) galactolipid biosynthetic process(GO:0019375) |
| 1.1 |
2.2 |
GO:0070358 |
actin polymerization-dependent cell motility(GO:0070358) |
| 1.1 |
18.3 |
GO:0032287 |
peripheral nervous system myelin maintenance(GO:0032287) |
| 1.1 |
3.2 |
GO:0070459 |
prolactin secretion(GO:0070459) |
| 1.1 |
9.7 |
GO:0008054 |
negative regulation of cyclin-dependent protein serine/threonine kinase by cyclin degradation(GO:0008054) |
| 1.1 |
3.2 |
GO:0032918 |
polyamine acetylation(GO:0032917) spermidine acetylation(GO:0032918) |
| 1.1 |
3.2 |
GO:0071929 |
alpha-tubulin acetylation(GO:0071929) |
| 1.1 |
3.2 |
GO:0048294 |
negative regulation of isotype switching to IgE isotypes(GO:0048294) |
| 1.1 |
5.3 |
GO:0097011 |
cellular response to granulocyte macrophage colony-stimulating factor stimulus(GO:0097011) response to granulocyte macrophage colony-stimulating factor(GO:0097012) |
| 1.1 |
7.5 |
GO:0002904 |
positive regulation of B cell apoptotic process(GO:0002904) |
| 1.0 |
7.3 |
GO:0048149 |
behavioral response to ethanol(GO:0048149) |
| 1.0 |
4.2 |
GO:0007168 |
receptor guanylyl cyclase signaling pathway(GO:0007168) |
| 1.0 |
4.2 |
GO:0042985 |
negative regulation of amyloid precursor protein biosynthetic process(GO:0042985) |
| 1.0 |
9.4 |
GO:0036289 |
peptidyl-serine autophosphorylation(GO:0036289) |
| 1.0 |
2.1 |
GO:0021529 |
spinal cord oligodendrocyte cell differentiation(GO:0021529) spinal cord oligodendrocyte cell fate specification(GO:0021530) |
| 1.0 |
4.1 |
GO:0021914 |
negative regulation of smoothened signaling pathway involved in ventral spinal cord patterning(GO:0021914) |
| 1.0 |
5.1 |
GO:2000310 |
regulation of N-methyl-D-aspartate selective glutamate receptor activity(GO:2000310) |
| 1.0 |
2.0 |
GO:2000347 |
positive regulation of hepatocyte proliferation(GO:2000347) |
| 1.0 |
3.1 |
GO:0006642 |
triglyceride mobilization(GO:0006642) |
| 1.0 |
1.0 |
GO:1902774 |
late endosome to lysosome transport(GO:1902774) |
| 1.0 |
8.0 |
GO:0090240 |
positive regulation of histone H4 acetylation(GO:0090240) |
| 1.0 |
5.0 |
GO:0034141 |
positive regulation of toll-like receptor 3 signaling pathway(GO:0034141) |
| 1.0 |
2.0 |
GO:0031915 |
positive regulation of synaptic plasticity(GO:0031915) |
| 1.0 |
3.0 |
GO:0021893 |
cerebral cortex GABAergic interneuron fate commitment(GO:0021893) |
| 1.0 |
7.0 |
GO:0051036 |
regulation of endosome size(GO:0051036) |
| 1.0 |
3.0 |
GO:0048168 |
regulation of neuronal synaptic plasticity(GO:0048168) |
| 1.0 |
7.0 |
GO:0034638 |
phosphatidylcholine catabolic process(GO:0034638) |
| 1.0 |
4.0 |
GO:2000807 |
regulation of synaptic vesicle clustering(GO:2000807) |
| 1.0 |
38.6 |
GO:0007157 |
heterophilic cell-cell adhesion via plasma membrane cell adhesion molecules(GO:0007157) |
| 1.0 |
4.0 |
GO:0072365 |
regulation of cellular ketone metabolic process by negative regulation of transcription from RNA polymerase II promoter(GO:0072365) |
| 1.0 |
1.0 |
GO:0033292 |
T-tubule organization(GO:0033292) |
| 1.0 |
21.7 |
GO:0048268 |
clathrin coat assembly(GO:0048268) |
| 1.0 |
8.9 |
GO:0021957 |
corticospinal tract morphogenesis(GO:0021957) |
| 1.0 |
1.0 |
GO:0031584 |
activation of phospholipase D activity(GO:0031584) |
| 1.0 |
5.9 |
GO:0071404 |
cellular response to lipoprotein particle stimulus(GO:0071402) cellular response to low-density lipoprotein particle stimulus(GO:0071404) |
| 1.0 |
9.8 |
GO:0033005 |
positive regulation of mast cell activation(GO:0033005) positive regulation of mast cell activation involved in immune response(GO:0033008) positive regulation of mast cell degranulation(GO:0043306) |
| 1.0 |
1.9 |
GO:1900126 |
negative regulation of hyaluronan biosynthetic process(GO:1900126) |
| 1.0 |
2.9 |
GO:0045332 |
phospholipid translocation(GO:0045332) |
| 1.0 |
2.9 |
GO:0061687 |
detoxification of inorganic compound(GO:0061687) |
| 1.0 |
26.1 |
GO:0060074 |
synapse maturation(GO:0060074) |
| 1.0 |
18.3 |
GO:0032456 |
endocytic recycling(GO:0032456) |
| 1.0 |
3.8 |
GO:0071442 |
regulation of histone H3-K14 acetylation(GO:0071440) positive regulation of histone H3-K14 acetylation(GO:0071442) |
| 1.0 |
19.0 |
GO:0001574 |
ganglioside biosynthetic process(GO:0001574) |
| 0.9 |
1.9 |
GO:0071205 |
protein localization to juxtaparanode region of axon(GO:0071205) |
| 0.9 |
6.6 |
GO:0046541 |
saliva secretion(GO:0046541) |
| 0.9 |
0.9 |
GO:2000830 |
vacuolar phosphate transport(GO:0007037) vitamin D3 metabolic process(GO:0070640) positive regulation of parathyroid hormone secretion(GO:2000830) |
| 0.9 |
2.8 |
GO:0031117 |
positive regulation of microtubule depolymerization(GO:0031117) |
| 0.9 |
1.9 |
GO:1901524 |
regulation of macromitophagy(GO:1901524) negative regulation of macromitophagy(GO:1901525) |
| 0.9 |
14.9 |
GO:0021859 |
pyramidal neuron differentiation(GO:0021859) |
| 0.9 |
1.9 |
GO:0038180 |
nerve growth factor signaling pathway(GO:0038180) |
| 0.9 |
3.7 |
GO:1903181 |
regulation of dopamine biosynthetic process(GO:1903179) positive regulation of dopamine biosynthetic process(GO:1903181) |
| 0.9 |
2.8 |
GO:1900242 |
regulation of synaptic vesicle endocytosis(GO:1900242) |
| 0.9 |
1.8 |
GO:0061343 |
cell adhesion involved in heart morphogenesis(GO:0061343) |
| 0.9 |
17.4 |
GO:0086026 |
atrial cardiac muscle cell action potential(GO:0086014) atrial cardiac muscle cell to AV node cell signaling(GO:0086026) atrial cardiac muscle cell to AV node cell communication(GO:0086066) |
| 0.9 |
0.9 |
GO:0070427 |
nucleotide-binding oligomerization domain containing 1 signaling pathway(GO:0070427) |
| 0.9 |
3.6 |
GO:0048711 |
positive regulation of astrocyte differentiation(GO:0048711) |
| 0.9 |
10.0 |
GO:0016082 |
synaptic vesicle priming(GO:0016082) |
| 0.9 |
3.6 |
GO:0002036 |
regulation of L-glutamate transport(GO:0002036) |
| 0.9 |
2.7 |
GO:1902512 |
positive regulation of apoptotic DNA fragmentation(GO:1902512) positive regulation of DNA catabolic process(GO:1903626) |
| 0.9 |
5.4 |
GO:0010523 |
negative regulation of calcium ion transport into cytosol(GO:0010523) |
| 0.9 |
4.5 |
GO:0046416 |
D-amino acid metabolic process(GO:0046416) |
| 0.9 |
0.9 |
GO:1901896 |
positive regulation of calcium-transporting ATPase activity(GO:1901896) |
| 0.9 |
0.9 |
GO:0010818 |
T cell chemotaxis(GO:0010818) |
| 0.9 |
8.0 |
GO:0007042 |
lysosomal lumen acidification(GO:0007042) |
| 0.9 |
3.6 |
GO:0019934 |
cGMP-mediated signaling(GO:0019934) |
| 0.9 |
2.7 |
GO:0018008 |
N-terminal peptidyl-glycine N-myristoylation(GO:0018008) peptidyl-glycine modification(GO:0018201) |
| 0.9 |
3.5 |
GO:1904321 |
response to forskolin(GO:1904321) cellular response to forskolin(GO:1904322) |
| 0.9 |
3.5 |
GO:0072344 |
rescue of stalled ribosome(GO:0072344) |
| 0.9 |
7.0 |
GO:0045820 |
negative regulation of glycolytic process(GO:0045820) |
| 0.9 |
2.6 |
GO:0001951 |
intestinal D-glucose absorption(GO:0001951) terminal web assembly(GO:1902896) |
| 0.9 |
11.4 |
GO:0046464 |
neutral lipid catabolic process(GO:0046461) acylglycerol catabolic process(GO:0046464) |
| 0.9 |
5.2 |
GO:0036444 |
calcium ion transmembrane import into mitochondrion(GO:0036444) |
| 0.9 |
3.5 |
GO:1903025 |
regulation of RNA polymerase II regulatory region sequence-specific DNA binding(GO:1903025) |
| 0.9 |
7.0 |
GO:0035507 |
regulation of myosin-light-chain-phosphatase activity(GO:0035507) |
| 0.9 |
19.2 |
GO:0061098 |
positive regulation of protein tyrosine kinase activity(GO:0061098) |
| 0.9 |
1.7 |
GO:0048841 |
regulation of axon extension involved in axon guidance(GO:0048841) |
| 0.9 |
0.9 |
GO:0035426 |
extracellular matrix-cell signaling(GO:0035426) |
| 0.9 |
6.9 |
GO:0070995 |
NADPH oxidation(GO:0070995) |
| 0.9 |
5.2 |
GO:0034058 |
endosomal vesicle fusion(GO:0034058) |
| 0.9 |
5.2 |
GO:0001542 |
ovulation from ovarian follicle(GO:0001542) |
| 0.9 |
6.9 |
GO:0032020 |
ISG15-protein conjugation(GO:0032020) |
| 0.9 |
0.9 |
GO:0072578 |
neurotransmitter-gated ion channel clustering(GO:0072578) |
| 0.9 |
0.9 |
GO:0003344 |
pericardium morphogenesis(GO:0003344) |
| 0.9 |
12.8 |
GO:0035640 |
exploration behavior(GO:0035640) |
| 0.9 |
1.7 |
GO:0021604 |
cranial nerve structural organization(GO:0021604) |
| 0.9 |
0.9 |
GO:0021882 |
regulation of transcription from RNA polymerase II promoter involved in forebrain neuron fate commitment(GO:0021882) |
| 0.9 |
4.3 |
GO:0015808 |
L-alanine transport(GO:0015808) |
| 0.9 |
1.7 |
GO:0033700 |
phospholipid efflux(GO:0033700) |
| 0.8 |
7.6 |
GO:0031274 |
positive regulation of pseudopodium assembly(GO:0031274) |
| 0.8 |
2.5 |
GO:1900039 |
positive regulation of cellular response to hypoxia(GO:1900039) |
| 0.8 |
9.2 |
GO:0071225 |
cellular response to muramyl dipeptide(GO:0071225) |
| 0.8 |
3.3 |
GO:0010735 |
positive regulation of transcription via serum response element binding(GO:0010735) |
| 0.8 |
1.7 |
GO:1900736 |
regulation of phospholipase C-activating G-protein coupled receptor signaling pathway(GO:1900736) |
| 0.8 |
3.3 |
GO:0006848 |
pyruvate transport(GO:0006848) |
| 0.8 |
9.1 |
GO:0060292 |
long term synaptic depression(GO:0060292) |
| 0.8 |
1.7 |
GO:0021649 |
vestibulocochlear nerve morphogenesis(GO:0021648) vestibulocochlear nerve structural organization(GO:0021649) ganglion morphogenesis(GO:0061552) dorsal root ganglion morphogenesis(GO:1904835) dorsal root ganglion development(GO:1990791) |
| 0.8 |
0.8 |
GO:0022028 |
tangential migration from the subventricular zone to the olfactory bulb(GO:0022028) |
| 0.8 |
2.5 |
GO:0051342 |
regulation of cyclic-nucleotide phosphodiesterase activity(GO:0051342) negative regulation of cyclic-nucleotide phosphodiesterase activity(GO:0051344) |
| 0.8 |
2.5 |
GO:1902605 |
heterotrimeric G-protein complex assembly(GO:1902605) |
| 0.8 |
3.3 |
GO:0097039 |
protein linear polyubiquitination(GO:0097039) |
| 0.8 |
2.4 |
GO:0003376 |
sphingosine-1-phosphate signaling pathway(GO:0003376) sphingolipid mediated signaling pathway(GO:0090520) |
| 0.8 |
0.8 |
GO:0098828 |
modulation of inhibitory postsynaptic potential(GO:0098828) |
| 0.8 |
2.4 |
GO:1900740 |
regulation of protein insertion into mitochondrial membrane involved in apoptotic signaling pathway(GO:1900739) positive regulation of protein insertion into mitochondrial membrane involved in apoptotic signaling pathway(GO:1900740) |
| 0.8 |
3.2 |
GO:0060789 |
hair follicle placode formation(GO:0060789) |
| 0.8 |
3.2 |
GO:0070072 |
vacuolar proton-transporting V-type ATPase complex assembly(GO:0070072) |
| 0.8 |
3.2 |
GO:0051593 |
response to folic acid(GO:0051593) |
| 0.8 |
6.4 |
GO:0006995 |
cellular response to nitrogen starvation(GO:0006995) cellular response to nitrogen levels(GO:0043562) |
| 0.8 |
5.6 |
GO:0071455 |
cellular response to increased oxygen levels(GO:0036295) cellular response to hyperoxia(GO:0071455) |
| 0.8 |
2.4 |
GO:0030007 |
cellular potassium ion homeostasis(GO:0030007) |
| 0.8 |
0.8 |
GO:0060509 |
Type I pneumocyte differentiation(GO:0060509) |
| 0.8 |
7.1 |
GO:0001964 |
startle response(GO:0001964) |
| 0.8 |
2.4 |
GO:0051964 |
negative regulation of synapse assembly(GO:0051964) |
| 0.8 |
0.8 |
GO:1901668 |
regulation of superoxide dismutase activity(GO:1901668) |
| 0.8 |
2.3 |
GO:1900365 |
positive regulation of mRNA polyadenylation(GO:1900365) |
| 0.8 |
19.4 |
GO:0036465 |
synaptic vesicle recycling(GO:0036465) |
| 0.8 |
2.3 |
GO:0042138 |
meiotic DNA double-strand break formation(GO:0042138) |
| 0.8 |
3.1 |
GO:2000812 |
regulation of barbed-end actin filament capping(GO:2000812) |
| 0.8 |
9.9 |
GO:0009437 |
carnitine metabolic process(GO:0009437) |
| 0.8 |
0.8 |
GO:1904192 |
cholangiocyte apoptotic process(GO:1902488) regulation of cholangiocyte apoptotic process(GO:1904192) negative regulation of cholangiocyte apoptotic process(GO:1904193) |
| 0.8 |
6.1 |
GO:0071816 |
protein insertion into ER membrane(GO:0045048) tail-anchored membrane protein insertion into ER membrane(GO:0071816) |
| 0.8 |
6.8 |
GO:0032688 |
negative regulation of interferon-beta production(GO:0032688) |
| 0.8 |
3.0 |
GO:0071072 |
negative regulation of phospholipid biosynthetic process(GO:0071072) |
| 0.8 |
1.5 |
GO:0010693 |
negative regulation of alkaline phosphatase activity(GO:0010693) |
| 0.8 |
3.8 |
GO:0009404 |
toxin metabolic process(GO:0009404) |
| 0.8 |
1.5 |
GO:0060437 |
lung growth(GO:0060437) |
| 0.7 |
3.0 |
GO:2000110 |
negative regulation of macrophage apoptotic process(GO:2000110) |
| 0.7 |
2.2 |
GO:0006669 |
sphinganine-1-phosphate biosynthetic process(GO:0006669) |
| 0.7 |
3.0 |
GO:0060398 |
regulation of growth hormone receptor signaling pathway(GO:0060398) |
| 0.7 |
5.2 |
GO:1903779 |
regulation of cardiac conduction(GO:1903779) |
| 0.7 |
2.2 |
GO:0034035 |
purine ribonucleoside bisphosphate metabolic process(GO:0034035) |
| 0.7 |
3.7 |
GO:0051533 |
positive regulation of NFAT protein import into nucleus(GO:0051533) |
| 0.7 |
5.9 |
GO:0007252 |
I-kappaB phosphorylation(GO:0007252) |
| 0.7 |
5.9 |
GO:0006620 |
posttranslational protein targeting to membrane(GO:0006620) |
| 0.7 |
5.1 |
GO:0046543 |
development of secondary female sexual characteristics(GO:0046543) |
| 0.7 |
0.7 |
GO:0035701 |
hematopoietic stem cell migration(GO:0035701) |
| 0.7 |
4.4 |
GO:2000323 |
negative regulation of glucocorticoid receptor signaling pathway(GO:2000323) |
| 0.7 |
2.2 |
GO:0042560 |
10-formyltetrahydrofolate catabolic process(GO:0009258) folic acid-containing compound catabolic process(GO:0009397) pteridine-containing compound catabolic process(GO:0042560) |
| 0.7 |
3.6 |
GO:0006701 |
progesterone biosynthetic process(GO:0006701) |
| 0.7 |
5.1 |
GO:0006686 |
sphingomyelin biosynthetic process(GO:0006686) |
| 0.7 |
0.7 |
GO:0035973 |
aggrephagy(GO:0035973) |
| 0.7 |
3.6 |
GO:0051045 |
negative regulation of membrane protein ectodomain proteolysis(GO:0051045) |
| 0.7 |
2.9 |
GO:0006049 |
UDP-N-acetylglucosamine catabolic process(GO:0006049) |
| 0.7 |
7.9 |
GO:0007214 |
gamma-aminobutyric acid signaling pathway(GO:0007214) |
| 0.7 |
4.3 |
GO:0060666 |
dichotomous subdivision of terminal units involved in salivary gland branching(GO:0060666) |
| 0.7 |
5.0 |
GO:0016139 |
glycoside catabolic process(GO:0016139) |
| 0.7 |
7.1 |
GO:0006883 |
cellular sodium ion homeostasis(GO:0006883) |
| 0.7 |
1.4 |
GO:1903795 |
regulation of inorganic anion transmembrane transport(GO:1903795) |
| 0.7 |
2.1 |
GO:1903903 |
regulation of establishment of T cell polarity(GO:1903903) |
| 0.7 |
2.1 |
GO:0032237 |
activation of store-operated calcium channel activity(GO:0032237) |
| 0.7 |
2.1 |
GO:0034162 |
toll-like receptor 9 signaling pathway(GO:0034162) |
| 0.7 |
4.2 |
GO:0030397 |
membrane disassembly(GO:0030397) nuclear envelope disassembly(GO:0051081) |
| 0.7 |
4.2 |
GO:0055003 |
cardiac myofibril assembly(GO:0055003) |
| 0.7 |
2.8 |
GO:0033762 |
response to glucagon(GO:0033762) |
| 0.7 |
1.4 |
GO:1903596 |
regulation of gap junction assembly(GO:1903596) |
| 0.7 |
2.1 |
GO:0070375 |
ERK5 cascade(GO:0070375) |
| 0.7 |
15.9 |
GO:0006491 |
N-glycan processing(GO:0006491) |
| 0.7 |
2.7 |
GO:0030242 |
pexophagy(GO:0030242) |
| 0.7 |
4.1 |
GO:0045200 |
establishment or maintenance of neuroblast polarity(GO:0045196) establishment of neuroblast polarity(GO:0045200) |
| 0.7 |
2.1 |
GO:0097091 |
synaptic vesicle clustering(GO:0097091) |
| 0.7 |
2.1 |
GO:0014889 |
muscle atrophy(GO:0014889) |
| 0.7 |
2.1 |
GO:0060468 |
prevention of polyspermy(GO:0060468) |
| 0.7 |
6.2 |
GO:0031339 |
negative regulation of vesicle fusion(GO:0031339) |
| 0.7 |
6.1 |
GO:1901897 |
regulation of relaxation of cardiac muscle(GO:1901897) |
| 0.7 |
2.0 |
GO:0043465 |
regulation of fermentation(GO:0043465) negative regulation of fermentation(GO:1901003) |
| 0.7 |
6.8 |
GO:0048266 |
behavioral response to pain(GO:0048266) |
| 0.7 |
0.7 |
GO:1903772 |
regulation of viral budding via host ESCRT complex(GO:1903772) |
| 0.7 |
3.4 |
GO:0061086 |
negative regulation of histone H3-K27 methylation(GO:0061086) |
| 0.7 |
5.4 |
GO:0022038 |
corpus callosum development(GO:0022038) |
| 0.7 |
2.0 |
GO:0046880 |
regulation of follicle-stimulating hormone secretion(GO:0046880) follicle-stimulating hormone secretion(GO:0046884) |
| 0.7 |
4.7 |
GO:0050716 |
positive regulation of interleukin-1 secretion(GO:0050716) positive regulation of interleukin-1 beta secretion(GO:0050718) |
| 0.7 |
16.0 |
GO:0010738 |
regulation of protein kinase A signaling(GO:0010738) |
| 0.7 |
0.7 |
GO:0035493 |
SNARE complex assembly(GO:0035493) |
| 0.7 |
3.3 |
GO:0035810 |
positive regulation of urine volume(GO:0035810) |
| 0.7 |
17.7 |
GO:0050771 |
negative regulation of axonogenesis(GO:0050771) |
| 0.7 |
3.9 |
GO:0007413 |
axonal fasciculation(GO:0007413) |
| 0.7 |
8.5 |
GO:0002021 |
response to dietary excess(GO:0002021) |
| 0.7 |
5.9 |
GO:0009186 |
deoxyribonucleoside diphosphate metabolic process(GO:0009186) |
| 0.7 |
0.7 |
GO:0045448 |
regulation of mitotic cell cycle, embryonic(GO:0009794) mitotic cell cycle, embryonic(GO:0045448) |
| 0.7 |
6.5 |
GO:1900273 |
positive regulation of long-term synaptic potentiation(GO:1900273) |
| 0.6 |
5.1 |
GO:0051386 |
regulation of neurotrophin TRK receptor signaling pathway(GO:0051386) |
| 0.6 |
19.9 |
GO:1902668 |
negative regulation of axon extension involved in axon guidance(GO:0048843) negative regulation of axon guidance(GO:1902668) |
| 0.6 |
1.3 |
GO:0003406 |
retinal pigment epithelium development(GO:0003406) |
| 0.6 |
2.5 |
GO:0070278 |
extracellular matrix constituent secretion(GO:0070278) |
| 0.6 |
1.9 |
GO:0072092 |
ureteric bud invasion(GO:0072092) |
| 0.6 |
2.5 |
GO:0016340 |
calcium-dependent cell-matrix adhesion(GO:0016340) |
| 0.6 |
0.6 |
GO:2000074 |
regulation of type B pancreatic cell development(GO:2000074) |
| 0.6 |
1.9 |
GO:0016561 |
protein import into peroxisome matrix, translocation(GO:0016561) |
| 0.6 |
8.7 |
GO:0006182 |
cGMP biosynthetic process(GO:0006182) |
| 0.6 |
1.9 |
GO:0007193 |
adenylate cyclase-inhibiting G-protein coupled receptor signaling pathway(GO:0007193) |
| 0.6 |
1.2 |
GO:0051892 |
negative regulation of cardioblast differentiation(GO:0051892) |
| 0.6 |
17.3 |
GO:0046854 |
phosphatidylinositol phosphorylation(GO:0046854) |
| 0.6 |
9.3 |
GO:0045717 |
negative regulation of fatty acid biosynthetic process(GO:0045717) |
| 0.6 |
7.4 |
GO:0090140 |
regulation of mitochondrial fission(GO:0090140) |
| 0.6 |
1.2 |
GO:0061043 |
regulation of vascular wound healing(GO:0061043) |
| 0.6 |
4.9 |
GO:0010832 |
negative regulation of myotube differentiation(GO:0010832) |
| 0.6 |
3.7 |
GO:0006622 |
protein targeting to lysosome(GO:0006622) |
| 0.6 |
1.8 |
GO:2000983 |
regulation of ATP citrate synthase activity(GO:2000983) negative regulation of ATP citrate synthase activity(GO:2000984) |
| 0.6 |
2.4 |
GO:0072362 |
regulation of glycolytic process by regulation of transcription from RNA polymerase II promoter(GO:0072361) regulation of glycolytic process by negative regulation of transcription from RNA polymerase II promoter(GO:0072362) |
| 0.6 |
5.5 |
GO:0090385 |
phagosome-lysosome fusion(GO:0090385) |
| 0.6 |
3.0 |
GO:0010640 |
regulation of platelet-derived growth factor receptor signaling pathway(GO:0010640) |
| 0.6 |
4.8 |
GO:0000042 |
protein targeting to Golgi(GO:0000042) |
| 0.6 |
2.4 |
GO:0045627 |
positive regulation of T-helper 1 cell differentiation(GO:0045627) |
| 0.6 |
0.6 |
GO:0070070 |
proton-transporting V-type ATPase complex assembly(GO:0070070) |
| 0.6 |
4.8 |
GO:0042572 |
retinol metabolic process(GO:0042572) |
| 0.6 |
1.8 |
GO:0072602 |
interleukin-4 secretion(GO:0072602) |
| 0.6 |
3.6 |
GO:0018344 |
protein geranylgeranylation(GO:0018344) |
| 0.6 |
2.4 |
GO:0071596 |
ubiquitin-dependent protein catabolic process via the N-end rule pathway(GO:0071596) |
| 0.6 |
4.2 |
GO:0032959 |
inositol trisphosphate biosynthetic process(GO:0032959) |
| 0.6 |
10.7 |
GO:0009268 |
response to pH(GO:0009268) |
| 0.6 |
1.8 |
GO:0006624 |
vacuolar protein processing(GO:0006624) |
| 0.6 |
1.8 |
GO:0051703 |
social behavior(GO:0035176) intraspecies interaction between organisms(GO:0051703) |
| 0.6 |
2.4 |
GO:0038128 |
ERBB2 signaling pathway(GO:0038128) |
| 0.6 |
4.7 |
GO:0071378 |
growth hormone receptor signaling pathway(GO:0060396) cellular response to growth hormone stimulus(GO:0071378) |
| 0.6 |
3.0 |
GO:0072318 |
clathrin coat disassembly(GO:0072318) |
| 0.6 |
2.9 |
GO:0045006 |
DNA deamination(GO:0045006) |
| 0.6 |
1.8 |
GO:0032957 |
inositol trisphosphate metabolic process(GO:0032957) |
| 0.6 |
0.6 |
GO:0010593 |
negative regulation of lamellipodium assembly(GO:0010593) |
| 0.6 |
5.2 |
GO:1903358 |
regulation of Golgi organization(GO:1903358) |
| 0.6 |
2.9 |
GO:0003093 |
regulation of glomerular filtration(GO:0003093) |
| 0.6 |
1.7 |
GO:0032693 |
negative regulation of interleukin-10 production(GO:0032693) |
| 0.6 |
5.2 |
GO:1904153 |
negative regulation of protein exit from endoplasmic reticulum(GO:0070862) negative regulation of retrograde protein transport, ER to cytosol(GO:1904153) |
| 0.6 |
1.7 |
GO:0006558 |
L-phenylalanine metabolic process(GO:0006558) erythrose 4-phosphate/phosphoenolpyruvate family amino acid metabolic process(GO:1902221) |
| 0.6 |
2.8 |
GO:1901678 |
iron coordination entity transport(GO:1901678) |
| 0.6 |
0.6 |
GO:0035622 |
intrahepatic bile duct development(GO:0035622) |
| 0.6 |
1.7 |
GO:0048148 |
behavioral response to cocaine(GO:0048148) |
| 0.6 |
1.7 |
GO:0042196 |
dichloromethane metabolic process(GO:0018900) chlorinated hydrocarbon metabolic process(GO:0042196) halogenated hydrocarbon metabolic process(GO:0042197) |
| 0.6 |
3.9 |
GO:0048169 |
regulation of long-term neuronal synaptic plasticity(GO:0048169) |
| 0.6 |
1.1 |
GO:0045794 |
negative regulation of cell volume(GO:0045794) |
| 0.6 |
0.6 |
GO:0045625 |
regulation of T-helper 1 cell differentiation(GO:0045625) |
| 0.6 |
2.8 |
GO:0002861 |
regulation of inflammatory response to antigenic stimulus(GO:0002861) |
| 0.6 |
1.1 |
GO:0021698 |
cerebellar cortex structural organization(GO:0021698) |
| 0.6 |
1.7 |
GO:0035526 |
retrograde transport, plasma membrane to Golgi(GO:0035526) |
| 0.5 |
2.2 |
GO:0055071 |
cellular manganese ion homeostasis(GO:0030026) Golgi calcium ion homeostasis(GO:0032468) manganese ion homeostasis(GO:0055071) |
| 0.5 |
1.6 |
GO:0061081 |
positive regulation of myeloid leukocyte cytokine production involved in immune response(GO:0061081) |
| 0.5 |
0.5 |
GO:0006668 |
sphinganine-1-phosphate metabolic process(GO:0006668) |
| 0.5 |
1.6 |
GO:0035864 |
response to potassium ion(GO:0035864) cellular response to potassium ion(GO:0035865) |
| 0.5 |
4.3 |
GO:0030578 |
PML body organization(GO:0030578) |
| 0.5 |
4.3 |
GO:0050654 |
chondroitin sulfate proteoglycan metabolic process(GO:0050654) |
| 0.5 |
1.1 |
GO:0042373 |
vitamin K metabolic process(GO:0042373) |
| 0.5 |
4.3 |
GO:0010544 |
negative regulation of platelet activation(GO:0010544) |
| 0.5 |
7.0 |
GO:0002115 |
store-operated calcium entry(GO:0002115) |
| 0.5 |
2.1 |
GO:0010724 |
regulation of definitive erythrocyte differentiation(GO:0010724) |
| 0.5 |
2.7 |
GO:1904754 |
positive regulation of vascular associated smooth muscle cell migration(GO:1904754) |
| 0.5 |
2.6 |
GO:0010025 |
wax biosynthetic process(GO:0010025) wax metabolic process(GO:0010166) |
| 0.5 |
10.6 |
GO:0095500 |
acetylcholine receptor signaling pathway(GO:0095500) postsynaptic signal transduction(GO:0098926) signal transduction involved in cellular response to ammonium ion(GO:1903831) response to acetylcholine(GO:1905144) cellular response to acetylcholine(GO:1905145) |
| 0.5 |
2.6 |
GO:0043314 |
negative regulation of neutrophil degranulation(GO:0043314) negative regulation of blood vessel remodeling(GO:0060313) |
| 0.5 |
8.4 |
GO:0007205 |
protein kinase C-activating G-protein coupled receptor signaling pathway(GO:0007205) |
| 0.5 |
0.5 |
GO:1901163 |
trophoblast cell migration(GO:0061450) regulation of trophoblast cell migration(GO:1901163) positive regulation of trophoblast cell migration(GO:1901165) |
| 0.5 |
2.6 |
GO:0071371 |
cellular response to gonadotropin stimulus(GO:0071371) |
| 0.5 |
3.1 |
GO:0006290 |
pyrimidine dimer repair(GO:0006290) |
| 0.5 |
0.5 |
GO:0032241 |
positive regulation of nucleobase-containing compound transport(GO:0032241) |
| 0.5 |
2.1 |
GO:0006538 |
glutamate catabolic process(GO:0006538) |
| 0.5 |
1.6 |
GO:0035964 |
COPI-coated vesicle budding(GO:0035964) |
| 0.5 |
4.1 |
GO:0014898 |
muscle hypertrophy in response to stress(GO:0003299) cardiac muscle hypertrophy in response to stress(GO:0014898) |
| 0.5 |
3.1 |
GO:0097576 |
autophagosome maturation(GO:0097352) vacuole fusion(GO:0097576) |
| 0.5 |
2.0 |
GO:0071692 |
protein localization to extracellular region(GO:0071692) maintenance of protein location in extracellular region(GO:0071694) |
| 0.5 |
1.5 |
GO:0030070 |
insulin processing(GO:0030070) |
| 0.5 |
0.5 |
GO:1902474 |
positive regulation of protein localization to synapse(GO:1902474) |
| 0.5 |
0.5 |
GO:0060080 |
inhibitory postsynaptic potential(GO:0060080) |
| 0.5 |
2.5 |
GO:1903361 |
protein localization to basolateral plasma membrane(GO:1903361) |
| 0.5 |
8.1 |
GO:0019835 |
cytolysis(GO:0019835) |
| 0.5 |
1.5 |
GO:0018214 |
peptidyl-glutamic acid carboxylation(GO:0017187) protein carboxylation(GO:0018214) |
| 0.5 |
3.5 |
GO:0006102 |
isocitrate metabolic process(GO:0006102) |
| 0.5 |
1.0 |
GO:0090148 |
membrane fission(GO:0090148) |
| 0.5 |
3.0 |
GO:0098789 |
pre-mRNA cleavage required for polyadenylation(GO:0098789) |
| 0.5 |
2.5 |
GO:0043569 |
negative regulation of insulin-like growth factor receptor signaling pathway(GO:0043569) |
| 0.5 |
2.0 |
GO:0071376 |
response to corticotropin-releasing hormone(GO:0043435) cellular response to corticotropin-releasing hormone stimulus(GO:0071376) |
| 0.5 |
1.5 |
GO:0036072 |
intramembranous ossification(GO:0001957) direct ossification(GO:0036072) |
| 0.5 |
1.0 |
GO:0070166 |
enamel mineralization(GO:0070166) |
| 0.5 |
2.5 |
GO:0071955 |
recycling endosome to Golgi transport(GO:0071955) |
| 0.5 |
3.0 |
GO:0044252 |
negative regulation of multicellular organismal metabolic process(GO:0044252) |
| 0.5 |
2.4 |
GO:0090336 |
positive regulation of brown fat cell differentiation(GO:0090336) |
| 0.5 |
1.9 |
GO:0030836 |
positive regulation of actin filament depolymerization(GO:0030836) |
| 0.5 |
1.0 |
GO:0021812 |
neuronal-glial interaction involved in cerebral cortex radial glia guided migration(GO:0021812) |
| 0.5 |
1.4 |
GO:0035902 |
response to immobilization stress(GO:0035902) |
| 0.5 |
0.5 |
GO:0035441 |
cell migration involved in vasculogenesis(GO:0035441) |
| 0.5 |
1.4 |
GO:0015882 |
L-ascorbic acid transport(GO:0015882) transepithelial L-ascorbic acid transport(GO:0070904) |
| 0.5 |
1.4 |
GO:0001830 |
trophectodermal cell fate commitment(GO:0001830) |
| 0.5 |
8.3 |
GO:0033622 |
integrin activation(GO:0033622) |
| 0.5 |
1.4 |
GO:0051901 |
positive regulation of mitochondrial depolarization(GO:0051901) |
| 0.5 |
1.4 |
GO:0015791 |
polyol transport(GO:0015791) |
| 0.5 |
0.5 |
GO:0021523 |
somatic motor neuron differentiation(GO:0021523) |
| 0.5 |
4.1 |
GO:0090527 |
actin filament reorganization(GO:0090527) |
| 0.5 |
1.4 |
GO:0034454 |
microtubule anchoring at centrosome(GO:0034454) |
| 0.5 |
0.9 |
GO:0003094 |
glomerular filtration(GO:0003094) renal filtration(GO:0097205) |
| 0.4 |
3.6 |
GO:0061088 |
sequestering of zinc ion(GO:0032119) regulation of sequestering of zinc ion(GO:0061088) |
| 0.4 |
0.9 |
GO:0006650 |
glycerophospholipid metabolic process(GO:0006650) |
| 0.4 |
0.4 |
GO:0030240 |
skeletal muscle thin filament assembly(GO:0030240) |
| 0.4 |
11.1 |
GO:0007520 |
myoblast fusion(GO:0007520) |
| 0.4 |
1.3 |
GO:0010499 |
proteasomal ubiquitin-independent protein catabolic process(GO:0010499) |
| 0.4 |
8.4 |
GO:0015701 |
bicarbonate transport(GO:0015701) |
| 0.4 |
7.9 |
GO:0032469 |
endoplasmic reticulum calcium ion homeostasis(GO:0032469) |
| 0.4 |
4.0 |
GO:0070842 |
aggresome assembly(GO:0070842) |
| 0.4 |
2.6 |
GO:0010572 |
positive regulation of platelet activation(GO:0010572) |
| 0.4 |
1.8 |
GO:2000671 |
regulation of motor neuron apoptotic process(GO:2000671) |
| 0.4 |
3.1 |
GO:0032264 |
IMP salvage(GO:0032264) |
| 0.4 |
2.6 |
GO:0007220 |
Notch receptor processing(GO:0007220) |
| 0.4 |
0.9 |
GO:0006507 |
GPI anchor release(GO:0006507) |
| 0.4 |
15.9 |
GO:0051290 |
protein heterotetramerization(GO:0051290) |
| 0.4 |
0.4 |
GO:0072425 |
signal transduction involved in G2 DNA damage checkpoint(GO:0072425) signal transduction involved in mitotic G2 DNA damage checkpoint(GO:0072434) |
| 0.4 |
2.1 |
GO:0097084 |
vascular smooth muscle cell development(GO:0097084) |
| 0.4 |
0.9 |
GO:0010730 |
negative regulation of hydrogen peroxide metabolic process(GO:0010727) negative regulation of hydrogen peroxide biosynthetic process(GO:0010730) |
| 0.4 |
1.7 |
GO:1901623 |
regulation of lymphocyte chemotaxis(GO:1901623) |
| 0.4 |
3.0 |
GO:0072102 |
glomerulus morphogenesis(GO:0072102) |
| 0.4 |
1.3 |
GO:0043615 |
astrocyte cell migration(GO:0043615) |
| 0.4 |
4.2 |
GO:0010839 |
negative regulation of keratinocyte proliferation(GO:0010839) |
| 0.4 |
0.8 |
GO:0061588 |
calcium activated phospholipid scrambling(GO:0061588) calcium activated phosphatidylserine scrambling(GO:0061589) calcium activated phosphatidylcholine scrambling(GO:0061590) calcium activated galactosylceramide scrambling(GO:0061591) |
| 0.4 |
7.1 |
GO:1900153 |
regulation of nuclear-transcribed mRNA catabolic process, deadenylation-dependent decay(GO:1900151) positive regulation of nuclear-transcribed mRNA catabolic process, deadenylation-dependent decay(GO:1900153) |
| 0.4 |
4.6 |
GO:0090503 |
RNA phosphodiester bond hydrolysis, exonucleolytic(GO:0090503) |
| 0.4 |
2.5 |
GO:0035635 |
entry of bacterium into host cell(GO:0035635) regulation of entry of bacterium into host cell(GO:2000535) |
| 0.4 |
3.3 |
GO:0071569 |
protein ufmylation(GO:0071569) |
| 0.4 |
1.2 |
GO:0060800 |
regulation of cell differentiation involved in embryonic placenta development(GO:0060800) |
| 0.4 |
8.7 |
GO:0015991 |
energy coupled proton transmembrane transport, against electrochemical gradient(GO:0015988) ATP hydrolysis coupled proton transport(GO:0015991) ATP hydrolysis coupled transmembrane transport(GO:0090662) |
| 0.4 |
13.9 |
GO:0006890 |
retrograde vesicle-mediated transport, Golgi to ER(GO:0006890) |
| 0.4 |
0.8 |
GO:0045113 |
regulation of integrin biosynthetic process(GO:0045113) |
| 0.4 |
5.7 |
GO:0008333 |
endosome to lysosome transport(GO:0008333) |
| 0.4 |
0.8 |
GO:0046007 |
negative regulation of activated T cell proliferation(GO:0046007) |
| 0.4 |
1.2 |
GO:0048505 |
regulation of timing of cell differentiation(GO:0048505) |
| 0.4 |
2.0 |
GO:1900748 |
positive regulation of vascular endothelial growth factor signaling pathway(GO:1900748) |
| 0.4 |
2.8 |
GO:0035249 |
synaptic transmission, glutamatergic(GO:0035249) |
| 0.4 |
2.4 |
GO:0015919 |
peroxisomal membrane transport(GO:0015919) protein import into peroxisome membrane(GO:0045046) |
| 0.4 |
39.3 |
GO:0071805 |
potassium ion transmembrane transport(GO:0071805) |
| 0.4 |
3.2 |
GO:0043496 |
regulation of protein homodimerization activity(GO:0043496) |
| 0.4 |
4.7 |
GO:0090161 |
Golgi ribbon formation(GO:0090161) |
| 0.4 |
1.6 |
GO:0006958 |
complement activation, classical pathway(GO:0006958) |
| 0.4 |
3.1 |
GO:0007271 |
synaptic transmission, cholinergic(GO:0007271) |
| 0.4 |
0.4 |
GO:0043300 |
regulation of leukocyte degranulation(GO:0043300) |
| 0.4 |
1.2 |
GO:0035826 |
rubidium ion transport(GO:0035826) regulation of rubidium ion transport(GO:2000680) |
| 0.4 |
1.2 |
GO:1903861 |
regulation of dendrite extension(GO:1903859) positive regulation of dendrite extension(GO:1903861) |
| 0.4 |
15.9 |
GO:0031338 |
regulation of vesicle fusion(GO:0031338) |
| 0.4 |
2.3 |
GO:0023021 |
termination of signal transduction(GO:0023021) |
| 0.4 |
16.9 |
GO:0051965 |
positive regulation of synapse assembly(GO:0051965) |
| 0.4 |
3.8 |
GO:0051103 |
DNA ligation involved in DNA repair(GO:0051103) |
| 0.4 |
1.1 |
GO:1900042 |
positive regulation of interleukin-2 secretion(GO:1900042) |
| 0.4 |
1.5 |
GO:1900028 |
negative regulation of ruffle assembly(GO:1900028) |
| 0.4 |
0.8 |
GO:0061462 |
protein localization to lysosome(GO:0061462) |
| 0.4 |
0.8 |
GO:0006681 |
galactosylceramide metabolic process(GO:0006681) galactolipid metabolic process(GO:0019374) |
| 0.4 |
0.4 |
GO:2001181 |
positive regulation of interleukin-10 secretion(GO:2001181) |
| 0.4 |
1.1 |
GO:2000574 |
regulation of microtubule motor activity(GO:2000574) |
| 0.4 |
0.4 |
GO:0060052 |
neurofilament cytoskeleton organization(GO:0060052) |
| 0.4 |
0.7 |
GO:0035590 |
purinergic nucleotide receptor signaling pathway(GO:0035590) |
| 0.4 |
5.2 |
GO:0042759 |
long-chain fatty acid biosynthetic process(GO:0042759) |
| 0.4 |
1.1 |
GO:1902044 |
regulation of Fas signaling pathway(GO:1902044) negative regulation of Fas signaling pathway(GO:1902045) |
| 0.4 |
1.1 |
GO:0006895 |
Golgi to endosome transport(GO:0006895) |
| 0.4 |
1.5 |
GO:0010756 |
regulation of plasminogen activation(GO:0010755) positive regulation of plasminogen activation(GO:0010756) |
| 0.4 |
1.5 |
GO:0002281 |
macrophage activation involved in immune response(GO:0002281) |
| 0.4 |
1.8 |
GO:0016242 |
negative regulation of macroautophagy(GO:0016242) |
| 0.4 |
0.4 |
GO:0002035 |
brain renin-angiotensin system(GO:0002035) |
| 0.4 |
0.7 |
GO:0008228 |
opsonization(GO:0008228) |
| 0.4 |
0.7 |
GO:1903071 |
positive regulation of ER-associated ubiquitin-dependent protein catabolic process(GO:1903071) |
| 0.4 |
0.7 |
GO:0021933 |
radial glia guided migration of cerebellar granule cell(GO:0021933) |
| 0.4 |
3.6 |
GO:0009072 |
aromatic amino acid family metabolic process(GO:0009072) |
| 0.4 |
2.1 |
GO:0035428 |
hexose transmembrane transport(GO:0035428) |
| 0.4 |
0.4 |
GO:0051534 |
negative regulation of NFAT protein import into nucleus(GO:0051534) |
| 0.4 |
10.3 |
GO:0007032 |
endosome organization(GO:0007032) |
| 0.4 |
0.7 |
GO:0071218 |
cellular response to misfolded protein(GO:0071218) |
| 0.3 |
1.7 |
GO:1900095 |
regulation of dosage compensation by inactivation of X chromosome(GO:1900095) |
| 0.3 |
1.4 |
GO:0006382 |
adenosine to inosine editing(GO:0006382) |
| 0.3 |
1.0 |
GO:1900194 |
negative regulation of oocyte development(GO:0060283) negative regulation of oocyte maturation(GO:1900194) |
| 0.3 |
2.1 |
GO:0061635 |
regulation of protein complex stability(GO:0061635) |
| 0.3 |
3.1 |
GO:0006904 |
vesicle docking involved in exocytosis(GO:0006904) |
| 0.3 |
0.3 |
GO:1903525 |
regulation of membrane tubulation(GO:1903525) |
| 0.3 |
2.0 |
GO:0070932 |
histone H3 deacetylation(GO:0070932) |
| 0.3 |
7.7 |
GO:0003333 |
amino acid transmembrane transport(GO:0003333) |
| 0.3 |
0.7 |
GO:0019372 |
lipoxygenase pathway(GO:0019372) |
| 0.3 |
0.7 |
GO:0045657 |
positive regulation of monocyte differentiation(GO:0045657) |
| 0.3 |
0.7 |
GO:1904694 |
negative regulation of vascular smooth muscle contraction(GO:1904694) |
| 0.3 |
1.3 |
GO:0014010 |
Schwann cell proliferation(GO:0014010) |
| 0.3 |
1.0 |
GO:0034983 |
peptidyl-lysine deacetylation(GO:0034983) |
| 0.3 |
2.3 |
GO:0006903 |
vesicle targeting(GO:0006903) |
| 0.3 |
0.3 |
GO:0042045 |
epithelial fluid transport(GO:0042045) |
| 0.3 |
2.0 |
GO:0061718 |
NADH regeneration(GO:0006735) canonical glycolysis(GO:0061621) glucose catabolic process to pyruvate(GO:0061718) |
| 0.3 |
0.7 |
GO:0035021 |
negative regulation of Rac protein signal transduction(GO:0035021) |
| 0.3 |
1.0 |
GO:2000628 |
regulation of miRNA metabolic process(GO:2000628) |
| 0.3 |
5.2 |
GO:0033344 |
cholesterol efflux(GO:0033344) |
| 0.3 |
2.0 |
GO:0006646 |
phosphatidylethanolamine biosynthetic process(GO:0006646) |
| 0.3 |
1.3 |
GO:0010524 |
positive regulation of calcium ion transport into cytosol(GO:0010524) |
| 0.3 |
5.5 |
GO:0045773 |
positive regulation of axon extension(GO:0045773) |
| 0.3 |
1.6 |
GO:0046501 |
protoporphyrinogen IX metabolic process(GO:0046501) |
| 0.3 |
2.3 |
GO:0042523 |
positive regulation of tyrosine phosphorylation of Stat5 protein(GO:0042523) |
| 0.3 |
0.3 |
GO:0002488 |
antigen processing and presentation of endogenous peptide antigen via MHC class Ib via ER pathway(GO:0002488) antigen processing and presentation of endogenous peptide antigen via MHC class Ib via ER pathway, TAP-dependent(GO:0002489) |
| 0.3 |
3.9 |
GO:0042182 |
ketone catabolic process(GO:0042182) |
| 0.3 |
2.9 |
GO:0018095 |
protein polyglutamylation(GO:0018095) |
| 0.3 |
1.9 |
GO:2000369 |
regulation of clathrin-mediated endocytosis(GO:2000369) |
| 0.3 |
0.6 |
GO:0019401 |
alditol biosynthetic process(GO:0019401) |
| 0.3 |
0.3 |
GO:2000823 |
regulation of androgen receptor activity(GO:2000823) |
| 0.3 |
2.9 |
GO:1904262 |
negative regulation of TORC1 signaling(GO:1904262) |
| 0.3 |
0.6 |
GO:1903895 |
negative regulation of IRE1-mediated unfolded protein response(GO:1903895) |
| 0.3 |
0.9 |
GO:0046900 |
tetrahydrofolylpolyglutamate metabolic process(GO:0046900) |
| 0.3 |
0.6 |
GO:0044034 |
negative stranded viral RNA replication(GO:0039689) multi-organism biosynthetic process(GO:0044034) |
| 0.3 |
0.3 |
GO:0042939 |
glutathione transport(GO:0034635) tripeptide transport(GO:0042939) |
| 0.3 |
0.9 |
GO:1902172 |
keratinocyte apoptotic process(GO:0097283) regulation of keratinocyte apoptotic process(GO:1902172) |
| 0.3 |
1.6 |
GO:0051930 |
regulation of sensory perception of pain(GO:0051930) regulation of sensory perception(GO:0051931) |
| 0.3 |
0.9 |
GO:0019085 |
early viral transcription(GO:0019085) |
| 0.3 |
1.2 |
GO:0006741 |
NADP biosynthetic process(GO:0006741) |
| 0.3 |
2.8 |
GO:0050687 |
negative regulation of defense response to virus(GO:0050687) |
| 0.3 |
0.3 |
GO:0060693 |
regulation of branching involved in salivary gland morphogenesis(GO:0060693) |
| 0.3 |
1.2 |
GO:0033578 |
protein glycosylation in Golgi(GO:0033578) |
| 0.3 |
1.5 |
GO:0097264 |
self proteolysis(GO:0097264) |
| 0.3 |
0.6 |
GO:0071787 |
endoplasmic reticulum tubular network assembly(GO:0071787) |
| 0.3 |
2.1 |
GO:0032757 |
positive regulation of interleukin-8 production(GO:0032757) |
| 0.3 |
0.6 |
GO:2000409 |
positive regulation of T cell extravasation(GO:2000409) |
| 0.3 |
3.8 |
GO:0008210 |
estrogen metabolic process(GO:0008210) |
| 0.3 |
3.8 |
GO:0042417 |
dopamine metabolic process(GO:0042417) |
| 0.3 |
1.2 |
GO:0031953 |
negative regulation of protein autophosphorylation(GO:0031953) |
| 0.3 |
0.6 |
GO:0035372 |
protein localization to microtubule(GO:0035372) |
| 0.3 |
1.2 |
GO:0042796 |
snRNA transcription from RNA polymerase III promoter(GO:0042796) |
| 0.3 |
8.1 |
GO:0010508 |
positive regulation of autophagy(GO:0010508) |
| 0.3 |
1.4 |
GO:0009247 |
glycolipid biosynthetic process(GO:0009247) |
| 0.3 |
8.1 |
GO:0046580 |
negative regulation of Ras protein signal transduction(GO:0046580) negative regulation of small GTPase mediated signal transduction(GO:0051058) |
| 0.3 |
2.6 |
GO:0061014 |
positive regulation of mRNA catabolic process(GO:0061014) |
| 0.3 |
3.4 |
GO:0035414 |
negative regulation of catenin import into nucleus(GO:0035414) |
| 0.3 |
0.9 |
GO:0051026 |
chiasma assembly(GO:0051026) |
| 0.3 |
4.2 |
GO:0009081 |
branched-chain amino acid metabolic process(GO:0009081) |
| 0.3 |
0.6 |
GO:1901491 |
negative regulation of lymphangiogenesis(GO:1901491) |
| 0.3 |
1.7 |
GO:2000114 |
regulation of establishment of cell polarity(GO:2000114) |
| 0.3 |
0.6 |
GO:0043302 |
positive regulation of leukocyte degranulation(GO:0043302) |
| 0.3 |
2.8 |
GO:2000741 |
positive regulation of mesenchymal stem cell differentiation(GO:2000741) |
| 0.3 |
1.7 |
GO:0007016 |
cytoskeletal anchoring at plasma membrane(GO:0007016) |
| 0.3 |
0.8 |
GO:0007041 |
lysosomal transport(GO:0007041) |
| 0.3 |
0.3 |
GO:0010847 |
regulation of chromatin assembly(GO:0010847) |
| 0.3 |
2.8 |
GO:0010758 |
regulation of macrophage chemotaxis(GO:0010758) |
| 0.3 |
2.2 |
GO:0090084 |
negative regulation of inclusion body assembly(GO:0090084) |
| 0.3 |
1.6 |
GO:0051150 |
regulation of smooth muscle cell differentiation(GO:0051150) |
| 0.3 |
0.5 |
GO:0043030 |
regulation of macrophage activation(GO:0043030) |
| 0.3 |
0.8 |
GO:0051031 |
tRNA transport(GO:0051031) |
| 0.3 |
1.6 |
GO:1901385 |
regulation of voltage-gated calcium channel activity(GO:1901385) |
| 0.3 |
0.8 |
GO:0032815 |
negative regulation of natural killer cell activation(GO:0032815) |
| 0.3 |
5.5 |
GO:0007218 |
neuropeptide signaling pathway(GO:0007218) |
| 0.3 |
1.8 |
GO:0098532 |
histone H3-K27 trimethylation(GO:0098532) |
| 0.3 |
3.4 |
GO:0008209 |
androgen metabolic process(GO:0008209) |
| 0.3 |
1.8 |
GO:0042126 |
nitrate metabolic process(GO:0042126) |
| 0.3 |
1.3 |
GO:0000301 |
retrograde transport, vesicle recycling within Golgi(GO:0000301) |
| 0.3 |
5.2 |
GO:0051647 |
nucleus localization(GO:0051647) |
| 0.3 |
12.4 |
GO:0006836 |
neurotransmitter transport(GO:0006836) |
| 0.3 |
1.0 |
GO:0002347 |
response to tumor cell(GO:0002347) |
| 0.3 |
1.0 |
GO:0032411 |
positive regulation of transporter activity(GO:0032411) |
| 0.3 |
0.5 |
GO:0018199 |
peptidyl-glutamine modification(GO:0018199) |
| 0.3 |
1.0 |
GO:0060576 |
intestinal epithelial cell development(GO:0060576) |
| 0.3 |
0.3 |
GO:1902534 |
single-organism membrane invagination(GO:1902534) |
| 0.2 |
0.5 |
GO:2001170 |
negative regulation of ATP biosynthetic process(GO:2001170) |
| 0.2 |
0.7 |
GO:0018094 |
protein polyglycylation(GO:0018094) |
| 0.2 |
7.8 |
GO:0031146 |
SCF-dependent proteasomal ubiquitin-dependent protein catabolic process(GO:0031146) |
| 0.2 |
1.7 |
GO:0015862 |
uridine transport(GO:0015862) |
| 0.2 |
1.2 |
GO:0006003 |
fructose 2,6-bisphosphate metabolic process(GO:0006003) |
| 0.2 |
1.2 |
GO:0021592 |
midbrain-hindbrain boundary morphogenesis(GO:0021555) fourth ventricle development(GO:0021592) initiation of neural tube closure(GO:0021993) |
| 0.2 |
3.6 |
GO:0033539 |
fatty acid beta-oxidation using acyl-CoA dehydrogenase(GO:0033539) |
| 0.2 |
0.5 |
GO:0071285 |
cellular response to lithium ion(GO:0071285) |
| 0.2 |
0.7 |
GO:0002692 |
negative regulation of cellular extravasation(GO:0002692) |
| 0.2 |
1.6 |
GO:1903301 |
positive regulation of glucokinase activity(GO:0033133) positive regulation of hexokinase activity(GO:1903301) |
| 0.2 |
0.9 |
GO:0045842 |
positive regulation of mitotic metaphase/anaphase transition(GO:0045842) positive regulation of metaphase/anaphase transition of cell cycle(GO:1902101) |
| 0.2 |
1.6 |
GO:0035994 |
response to muscle stretch(GO:0035994) |
| 0.2 |
0.9 |
GO:0090219 |
negative regulation of lipid kinase activity(GO:0090219) |
| 0.2 |
1.2 |
GO:0060665 |
regulation of branching involved in salivary gland morphogenesis by mesenchymal-epithelial signaling(GO:0060665) |
| 0.2 |
1.1 |
GO:0034219 |
carbohydrate transmembrane transport(GO:0034219) |
| 0.2 |
1.1 |
GO:0048246 |
macrophage chemotaxis(GO:0048246) |
| 0.2 |
6.4 |
GO:0016578 |
histone deubiquitination(GO:0016578) |
| 0.2 |
0.5 |
GO:0006116 |
NADH oxidation(GO:0006116) |
| 0.2 |
1.4 |
GO:0007416 |
synapse assembly(GO:0007416) |
| 0.2 |
0.9 |
GO:0034047 |
regulation of protein phosphatase type 2A activity(GO:0034047) |
| 0.2 |
1.6 |
GO:0055090 |
acylglycerol homeostasis(GO:0055090) triglyceride homeostasis(GO:0070328) |
| 0.2 |
13.6 |
GO:0010923 |
negative regulation of phosphatase activity(GO:0010923) |
| 0.2 |
0.5 |
GO:0031268 |
pseudopodium organization(GO:0031268) |
| 0.2 |
1.8 |
GO:1901621 |
negative regulation of smoothened signaling pathway involved in dorsal/ventral neural tube patterning(GO:1901621) |
| 0.2 |
0.7 |
GO:0070589 |
cell wall mannoprotein biosynthetic process(GO:0000032) mannoprotein metabolic process(GO:0006056) mannoprotein biosynthetic process(GO:0006057) cell wall glycoprotein biosynthetic process(GO:0031506) cell wall biogenesis(GO:0042546) cell wall macromolecule metabolic process(GO:0044036) cell wall macromolecule biosynthetic process(GO:0044038) chain elongation of O-linked mannose residue(GO:0044845) cellular component macromolecule biosynthetic process(GO:0070589) cell wall organization or biogenesis(GO:0071554) |
| 0.2 |
0.7 |
GO:0032148 |
activation of protein kinase B activity(GO:0032148) |
| 0.2 |
0.4 |
GO:1904431 |
positive regulation of t-circle formation(GO:1904431) |
| 0.2 |
4.8 |
GO:0046513 |
ceramide biosynthetic process(GO:0046513) |
| 0.2 |
2.2 |
GO:0051560 |
mitochondrial calcium ion homeostasis(GO:0051560) |
| 0.2 |
0.2 |
GO:0003219 |
cardiac right ventricle formation(GO:0003219) |
| 0.2 |
0.4 |
GO:0051088 |
PMA-inducible membrane protein ectodomain proteolysis(GO:0051088) |
| 0.2 |
0.9 |
GO:0010792 |
DNA double-strand break processing involved in repair via single-strand annealing(GO:0010792) |
| 0.2 |
2.8 |
GO:2001014 |
regulation of skeletal muscle cell differentiation(GO:2001014) |
| 0.2 |
0.6 |
GO:0043117 |
positive regulation of vascular permeability(GO:0043117) |
| 0.2 |
4.5 |
GO:0006829 |
zinc II ion transport(GO:0006829) |
| 0.2 |
0.2 |
GO:0034124 |
regulation of MyD88-dependent toll-like receptor signaling pathway(GO:0034124) |
| 0.2 |
4.1 |
GO:0001881 |
receptor recycling(GO:0001881) |
| 0.2 |
2.4 |
GO:0015844 |
monoamine transport(GO:0015844) |
| 0.2 |
0.6 |
GO:0019676 |
ammonia assimilation cycle(GO:0019676) |
| 0.2 |
1.0 |
GO:1904491 |
protein localization to ciliary transition zone(GO:1904491) |
| 0.2 |
0.8 |
GO:1900119 |
positive regulation of execution phase of apoptosis(GO:1900119) |
| 0.2 |
0.6 |
GO:0051967 |
negative regulation of synaptic transmission, glutamatergic(GO:0051967) |
| 0.2 |
0.4 |
GO:0010726 |
positive regulation of hydrogen peroxide metabolic process(GO:0010726) |
| 0.2 |
0.4 |
GO:0061055 |
myotome development(GO:0061055) |
| 0.2 |
1.8 |
GO:0044804 |
nucleophagy(GO:0044804) |
| 0.2 |
1.8 |
GO:1990403 |
embryonic brain development(GO:1990403) |
| 0.2 |
0.4 |
GO:0019086 |
late viral transcription(GO:0019086) |
| 0.2 |
2.1 |
GO:0071470 |
cellular response to osmotic stress(GO:0071470) |
| 0.2 |
0.8 |
GO:0035280 |
miRNA loading onto RISC involved in gene silencing by miRNA(GO:0035280) |
| 0.2 |
1.2 |
GO:0051205 |
protein insertion into membrane(GO:0051205) |
| 0.2 |
0.6 |
GO:0035621 |
ER to Golgi ceramide transport(GO:0035621) ceramide transport(GO:0035627) |
| 0.2 |
0.4 |
GO:0030321 |
transepithelial chloride transport(GO:0030321) |
| 0.2 |
1.3 |
GO:0035767 |
endothelial cell chemotaxis(GO:0035767) |
| 0.2 |
1.5 |
GO:0035887 |
aortic smooth muscle cell differentiation(GO:0035887) |
| 0.2 |
2.3 |
GO:1900383 |
regulation of synaptic plasticity by receptor localization to synapse(GO:1900383) |
| 0.2 |
0.9 |
GO:1902047 |
polyamine transport(GO:0015846) polyamine transmembrane transport(GO:1902047) regulation of polyamine transmembrane transport(GO:1902267) |
| 0.2 |
1.1 |
GO:0051014 |
actin filament severing(GO:0051014) |
| 0.2 |
0.2 |
GO:0030813 |
positive regulation of nucleotide catabolic process(GO:0030813) positive regulation of glycolytic process(GO:0045821) positive regulation of cofactor metabolic process(GO:0051194) positive regulation of coenzyme metabolic process(GO:0051197) |
| 0.2 |
0.6 |
GO:1901186 |
positive regulation of ERBB signaling pathway(GO:1901186) |
| 0.2 |
1.9 |
GO:0046697 |
decidualization(GO:0046697) |
| 0.2 |
0.6 |
GO:1903887 |
motile primary cilium assembly(GO:1903887) |
| 0.2 |
1.3 |
GO:0032292 |
myelination in peripheral nervous system(GO:0022011) peripheral nervous system axon ensheathment(GO:0032292) |
| 0.2 |
0.6 |
GO:0035552 |
oxidative single-stranded DNA demethylation(GO:0035552) |
| 0.2 |
0.5 |
GO:0034184 |
positive regulation of maintenance of sister chromatid cohesion(GO:0034093) positive regulation of maintenance of mitotic sister chromatid cohesion(GO:0034184) |
| 0.2 |
0.5 |
GO:0060708 |
spongiotrophoblast differentiation(GO:0060708) |
| 0.2 |
0.5 |
GO:1901550 |
regulation of endothelial cell development(GO:1901550) regulation of establishment of endothelial barrier(GO:1903140) |
| 0.2 |
0.4 |
GO:0051902 |
negative regulation of mitochondrial depolarization(GO:0051902) negative regulation of membrane depolarization(GO:1904180) regulation of caveolin-mediated endocytosis(GO:2001286) |
| 0.2 |
1.1 |
GO:1903961 |
positive regulation of plasma membrane long-chain fatty acid transport(GO:0010747) positive regulation of anion transmembrane transport(GO:1903961) |
| 0.2 |
0.5 |
GO:0045654 |
positive regulation of megakaryocyte differentiation(GO:0045654) |
| 0.2 |
3.0 |
GO:0070536 |
protein K63-linked deubiquitination(GO:0070536) |
| 0.2 |
1.6 |
GO:0031115 |
negative regulation of microtubule polymerization(GO:0031115) |
| 0.2 |
0.4 |
GO:0061013 |
regulation of mRNA catabolic process(GO:0061013) |
| 0.2 |
0.5 |
GO:0051791 |
medium-chain fatty acid metabolic process(GO:0051791) medium-chain fatty acid biosynthetic process(GO:0051792) |
| 0.2 |
2.1 |
GO:0006744 |
ubiquinone biosynthetic process(GO:0006744) quinone biosynthetic process(GO:1901663) |
| 0.2 |
0.2 |
GO:0008626 |
granzyme-mediated apoptotic signaling pathway(GO:0008626) |
| 0.2 |
2.5 |
GO:0031279 |
regulation of cyclase activity(GO:0031279) |
| 0.2 |
0.5 |
GO:0000185 |
activation of MAPKKK activity(GO:0000185) |
| 0.2 |
1.4 |
GO:0072583 |
clathrin-mediated endocytosis(GO:0072583) |
| 0.2 |
0.5 |
GO:0010884 |
positive regulation of lipid storage(GO:0010884) |
| 0.2 |
1.4 |
GO:0031333 |
negative regulation of protein complex assembly(GO:0031333) |
| 0.2 |
0.3 |
GO:0035729 |
response to hepatocyte growth factor(GO:0035728) cellular response to hepatocyte growth factor stimulus(GO:0035729) |
| 0.2 |
0.7 |
GO:0021942 |
radial glia guided migration of Purkinje cell(GO:0021942) |
| 0.2 |
0.7 |
GO:0006527 |
arginine catabolic process(GO:0006527) |
| 0.2 |
0.8 |
GO:0036230 |
granulocyte activation(GO:0036230) |
| 0.2 |
0.5 |
GO:0001827 |
inner cell mass cell fate commitment(GO:0001827) |
| 0.2 |
0.7 |
GO:0015959 |
diadenosine polyphosphate metabolic process(GO:0015959) |
| 0.2 |
0.7 |
GO:0051189 |
Mo-molybdopterin cofactor biosynthetic process(GO:0006777) Mo-molybdopterin cofactor metabolic process(GO:0019720) molybdopterin cofactor biosynthetic process(GO:0032324) molybdopterin cofactor metabolic process(GO:0043545) prosthetic group metabolic process(GO:0051189) |
| 0.2 |
0.2 |
GO:0036115 |
fatty-acyl-CoA catabolic process(GO:0036115) |
| 0.2 |
0.6 |
GO:0097393 |
regulation of maintenance of sister chromatid cohesion(GO:0034091) negative regulation of maintenance of sister chromatid cohesion(GO:0034092) regulation of maintenance of mitotic sister chromatid cohesion(GO:0034182) negative regulation of maintenance of mitotic sister chromatid cohesion(GO:0034183) post-embryonic appendage morphogenesis(GO:0035120) post-embryonic limb morphogenesis(GO:0035127) post-embryonic forelimb morphogenesis(GO:0035128) telomeric repeat-containing RNA transcription(GO:0097393) telomeric repeat-containing RNA transcription from RNA pol II promoter(GO:0097394) maintenance of mitotic sister chromatid cohesion, telomeric(GO:0099403) mitotic sister chromatid cohesion, telomeric(GO:0099404) regulation of telomeric RNA transcription from RNA pol II promoter(GO:1901580) negative regulation of telomeric RNA transcription from RNA pol II promoter(GO:1901581) positive regulation of telomeric RNA transcription from RNA pol II promoter(GO:1901582) regulation of maintenance of mitotic sister chromatid cohesion, telomeric(GO:1904907) negative regulation of maintenance of mitotic sister chromatid cohesion, telomeric(GO:1904908) |
| 0.2 |
0.8 |
GO:0015697 |
quaternary ammonium group transport(GO:0015697) |
| 0.2 |
0.3 |
GO:0061511 |
centriole elongation(GO:0061511) |
| 0.2 |
0.5 |
GO:2000651 |
positive regulation of sodium ion transmembrane transporter activity(GO:2000651) |
| 0.2 |
0.5 |
GO:0031038 |
myosin II filament organization(GO:0031038) regulation of myosin II filament organization(GO:0043519) |
| 0.2 |
1.3 |
GO:0097460 |
ferrous iron import into cell(GO:0097460) |
| 0.2 |
1.4 |
GO:0050805 |
negative regulation of synaptic transmission(GO:0050805) |
| 0.2 |
0.3 |
GO:0045075 |
interleukin-12 biosynthetic process(GO:0042090) regulation of interleukin-12 biosynthetic process(GO:0045075) |
| 0.2 |
0.5 |
GO:0072643 |
interferon-gamma secretion(GO:0072643) |
| 0.2 |
0.3 |
GO:0046886 |
positive regulation of hormone metabolic process(GO:0032352) positive regulation of hormone biosynthetic process(GO:0046886) |
| 0.2 |
1.2 |
GO:0051016 |
barbed-end actin filament capping(GO:0051016) |
| 0.2 |
2.2 |
GO:0009214 |
cyclic nucleotide catabolic process(GO:0009214) |
| 0.2 |
0.5 |
GO:0006481 |
C-terminal protein methylation(GO:0006481) |
| 0.2 |
2.4 |
GO:0030970 |
retrograde protein transport, ER to cytosol(GO:0030970) |
| 0.2 |
0.3 |
GO:0035434 |
copper ion transmembrane transport(GO:0035434) |
| 0.1 |
0.6 |
GO:0090239 |
regulation of histone H4 acetylation(GO:0090239) |
| 0.1 |
0.1 |
GO:0061188 |
regulation of chromatin silencing at rDNA(GO:0061187) negative regulation of chromatin silencing at rDNA(GO:0061188) |
| 0.1 |
0.4 |
GO:0018149 |
peptide cross-linking(GO:0018149) |
| 0.1 |
0.7 |
GO:0000727 |
double-strand break repair via break-induced replication(GO:0000727) |
| 0.1 |
0.7 |
GO:0006041 |
glucosamine metabolic process(GO:0006041) |
| 0.1 |
0.3 |
GO:0045053 |
protein retention in Golgi apparatus(GO:0045053) |
| 0.1 |
0.1 |
GO:1901187 |
regulation of ephrin receptor signaling pathway(GO:1901187) |
| 0.1 |
0.7 |
GO:0006363 |
termination of RNA polymerase I transcription(GO:0006363) |
| 0.1 |
0.4 |
GO:0035092 |
sperm chromatin condensation(GO:0035092) |
| 0.1 |
0.7 |
GO:0071028 |
nuclear RNA surveillance(GO:0071027) nuclear mRNA surveillance(GO:0071028) |
| 0.1 |
0.7 |
GO:0042158 |
lipoprotein biosynthetic process(GO:0042158) |
| 0.1 |
0.6 |
GO:0042167 |
heme catabolic process(GO:0042167) pigment catabolic process(GO:0046149) |
| 0.1 |
0.6 |
GO:0042574 |
retinal metabolic process(GO:0042574) |
| 0.1 |
0.4 |
GO:0043416 |
regulation of skeletal muscle tissue regeneration(GO:0043416) |
| 0.1 |
0.3 |
GO:0036120 |
cellular response to platelet-derived growth factor stimulus(GO:0036120) |
| 0.1 |
0.8 |
GO:1902236 |
negative regulation of endoplasmic reticulum stress-induced intrinsic apoptotic signaling pathway(GO:1902236) |
| 0.1 |
1.4 |
GO:0032965 |
regulation of collagen biosynthetic process(GO:0032965) |
| 0.1 |
0.1 |
GO:2000402 |
negative regulation of lymphocyte migration(GO:2000402) |
| 0.1 |
1.5 |
GO:0010507 |
negative regulation of autophagy(GO:0010507) |
| 0.1 |
1.1 |
GO:0006488 |
dolichol-linked oligosaccharide biosynthetic process(GO:0006488) |
| 0.1 |
0.7 |
GO:0071318 |
cellular response to ATP(GO:0071318) |
| 0.1 |
0.3 |
GO:0048265 |
response to pain(GO:0048265) |
| 0.1 |
1.1 |
GO:0051646 |
mitochondrion localization(GO:0051646) |
| 0.1 |
0.4 |
GO:0046208 |
spermine catabolic process(GO:0046208) |
| 0.1 |
0.9 |
GO:0046627 |
negative regulation of insulin receptor signaling pathway(GO:0046627) negative regulation of cellular response to insulin stimulus(GO:1900077) |
| 0.1 |
1.7 |
GO:0034315 |
regulation of Arp2/3 complex-mediated actin nucleation(GO:0034315) |
| 0.1 |
0.5 |
GO:0030948 |
negative regulation of vascular endothelial growth factor receptor signaling pathway(GO:0030948) |
| 0.1 |
3.4 |
GO:0010842 |
retina layer formation(GO:0010842) |
| 0.1 |
0.4 |
GO:0043461 |
proton-transporting ATP synthase complex assembly(GO:0043461) proton-transporting ATP synthase complex biogenesis(GO:0070272) |
| 0.1 |
1.5 |
GO:0043982 |
histone H4-K5 acetylation(GO:0043981) histone H4-K8 acetylation(GO:0043982) |
| 0.1 |
0.8 |
GO:0006266 |
DNA ligation(GO:0006266) |
| 0.1 |
1.1 |
GO:0018279 |
peptidyl-asparagine modification(GO:0018196) protein N-linked glycosylation via asparagine(GO:0018279) |
| 0.1 |
0.6 |
GO:0030579 |
ubiquitin-dependent SMAD protein catabolic process(GO:0030579) |
| 0.1 |
1.0 |
GO:0050995 |
negative regulation of lipid catabolic process(GO:0050995) |
| 0.1 |
0.4 |
GO:0032026 |
response to magnesium ion(GO:0032026) |
| 0.1 |
0.1 |
GO:1902358 |
sulfate transmembrane transport(GO:1902358) |
| 0.1 |
0.2 |
GO:0071985 |
multivesicular body sorting pathway(GO:0071985) |
| 0.1 |
3.3 |
GO:0000038 |
very long-chain fatty acid metabolic process(GO:0000038) |
| 0.1 |
0.1 |
GO:0061082 |
myeloid leukocyte cytokine production(GO:0061082) |
| 0.1 |
0.5 |
GO:0006896 |
Golgi to vacuole transport(GO:0006896) |
| 0.1 |
0.7 |
GO:1901673 |
regulation of mitotic spindle assembly(GO:1901673) |
| 0.1 |
0.2 |
GO:0035774 |
positive regulation of insulin secretion involved in cellular response to glucose stimulus(GO:0035774) |
| 0.1 |
0.4 |
GO:0033198 |
response to ATP(GO:0033198) |
| 0.1 |
0.2 |
GO:0002638 |
negative regulation of immunoglobulin production(GO:0002638) |
| 0.1 |
0.1 |
GO:0045346 |
regulation of MHC class II biosynthetic process(GO:0045346) negative regulation of MHC class II biosynthetic process(GO:0045347) |
| 0.1 |
0.7 |
GO:0019227 |
neuronal action potential propagation(GO:0019227) action potential propagation(GO:0098870) |
| 0.1 |
0.2 |
GO:0001573 |
ganglioside metabolic process(GO:0001573) |
| 0.1 |
0.6 |
GO:0051481 |
negative regulation of cytosolic calcium ion concentration(GO:0051481) |
| 0.1 |
2.7 |
GO:0006487 |
protein N-linked glycosylation(GO:0006487) |
| 0.1 |
0.7 |
GO:0032095 |
regulation of response to food(GO:0032095) |
| 0.1 |
0.1 |
GO:1902109 |
negative regulation of mitochondrial membrane permeability involved in apoptotic process(GO:1902109) |
| 0.1 |
0.2 |
GO:0032914 |
positive regulation of transforming growth factor beta1 production(GO:0032914) |
| 0.1 |
1.5 |
GO:0002495 |
antigen processing and presentation of peptide antigen via MHC class II(GO:0002495) antigen processing and presentation of peptide or polysaccharide antigen via MHC class II(GO:0002504) |
| 0.1 |
0.2 |
GO:2000973 |
regulation of pro-B cell differentiation(GO:2000973) |
| 0.1 |
0.3 |
GO:1904705 |
regulation of vascular smooth muscle cell proliferation(GO:1904705) vascular smooth muscle cell proliferation(GO:1990874) |
| 0.1 |
0.1 |
GO:0043652 |
engulfment of apoptotic cell(GO:0043652) |
| 0.1 |
0.2 |
GO:0048278 |
vesicle docking(GO:0048278) |
| 0.1 |
0.6 |
GO:0016559 |
peroxisome fission(GO:0016559) |
| 0.1 |
0.3 |
GO:0071257 |
cellular response to electrical stimulus(GO:0071257) |
| 0.1 |
0.2 |
GO:0002182 |
cytoplasmic translational elongation(GO:0002182) regulation of cytoplasmic translational elongation(GO:1900247) negative regulation of cytoplasmic translational elongation(GO:1900248) |
| 0.1 |
0.8 |
GO:1902042 |
negative regulation of extrinsic apoptotic signaling pathway via death domain receptors(GO:1902042) |
| 0.1 |
0.4 |
GO:0010543 |
regulation of platelet activation(GO:0010543) |
| 0.1 |
0.7 |
GO:0006054 |
N-acetylneuraminate metabolic process(GO:0006054) |
| 0.1 |
3.0 |
GO:0007156 |
homophilic cell adhesion via plasma membrane adhesion molecules(GO:0007156) |
| 0.1 |
0.1 |
GO:0061141 |
lung ciliated cell differentiation(GO:0061141) |
| 0.1 |
0.9 |
GO:0070475 |
rRNA base methylation(GO:0070475) |
| 0.1 |
0.2 |
GO:2000338 |
response to molecule of fungal origin(GO:0002238) positive regulation of chemokine biosynthetic process(GO:0045080) chemokine (C-X-C motif) ligand 1 production(GO:0072566) regulation of chemokine (C-X-C motif) ligand 1 production(GO:2000338) |
| 0.1 |
0.5 |
GO:0019236 |
response to pheromone(GO:0019236) |
| 0.1 |
0.3 |
GO:0007128 |
meiotic prophase I(GO:0007128) prophase(GO:0051324) meiotic cell cycle phase(GO:0098762) meiosis I cell cycle phase(GO:0098764) |
| 0.1 |
0.2 |
GO:0060392 |
negative regulation of SMAD protein import into nucleus(GO:0060392) |
| 0.1 |
0.6 |
GO:0032007 |
negative regulation of TOR signaling(GO:0032007) |
| 0.1 |
1.5 |
GO:0060999 |
positive regulation of dendritic spine development(GO:0060999) |
| 0.1 |
0.5 |
GO:0060088 |
auditory receptor cell stereocilium organization(GO:0060088) |
| 0.1 |
0.3 |
GO:0061469 |
regulation of type B pancreatic cell proliferation(GO:0061469) |
| 0.1 |
1.4 |
GO:0000266 |
mitochondrial fission(GO:0000266) |
| 0.1 |
0.5 |
GO:1900246 |
positive regulation of RIG-I signaling pathway(GO:1900246) |
| 0.1 |
0.5 |
GO:0007176 |
regulation of epidermal growth factor-activated receptor activity(GO:0007176) |
| 0.1 |
0.4 |
GO:1904354 |
negative regulation of telomere capping(GO:1904354) |
| 0.1 |
0.3 |
GO:1903336 |
negative regulation of vacuolar transport(GO:1903336) |
| 0.1 |
0.3 |
GO:0001845 |
phagolysosome assembly(GO:0001845) |
| 0.1 |
1.7 |
GO:1904893 |
negative regulation of JAK-STAT cascade(GO:0046426) negative regulation of STAT cascade(GO:1904893) |
| 0.1 |
0.4 |
GO:0006027 |
glycosaminoglycan catabolic process(GO:0006027) |
| 0.1 |
0.1 |
GO:0032911 |
negative regulation of transforming growth factor beta1 production(GO:0032911) |
| 0.1 |
2.1 |
GO:0030032 |
lamellipodium assembly(GO:0030032) |
| 0.1 |
0.3 |
GO:0044565 |
dendritic cell proliferation(GO:0044565) |
| 0.1 |
0.3 |
GO:0051645 |
Golgi localization(GO:0051645) |
| 0.1 |
0.2 |
GO:0050861 |
positive regulation of B cell receptor signaling pathway(GO:0050861) |
| 0.1 |
1.6 |
GO:0000045 |
autophagosome assembly(GO:0000045) |
| 0.1 |
0.4 |
GO:0006953 |
acute-phase response(GO:0006953) |
| 0.1 |
0.3 |
GO:0044829 |
positive regulation by host of viral genome replication(GO:0044829) |
| 0.1 |
0.3 |
GO:0051601 |
exocyst localization(GO:0051601) |
| 0.1 |
2.2 |
GO:0006885 |
regulation of pH(GO:0006885) |
| 0.1 |
0.2 |
GO:0090286 |
cytoskeletal anchoring at nuclear membrane(GO:0090286) |
| 0.1 |
0.1 |
GO:0006498 |
N-terminal protein lipidation(GO:0006498) |
| 0.1 |
0.1 |
GO:0003032 |
detection of oxygen(GO:0003032) |
| 0.1 |
0.2 |
GO:2000314 |
negative regulation of fibroblast growth factor receptor signaling pathway involved in neural plate anterior/posterior pattern formation(GO:2000314) |
| 0.1 |
13.9 |
GO:0007018 |
microtubule-based movement(GO:0007018) |
| 0.1 |
0.3 |
GO:0006659 |
phosphatidylserine biosynthetic process(GO:0006659) |
| 0.1 |
1.0 |
GO:0038127 |
ERBB signaling pathway(GO:0038127) |
| 0.1 |
0.2 |
GO:0019348 |
dolichol metabolic process(GO:0019348) |
| 0.1 |
1.1 |
GO:0006906 |
vesicle fusion(GO:0006906) |
| 0.1 |
0.1 |
GO:0050747 |
positive regulation of lipoprotein metabolic process(GO:0050747) |
| 0.1 |
0.2 |
GO:0046598 |
positive regulation of viral entry into host cell(GO:0046598) |
| 0.1 |
1.8 |
GO:0018345 |
protein palmitoylation(GO:0018345) |
| 0.1 |
0.1 |
GO:0051654 |
establishment of mitochondrion localization(GO:0051654) |
| 0.1 |
5.8 |
GO:0035023 |
regulation of Rho protein signal transduction(GO:0035023) |
| 0.1 |
0.2 |
GO:0006420 |
arginyl-tRNA aminoacylation(GO:0006420) |
| 0.1 |
0.1 |
GO:0045002 |
double-strand break repair via single-strand annealing(GO:0045002) |
| 0.1 |
0.1 |
GO:0042726 |
flavin-containing compound metabolic process(GO:0042726) |
| 0.1 |
0.2 |
GO:0001561 |
fatty acid alpha-oxidation(GO:0001561) |
| 0.1 |
0.3 |
GO:0052490 |
suppression by virus of host apoptotic process(GO:0019050) negative regulation by symbiont of host apoptotic process(GO:0033668) modulation by virus of host apoptotic process(GO:0039526) negative regulation by symbiont of host programmed cell death(GO:0052041) negative regulation by organism of programmed cell death in other organism involved in symbiotic interaction(GO:0052490) |
| 0.1 |
3.5 |
GO:0016579 |
protein deubiquitination(GO:0016579) |
| 0.1 |
0.7 |
GO:0061154 |
endothelial tube morphogenesis(GO:0061154) |
| 0.1 |
0.4 |
GO:0060644 |
mammary gland epithelial cell differentiation(GO:0060644) |
| 0.1 |
1.9 |
GO:0030433 |
ER-associated ubiquitin-dependent protein catabolic process(GO:0030433) |
| 0.1 |
0.4 |
GO:0032933 |
response to sterol depletion(GO:0006991) SREBP signaling pathway(GO:0032933) cellular response to sterol depletion(GO:0071501) |
| 0.1 |
7.6 |
GO:0042787 |
protein ubiquitination involved in ubiquitin-dependent protein catabolic process(GO:0042787) |
| 0.1 |
0.1 |
GO:1903232 |
melanosome assembly(GO:1903232) |
| 0.1 |
0.2 |
GO:0006436 |
tryptophanyl-tRNA aminoacylation(GO:0006436) |
| 0.1 |
0.4 |
GO:0006123 |
mitochondrial electron transport, cytochrome c to oxygen(GO:0006123) |
| 0.1 |
0.5 |
GO:0006750 |
glutathione biosynthetic process(GO:0006750) |
| 0.1 |
0.2 |
GO:0097120 |
receptor localization to synapse(GO:0097120) |
| 0.1 |
3.0 |
GO:0048813 |
dendrite morphogenesis(GO:0048813) |
| 0.1 |
13.0 |
GO:0007264 |
small GTPase mediated signal transduction(GO:0007264) |
| 0.1 |
0.4 |
GO:0036503 |
ERAD pathway(GO:0036503) |
| 0.1 |
0.2 |
GO:0070127 |
tRNA aminoacylation for mitochondrial protein translation(GO:0070127) |
| 0.1 |
0.1 |
GO:0045176 |
apical protein localization(GO:0045176) |
| 0.0 |
0.2 |
GO:0015858 |
nucleoside transport(GO:0015858) |
| 0.0 |
0.1 |
GO:0003348 |
cardiac endothelial cell differentiation(GO:0003348) |
| 0.0 |
0.1 |
GO:1901421 |
positive regulation of response to alcohol(GO:1901421) |
| 0.0 |
0.1 |
GO:2001257 |
regulation of cation channel activity(GO:2001257) |
| 0.0 |
0.0 |
GO:0006553 |
lysine metabolic process(GO:0006553) |
| 0.0 |
0.3 |
GO:0009134 |
nucleoside diphosphate catabolic process(GO:0009134) |
| 0.0 |
0.1 |
GO:0070498 |
interleukin-1-mediated signaling pathway(GO:0070498) |
| 0.0 |
2.7 |
GO:0046488 |
phosphatidylinositol metabolic process(GO:0046488) |
| 0.0 |
0.1 |
GO:1904424 |
regulation of GTP binding(GO:1904424) |
| 0.0 |
0.1 |
GO:0001553 |
luteinization(GO:0001553) |
| 0.0 |
0.1 |
GO:0033580 |
protein glycosylation at cell surface(GO:0033575) protein galactosylation at cell surface(GO:0033580) protein galactosylation(GO:0042125) |
| 0.0 |
0.1 |
GO:0009212 |
dTTP biosynthetic process(GO:0006235) pyrimidine deoxyribonucleoside triphosphate biosynthetic process(GO:0009212) dTTP metabolic process(GO:0046075) |
| 0.0 |
0.7 |
GO:0070972 |
protein localization to endoplasmic reticulum(GO:0070972) |
| 0.0 |
0.0 |
GO:0034389 |
lipid particle organization(GO:0034389) |
| 0.0 |
0.5 |
GO:0043171 |
peptide catabolic process(GO:0043171) |
| 0.0 |
0.2 |
GO:0001826 |
inner cell mass cell differentiation(GO:0001826) |
| 0.0 |
0.5 |
GO:0006044 |
N-acetylglucosamine metabolic process(GO:0006044) |
| 0.0 |
0.2 |
GO:1904217 |
regulation of CDP-diacylglycerol-serine O-phosphatidyltransferase activity(GO:1904217) positive regulation of CDP-diacylglycerol-serine O-phosphatidyltransferase activity(GO:1904219) regulation of serine C-palmitoyltransferase activity(GO:1904220) positive regulation of serine C-palmitoyltransferase activity(GO:1904222) |
| 0.0 |
0.2 |
GO:0060394 |
negative regulation of pathway-restricted SMAD protein phosphorylation(GO:0060394) |
| 0.0 |
0.4 |
GO:0031507 |
heterochromatin assembly(GO:0031507) |
| 0.0 |
0.1 |
GO:0002446 |
neutrophil mediated immunity(GO:0002446) |
| 0.0 |
0.0 |
GO:0090280 |
positive regulation of calcium ion import(GO:0090280) |
| 0.0 |
0.2 |
GO:0048251 |
elastic fiber assembly(GO:0048251) |
| 0.0 |
0.0 |
GO:0048861 |
leukemia inhibitory factor signaling pathway(GO:0048861) |
| 0.0 |
0.0 |
GO:0010040 |
response to iron(II) ion(GO:0010040) |
| 0.0 |
0.3 |
GO:0097320 |
membrane tubulation(GO:0097320) |
| 0.0 |
0.1 |
GO:0007258 |
JUN phosphorylation(GO:0007258) |
| 0.0 |
0.0 |
GO:0007342 |
fusion of sperm to egg plasma membrane(GO:0007342) |
| 0.0 |
0.0 |
GO:0060689 |
cell differentiation involved in salivary gland development(GO:0060689) |
| 0.0 |
0.8 |
GO:0001578 |
microtubule bundle formation(GO:0001578) |
| 0.0 |
0.1 |
GO:0010793 |
regulation of mRNA export from nucleus(GO:0010793) regulation of ribonucleoprotein complex localization(GO:2000197) |
| 0.0 |
0.1 |
GO:0009620 |
response to fungus(GO:0009620) |
| 0.0 |
0.0 |
GO:0035106 |
operant conditioning(GO:0035106) |
| 0.0 |
0.2 |
GO:0007095 |
mitotic G2 DNA damage checkpoint(GO:0007095) |
| 0.0 |
0.1 |
GO:0070230 |
positive regulation of lymphocyte apoptotic process(GO:0070230) |
| 0.0 |
0.1 |
GO:0031468 |
nuclear envelope reassembly(GO:0031468) |
| 0.0 |
0.0 |
GO:0031033 |
myosin filament organization(GO:0031033) |
| 0.0 |
0.2 |
GO:0050729 |
positive regulation of inflammatory response(GO:0050729) |
| 0.0 |
0.0 |
GO:0006020 |
inositol metabolic process(GO:0006020) |
| 0.0 |
0.0 |
GO:0036151 |
phosphatidylcholine acyl-chain remodeling(GO:0036151) |
| 0.0 |
0.1 |
GO:0006956 |
complement activation(GO:0006956) |
| 0.0 |
0.0 |
GO:0039530 |
MDA-5 signaling pathway(GO:0039530) |
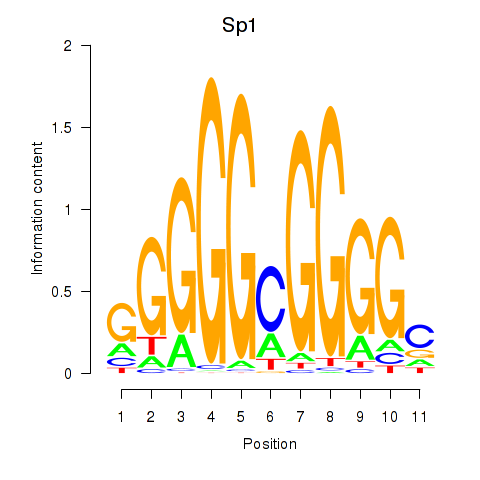
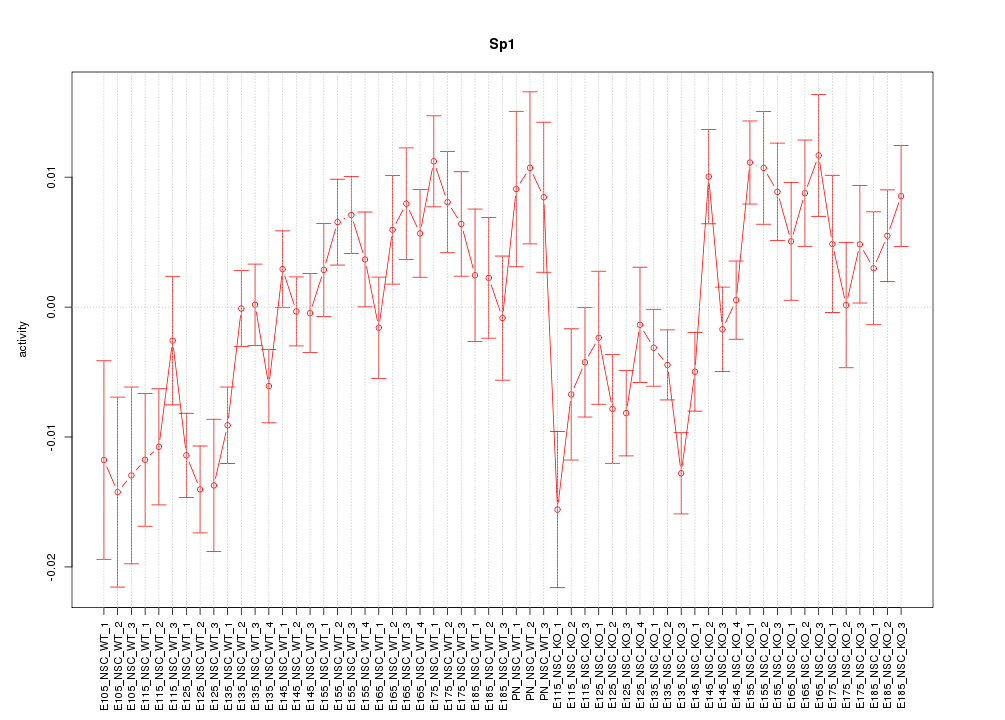
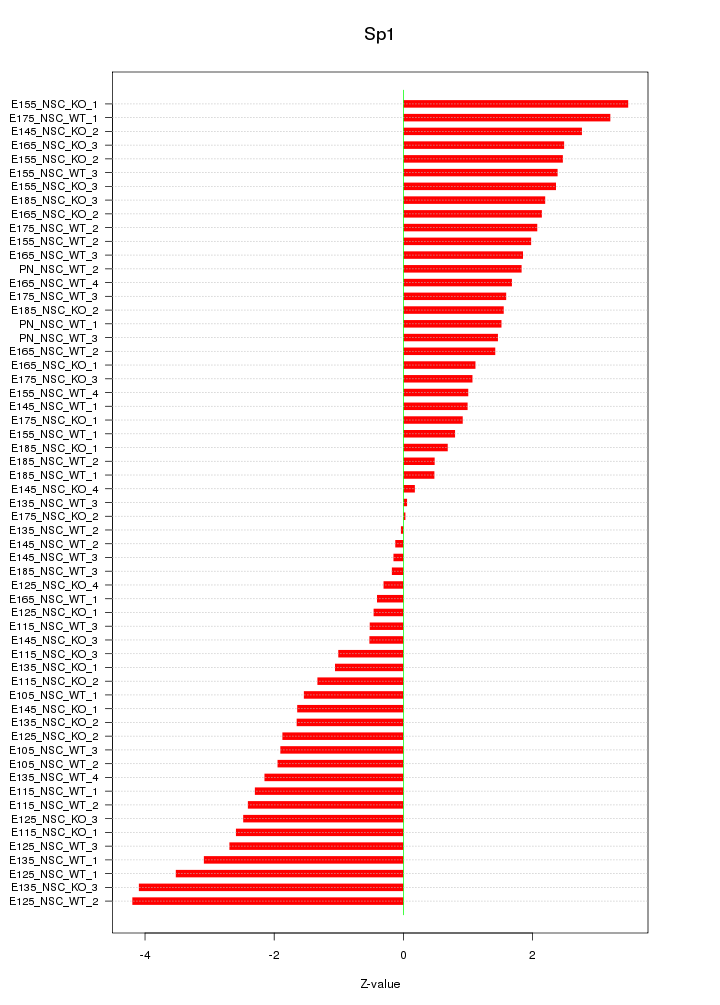

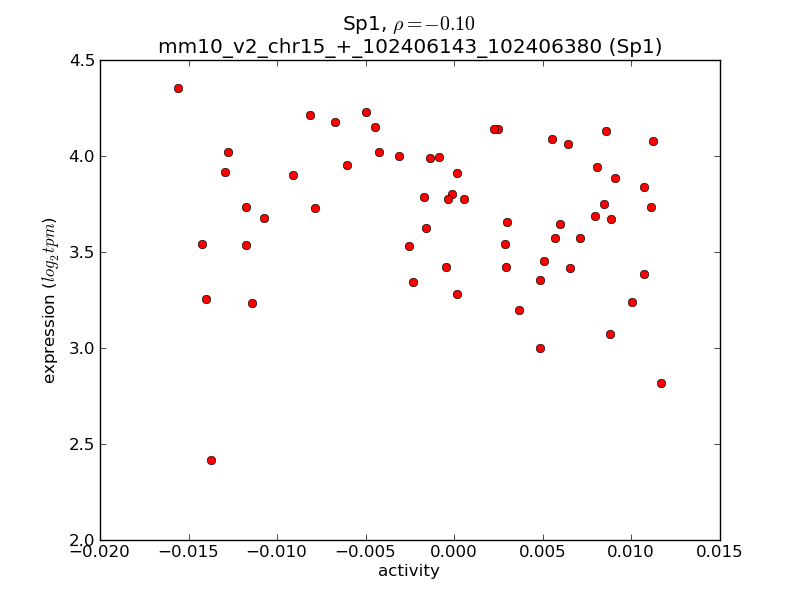
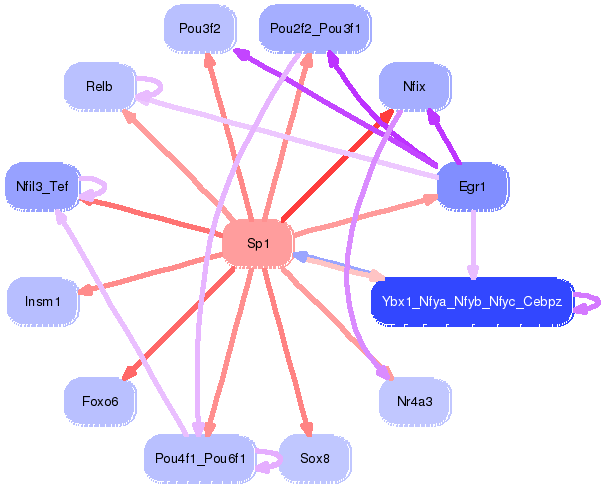