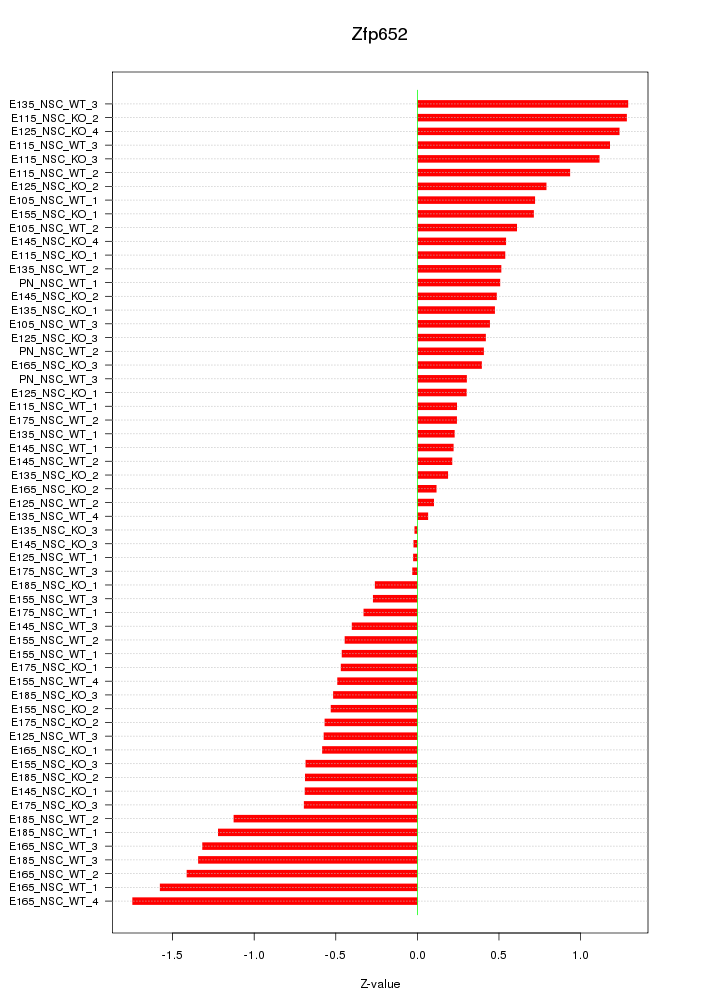
Motif ID: Zfp652
Z-value: 0.734

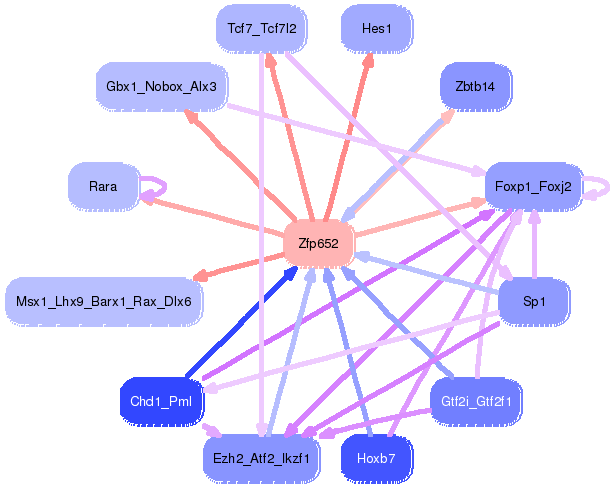
Transcription factors associated with Zfp652:
| Gene Symbol | Entrez ID | Gene Name |
|---|---|---|
| Zfp652 | ENSMUSG00000075595.3 | Zfp652 |
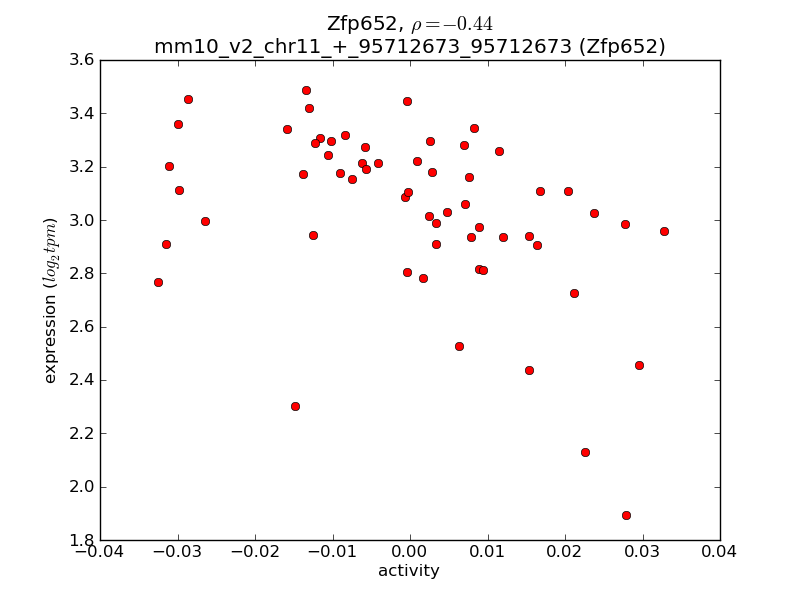
Activity-expression correlation:
| Gene Symbol | Promoter | Pearson corr. coef. | P-value | Plot |
|---|---|---|---|---|
| Zfp652 | mm10_v2_chr11_+_95712673_95712673 | -0.44 | 5.6e-04 | Click! |


Top targets:
Gene overrepresentation in biological_process category:
| Log-likelihood per target | Total log-likelihood | Term | Description |
|---|---|---|---|
| 2.1 | 6.3 | GO:0090274 | positive regulation of somatostatin secretion(GO:0090274) |
| 1.7 | 5.0 | GO:0021557 | oculomotor nerve development(GO:0021557) ascending aorta development(GO:0035905) ascending aorta morphogenesis(GO:0035910) |
| 1.3 | 17.3 | GO:0060159 | regulation of dopamine receptor signaling pathway(GO:0060159) |
| 1.1 | 3.3 | GO:0009174 | UMP biosynthetic process(GO:0006222) pyrimidine ribonucleoside monophosphate metabolic process(GO:0009173) pyrimidine ribonucleoside monophosphate biosynthetic process(GO:0009174) UMP metabolic process(GO:0046049) |
| 0.9 | 2.6 | GO:1903225 | negative regulation of endodermal cell differentiation(GO:1903225) |
| 0.9 | 4.3 | GO:0035262 | gonad morphogenesis(GO:0035262) |
| 0.8 | 2.5 | GO:0060010 | Sertoli cell fate commitment(GO:0060010) |
| 0.7 | 3.5 | GO:2000668 | dendritic cell apoptotic process(GO:0097048) regulation of dendritic cell apoptotic process(GO:2000668) |
| 0.7 | 2.7 | GO:0046121 | deoxyribonucleoside catabolic process(GO:0046121) |
| 0.6 | 4.5 | GO:0051461 | positive regulation of heat generation(GO:0031652) regulation of corticotropin secretion(GO:0051459) positive regulation of corticotropin secretion(GO:0051461) |
| 0.6 | 2.6 | GO:2000054 | negative regulation of Wnt signaling pathway involved in dorsal/ventral axis specification(GO:2000054) |
| 0.6 | 2.8 | GO:2000065 | negative regulation of aldosterone metabolic process(GO:0032345) negative regulation of aldosterone biosynthetic process(GO:0032348) negative regulation of cortisol biosynthetic process(GO:2000065) |
| 0.5 | 4.2 | GO:0048625 | myoblast fate commitment(GO:0048625) |
| 0.5 | 1.4 | GO:0097623 | potassium ion export across plasma membrane(GO:0097623) |
| 0.4 | 1.7 | GO:0060266 | negative regulation of respiratory burst involved in inflammatory response(GO:0060266) negative regulation of respiratory burst(GO:0060268) |
| 0.4 | 2.6 | GO:0021775 | smoothened signaling pathway involved in ventral spinal cord interneuron specification(GO:0021775) smoothened signaling pathway involved in spinal cord motor neuron cell fate specification(GO:0021776) |
| 0.4 | 4.3 | GO:0031274 | positive regulation of pseudopodium assembly(GO:0031274) |
| 0.3 | 2.7 | GO:0015074 | DNA integration(GO:0015074) |
| 0.3 | 2.5 | GO:0032625 | interleukin-21 production(GO:0032625) interleukin-21 secretion(GO:0072619) |
| 0.3 | 2.2 | GO:0032782 | bile acid secretion(GO:0032782) |
| 0.3 | 1.2 | GO:0031581 | hemidesmosome assembly(GO:0031581) |
| 0.2 | 2.0 | GO:0048386 | positive regulation of retinoic acid receptor signaling pathway(GO:0048386) |
| 0.2 | 0.6 | GO:1901731 | calcium-mediated signaling using extracellular calcium source(GO:0035585) positive regulation of platelet aggregation(GO:1901731) |
| 0.2 | 4.1 | GO:0006379 | mRNA cleavage(GO:0006379) |
| 0.2 | 0.5 | GO:0035672 | transepithelial chloride transport(GO:0030321) oligopeptide transmembrane transport(GO:0035672) |
| 0.2 | 2.7 | GO:0050774 | negative regulation of dendrite morphogenesis(GO:0050774) |
| 0.2 | 0.8 | GO:0072368 | regulation of lipid transport by negative regulation of transcription from RNA polymerase II promoter(GO:0072368) |
| 0.1 | 1.3 | GO:0007168 | receptor guanylyl cyclase signaling pathway(GO:0007168) |
| 0.1 | 3.9 | GO:0035115 | embryonic forelimb morphogenesis(GO:0035115) |
| 0.1 | 1.2 | GO:0010571 | positive regulation of nuclear cell cycle DNA replication(GO:0010571) |
| 0.1 | 2.5 | GO:0001522 | pseudouridine synthesis(GO:0001522) |
| 0.1 | 1.9 | GO:1902857 | positive regulation of nonmotile primary cilium assembly(GO:1902857) |
| 0.1 | 0.7 | GO:0019370 | leukotriene biosynthetic process(GO:0019370) |
| 0.1 | 0.8 | GO:0007016 | cytoskeletal anchoring at plasma membrane(GO:0007016) |
| 0.1 | 0.5 | GO:0002667 | lymphocyte anergy(GO:0002249) regulation of T cell anergy(GO:0002667) T cell anergy(GO:0002870) regulation of lymphocyte anergy(GO:0002911) |
| 0.1 | 0.3 | GO:0060480 | lung goblet cell differentiation(GO:0060480) |
| 0.1 | 0.9 | GO:0003417 | growth plate cartilage development(GO:0003417) |
| 0.0 | 0.3 | GO:0033227 | dsRNA transport(GO:0033227) |
| 0.0 | 1.8 | GO:0030199 | collagen fibril organization(GO:0030199) |
| 0.0 | 1.6 | GO:0003170 | heart valve development(GO:0003170) |
| 0.0 | 1.8 | GO:0043392 | negative regulation of DNA binding(GO:0043392) |
| 0.0 | 1.2 | GO:0060325 | face morphogenesis(GO:0060325) |
| 0.0 | 0.7 | GO:0035873 | lactate transport(GO:0015727) lactate transmembrane transport(GO:0035873) plasma membrane lactate transport(GO:0035879) |
| 0.0 | 2.0 | GO:0061077 | chaperone-mediated protein folding(GO:0061077) |
| 0.0 | 5.0 | GO:0043524 | negative regulation of neuron apoptotic process(GO:0043524) |
| 0.0 | 0.1 | GO:2001053 | regulation of mesenchymal cell apoptotic process(GO:2001053) negative regulation of mesenchymal cell apoptotic process(GO:2001054) |
| 0.0 | 0.3 | GO:0043252 | sodium-independent organic anion transport(GO:0043252) |
| 0.0 | 0.2 | GO:0019065 | receptor-mediated endocytosis of virus by host cell(GO:0019065) endocytosis involved in viral entry into host cell(GO:0075509) |
| 0.0 | 1.6 | GO:0042147 | retrograde transport, endosome to Golgi(GO:0042147) |
| 0.0 | 3.7 | GO:0007266 | Rho protein signal transduction(GO:0007266) |
| 0.0 | 1.4 | GO:0001570 | vasculogenesis(GO:0001570) |
| 0.0 | 0.4 | GO:0060445 | branching involved in salivary gland morphogenesis(GO:0060445) |
| 0.0 | 0.4 | GO:0010107 | potassium ion import(GO:0010107) |
| 0.0 | 0.1 | GO:0002021 | response to dietary excess(GO:0002021) |
Gene overrepresentation in cellular_component category:
| Log-likelihood per target | Total log-likelihood | Term | Description |
|---|---|---|---|
| 0.9 | 2.6 | GO:0005588 | collagen type V trimer(GO:0005588) |
| 0.5 | 4.2 | GO:0070369 | beta-catenin-TCF7L2 complex(GO:0070369) |
| 0.4 | 17.3 | GO:0032809 | neuronal cell body membrane(GO:0032809) |
| 0.2 | 0.9 | GO:0005594 | collagen type IX trimer(GO:0005594) |
| 0.2 | 3.2 | GO:0043657 | host(GO:0018995) host cell part(GO:0033643) host cell(GO:0043657) |
| 0.2 | 1.9 | GO:0031105 | septin complex(GO:0031105) |
| 0.1 | 0.6 | GO:0031095 | platelet dense tubular network membrane(GO:0031095) |
| 0.1 | 1.3 | GO:0008074 | guanylate cyclase complex, soluble(GO:0008074) |
| 0.1 | 3.5 | GO:0005921 | gap junction(GO:0005921) |
| 0.1 | 2.6 | GO:0030877 | beta-catenin destruction complex(GO:0030877) |
| 0.1 | 0.4 | GO:0043259 | laminin-10 complex(GO:0043259) |
| 0.1 | 0.8 | GO:0005916 | fascia adherens(GO:0005916) |
| 0.1 | 1.2 | GO:0030056 | hemidesmosome(GO:0030056) |
| 0.1 | 0.8 | GO:0032937 | SREBP-SCAP-Insig complex(GO:0032937) |
| 0.1 | 1.1 | GO:0097542 | ciliary tip(GO:0097542) |
| 0.1 | 4.1 | GO:0005882 | intermediate filament(GO:0005882) |
| 0.1 | 4.1 | GO:0000932 | cytoplasmic mRNA processing body(GO:0000932) |
| 0.1 | 6.3 | GO:0043195 | terminal bouton(GO:0043195) |
| 0.1 | 0.9 | GO:0035102 | PRC1 complex(GO:0035102) |
| 0.0 | 1.2 | GO:0002102 | podosome(GO:0002102) |
| 0.0 | 2.7 | GO:0031985 | Golgi cisterna(GO:0031985) |
| 0.0 | 1.6 | GO:0005881 | cytoplasmic microtubule(GO:0005881) |
| 0.0 | 0.5 | GO:0097225 | sperm midpiece(GO:0097225) |
| 0.0 | 0.2 | GO:0030122 | AP-2 adaptor complex(GO:0030122) |
| 0.0 | 0.2 | GO:0061574 | ASAP complex(GO:0061574) |
| 0.0 | 1.5 | GO:0005581 | collagen trimer(GO:0005581) |
| 0.0 | 3.5 | GO:0031965 | nuclear membrane(GO:0031965) |
| 0.0 | 6.7 | GO:0000785 | chromatin(GO:0000785) |
Gene overrepresentation in molecular_function category:
| Log-likelihood per target | Total log-likelihood | Term | Description |
|---|---|---|---|
| 0.9 | 8.0 | GO:0031730 | CCR5 chemokine receptor binding(GO:0031730) |
| 0.7 | 3.3 | GO:0004849 | uridine kinase activity(GO:0004849) |
| 0.6 | 1.9 | GO:0019966 | interleukin-1 binding(GO:0019966) |
| 0.5 | 3.3 | GO:0008239 | dipeptidyl-peptidase activity(GO:0008239) |
| 0.5 | 1.4 | GO:1902282 | voltage-gated potassium channel activity involved in ventricular cardiac muscle cell action potential repolarization(GO:1902282) |
| 0.4 | 17.3 | GO:0001965 | G-protein alpha-subunit binding(GO:0001965) |
| 0.4 | 3.7 | GO:0005095 | GTPase inhibitor activity(GO:0005095) |
| 0.3 | 3.2 | GO:0032036 | myosin heavy chain binding(GO:0032036) |
| 0.3 | 2.5 | GO:0001972 | retinoic acid binding(GO:0001972) |
| 0.3 | 4.5 | GO:0071855 | neuropeptide receptor binding(GO:0071855) |
| 0.3 | 1.2 | GO:0042015 | interleukin-20 binding(GO:0042015) |
| 0.3 | 3.5 | GO:0005243 | gap junction channel activity(GO:0005243) |
| 0.3 | 2.8 | GO:0070700 | BMP receptor binding(GO:0070700) |
| 0.3 | 6.7 | GO:0070016 | armadillo repeat domain binding(GO:0070016) |
| 0.3 | 1.3 | GO:0016941 | natriuretic peptide receptor activity(GO:0016941) |
| 0.2 | 4.3 | GO:0017049 | GTP-Rho binding(GO:0017049) |
| 0.2 | 2.7 | GO:0016832 | aldehyde-lyase activity(GO:0016832) |
| 0.2 | 2.5 | GO:0034951 | pivalyl-CoA mutase activity(GO:0034784) o-hydroxylaminobenzoate mutase activity(GO:0034951) lupeol synthase activity(GO:0042299) beta-amyrin synthase activity(GO:0042300) baruol synthase activity(GO:0080011) |
| 0.2 | 5.0 | GO:0008432 | JUN kinase binding(GO:0008432) |
| 0.2 | 0.5 | GO:0015562 | efflux transmembrane transporter activity(GO:0015562) |
| 0.1 | 1.8 | GO:0008191 | metalloendopeptidase inhibitor activity(GO:0008191) |
| 0.1 | 6.3 | GO:0001653 | peptide receptor activity(GO:0001653) G-protein coupled peptide receptor activity(GO:0008528) |
| 0.1 | 1.7 | GO:0070182 | DNA polymerase binding(GO:0070182) |
| 0.1 | 0.3 | GO:0051032 | nucleic acid transmembrane transporter activity(GO:0051032) RNA transmembrane transporter activity(GO:0051033) |
| 0.1 | 2.0 | GO:0005528 | macrolide binding(GO:0005527) FK506 binding(GO:0005528) |
| 0.1 | 0.6 | GO:0103116 | alpha-D-galactofuranose transporter activity(GO:0103116) |
| 0.1 | 2.6 | GO:0005201 | extracellular matrix structural constituent(GO:0005201) |
| 0.1 | 0.7 | GO:0016755 | transferase activity, transferring amino-acyl groups(GO:0016755) |
| 0.0 | 1.7 | GO:0017017 | MAP kinase tyrosine/serine/threonine phosphatase activity(GO:0017017) |
| 0.0 | 0.7 | GO:0015129 | lactate transmembrane transporter activity(GO:0015129) |
| 0.0 | 1.6 | GO:0017112 | Rab guanyl-nucleotide exchange factor activity(GO:0017112) |
| 0.0 | 0.3 | GO:0017034 | Rap guanyl-nucleotide exchange factor activity(GO:0017034) |
| 0.0 | 1.2 | GO:0071837 | HMG box domain binding(GO:0071837) |
| 0.0 | 0.4 | GO:0042556 | cobinamide kinase activity(GO:0008819) phytol kinase activity(GO:0010276) phenol kinase activity(GO:0018720) cyclin-dependent protein kinase activating kinase regulator activity(GO:0019914) inositol tetrakisphosphate 2-kinase activity(GO:0032942) heptose 7-phosphate kinase activity(GO:0033785) aminoglycoside phosphotransferase activity(GO:0034071) eukaryotic elongation factor-2 kinase regulator activity(GO:0042556) eukaryotic elongation factor-2 kinase activator activity(GO:0042557) LPPG:FO 2-phospho-L-lactate transferase activity(GO:0043743) cytidine kinase activity(GO:0043771) glycerate 2-kinase activity(GO:0043798) (S)-lactate 2-kinase activity(GO:0043841) phosphoserine:homoserine phosphotransferase activity(GO:0043899) L-seryl-tRNA(Sec) kinase activity(GO:0043915) phosphocholine transferase activity(GO:0044605) GTP-dependent polynucleotide kinase activity(GO:0051735) farnesol kinase activity(GO:0052668) CTP:2-trans,-6-trans-farnesol kinase activity(GO:0052669) geraniol kinase activity(GO:0052670) geranylgeraniol kinase activity(GO:0052671) CTP:geranylgeraniol kinase activity(GO:0052672) prenol kinase activity(GO:0052673) 1-phosphatidylinositol-5-kinase activity(GO:0052810) 1-phosphatidylinositol-3-phosphate 4-kinase activity(GO:0052811) phosphatidylinositol-3,4-bisphosphate 5-kinase activity(GO:0052812) inositol-3,4,6-trisphosphate 1-kinase activity(GO:0052835) inositol 5-diphosphate pentakisphosphate 5-kinase activity(GO:0052836) inositol diphosphate tetrakisphosphate kinase activity(GO:0052839) |
| 0.0 | 0.1 | GO:0003680 | AT DNA binding(GO:0003680) |
| 0.0 | 0.5 | GO:0008307 | structural constituent of muscle(GO:0008307) |
| 0.0 | 0.4 | GO:0005242 | inward rectifier potassium channel activity(GO:0005242) |
| 0.0 | 0.3 | GO:0015347 | sodium-independent organic anion transmembrane transporter activity(GO:0015347) |
| 0.0 | 2.5 | GO:0003705 | transcription factor activity, RNA polymerase II distal enhancer sequence-specific binding(GO:0003705) |
| 0.0 | 0.6 | GO:0005251 | delayed rectifier potassium channel activity(GO:0005251) |
| 0.0 | 4.1 | GO:0004386 | helicase activity(GO:0004386) |
| 0.0 | 2.7 | GO:0004930 | G-protein coupled receptor activity(GO:0004930) |
| 0.0 | 0.1 | GO:0008440 | inositol-1,4,5-trisphosphate 3-kinase activity(GO:0008440) |
| 0.0 | 1.4 | GO:0008013 | beta-catenin binding(GO:0008013) |
| 0.0 | 0.8 | GO:0005200 | structural constituent of cytoskeleton(GO:0005200) |
| 0.0 | 0.8 | GO:0004402 | histone acetyltransferase activity(GO:0004402) |
| 0.0 | 0.6 | GO:0043621 | protein self-association(GO:0043621) |