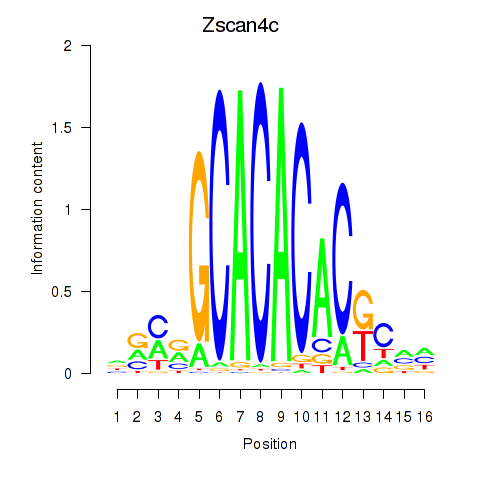
Motif ID: Zscan4c
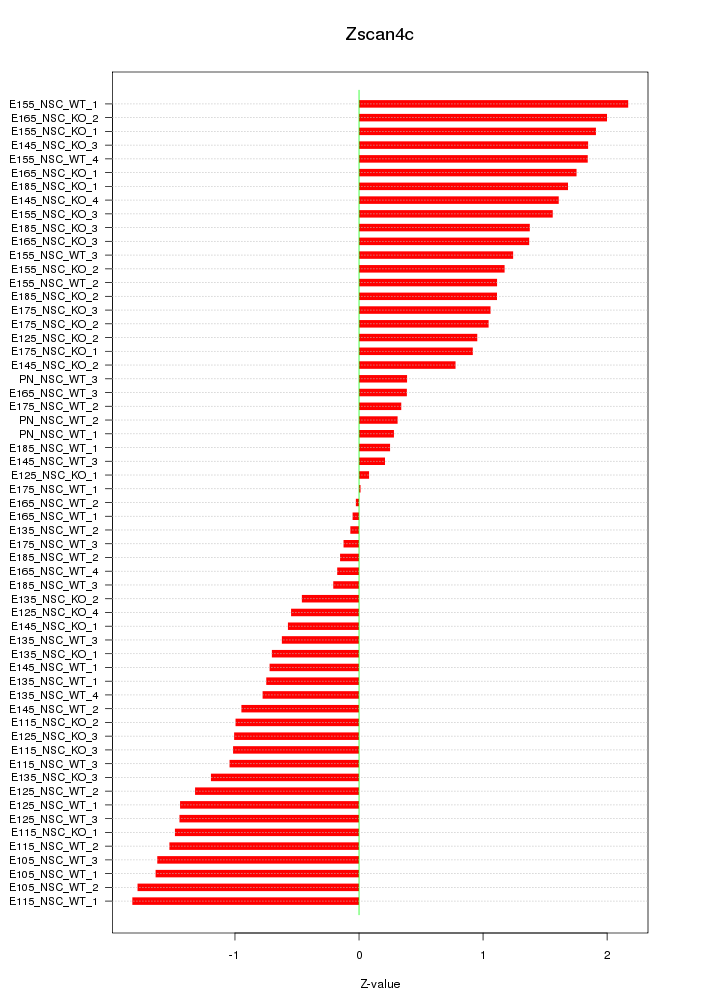
Z-value: 1.141
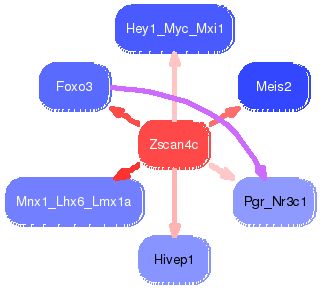
Transcription factors associated with Zscan4c:
| Gene Symbol | Entrez ID | Gene Name |
|---|---|---|
| Zscan4c | ENSMUSG00000054272.5 | Zscan4c |

Top targets:
Gene overrepresentation in biological_process category:
| Log-likelihood per target | Total log-likelihood | Term | Description |
|---|---|---|---|
| 6.4 | 19.1 | GO:0001928 | regulation of exocyst assembly(GO:0001928) |
| 3.6 | 14.4 | GO:0055095 | lipoprotein particle mediated signaling(GO:0055095) low-density lipoprotein particle mediated signaling(GO:0055096) |
| 2.4 | 14.2 | GO:0060718 | chorionic trophoblast cell differentiation(GO:0060718) |
| 1.6 | 4.7 | GO:0002842 | T cell mediated immune response to tumor cell(GO:0002424) regulation of T cell mediated immune response to tumor cell(GO:0002840) positive regulation of T cell mediated immune response to tumor cell(GO:0002842) positive regulation of cell-cell adhesion mediated by integrin(GO:0033634) |
| 1.3 | 9.4 | GO:1905206 | positive regulation of hydrogen peroxide-mediated programmed cell death(GO:1901300) positive regulation of hydrogen peroxide-induced cell death(GO:1905206) |
| 1.2 | 6.1 | GO:1904936 | cerebral cortex GABAergic interneuron migration(GO:0021853) interneuron migration(GO:1904936) |
| 1.2 | 23.3 | GO:0021542 | dentate gyrus development(GO:0021542) |
| 1.0 | 6.1 | GO:0060907 | positive regulation of macrophage cytokine production(GO:0060907) |
| 1.0 | 5.0 | GO:2001025 | positive regulation of response to drug(GO:2001025) |
| 1.0 | 2.9 | GO:2000501 | natural killer cell chemotaxis(GO:0035747) regulation of natural killer cell chemotaxis(GO:2000501) |
| 1.0 | 5.8 | GO:0048934 | peripheral nervous system neuron differentiation(GO:0048934) peripheral nervous system neuron development(GO:0048935) |
| 1.0 | 9.5 | GO:0007379 | segment specification(GO:0007379) |
| 0.9 | 5.6 | GO:0089711 | L-glutamate transmembrane transport(GO:0089711) |
| 0.9 | 2.8 | GO:1902277 | negative regulation of pancreatic amylase secretion(GO:1902277) |
| 0.9 | 2.7 | GO:1904139 | microglial cell migration(GO:1904124) regulation of microglial cell migration(GO:1904139) |
| 0.9 | 6.1 | GO:0061092 | involuntary skeletal muscle contraction(GO:0003011) regulation of phospholipid translocation(GO:0061091) positive regulation of phospholipid translocation(GO:0061092) |
| 0.8 | 16.9 | GO:0050650 | chondroitin sulfate proteoglycan biosynthetic process(GO:0050650) |
| 0.7 | 4.6 | GO:1900194 | negative regulation of oocyte development(GO:0060283) negative regulation of oocyte maturation(GO:1900194) |
| 0.6 | 3.5 | GO:0045218 | zonula adherens maintenance(GO:0045218) |
| 0.5 | 13.9 | GO:0007214 | gamma-aminobutyric acid signaling pathway(GO:0007214) |
| 0.5 | 1.5 | GO:1901731 | calcium-mediated signaling using extracellular calcium source(GO:0035585) positive regulation of platelet aggregation(GO:1901731) |
| 0.4 | 3.2 | GO:0007016 | cytoskeletal anchoring at plasma membrane(GO:0007016) |
| 0.4 | 3.2 | GO:0097264 | self proteolysis(GO:0097264) |
| 0.4 | 2.4 | GO:0007197 | adenylate cyclase-inhibiting G-protein coupled acetylcholine receptor signaling pathway(GO:0007197) phospholipase C-activating G-protein coupled acetylcholine receptor signaling pathway(GO:0007207) |
| 0.4 | 6.9 | GO:0035020 | regulation of Rac protein signal transduction(GO:0035020) |
| 0.3 | 3.4 | GO:0021869 | forebrain ventricular zone progenitor cell division(GO:0021869) |
| 0.2 | 11.3 | GO:0046513 | ceramide biosynthetic process(GO:0046513) |
| 0.2 | 12.3 | GO:0010923 | negative regulation of phosphatase activity(GO:0010923) |
| 0.2 | 9.8 | GO:0008542 | visual learning(GO:0008542) |
| 0.1 | 0.3 | GO:0046098 | guanine metabolic process(GO:0046098) |
| 0.1 | 3.6 | GO:2000785 | regulation of autophagosome assembly(GO:2000785) |
| 0.1 | 9.7 | GO:0010811 | positive regulation of cell-substrate adhesion(GO:0010811) |
| 0.1 | 2.9 | GO:0090004 | positive regulation of establishment of protein localization to plasma membrane(GO:0090004) |
| 0.1 | 2.5 | GO:0007193 | adenylate cyclase-inhibiting G-protein coupled receptor signaling pathway(GO:0007193) |
| 0.0 | 0.2 | GO:0031914 | negative regulation of synaptic plasticity(GO:0031914) negative regulation of glucocorticoid mediated signaling pathway(GO:1900170) |
| 0.0 | 9.4 | GO:0010976 | positive regulation of neuron projection development(GO:0010976) |
| 0.0 | 1.1 | GO:0035690 | cellular response to drug(GO:0035690) |
| 0.0 | 1.4 | GO:0003073 | regulation of systemic arterial blood pressure(GO:0003073) |
| 0.0 | 0.3 | GO:0008053 | mitochondrial fusion(GO:0008053) |
Gene overrepresentation in cellular_component category:
| Log-likelihood per target | Total log-likelihood | Term | Description |
|---|---|---|---|
| 2.8 | 13.9 | GO:0038039 | G-protein coupled receptor heterodimeric complex(GO:0038039) |
| 0.9 | 2.7 | GO:1990682 | CSF1-CSF1R complex(GO:1990682) |
| 0.8 | 5.0 | GO:1990635 | proximal dendrite(GO:1990635) |
| 0.6 | 9.7 | GO:0005614 | interstitial matrix(GO:0005614) |
| 0.5 | 4.7 | GO:0031362 | anchored component of external side of plasma membrane(GO:0031362) |
| 0.4 | 1.5 | GO:0031095 | platelet dense tubular network membrane(GO:0031095) |
| 0.3 | 39.6 | GO:0031225 | anchored component of membrane(GO:0031225) |
| 0.3 | 6.9 | GO:0016327 | apicolateral plasma membrane(GO:0016327) |
| 0.3 | 9.7 | GO:0043194 | axon initial segment(GO:0043194) |
| 0.3 | 3.5 | GO:0005915 | zonula adherens(GO:0005915) |
| 0.2 | 9.5 | GO:0008023 | transcription elongation factor complex(GO:0008023) |
| 0.2 | 5.6 | GO:0030673 | axolemma(GO:0030673) |
| 0.2 | 5.8 | GO:0048786 | presynaptic active zone(GO:0048786) |
| 0.2 | 2.4 | GO:0032279 | asymmetric synapse(GO:0032279) |
| 0.1 | 0.3 | GO:0031230 | intrinsic component of cell outer membrane(GO:0031230) integral component of cell outer membrane(GO:0045203) |
| 0.1 | 2.5 | GO:0005834 | heterotrimeric G-protein complex(GO:0005834) |
| 0.0 | 2.9 | GO:0008076 | voltage-gated potassium channel complex(GO:0008076) |
| 0.0 | 6.1 | GO:0005802 | trans-Golgi network(GO:0005802) |
| 0.0 | 7.0 | GO:0031012 | extracellular matrix(GO:0031012) |
| 0.0 | 1.8 | GO:0043679 | axon terminus(GO:0043679) |
| 0.0 | 2.1 | GO:0008021 | synaptic vesicle(GO:0008021) |
Gene overrepresentation in molecular_function category:
| Log-likelihood per target | Total log-likelihood | Term | Description |
|---|---|---|---|
| 2.9 | 14.4 | GO:0055100 | adiponectin binding(GO:0055100) |
| 2.8 | 16.9 | GO:0015018 | galactosylgalactosylxylosylprotein 3-beta-glucuronosyltransferase activity(GO:0015018) |
| 2.3 | 13.9 | GO:0004965 | G-protein coupled GABA receptor activity(GO:0004965) |
| 1.4 | 5.6 | GO:0015501 | glutamate:sodium symporter activity(GO:0015501) |
| 1.3 | 11.3 | GO:0050291 | sphingosine N-acyltransferase activity(GO:0050291) |
| 1.2 | 5.8 | GO:0005030 | neurotrophin receptor activity(GO:0005030) |
| 1.0 | 19.1 | GO:0030275 | LRR domain binding(GO:0030275) |
| 0.9 | 3.5 | GO:0008569 | ATP-dependent microtubule motor activity, minus-end-directed(GO:0008569) |
| 0.6 | 14.2 | GO:0005520 | insulin-like growth factor binding(GO:0005520) |
| 0.6 | 6.1 | GO:0038191 | neuropilin binding(GO:0038191) |
| 0.5 | 9.0 | GO:0001968 | fibronectin binding(GO:0001968) |
| 0.4 | 3.2 | GO:0016308 | 1-phosphatidylinositol-4-phosphate 5-kinase activity(GO:0016308) |
| 0.4 | 4.7 | GO:0030296 | protein tyrosine kinase activator activity(GO:0030296) |
| 0.4 | 2.4 | GO:0016907 | G-protein coupled acetylcholine receptor activity(GO:0016907) |
| 0.4 | 2.5 | GO:0031821 | G-protein coupled serotonin receptor binding(GO:0031821) |
| 0.3 | 6.1 | GO:0004012 | phospholipid-translocating ATPase activity(GO:0004012) |
| 0.3 | 11.6 | GO:0004864 | protein phosphatase inhibitor activity(GO:0004864) |
| 0.2 | 4.6 | GO:0005070 | SH3/SH2 adaptor activity(GO:0005070) |
| 0.2 | 5.0 | GO:0001784 | phosphotyrosine binding(GO:0001784) |
| 0.2 | 9.4 | GO:0001221 | transcription cofactor binding(GO:0001221) |
| 0.2 | 3.6 | GO:0004198 | calcium-dependent cysteine-type endopeptidase activity(GO:0004198) |
| 0.1 | 7.1 | GO:0030971 | receptor tyrosine kinase binding(GO:0030971) |
| 0.1 | 2.8 | GO:0005242 | inward rectifier potassium channel activity(GO:0005242) |
| 0.1 | 2.2 | GO:0008349 | MAP kinase kinase kinase kinase activity(GO:0008349) |
| 0.1 | 5.6 | GO:0005246 | calcium channel regulator activity(GO:0005246) |
| 0.1 | 2.0 | GO:0008188 | neuropeptide receptor activity(GO:0008188) |
| 0.1 | 0.9 | GO:0001206 | transcriptional repressor activity, RNA polymerase II distal enhancer sequence-specific binding(GO:0001206) |
| 0.1 | 4.3 | GO:0043015 | gamma-tubulin binding(GO:0043015) |
| 0.1 | 1.1 | GO:0016151 | nickel cation binding(GO:0016151) |
| 0.1 | 30.1 | GO:0001077 | transcriptional activator activity, RNA polymerase II core promoter proximal region sequence-specific binding(GO:0001077) |
| 0.1 | 2.9 | GO:0008009 | chemokine activity(GO:0008009) |
| 0.1 | 2.8 | GO:0017112 | Rab guanyl-nucleotide exchange factor activity(GO:0017112) |
| 0.1 | 2.9 | GO:0015459 | potassium channel regulator activity(GO:0015459) |
| 0.0 | 1.4 | GO:0043014 | alpha-tubulin binding(GO:0043014) |
| 0.0 | 0.9 | GO:0003841 | 1-acylglycerol-3-phosphate O-acyltransferase activity(GO:0003841) |
| 0.0 | 1.5 | GO:0030507 | spectrin binding(GO:0030507) |
| 0.0 | 8.2 | GO:0008022 | protein C-terminus binding(GO:0008022) |
| 0.0 | 2.7 | GO:0005126 | cytokine receptor binding(GO:0005126) |
| 0.0 | 1.0 | GO:0044824 | integrase activity(GO:0008907) T/G mismatch-specific endonuclease activity(GO:0043765) retroviral integrase activity(GO:0044823) retroviral 3' processing activity(GO:0044824) |
| 0.0 | 1.9 | GO:0017124 | SH3 domain binding(GO:0017124) |
| 0.0 | 0.3 | GO:0016814 | hydrolase activity, acting on carbon-nitrogen (but not peptide) bonds, in cyclic amidines(GO:0016814) |