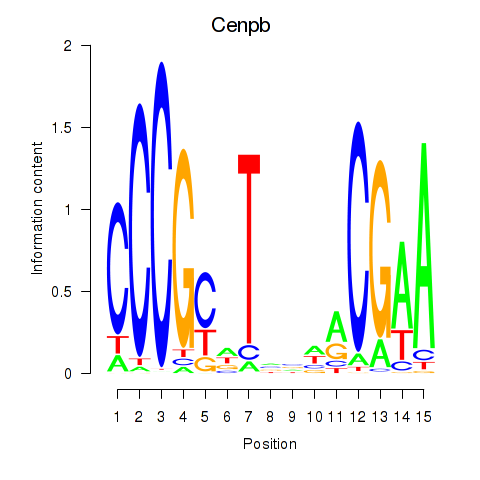
Motif ID: Cenpb
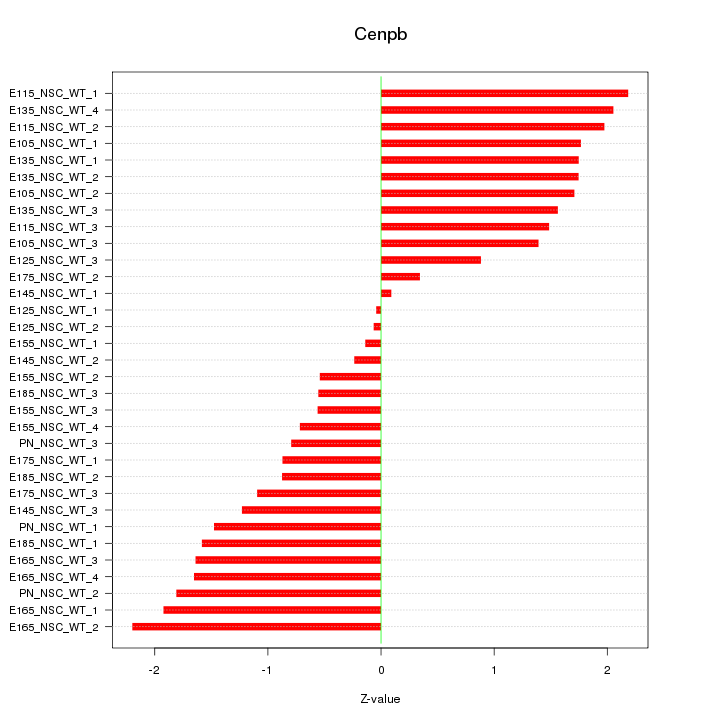
Z-value: 1.358
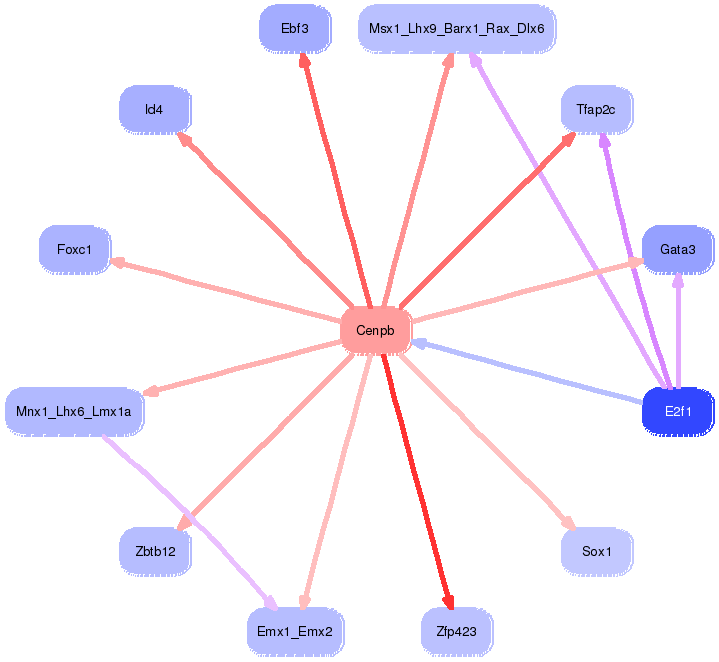
Transcription factors associated with Cenpb:
| Gene Symbol | Entrez ID | Gene Name |
|---|---|---|
| Cenpb | ENSMUSG00000068267.4 | Cenpb |
Activity-expression correlation:
| Gene Symbol | Promoter | Pearson corr. coef. | P-value | Plot |
|---|---|---|---|---|
| Cenpb | mm10_v2_chr2_-_131179985_131180092 | -0.67 | 2.1e-05 | Click! |


Top targets:
Gene overrepresentation in biological_process category:
| Log-likelihood per target | Total log-likelihood | Term | Description |
|---|---|---|---|
| 1.8 | 5.5 | GO:0060598 | dichotomous subdivision of terminal units involved in mammary gland duct morphogenesis(GO:0060598) |
| 1.7 | 5.2 | GO:2001206 | positive regulation of osteoclast development(GO:2001206) |
| 1.0 | 3.1 | GO:0050929 | corticospinal neuron axon guidance through spinal cord(GO:0021972) positive regulation of negative chemotaxis(GO:0050924) induction of negative chemotaxis(GO:0050929) negative regulation of mononuclear cell migration(GO:0071676) negative regulation of retinal ganglion cell axon guidance(GO:0090260) |
| 0.9 | 3.8 | GO:0060741 | prostate gland stromal morphogenesis(GO:0060741) |
| 0.9 | 2.6 | GO:0036388 | pre-replicative complex assembly involved in nuclear cell cycle DNA replication(GO:0006267) pre-replicative complex assembly(GO:0036388) pre-replicative complex assembly involved in cell cycle DNA replication(GO:1902299) |
| 0.8 | 11.0 | GO:0006268 | DNA unwinding involved in DNA replication(GO:0006268) |
| 0.8 | 2.4 | GO:0034310 | primary alcohol catabolic process(GO:0034310) |
| 0.8 | 3.8 | GO:0014022 | neural plate elongation(GO:0014022) convergent extension involved in neural plate elongation(GO:0022007) |
| 0.7 | 3.7 | GO:0070327 | thyroid hormone transport(GO:0070327) |
| 0.7 | 2.1 | GO:0006106 | fumarate metabolic process(GO:0006106) |
| 0.7 | 4.3 | GO:0060242 | contact inhibition(GO:0060242) |
| 0.7 | 2.1 | GO:0032474 | otolith morphogenesis(GO:0032474) |
| 0.7 | 6.2 | GO:1903298 | regulation of hypoxia-induced intrinsic apoptotic signaling pathway(GO:1903297) negative regulation of hypoxia-induced intrinsic apoptotic signaling pathway(GO:1903298) |
| 0.7 | 3.3 | GO:0035262 | gonad morphogenesis(GO:0035262) |
| 0.6 | 2.4 | GO:0071475 | cellular hyperosmotic salinity response(GO:0071475) |
| 0.6 | 5.3 | GO:0042756 | drinking behavior(GO:0042756) |
| 0.6 | 1.7 | GO:1903334 | positive regulation of protein folding(GO:1903334) |
| 0.5 | 1.6 | GO:0003278 | apoptotic process involved in heart morphogenesis(GO:0003278) |
| 0.5 | 2.0 | GO:0006407 | rRNA export from nucleus(GO:0006407) |
| 0.5 | 1.5 | GO:0032066 | nucleolus to nucleoplasm transport(GO:0032066) |
| 0.5 | 3.2 | GO:1904667 | negative regulation of ubiquitin protein ligase activity(GO:1904667) |
| 0.4 | 1.3 | GO:0010940 | positive regulation of necrotic cell death(GO:0010940) |
| 0.4 | 1.1 | GO:0035799 | ureter maturation(GO:0035799) cell-cell signaling involved in kidney development(GO:0060995) Wnt signaling pathway involved in kidney development(GO:0061289) canonical Wnt signaling pathway involved in metanephric kidney development(GO:0061290) cell-cell signaling involved in metanephros development(GO:0072204) regulation of DNA demethylation(GO:1901535) negative regulation of DNA demethylation(GO:1901536) |
| 0.4 | 1.4 | GO:2000546 | positive regulation of cell chemotaxis to fibroblast growth factor(GO:1904849) positive regulation of endothelial cell chemotaxis to fibroblast growth factor(GO:2000546) |
| 0.4 | 1.4 | GO:1903237 | negative regulation of leukocyte tethering or rolling(GO:1903237) |
| 0.4 | 1.1 | GO:2000832 | protein-chromophore linkage(GO:0018298) negative regulation of steroid hormone secretion(GO:2000832) negative regulation of corticosteroid hormone secretion(GO:2000847) negative regulation of glucocorticoid secretion(GO:2000850) |
| 0.3 | 1.0 | GO:1904430 | negative regulation of t-circle formation(GO:1904430) |
| 0.3 | 2.0 | GO:0046602 | regulation of mitotic centrosome separation(GO:0046602) |
| 0.3 | 1.3 | GO:0015744 | succinate transport(GO:0015744) |
| 0.3 | 1.9 | GO:0006384 | transcription initiation from RNA polymerase III promoter(GO:0006384) |
| 0.3 | 0.9 | GO:0002669 | positive regulation of T cell anergy(GO:0002669) positive regulation of lymphocyte anergy(GO:0002913) |
| 0.3 | 0.9 | GO:0033860 | regulation of NAD(P)H oxidase activity(GO:0033860) flavin-containing compound metabolic process(GO:0042726) |
| 0.3 | 0.9 | GO:0003219 | atrioventricular node development(GO:0003162) cardiac right ventricle formation(GO:0003219) |
| 0.3 | 0.9 | GO:0000720 | pyrimidine dimer repair by nucleotide-excision repair(GO:0000720) |
| 0.3 | 1.4 | GO:0046600 | negative regulation of centriole replication(GO:0046600) |
| 0.3 | 0.8 | GO:0035552 | oxidative single-stranded DNA demethylation(GO:0035552) |
| 0.3 | 1.4 | GO:0070236 | negative regulation of activation-induced cell death of T cells(GO:0070236) |
| 0.3 | 3.8 | GO:0051764 | actin crosslink formation(GO:0051764) |
| 0.3 | 0.5 | GO:0072076 | nephrogenic mesenchyme development(GO:0072076) |
| 0.3 | 3.0 | GO:0051601 | exocyst localization(GO:0051601) |
| 0.2 | 1.5 | GO:1904936 | cerebral cortex GABAergic interneuron migration(GO:0021853) interneuron migration(GO:1904936) |
| 0.2 | 0.7 | GO:0033615 | mitochondrial proton-transporting ATP synthase complex assembly(GO:0033615) |
| 0.2 | 1.6 | GO:0000055 | ribosomal large subunit export from nucleus(GO:0000055) |
| 0.2 | 1.1 | GO:0070459 | prolactin secretion(GO:0070459) |
| 0.2 | 2.4 | GO:0035814 | negative regulation of renal sodium excretion(GO:0035814) |
| 0.2 | 1.4 | GO:0045625 | regulation of T-helper 1 cell differentiation(GO:0045625) positive regulation of T-helper 2 cell differentiation(GO:0045630) |
| 0.2 | 1.8 | GO:0036289 | peptidyl-serine autophosphorylation(GO:0036289) |
| 0.2 | 1.0 | GO:0046133 | pyrimidine ribonucleoside catabolic process(GO:0046133) |
| 0.2 | 6.7 | GO:0030513 | positive regulation of BMP signaling pathway(GO:0030513) |
| 0.2 | 4.9 | GO:0010922 | positive regulation of phosphatase activity(GO:0010922) |
| 0.2 | 1.8 | GO:0046036 | GTP biosynthetic process(GO:0006183) CTP biosynthetic process(GO:0006241) CTP metabolic process(GO:0046036) |
| 0.2 | 1.4 | GO:1901387 | positive regulation of voltage-gated calcium channel activity(GO:1901387) |
| 0.2 | 1.7 | GO:2000628 | regulation of miRNA metabolic process(GO:2000628) |
| 0.2 | 1.0 | GO:0042135 | neurotransmitter catabolic process(GO:0042135) |
| 0.2 | 5.9 | GO:0000387 | spliceosomal snRNP assembly(GO:0000387) |
| 0.2 | 1.0 | GO:1900016 | negative regulation of cytokine production involved in inflammatory response(GO:1900016) |
| 0.2 | 2.3 | GO:0036065 | fucosylation(GO:0036065) |
| 0.1 | 2.9 | GO:0006999 | nuclear pore organization(GO:0006999) |
| 0.1 | 0.8 | GO:0006452 | translational frameshifting(GO:0006452) positive regulation of translational termination(GO:0045905) |
| 0.1 | 0.8 | GO:0006207 | 'de novo' pyrimidine nucleobase biosynthetic process(GO:0006207) pyrimidine nucleobase biosynthetic process(GO:0019856) |
| 0.1 | 0.8 | GO:0072610 | interleukin-12 secretion(GO:0072610) regulation of interleukin-12 secretion(GO:2001182) positive regulation of interleukin-12 secretion(GO:2001184) |
| 0.1 | 5.1 | GO:0006879 | cellular iron ion homeostasis(GO:0006879) |
| 0.1 | 0.5 | GO:0060266 | negative regulation of respiratory burst involved in inflammatory response(GO:0060266) negative regulation of respiratory burst(GO:0060268) |
| 0.1 | 3.4 | GO:0018345 | protein palmitoylation(GO:0018345) |
| 0.1 | 1.9 | GO:0032515 | negative regulation of phosphoprotein phosphatase activity(GO:0032515) |
| 0.1 | 1.9 | GO:0043248 | proteasome assembly(GO:0043248) |
| 0.1 | 0.5 | GO:0007603 | phototransduction, visible light(GO:0007603) |
| 0.1 | 1.8 | GO:0022027 | interkinetic nuclear migration(GO:0022027) |
| 0.1 | 0.5 | GO:0060022 | hard palate development(GO:0060022) |
| 0.1 | 0.8 | GO:0070445 | oligodendrocyte progenitor proliferation(GO:0070444) regulation of oligodendrocyte progenitor proliferation(GO:0070445) |
| 0.1 | 0.8 | GO:0010815 | bradykinin catabolic process(GO:0010815) |
| 0.1 | 2.8 | GO:0009299 | mRNA transcription(GO:0009299) |
| 0.1 | 1.3 | GO:0034244 | negative regulation of transcription elongation from RNA polymerase II promoter(GO:0034244) |
| 0.1 | 1.1 | GO:0031274 | positive regulation of pseudopodium assembly(GO:0031274) |
| 0.1 | 1.7 | GO:0051123 | RNA polymerase II transcriptional preinitiation complex assembly(GO:0051123) |
| 0.1 | 0.3 | GO:0038128 | ERBB2 signaling pathway(GO:0038128) |
| 0.1 | 1.5 | GO:0019430 | removal of superoxide radicals(GO:0019430) |
| 0.1 | 1.2 | GO:0010667 | negative regulation of cardiac muscle cell apoptotic process(GO:0010667) |
| 0.1 | 0.5 | GO:0060052 | neurofilament cytoskeleton organization(GO:0060052) |
| 0.1 | 4.1 | GO:0030512 | negative regulation of transforming growth factor beta receptor signaling pathway(GO:0030512) negative regulation of cellular response to transforming growth factor beta stimulus(GO:1903845) |
| 0.1 | 0.6 | GO:0048742 | regulation of skeletal muscle fiber development(GO:0048742) |
| 0.1 | 0.8 | GO:0030150 | protein import into mitochondrial matrix(GO:0030150) |
| 0.1 | 3.3 | GO:0009060 | aerobic respiration(GO:0009060) |
| 0.1 | 0.2 | GO:2001269 | positive regulation of cysteine-type endopeptidase activity involved in apoptotic signaling pathway(GO:2001269) |
| 0.1 | 0.6 | GO:1900119 | positive regulation of execution phase of apoptosis(GO:1900119) |
| 0.1 | 3.4 | GO:0032543 | mitochondrial translation(GO:0032543) |
| 0.1 | 0.7 | GO:0071257 | cellular response to electrical stimulus(GO:0071257) |
| 0.1 | 0.3 | GO:0031053 | primary miRNA processing(GO:0031053) |
| 0.1 | 1.0 | GO:0090005 | negative regulation of establishment of protein localization to plasma membrane(GO:0090005) |
| 0.0 | 0.6 | GO:0021521 | ventral spinal cord interneuron specification(GO:0021521) cell fate specification involved in pattern specification(GO:0060573) |
| 0.0 | 3.3 | GO:0043966 | histone H3 acetylation(GO:0043966) |
| 0.0 | 1.8 | GO:0000184 | nuclear-transcribed mRNA catabolic process, nonsense-mediated decay(GO:0000184) |
| 0.0 | 0.3 | GO:0006620 | posttranslational protein targeting to membrane(GO:0006620) |
| 0.0 | 0.7 | GO:1902187 | negative regulation of viral release from host cell(GO:1902187) |
| 0.0 | 3.4 | GO:0001578 | microtubule bundle formation(GO:0001578) |
| 0.0 | 0.3 | GO:0017196 | N-terminal peptidyl-methionine acetylation(GO:0017196) |
| 0.0 | 0.3 | GO:0033299 | secretion of lysosomal enzymes(GO:0033299) |
| 0.0 | 0.5 | GO:0006654 | phosphatidic acid biosynthetic process(GO:0006654) phosphatidic acid metabolic process(GO:0046473) |
| 0.0 | 3.8 | GO:2001237 | negative regulation of extrinsic apoptotic signaling pathway(GO:2001237) |
| 0.0 | 0.2 | GO:0045717 | negative regulation of fatty acid biosynthetic process(GO:0045717) |
| 0.0 | 0.3 | GO:0033314 | mitotic DNA replication checkpoint(GO:0033314) |
| 0.0 | 1.3 | GO:2001222 | regulation of neuron migration(GO:2001222) |
| 0.0 | 0.4 | GO:0090308 | regulation of methylation-dependent chromatin silencing(GO:0090308) |
| 0.0 | 1.2 | GO:0006446 | regulation of translational initiation(GO:0006446) |
| 0.0 | 0.5 | GO:0016226 | iron-sulfur cluster assembly(GO:0016226) metallo-sulfur cluster assembly(GO:0031163) |
| 0.0 | 0.5 | GO:0090502 | RNA phosphodiester bond hydrolysis, endonucleolytic(GO:0090502) |
| 0.0 | 0.4 | GO:0015937 | coenzyme A biosynthetic process(GO:0015937) |
| 0.0 | 0.5 | GO:2000269 | regulation of fibroblast apoptotic process(GO:2000269) |
| 0.0 | 0.4 | GO:0016973 | poly(A)+ mRNA export from nucleus(GO:0016973) |
| 0.0 | 0.9 | GO:0030490 | maturation of SSU-rRNA(GO:0030490) |
| 0.0 | 4.4 | GO:0045216 | cell-cell junction organization(GO:0045216) |
| 0.0 | 2.9 | GO:0006364 | rRNA processing(GO:0006364) |
| 0.0 | 1.8 | GO:0006487 | protein N-linked glycosylation(GO:0006487) |
| 0.0 | 0.3 | GO:0072673 | lamellipodium morphogenesis(GO:0072673) |
| 0.0 | 0.6 | GO:0051452 | intracellular pH reduction(GO:0051452) |
| 0.0 | 0.5 | GO:0001947 | heart looping(GO:0001947) |
| 0.0 | 0.1 | GO:0051697 | protein delipidation(GO:0051697) |
| 0.0 | 1.3 | GO:0009408 | response to heat(GO:0009408) |
| 0.0 | 1.0 | GO:0048146 | positive regulation of fibroblast proliferation(GO:0048146) |
| 0.0 | 0.4 | GO:0030488 | tRNA methylation(GO:0030488) |
| 0.0 | 0.8 | GO:0005978 | glycogen biosynthetic process(GO:0005978) glucan biosynthetic process(GO:0009250) |
| 0.0 | 0.0 | GO:0009153 | purine deoxyribonucleotide biosynthetic process(GO:0009153) |
| 0.0 | 0.9 | GO:0050728 | negative regulation of inflammatory response(GO:0050728) |
| 0.0 | 0.5 | GO:0010501 | RNA secondary structure unwinding(GO:0010501) |
| 0.0 | 0.9 | GO:0042147 | retrograde transport, endosome to Golgi(GO:0042147) |
| 0.0 | 0.7 | GO:1902653 | cholesterol biosynthetic process(GO:0006695) secondary alcohol biosynthetic process(GO:1902653) |
| 0.0 | 0.8 | GO:0090263 | positive regulation of canonical Wnt signaling pathway(GO:0090263) |
| 0.0 | 0.3 | GO:0044342 | type B pancreatic cell proliferation(GO:0044342) |
| 0.0 | 0.8 | GO:0042254 | ribosome biogenesis(GO:0042254) |
| 0.0 | 0.2 | GO:0045653 | negative regulation of megakaryocyte differentiation(GO:0045653) |
| 0.0 | 1.6 | GO:0032886 | regulation of microtubule-based process(GO:0032886) |
| 0.0 | 0.3 | GO:1902259 | regulation of delayed rectifier potassium channel activity(GO:1902259) |
| 0.0 | 0.3 | GO:0046677 | response to antibiotic(GO:0046677) |
| 0.0 | 0.3 | GO:0001706 | endoderm formation(GO:0001706) |
| 0.0 | 0.2 | GO:0071480 | cellular response to gamma radiation(GO:0071480) |
Gene overrepresentation in cellular_component category:
| Log-likelihood per target | Total log-likelihood | Term | Description |
|---|---|---|---|
| 1.2 | 4.7 | GO:0008537 | proteasome activator complex(GO:0008537) |
| 0.9 | 2.6 | GO:0036387 | nuclear pre-replicative complex(GO:0005656) pre-replicative complex(GO:0036387) |
| 0.8 | 2.4 | GO:0031983 | vesicle lumen(GO:0031983) |
| 0.6 | 7.9 | GO:0034663 | endoplasmic reticulum chaperone complex(GO:0034663) |
| 0.6 | 8.9 | GO:0042555 | MCM complex(GO:0042555) |
| 0.5 | 4.9 | GO:0017101 | aminoacyl-tRNA synthetase multienzyme complex(GO:0017101) |
| 0.5 | 1.5 | GO:0030690 | Noc1p-Noc2p complex(GO:0030690) |
| 0.5 | 1.4 | GO:0020018 | ciliary pocket(GO:0020016) ciliary pocket membrane(GO:0020018) |
| 0.5 | 2.8 | GO:0005853 | eukaryotic translation elongation factor 1 complex(GO:0005853) |
| 0.4 | 2.4 | GO:0043564 | Ku70:Ku80 complex(GO:0043564) |
| 0.4 | 5.0 | GO:0008250 | oligosaccharyltransferase complex(GO:0008250) |
| 0.3 | 1.3 | GO:0032021 | NELF complex(GO:0032021) |
| 0.3 | 5.0 | GO:0034719 | SMN-Sm protein complex(GO:0034719) |
| 0.3 | 1.7 | GO:0070847 | core mediator complex(GO:0070847) |
| 0.2 | 4.4 | GO:0016327 | apicolateral plasma membrane(GO:0016327) |
| 0.2 | 2.1 | GO:0000800 | lateral element(GO:0000800) |
| 0.2 | 2.5 | GO:0000164 | protein phosphatase type 1 complex(GO:0000164) |
| 0.2 | 0.9 | GO:0002193 | MAML1-RBP-Jkappa- ICN1 complex(GO:0002193) |
| 0.2 | 0.7 | GO:0016012 | sarcoglycan complex(GO:0016012) |
| 0.2 | 3.0 | GO:0000145 | exocyst(GO:0000145) |
| 0.2 | 1.2 | GO:0033588 | Elongator holoenzyme complex(GO:0033588) |
| 0.2 | 1.2 | GO:0016281 | eukaryotic translation initiation factor 4F complex(GO:0016281) |
| 0.1 | 2.1 | GO:0045239 | tricarboxylic acid cycle enzyme complex(GO:0045239) |
| 0.1 | 1.5 | GO:0043240 | Fanconi anaemia nuclear complex(GO:0043240) |
| 0.1 | 2.3 | GO:0005839 | proteasome core complex(GO:0005839) |
| 0.1 | 0.5 | GO:0097361 | CIA complex(GO:0097361) |
| 0.1 | 2.1 | GO:0033276 | transcription factor TFTC complex(GO:0033276) |
| 0.1 | 0.5 | GO:0097025 | MPP7-DLG1-LIN7 complex(GO:0097025) |
| 0.1 | 8.7 | GO:0000313 | organellar ribosome(GO:0000313) mitochondrial ribosome(GO:0005761) |
| 0.1 | 0.7 | GO:0070688 | MLL5-L complex(GO:0070688) |
| 0.1 | 1.9 | GO:0005666 | DNA-directed RNA polymerase III complex(GO:0005666) |
| 0.1 | 0.8 | GO:0005642 | annulate lamellae(GO:0005642) |
| 0.1 | 3.8 | GO:0022627 | cytosolic small ribosomal subunit(GO:0022627) |
| 0.1 | 1.2 | GO:0032580 | Golgi cisterna membrane(GO:0032580) |
| 0.1 | 6.1 | GO:0005643 | nuclear pore(GO:0005643) |
| 0.1 | 0.5 | GO:0030677 | nucleolar ribonuclease P complex(GO:0005655) ribonuclease P complex(GO:0030677) multimeric ribonuclease P complex(GO:0030681) |
| 0.1 | 1.6 | GO:0002102 | podosome(GO:0002102) |
| 0.1 | 1.9 | GO:0030687 | preribosome, large subunit precursor(GO:0030687) |
| 0.1 | 3.3 | GO:0005876 | spindle microtubule(GO:0005876) |
| 0.1 | 0.5 | GO:0005883 | neurofilament(GO:0005883) |
| 0.1 | 0.8 | GO:0005686 | U2 snRNP(GO:0005686) |
| 0.1 | 1.7 | GO:0032588 | trans-Golgi network membrane(GO:0032588) |
| 0.0 | 0.5 | GO:0042622 | photoreceptor outer segment membrane(GO:0042622) |
| 0.0 | 0.9 | GO:0070971 | endoplasmic reticulum exit site(GO:0070971) |
| 0.0 | 3.2 | GO:0016234 | inclusion body(GO:0016234) |
| 0.0 | 0.9 | GO:0005838 | proteasome regulatory particle(GO:0005838) proteasome accessory complex(GO:0022624) |
| 0.0 | 1.4 | GO:0035145 | exon-exon junction complex(GO:0035145) |
| 0.0 | 2.7 | GO:0071013 | catalytic step 2 spliceosome(GO:0071013) |
| 0.0 | 2.0 | GO:0005657 | replication fork(GO:0005657) |
| 0.0 | 1.0 | GO:0035869 | ciliary transition zone(GO:0035869) |
| 0.0 | 2.5 | GO:0030880 | RNA polymerase complex(GO:0030880) |
| 0.0 | 0.3 | GO:0031209 | SCAR complex(GO:0031209) |
| 0.0 | 0.3 | GO:0031414 | N-terminal protein acetyltransferase complex(GO:0031414) |
| 0.0 | 2.1 | GO:0005840 | ribosome(GO:0005840) |
| 0.0 | 0.9 | GO:0030964 | mitochondrial respiratory chain complex I(GO:0005747) NADH dehydrogenase complex(GO:0030964) respiratory chain complex I(GO:0045271) |
| 0.0 | 1.8 | GO:0005604 | basement membrane(GO:0005604) |
| 0.0 | 1.2 | GO:0005720 | nuclear heterochromatin(GO:0005720) |
| 0.0 | 1.2 | GO:0031526 | brush border membrane(GO:0031526) |
| 0.0 | 0.2 | GO:0035631 | CD40 receptor complex(GO:0035631) |
| 0.0 | 2.1 | GO:0005923 | bicellular tight junction(GO:0005923) |
| 0.0 | 0.4 | GO:0005719 | nuclear euchromatin(GO:0005719) |
| 0.0 | 1.6 | GO:0043209 | myelin sheath(GO:0043209) |
| 0.0 | 22.4 | GO:0005739 | mitochondrion(GO:0005739) |
| 0.0 | 1.1 | GO:0016607 | nuclear speck(GO:0016607) |
| 0.0 | 3.9 | GO:0005925 | focal adhesion(GO:0005925) |
Gene overrepresentation in molecular_function category:
| Log-likelihood per target | Total log-likelihood | Term | Description |
|---|---|---|---|
| 0.9 | 3.7 | GO:0015349 | thyroid hormone transmembrane transporter activity(GO:0015349) |
| 0.7 | 2.0 | GO:0035402 | histone kinase activity (H3-T11 specific)(GO:0035402) |
| 0.6 | 4.9 | GO:0008097 | 5S rRNA binding(GO:0008097) |
| 0.6 | 4.7 | GO:0061133 | endopeptidase activator activity(GO:0061133) |
| 0.6 | 5.0 | GO:0004579 | dolichyl-diphosphooligosaccharide-protein glycotransferase activity(GO:0004579) |
| 0.5 | 2.8 | GO:0008239 | dipeptidyl-peptidase activity(GO:0008239) |
| 0.5 | 1.4 | GO:0005105 | type 1 fibroblast growth factor receptor binding(GO:0005105) |
| 0.4 | 3.1 | GO:0043237 | laminin-1 binding(GO:0043237) |
| 0.4 | 1.8 | GO:0004692 | cGMP-dependent protein kinase activity(GO:0004692) |
| 0.4 | 1.2 | GO:0010484 | H3 histone acetyltransferase activity(GO:0010484) |
| 0.4 | 4.1 | GO:0015299 | solute:proton antiporter activity(GO:0015299) |
| 0.4 | 1.4 | GO:0031735 | CCR10 chemokine receptor binding(GO:0031735) |
| 0.4 | 1.1 | GO:0009881 | photoreceptor activity(GO:0009881) |
| 0.3 | 8.1 | GO:0070064 | proline-rich region binding(GO:0070064) |
| 0.3 | 1.3 | GO:0015141 | succinate transmembrane transporter activity(GO:0015141) |
| 0.3 | 1.0 | GO:0004126 | cytidine deaminase activity(GO:0004126) |
| 0.3 | 2.6 | GO:0003688 | DNA replication origin binding(GO:0003688) |
| 0.3 | 2.1 | GO:0000150 | recombinase activity(GO:0000150) |
| 0.3 | 1.5 | GO:0031493 | nucleosomal histone binding(GO:0031493) |
| 0.3 | 2.5 | GO:0004865 | protein serine/threonine phosphatase inhibitor activity(GO:0004865) |
| 0.3 | 5.2 | GO:0004198 | calcium-dependent cysteine-type endopeptidase activity(GO:0004198) |
| 0.3 | 0.8 | GO:0048039 | oxidoreductase activity, acting on the CH-CH group of donors, quinone or related compound as acceptor(GO:0016635) ubiquinone binding(GO:0048039) |
| 0.3 | 2.4 | GO:0051575 | 5'-deoxyribose-5-phosphate lyase activity(GO:0051575) |
| 0.2 | 1.2 | GO:0004719 | protein-L-isoaspartate (D-aspartate) O-methyltransferase activity(GO:0004719) |
| 0.2 | 1.4 | GO:0043426 | MRF binding(GO:0043426) |
| 0.2 | 1.1 | GO:0005134 | interleukin-2 receptor binding(GO:0005134) |
| 0.2 | 3.1 | GO:0016863 | intramolecular oxidoreductase activity, transposing C=C bonds(GO:0016863) |
| 0.2 | 3.0 | GO:0005536 | glucose binding(GO:0005536) |
| 0.2 | 0.8 | GO:0035514 | DNA demethylase activity(GO:0035514) oxidative RNA demethylase activity(GO:0035515) |
| 0.2 | 4.1 | GO:0017049 | GTP-Rho binding(GO:0017049) |
| 0.2 | 9.9 | GO:0004003 | ATP-dependent DNA helicase activity(GO:0004003) |
| 0.2 | 2.3 | GO:0016805 | dipeptidase activity(GO:0016805) |
| 0.2 | 3.2 | GO:0070006 | metalloaminopeptidase activity(GO:0070006) |
| 0.2 | 1.6 | GO:0043023 | ribosomal large subunit binding(GO:0043023) |
| 0.2 | 1.3 | GO:0055131 | C3HC4-type RING finger domain binding(GO:0055131) |
| 0.2 | 3.1 | GO:0071855 | neuropeptide receptor binding(GO:0071855) |
| 0.2 | 0.9 | GO:0031685 | adenosine receptor binding(GO:0031685) |
| 0.1 | 1.0 | GO:0043495 | protein anchor(GO:0043495) |
| 0.1 | 2.9 | GO:0017056 | structural constituent of nuclear pore(GO:0017056) |
| 0.1 | 3.4 | GO:0019706 | protein-cysteine S-palmitoyltransferase activity(GO:0019706) |
| 0.1 | 3.7 | GO:0003746 | translation elongation factor activity(GO:0003746) |
| 0.1 | 0.4 | GO:0004140 | dephospho-CoA kinase activity(GO:0004140) |
| 0.1 | 0.4 | GO:0004887 | thyroid hormone receptor activity(GO:0004887) |
| 0.1 | 1.6 | GO:0008301 | DNA binding, bending(GO:0008301) |
| 0.1 | 1.2 | GO:0008190 | eukaryotic initiation factor 4E binding(GO:0008190) |
| 0.1 | 2.4 | GO:0035380 | C-3 sterol dehydrogenase (C-4 sterol decarboxylase) activity(GO:0000252) mevaldate reductase activity(GO:0004495) gluconate dehydrogenase activity(GO:0008875) epoxide dehydrogenase activity(GO:0018451) 5-exo-hydroxycamphor dehydrogenase activity(GO:0018452) 2-hydroxytetrahydrofuran dehydrogenase activity(GO:0018453) acetoin dehydrogenase activity(GO:0019152) phenylcoumaran benzylic ether reductase activity(GO:0032442) D-xylose:NADP reductase activity(GO:0032866) L-arabinose:NADP reductase activity(GO:0032867) D-arabinitol dehydrogenase, D-ribulose forming (NADP+) activity(GO:0033709) (R)-(-)-1,2,3,4-tetrahydronaphthol dehydrogenase activity(GO:0034831) 3-hydroxymenthone dehydrogenase activity(GO:0034840) very long-chain-3-hydroxyacyl-CoA dehydrogenase activity(GO:0035380) dihydrotestosterone 17-beta-dehydrogenase activity(GO:0035410) (R)-2-hydroxyisocaproate dehydrogenase activity(GO:0043713) L-arabinose 1-dehydrogenase (NADP+) activity(GO:0044103) L-xylulose reductase (NAD+) activity(GO:0044105) 3-ketoglucose-reductase activity(GO:0048258) D-arabinitol dehydrogenase, D-xylulose forming (NADP+) activity(GO:0052677) |
| 0.1 | 0.9 | GO:0031492 | nucleosomal DNA binding(GO:0031492) |
| 0.1 | 2.3 | GO:0004298 | threonine-type endopeptidase activity(GO:0004298) threonine-type peptidase activity(GO:0070003) |
| 0.1 | 0.5 | GO:0097016 | L27 domain binding(GO:0097016) |
| 0.1 | 0.6 | GO:0019841 | retinol binding(GO:0019841) |
| 0.1 | 2.0 | GO:0004435 | phosphatidylinositol phospholipase C activity(GO:0004435) |
| 0.1 | 2.0 | GO:0043236 | laminin binding(GO:0043236) |
| 0.1 | 0.5 | GO:0047391 | alkylglycerophosphoethanolamine phosphodiesterase activity(GO:0047391) |
| 0.1 | 1.8 | GO:0004550 | nucleoside diphosphate kinase activity(GO:0004550) |
| 0.1 | 4.4 | GO:0003899 | DNA-directed RNA polymerase activity(GO:0003899) |
| 0.1 | 2.5 | GO:0017025 | TBP-class protein binding(GO:0017025) |
| 0.1 | 2.1 | GO:0016836 | hydro-lyase activity(GO:0016836) |
| 0.1 | 0.7 | GO:0030957 | Tat protein binding(GO:0030957) |
| 0.1 | 5.5 | GO:0000980 | RNA polymerase II distal enhancer sequence-specific DNA binding(GO:0000980) |
| 0.1 | 0.5 | GO:0008186 | RNA helicase activity(GO:0003724) ATP-dependent RNA helicase activity(GO:0004004) RNA-dependent ATPase activity(GO:0008186) |
| 0.1 | 0.3 | GO:0001069 | regulatory region RNA binding(GO:0001069) |
| 0.1 | 0.5 | GO:0070700 | BMP receptor binding(GO:0070700) |
| 0.0 | 0.5 | GO:0004526 | ribonuclease P activity(GO:0004526) |
| 0.0 | 1.1 | GO:0016709 | oxidoreductase activity, acting on paired donors, with incorporation or reduction of molecular oxygen, NAD(P)H as one donor, and incorporation of one atom of oxygen(GO:0016709) |
| 0.0 | 2.6 | GO:0098811 | transcriptional activator activity, RNA polymerase II transcription factor binding(GO:0001190) transcriptional repressor activity, RNA polymerase II activating transcription factor binding(GO:0098811) |
| 0.0 | 0.9 | GO:0001784 | phosphotyrosine binding(GO:0001784) |
| 0.0 | 0.6 | GO:0008308 | voltage-gated anion channel activity(GO:0008308) |
| 0.0 | 0.9 | GO:0050136 | NADH dehydrogenase (ubiquinone) activity(GO:0008137) NADH dehydrogenase (quinone) activity(GO:0050136) |
| 0.0 | 6.5 | GO:0003735 | structural constituent of ribosome(GO:0003735) |
| 0.0 | 1.4 | GO:0004896 | cytokine receptor activity(GO:0004896) |
| 0.0 | 2.0 | GO:0008376 | acetylgalactosaminyltransferase activity(GO:0008376) |
| 0.0 | 1.1 | GO:0061631 | ubiquitin conjugating enzyme activity(GO:0061631) |
| 0.0 | 0.5 | GO:0003841 | 1-acylglycerol-3-phosphate O-acyltransferase activity(GO:0003841) |
| 0.0 | 0.8 | GO:0017017 | MAP kinase tyrosine/serine/threonine phosphatase activity(GO:0017017) |
| 0.0 | 1.3 | GO:0004402 | histone acetyltransferase activity(GO:0004402) |
| 0.0 | 0.3 | GO:0004596 | peptide alpha-N-acetyltransferase activity(GO:0004596) |
| 0.0 | 0.6 | GO:0051059 | NF-kappaB binding(GO:0051059) |
| 0.0 | 0.3 | GO:0005035 | tumor necrosis factor-activated receptor activity(GO:0005031) death receptor activity(GO:0005035) |
| 0.0 | 0.1 | GO:0050347 | trans-hexaprenyltranstransferase activity(GO:0000010) trans-octaprenyltranstransferase activity(GO:0050347) |
| 0.0 | 0.8 | GO:0004722 | protein serine/threonine phosphatase activity(GO:0004722) |
| 0.0 | 0.3 | GO:0043022 | ribosome binding(GO:0043022) |
| 0.0 | 3.7 | GO:0001077 | transcriptional activator activity, RNA polymerase II core promoter proximal region sequence-specific binding(GO:0001077) |
| 0.0 | 0.2 | GO:0042826 | histone deacetylase binding(GO:0042826) |
| 0.0 | 2.1 | GO:0008234 | cysteine-type peptidase activity(GO:0008234) |
| 0.0 | 0.4 | GO:0004707 | MAP kinase activity(GO:0004707) |
| 0.0 | 0.6 | GO:0004540 | ribonuclease activity(GO:0004540) |
| 0.0 | 0.3 | GO:0015929 | hexosaminidase activity(GO:0015929) |
| 0.0 | 0.2 | GO:0003950 | NAD+ ADP-ribosyltransferase activity(GO:0003950) |
| 0.0 | 0.9 | GO:0048306 | calcium-dependent protein binding(GO:0048306) |
| 0.0 | 0.7 | GO:0016300 | tRNA (uracil) methyltransferase activity(GO:0016300) |