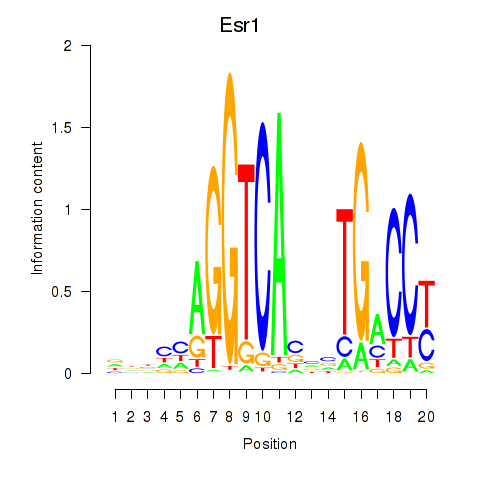
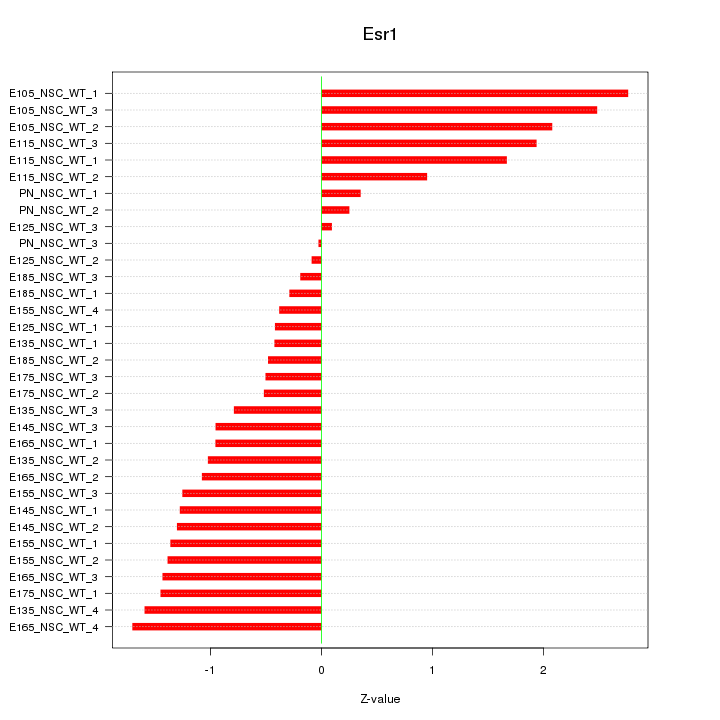
Motif ID: Esr1
Z-value: 1.231
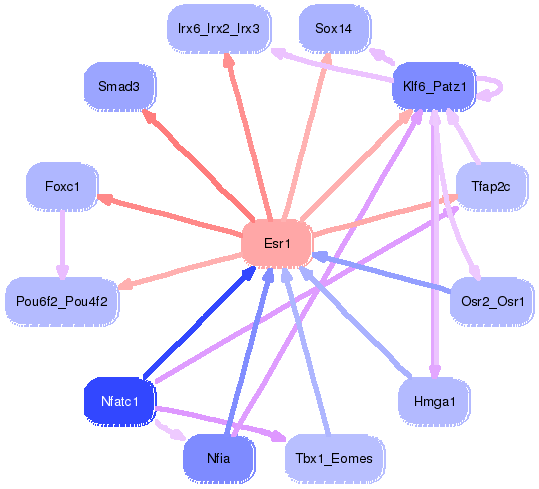
Transcription factors associated with Esr1:
| Gene Symbol | Entrez ID | Gene Name |
|---|---|---|
| Esr1 | ENSMUSG00000019768.10 | Esr1 |
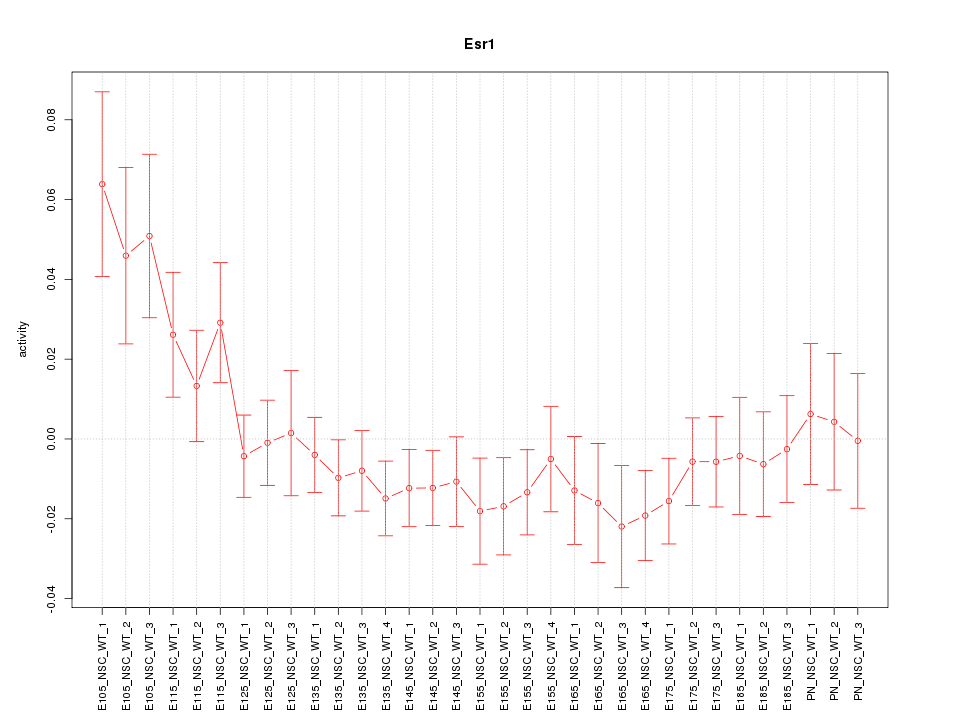
Activity-expression correlation:
| Gene Symbol | Promoter | Pearson corr. coef. | P-value | Plot |
|---|---|---|---|---|
| Esr1 | mm10_v2_chr10_+_4611971_4612021 | -0.39 | 2.5e-02 | Click! |

Top targets:
Gene overrepresentation in biological_process category:
| Log-likelihood per target | Total log-likelihood | Term | Description |
|---|---|---|---|
| 4.3 | 12.8 | GO:1904274 | tricellular tight junction assembly(GO:1904274) |
| 3.2 | 13.0 | GO:0032439 | endosome localization(GO:0032439) |
| 2.9 | 11.6 | GO:0035606 | peptidyl-cysteine S-trans-nitrosylation(GO:0035606) |
| 2.4 | 7.1 | GO:0016115 | terpenoid catabolic process(GO:0016115) |
| 1.7 | 5.1 | GO:0072204 | cell-cell signaling involved in kidney development(GO:0060995) Wnt signaling pathway involved in kidney development(GO:0061289) canonical Wnt signaling pathway involved in metanephric kidney development(GO:0061290) cell-cell signaling involved in metanephros development(GO:0072204) |
| 1.7 | 5.0 | GO:0002765 | immune response-inhibiting signal transduction(GO:0002765) |
| 1.6 | 4.9 | GO:0044413 | evasion or tolerance of host defenses by virus(GO:0019049) positive regulation of transforming growth factor beta3 production(GO:0032916) avoidance of host defenses(GO:0044413) evasion or tolerance of host defenses(GO:0044415) avoidance of defenses of other organism involved in symbiotic interaction(GO:0051832) evasion or tolerance of defenses of other organism involved in symbiotic interaction(GO:0051834) |
| 1.6 | 4.8 | GO:0015938 | coenzyme A catabolic process(GO:0015938) nucleoside bisphosphate catabolic process(GO:0033869) ribonucleoside bisphosphate catabolic process(GO:0034031) purine nucleoside bisphosphate catabolic process(GO:0034034) |
| 1.6 | 4.7 | GO:0018298 | protein-chromophore linkage(GO:0018298) |
| 1.5 | 6.1 | GO:0014846 | esophagus smooth muscle contraction(GO:0014846) glial cell-derived neurotrophic factor receptor signaling pathway(GO:0035860) |
| 1.4 | 4.1 | GO:0003278 | apoptotic process involved in heart morphogenesis(GO:0003278) |
| 1.3 | 4.0 | GO:0044778 | meiotic DNA integrity checkpoint(GO:0044778) |
| 1.3 | 3.9 | GO:1903225 | negative regulation of endodermal cell differentiation(GO:1903225) |
| 1.2 | 6.1 | GO:0019659 | lactate biosynthetic process from pyruvate(GO:0019244) lactate biosynthetic process(GO:0019249) glucose catabolic process to lactate(GO:0019659) glycolytic fermentation(GO:0019660) glucose catabolic process to lactate via pyruvate(GO:0019661) |
| 1.1 | 3.2 | GO:0046122 | purine deoxyribonucleoside metabolic process(GO:0046122) |
| 1.0 | 2.1 | GO:0002578 | negative regulation of antigen processing and presentation(GO:0002578) |
| 1.0 | 3.0 | GO:2000393 | negative regulation of lamellipodium morphogenesis(GO:2000393) |
| 1.0 | 2.9 | GO:0006657 | CDP-choline pathway(GO:0006657) |
| 0.9 | 2.8 | GO:0060598 | dichotomous subdivision of terminal units involved in mammary gland duct morphogenesis(GO:0060598) |
| 0.9 | 6.3 | GO:1904667 | negative regulation of ubiquitin protein ligase activity(GO:1904667) |
| 0.8 | 2.5 | GO:0014063 | negative regulation of serotonin secretion(GO:0014063) |
| 0.8 | 2.4 | GO:0045819 | positive regulation of glycogen catabolic process(GO:0045819) |
| 0.8 | 5.4 | GO:2000491 | positive regulation of hepatic stellate cell activation(GO:2000491) |
| 0.8 | 3.9 | GO:1900122 | positive regulation of receptor binding(GO:1900122) |
| 0.8 | 2.3 | GO:0006083 | acetate metabolic process(GO:0006083) |
| 0.7 | 2.1 | GO:0014738 | regulation of muscle hyperplasia(GO:0014738) muscle hyperplasia(GO:0014900) |
| 0.7 | 6.9 | GO:0030388 | fructose 1,6-bisphosphate metabolic process(GO:0030388) |
| 0.7 | 2.1 | GO:0060392 | negative regulation of SMAD protein import into nucleus(GO:0060392) |
| 0.7 | 2.0 | GO:0060244 | negative regulation of cell proliferation involved in contact inhibition(GO:0060244) |
| 0.6 | 1.9 | GO:0010814 | substance P catabolic process(GO:0010814) calcitonin catabolic process(GO:0010816) endothelin maturation(GO:0034959) |
| 0.6 | 6.4 | GO:0008063 | Toll signaling pathway(GO:0008063) |
| 0.6 | 2.4 | GO:1901165 | positive regulation of trophoblast cell migration(GO:1901165) |
| 0.6 | 2.4 | GO:0071449 | cellular response to lipid hydroperoxide(GO:0071449) |
| 0.6 | 10.1 | GO:2000353 | positive regulation of endothelial cell apoptotic process(GO:2000353) |
| 0.6 | 2.9 | GO:0030091 | protein repair(GO:0030091) |
| 0.6 | 1.7 | GO:0010958 | regulation of amino acid import(GO:0010958) regulation of L-arginine import(GO:0010963) |
| 0.6 | 1.7 | GO:0046061 | dATP catabolic process(GO:0046061) |
| 0.5 | 1.6 | GO:1903048 | regulation of acetylcholine-gated cation channel activity(GO:1903048) |
| 0.5 | 1.6 | GO:0072356 | chromosome passenger complex localization to kinetochore(GO:0072356) |
| 0.5 | 1.6 | GO:0009174 | UMP biosynthetic process(GO:0006222) pyrimidine ribonucleoside monophosphate metabolic process(GO:0009173) pyrimidine ribonucleoside monophosphate biosynthetic process(GO:0009174) UMP metabolic process(GO:0046049) |
| 0.5 | 1.6 | GO:0002035 | brain renin-angiotensin system(GO:0002035) |
| 0.5 | 1.5 | GO:0006420 | arginyl-tRNA aminoacylation(GO:0006420) |
| 0.5 | 1.9 | GO:0043973 | histone H3-K4 acetylation(GO:0043973) |
| 0.5 | 1.4 | GO:0070093 | negative regulation of glucagon secretion(GO:0070093) |
| 0.5 | 0.9 | GO:0035106 | operant conditioning(GO:0035106) |
| 0.5 | 5.5 | GO:2000254 | regulation of male germ cell proliferation(GO:2000254) |
| 0.5 | 3.2 | GO:0090170 | regulation of Golgi inheritance(GO:0090170) |
| 0.4 | 1.7 | GO:0018242 | protein O-linked glycosylation via serine(GO:0018242) |
| 0.4 | 1.7 | GO:0032901 | positive regulation of neurotrophin production(GO:0032901) |
| 0.4 | 2.4 | GO:0009235 | cobalamin metabolic process(GO:0009235) |
| 0.4 | 2.0 | GO:0030423 | targeting of mRNA for destruction involved in RNA interference(GO:0030423) |
| 0.4 | 2.0 | GO:0034316 | negative regulation of Arp2/3 complex-mediated actin nucleation(GO:0034316) |
| 0.4 | 1.2 | GO:0006566 | threonine metabolic process(GO:0006566) |
| 0.4 | 8.4 | GO:0014823 | response to activity(GO:0014823) |
| 0.4 | 1.1 | GO:0006597 | spermine biosynthetic process(GO:0006597) |
| 0.4 | 1.5 | GO:0015886 | heme transport(GO:0015886) |
| 0.4 | 0.7 | GO:0002572 | pro-T cell differentiation(GO:0002572) |
| 0.4 | 1.5 | GO:0000957 | mitochondrial RNA catabolic process(GO:0000957) regulation of mitochondrial RNA catabolic process(GO:0000960) |
| 0.4 | 1.5 | GO:0031581 | hemidesmosome assembly(GO:0031581) |
| 0.4 | 1.8 | GO:0031033 | myosin filament organization(GO:0031033) |
| 0.4 | 2.1 | GO:0042795 | snRNA transcription from RNA polymerase II promoter(GO:0042795) |
| 0.3 | 4.5 | GO:0043589 | skin morphogenesis(GO:0043589) |
| 0.3 | 1.0 | GO:0050787 | glycolate metabolic process(GO:0009441) enzyme active site formation via L-cysteine sulfinic acid(GO:0018323) primary alcohol biosynthetic process(GO:0034309) cellular response to glyoxal(GO:0036471) glycolate biosynthetic process(GO:0046295) detoxification of mercury ion(GO:0050787) negative regulation of TRAIL-activated apoptotic signaling pathway(GO:1903122) regulation of pyrroline-5-carboxylate reductase activity(GO:1903167) positive regulation of pyrroline-5-carboxylate reductase activity(GO:1903168) regulation of tyrosine 3-monooxygenase activity(GO:1903176) positive regulation of tyrosine 3-monooxygenase activity(GO:1903178) L-dopa metabolic process(GO:1903184) L-dopa biosynthetic process(GO:1903185) glyoxal metabolic process(GO:1903189) glyoxal catabolic process(GO:1903190) regulation of L-dopa biosynthetic process(GO:1903195) positive regulation of L-dopa biosynthetic process(GO:1903197) regulation of L-dopa decarboxylase activity(GO:1903198) positive regulation of L-dopa decarboxylase activity(GO:1903200) positive regulation of cellular amino acid biosynthetic process(GO:2000284) positive regulation of androgen receptor activity(GO:2000825) |
| 0.3 | 1.3 | GO:0006680 | glucosylceramide catabolic process(GO:0006680) |
| 0.3 | 0.9 | GO:0035519 | protein K29-linked ubiquitination(GO:0035519) |
| 0.3 | 1.5 | GO:0006348 | chromatin silencing at telomere(GO:0006348) |
| 0.3 | 3.1 | GO:0051574 | positive regulation of histone H3-K9 methylation(GO:0051574) |
| 0.3 | 0.3 | GO:0003134 | BMP signaling pathway involved in heart induction(GO:0003130) endodermal-mesodermal cell signaling(GO:0003133) endodermal-mesodermal cell signaling involved in heart induction(GO:0003134) |
| 0.3 | 1.2 | GO:1902990 | mitotic telomere maintenance via semi-conservative replication(GO:1902990) negative regulation of t-circle formation(GO:1904430) |
| 0.3 | 0.6 | GO:0046121 | deoxyribonucleoside catabolic process(GO:0046121) |
| 0.3 | 2.6 | GO:2000467 | positive regulation of glycogen (starch) synthase activity(GO:2000467) |
| 0.3 | 1.5 | GO:0071294 | cellular response to zinc ion(GO:0071294) |
| 0.3 | 5.2 | GO:0000920 | cell separation after cytokinesis(GO:0000920) |
| 0.3 | 0.8 | GO:0033566 | gamma-tubulin complex localization(GO:0033566) |
| 0.3 | 0.5 | GO:1901896 | positive regulation of calcium-transporting ATPase activity(GO:1901896) |
| 0.3 | 1.1 | GO:0031915 | positive regulation of synaptic plasticity(GO:0031915) |
| 0.3 | 0.8 | GO:0046022 | regulation of transcription from RNA polymerase II promoter, mitotic(GO:0046021) positive regulation of transcription from RNA polymerase II promoter during mitosis(GO:0046022) |
| 0.3 | 1.8 | GO:0008343 | adult feeding behavior(GO:0008343) |
| 0.3 | 1.0 | GO:0015793 | glycerol transport(GO:0015793) |
| 0.2 | 0.7 | GO:1904729 | regulation of intestinal cholesterol absorption(GO:0030300) regulation of intestinal absorption(GO:1904478) regulation of intestinal lipid absorption(GO:1904729) |
| 0.2 | 1.0 | GO:0018343 | protein farnesylation(GO:0018343) |
| 0.2 | 1.0 | GO:1904565 | response to 1-oleoyl-sn-glycerol 3-phosphate(GO:1904565) cellular response to 1-oleoyl-sn-glycerol 3-phosphate(GO:1904566) |
| 0.2 | 0.7 | GO:1902498 | regulation of protein autoubiquitination(GO:1902498) |
| 0.2 | 2.7 | GO:0035814 | negative regulation of renal sodium excretion(GO:0035814) |
| 0.2 | 0.9 | GO:0048312 | intracellular distribution of mitochondria(GO:0048312) |
| 0.2 | 1.4 | GO:1904715 | negative regulation of chaperone-mediated autophagy(GO:1904715) |
| 0.2 | 2.9 | GO:0006614 | SRP-dependent cotranslational protein targeting to membrane(GO:0006614) |
| 0.2 | 0.4 | GO:0036166 | phenotypic switching(GO:0036166) |
| 0.2 | 0.9 | GO:0070213 | protein auto-ADP-ribosylation(GO:0070213) |
| 0.2 | 1.1 | GO:0075525 | viral translational termination-reinitiation(GO:0075525) |
| 0.2 | 1.1 | GO:0042997 | negative regulation of Golgi to plasma membrane protein transport(GO:0042997) |
| 0.2 | 0.6 | GO:0000715 | nucleotide-excision repair, DNA damage recognition(GO:0000715) |
| 0.2 | 1.0 | GO:0042256 | mature ribosome assembly(GO:0042256) |
| 0.2 | 0.6 | GO:0060672 | epithelial cell differentiation involved in embryonic placenta development(GO:0060671) epithelial cell morphogenesis involved in placental branching(GO:0060672) |
| 0.2 | 0.6 | GO:0038165 | oncostatin-M-mediated signaling pathway(GO:0038165) |
| 0.2 | 6.9 | GO:0002474 | antigen processing and presentation of peptide antigen via MHC class I(GO:0002474) |
| 0.2 | 0.6 | GO:0010626 | negative regulation of Schwann cell proliferation(GO:0010626) |
| 0.2 | 0.6 | GO:0002940 | tRNA N2-guanine methylation(GO:0002940) |
| 0.2 | 1.5 | GO:0061002 | negative regulation of dendritic spine morphogenesis(GO:0061002) |
| 0.2 | 3.4 | GO:0035024 | negative regulation of Rho protein signal transduction(GO:0035024) |
| 0.2 | 0.5 | GO:1903998 | regulation of eating behavior(GO:1903998) |
| 0.2 | 1.0 | GO:2000767 | positive regulation of cytoplasmic translation(GO:2000767) |
| 0.2 | 3.6 | GO:0000028 | ribosomal small subunit assembly(GO:0000028) |
| 0.2 | 1.9 | GO:0016339 | calcium-dependent cell-cell adhesion via plasma membrane cell adhesion molecules(GO:0016339) |
| 0.2 | 1.1 | GO:0031848 | protection from non-homologous end joining at telomere(GO:0031848) |
| 0.2 | 0.5 | GO:1901731 | calcium-mediated signaling using extracellular calcium source(GO:0035585) positive regulation of platelet aggregation(GO:1901731) |
| 0.2 | 0.9 | GO:1903352 | ornithine transport(GO:0015822) L-ornithine transmembrane transport(GO:1903352) |
| 0.1 | 1.3 | GO:0045003 | DNA recombinase assembly(GO:0000730) double-strand break repair via synthesis-dependent strand annealing(GO:0045003) |
| 0.1 | 0.4 | GO:0032058 | positive regulation of translational initiation in response to stress(GO:0032058) |
| 0.1 | 0.4 | GO:0009051 | pentose-phosphate shunt, oxidative branch(GO:0009051) |
| 0.1 | 2.1 | GO:0050849 | negative regulation of calcium-mediated signaling(GO:0050849) |
| 0.1 | 0.4 | GO:0002176 | male germ cell proliferation(GO:0002176) |
| 0.1 | 0.9 | GO:0006452 | translational frameshifting(GO:0006452) positive regulation of translational termination(GO:0045905) |
| 0.1 | 3.7 | GO:0009649 | entrainment of circadian clock(GO:0009649) |
| 0.1 | 2.7 | GO:0032094 | response to food(GO:0032094) |
| 0.1 | 1.1 | GO:0071865 | regulation of apoptotic process in bone marrow(GO:0071865) negative regulation of apoptotic process in bone marrow(GO:0071866) |
| 0.1 | 0.8 | GO:0036066 | protein O-linked fucosylation(GO:0036066) |
| 0.1 | 0.8 | GO:0021631 | optic nerve morphogenesis(GO:0021631) |
| 0.1 | 0.7 | GO:0030579 | ubiquitin-dependent SMAD protein catabolic process(GO:0030579) |
| 0.1 | 0.7 | GO:0090666 | scaRNA localization to Cajal body(GO:0090666) |
| 0.1 | 0.4 | GO:0006436 | tryptophanyl-tRNA aminoacylation(GO:0006436) |
| 0.1 | 4.4 | GO:0001706 | endoderm formation(GO:0001706) |
| 0.1 | 0.5 | GO:0070127 | tRNA aminoacylation for mitochondrial protein translation(GO:0070127) |
| 0.1 | 0.5 | GO:0035616 | histone H2B conserved C-terminal lysine deubiquitination(GO:0035616) |
| 0.1 | 1.4 | GO:2000480 | negative regulation of cAMP-dependent protein kinase activity(GO:2000480) |
| 0.1 | 1.4 | GO:0061032 | visceral serous pericardium development(GO:0061032) |
| 0.1 | 0.5 | GO:0001550 | ovarian cumulus expansion(GO:0001550) fused antrum stage(GO:0048165) |
| 0.1 | 0.9 | GO:0006451 | selenocysteine incorporation(GO:0001514) translational readthrough(GO:0006451) |
| 0.1 | 0.9 | GO:0051534 | negative regulation of NFAT protein import into nucleus(GO:0051534) |
| 0.1 | 1.3 | GO:0048680 | positive regulation of axon regeneration(GO:0048680) |
| 0.1 | 1.3 | GO:0019262 | N-acetylneuraminate catabolic process(GO:0019262) |
| 0.1 | 0.4 | GO:0050862 | positive regulation of T cell receptor signaling pathway(GO:0050862) |
| 0.1 | 1.9 | GO:0006516 | glycoprotein catabolic process(GO:0006516) |
| 0.1 | 1.1 | GO:0018065 | protein-cofactor linkage(GO:0018065) |
| 0.1 | 1.3 | GO:0070050 | neuron cellular homeostasis(GO:0070050) |
| 0.1 | 2.0 | GO:0000186 | activation of MAPKK activity(GO:0000186) |
| 0.1 | 0.8 | GO:0061084 | negative regulation of protein refolding(GO:0061084) |
| 0.1 | 1.7 | GO:0043248 | proteasome assembly(GO:0043248) |
| 0.1 | 0.4 | GO:0032511 | late endosome to vacuole transport via multivesicular body sorting pathway(GO:0032511) protein targeting to vacuole involved in ubiquitin-dependent protein catabolic process via the multivesicular body sorting pathway(GO:0043328) |
| 0.1 | 0.4 | GO:0006624 | vacuolar protein processing(GO:0006624) |
| 0.1 | 1.9 | GO:0034643 | establishment of mitochondrion localization, microtubule-mediated(GO:0034643) mitochondrion transport along microtubule(GO:0047497) |
| 0.1 | 1.3 | GO:1902857 | positive regulation of nonmotile primary cilium assembly(GO:1902857) |
| 0.1 | 1.9 | GO:0031115 | negative regulation of microtubule polymerization(GO:0031115) |
| 0.1 | 0.3 | GO:0006776 | vitamin A metabolic process(GO:0006776) |
| 0.1 | 0.3 | GO:0051892 | negative regulation of cardioblast differentiation(GO:0051892) |
| 0.1 | 1.3 | GO:0071459 | protein localization to chromosome, centromeric region(GO:0071459) |
| 0.1 | 0.6 | GO:0006108 | malate metabolic process(GO:0006108) |
| 0.1 | 1.2 | GO:0033623 | regulation of integrin activation(GO:0033623) |
| 0.1 | 3.8 | GO:0043039 | tRNA aminoacylation(GO:0043039) |
| 0.1 | 0.1 | GO:0045410 | positive regulation of interleukin-6 biosynthetic process(GO:0045410) |
| 0.1 | 0.9 | GO:0009396 | folic acid-containing compound biosynthetic process(GO:0009396) |
| 0.1 | 0.2 | GO:0071603 | endothelial cell-cell adhesion(GO:0071603) |
| 0.1 | 0.9 | GO:2001214 | positive regulation of vasculogenesis(GO:2001214) |
| 0.1 | 0.7 | GO:0050774 | negative regulation of dendrite morphogenesis(GO:0050774) |
| 0.1 | 1.1 | GO:0033194 | response to hydroperoxide(GO:0033194) |
| 0.1 | 0.9 | GO:0034498 | early endosome to Golgi transport(GO:0034498) |
| 0.1 | 0.9 | GO:0060539 | diaphragm development(GO:0060539) |
| 0.1 | 1.4 | GO:0034142 | toll-like receptor 4 signaling pathway(GO:0034142) |
| 0.1 | 0.4 | GO:0046598 | positive regulation of viral entry into host cell(GO:0046598) |
| 0.1 | 0.7 | GO:1903608 | protein localization to cytoplasmic stress granule(GO:1903608) |
| 0.1 | 0.9 | GO:0061299 | retina vasculature morphogenesis in camera-type eye(GO:0061299) |
| 0.1 | 0.5 | GO:0001302 | replicative cell aging(GO:0001302) |
| 0.1 | 0.9 | GO:0007250 | activation of NF-kappaB-inducing kinase activity(GO:0007250) |
| 0.1 | 1.3 | GO:0050909 | sensory perception of taste(GO:0050909) |
| 0.1 | 0.1 | GO:0051654 | establishment of mitochondrion localization(GO:0051654) |
| 0.1 | 0.8 | GO:0060510 | Type II pneumocyte differentiation(GO:0060510) |
| 0.1 | 2.2 | GO:0000462 | maturation of SSU-rRNA from tricistronic rRNA transcript (SSU-rRNA, 5.8S rRNA, LSU-rRNA)(GO:0000462) |
| 0.1 | 1.0 | GO:0051292 | nuclear pore complex assembly(GO:0051292) |
| 0.1 | 1.4 | GO:0051123 | RNA polymerase II transcriptional preinitiation complex assembly(GO:0051123) |
| 0.1 | 1.9 | GO:0043687 | post-translational protein modification(GO:0043687) |
| 0.1 | 2.0 | GO:0006783 | heme biosynthetic process(GO:0006783) |
| 0.1 | 0.2 | GO:0009812 | flavonoid metabolic process(GO:0009812) flavonoid biosynthetic process(GO:0009813) flavonoid glucuronidation(GO:0052696) |
| 0.1 | 0.9 | GO:0014067 | negative regulation of phosphatidylinositol 3-kinase signaling(GO:0014067) |
| 0.1 | 1.5 | GO:0000266 | mitochondrial fission(GO:0000266) |
| 0.1 | 0.5 | GO:0090557 | establishment of endothelial intestinal barrier(GO:0090557) |
| 0.1 | 0.7 | GO:0032927 | positive regulation of activin receptor signaling pathway(GO:0032927) |
| 0.1 | 1.9 | GO:0033962 | cytoplasmic mRNA processing body assembly(GO:0033962) |
| 0.1 | 1.4 | GO:0033539 | fatty acid beta-oxidation using acyl-CoA dehydrogenase(GO:0033539) |
| 0.1 | 0.5 | GO:0032464 | positive regulation of protein homooligomerization(GO:0032464) |
| 0.1 | 1.1 | GO:0006465 | signal peptide processing(GO:0006465) |
| 0.1 | 0.2 | GO:0070124 | mitochondrial translational initiation(GO:0070124) |
| 0.1 | 6.3 | GO:0007088 | regulation of mitotic nuclear division(GO:0007088) |
| 0.1 | 0.6 | GO:0061302 | smooth muscle cell-matrix adhesion(GO:0061302) |
| 0.1 | 1.8 | GO:0045540 | regulation of cholesterol biosynthetic process(GO:0045540) |
| 0.1 | 1.6 | GO:0050873 | brown fat cell differentiation(GO:0050873) |
| 0.1 | 1.3 | GO:0030212 | hyaluronan metabolic process(GO:0030212) |
| 0.1 | 1.0 | GO:0071260 | cellular response to mechanical stimulus(GO:0071260) |
| 0.1 | 0.2 | GO:0097680 | double-strand break repair via classical nonhomologous end joining(GO:0097680) |
| 0.1 | 0.5 | GO:0021559 | trigeminal nerve development(GO:0021559) |
| 0.1 | 0.6 | GO:0030490 | maturation of SSU-rRNA(GO:0030490) |
| 0.1 | 1.2 | GO:0000154 | rRNA modification(GO:0000154) |
| 0.0 | 0.9 | GO:0008340 | determination of adult lifespan(GO:0008340) |
| 0.0 | 0.2 | GO:0060982 | coronary artery morphogenesis(GO:0060982) regulation of cargo loading into COPII-coated vesicle(GO:1901301) |
| 0.0 | 1.2 | GO:0071480 | cellular response to gamma radiation(GO:0071480) |
| 0.0 | 1.3 | GO:0045494 | photoreceptor cell maintenance(GO:0045494) |
| 0.0 | 0.8 | GO:0045292 | mRNA cis splicing, via spliceosome(GO:0045292) |
| 0.0 | 0.8 | GO:0043984 | histone H4-K16 acetylation(GO:0043984) |
| 0.0 | 0.4 | GO:0060340 | positive regulation of type I interferon-mediated signaling pathway(GO:0060340) |
| 0.0 | 1.2 | GO:0008299 | isoprenoid biosynthetic process(GO:0008299) |
| 0.0 | 1.6 | GO:0040019 | positive regulation of embryonic development(GO:0040019) |
| 0.0 | 0.2 | GO:0018002 | N-terminal peptidyl-serine acetylation(GO:0017198) N-terminal peptidyl-glutamic acid acetylation(GO:0018002) peptidyl-serine acetylation(GO:0030920) |
| 0.0 | 0.2 | GO:2000346 | negative regulation of hepatocyte proliferation(GO:2000346) |
| 0.0 | 1.8 | GO:0045727 | positive regulation of translation(GO:0045727) |
| 0.0 | 0.7 | GO:0010971 | positive regulation of G2/M transition of mitotic cell cycle(GO:0010971) |
| 0.0 | 0.4 | GO:0002478 | antigen processing and presentation of exogenous peptide antigen(GO:0002478) |
| 0.0 | 1.1 | GO:0045747 | positive regulation of Notch signaling pathway(GO:0045747) |
| 0.0 | 0.6 | GO:0032515 | negative regulation of phosphoprotein phosphatase activity(GO:0032515) |
| 0.0 | 2.1 | GO:0061077 | chaperone-mediated protein folding(GO:0061077) |
| 0.0 | 0.3 | GO:0016479 | negative regulation of transcription from RNA polymerase I promoter(GO:0016479) |
| 0.0 | 0.3 | GO:2000678 | negative regulation of transcription regulatory region DNA binding(GO:2000678) |
| 0.0 | 0.6 | GO:0007194 | negative regulation of adenylate cyclase activity(GO:0007194) |
| 0.0 | 0.4 | GO:0097049 | motor neuron apoptotic process(GO:0097049) regulation of motor neuron apoptotic process(GO:2000671) |
| 0.0 | 0.3 | GO:0071340 | skeletal muscle acetylcholine-gated channel clustering(GO:0071340) |
| 0.0 | 0.2 | GO:1901029 | negative regulation of mitochondrial outer membrane permeabilization involved in apoptotic signaling pathway(GO:1901029) |
| 0.0 | 0.1 | GO:0051030 | snRNA transport(GO:0051030) |
| 0.0 | 5.7 | GO:0051099 | positive regulation of binding(GO:0051099) |
| 0.0 | 1.9 | GO:0043966 | histone H3 acetylation(GO:0043966) |
| 0.0 | 0.6 | GO:2000060 | positive regulation of protein ubiquitination involved in ubiquitin-dependent protein catabolic process(GO:2000060) |
| 0.0 | 0.2 | GO:0006488 | dolichol-linked oligosaccharide biosynthetic process(GO:0006488) |
| 0.0 | 0.5 | GO:0006693 | prostanoid metabolic process(GO:0006692) prostaglandin metabolic process(GO:0006693) |
| 0.0 | 0.1 | GO:0006742 | NADP catabolic process(GO:0006742) pyridine nucleotide catabolic process(GO:0019364) |
| 0.0 | 0.6 | GO:1902230 | negative regulation of intrinsic apoptotic signaling pathway in response to DNA damage(GO:1902230) |
| 0.0 | 2.6 | GO:0010811 | positive regulation of cell-substrate adhesion(GO:0010811) |
| 0.0 | 0.2 | GO:0033014 | porphyrin-containing compound biosynthetic process(GO:0006779) tetrapyrrole biosynthetic process(GO:0033014) |
| 0.0 | 0.8 | GO:0030970 | retrograde protein transport, ER to cytosol(GO:0030970) |
| 0.0 | 4.3 | GO:0019827 | stem cell population maintenance(GO:0019827) |
| 0.0 | 0.1 | GO:0046077 | dUDP biosynthetic process(GO:0006227) pyrimidine nucleoside diphosphate biosynthetic process(GO:0009139) pyrimidine deoxyribonucleoside diphosphate metabolic process(GO:0009196) pyrimidine deoxyribonucleoside diphosphate biosynthetic process(GO:0009197) dUDP metabolic process(GO:0046077) |
| 0.0 | 0.2 | GO:1900118 | negative regulation of execution phase of apoptosis(GO:1900118) |
| 0.0 | 1.0 | GO:0001541 | ovarian follicle development(GO:0001541) |
| 0.0 | 1.7 | GO:0008584 | male gonad development(GO:0008584) development of primary male sexual characteristics(GO:0046546) |
| 0.0 | 0.1 | GO:0090114 | COPII-coated vesicle budding(GO:0090114) |
| 0.0 | 0.5 | GO:0071577 | zinc II ion transmembrane transport(GO:0071577) |
| 0.0 | 0.7 | GO:0048025 | negative regulation of mRNA splicing, via spliceosome(GO:0048025) |
| 0.0 | 0.5 | GO:0001522 | pseudouridine synthesis(GO:0001522) |
| 0.0 | 0.4 | GO:0008637 | apoptotic mitochondrial changes(GO:0008637) |
| 0.0 | 0.4 | GO:2000001 | regulation of DNA damage checkpoint(GO:2000001) |
| 0.0 | 0.5 | GO:0090090 | negative regulation of canonical Wnt signaling pathway(GO:0090090) |
| 0.0 | 0.7 | GO:0043267 | negative regulation of potassium ion transport(GO:0043267) |
| 0.0 | 0.1 | GO:0003376 | sphingosine-1-phosphate signaling pathway(GO:0003376) sphingolipid mediated signaling pathway(GO:0090520) |
| 0.0 | 0.1 | GO:0034975 | protein folding in endoplasmic reticulum(GO:0034975) |
| 0.0 | 0.3 | GO:0008210 | estrogen metabolic process(GO:0008210) |
| 0.0 | 0.7 | GO:0034314 | Arp2/3 complex-mediated actin nucleation(GO:0034314) |
| 0.0 | 0.3 | GO:0002385 | mucosal immune response(GO:0002385) |
| 0.0 | 0.2 | GO:0002031 | G-protein coupled receptor internalization(GO:0002031) |
| 0.0 | 0.1 | GO:0002408 | myeloid dendritic cell chemotaxis(GO:0002408) |
| 0.0 | 0.4 | GO:0016180 | snRNA processing(GO:0016180) |
| 0.0 | 0.1 | GO:0098734 | protein depalmitoylation(GO:0002084) macromolecule depalmitoylation(GO:0098734) |
| 0.0 | 0.8 | GO:0006414 | translational elongation(GO:0006414) |
| 0.0 | 0.6 | GO:0000184 | nuclear-transcribed mRNA catabolic process, nonsense-mediated decay(GO:0000184) |
| 0.0 | 0.4 | GO:0045070 | positive regulation of viral genome replication(GO:0045070) |
| 0.0 | 1.3 | GO:0030183 | B cell differentiation(GO:0030183) |
| 0.0 | 0.1 | GO:0000379 | tRNA-type intron splice site recognition and cleavage(GO:0000379) |
| 0.0 | 0.8 | GO:0000380 | alternative mRNA splicing, via spliceosome(GO:0000380) |
| 0.0 | 0.2 | GO:2000757 | negative regulation of peptidyl-lysine acetylation(GO:2000757) |
| 0.0 | 0.1 | GO:0019695 | choline metabolic process(GO:0019695) |
| 0.0 | 0.4 | GO:0016578 | histone deubiquitination(GO:0016578) |
| 0.0 | 0.2 | GO:0009303 | rRNA transcription(GO:0009303) |
| 0.0 | 0.9 | GO:0051092 | positive regulation of NF-kappaB transcription factor activity(GO:0051092) |
| 0.0 | 0.1 | GO:0030644 | cellular chloride ion homeostasis(GO:0030644) |
| 0.0 | 0.6 | GO:0030968 | endoplasmic reticulum unfolded protein response(GO:0030968) |
| 0.0 | 0.2 | GO:0006813 | potassium ion transport(GO:0006813) |
| 0.0 | 0.1 | GO:0035330 | regulation of hippo signaling(GO:0035330) |
| 0.0 | 1.5 | GO:0006364 | rRNA processing(GO:0006364) |
| 0.0 | 0.2 | GO:0070208 | protein heterotrimerization(GO:0070208) |
| 0.0 | 0.4 | GO:0035058 | nonmotile primary cilium assembly(GO:0035058) |
| 0.0 | 0.2 | GO:0035269 | protein O-linked mannosylation(GO:0035269) |
| 0.0 | 0.1 | GO:0007130 | synaptonemal complex assembly(GO:0007130) |
| 0.0 | 0.1 | GO:0090188 | negative regulation of pancreatic juice secretion(GO:0090188) |
| 0.0 | 0.1 | GO:0006532 | aspartate biosynthetic process(GO:0006532) |
| 0.0 | 0.2 | GO:0030488 | tRNA methylation(GO:0030488) |
| 0.0 | 0.1 | GO:0035428 | hexose transmembrane transport(GO:0035428) |
| 0.0 | 0.0 | GO:0051531 | NFAT protein import into nucleus(GO:0051531) regulation of NFAT protein import into nucleus(GO:0051532) positive regulation of NFAT protein import into nucleus(GO:0051533) |
| 0.0 | 0.2 | GO:0048524 | positive regulation of viral process(GO:0048524) |
| 0.0 | 1.2 | GO:0045333 | cellular respiration(GO:0045333) |
| 0.0 | 0.7 | GO:0031338 | regulation of vesicle fusion(GO:0031338) |
| 0.0 | 0.3 | GO:0034724 | DNA replication-independent nucleosome assembly(GO:0006336) DNA replication-independent nucleosome organization(GO:0034724) |
| 0.0 | 0.8 | GO:1903955 | positive regulation of protein targeting to mitochondrion(GO:1903955) |
Gene overrepresentation in cellular_component category:
| Log-likelihood per target | Total log-likelihood | Term | Description |
|---|---|---|---|
| 2.2 | 13.0 | GO:0045179 | apical cortex(GO:0045179) |
| 2.1 | 12.8 | GO:0061689 | tricellular tight junction(GO:0061689) |
| 1.8 | 12.7 | GO:0097452 | GAIT complex(GO:0097452) |
| 1.5 | 4.5 | GO:0005584 | collagen type I trimer(GO:0005584) |
| 1.3 | 3.9 | GO:0005588 | collagen type V trimer(GO:0005588) |
| 1.0 | 4.9 | GO:0071144 | SMAD2-SMAD3 protein complex(GO:0071144) |
| 0.9 | 12.8 | GO:0035686 | sperm fibrous sheath(GO:0035686) |
| 0.9 | 11.3 | GO:0042612 | MHC class I protein complex(GO:0042612) |
| 0.7 | 3.6 | GO:0033093 | Weibel-Palade body(GO:0033093) |
| 0.7 | 2.1 | GO:0005577 | fibrinogen complex(GO:0005577) |
| 0.7 | 2.1 | GO:0034666 | integrin alpha2-beta1 complex(GO:0034666) |
| 0.7 | 4.0 | GO:0030896 | checkpoint clamp complex(GO:0030896) |
| 0.5 | 1.4 | GO:0034457 | Mpp10 complex(GO:0034457) |
| 0.4 | 2.5 | GO:1990726 | Lsm1-7-Pat1 complex(GO:1990726) |
| 0.4 | 3.3 | GO:0042611 | MHC protein complex(GO:0042611) |
| 0.4 | 1.1 | GO:0042720 | mitochondrial inner membrane peptidase complex(GO:0042720) |
| 0.4 | 3.4 | GO:0061574 | ASAP complex(GO:0061574) |
| 0.4 | 1.5 | GO:0043259 | laminin-1 complex(GO:0005606) laminin-10 complex(GO:0043259) |
| 0.4 | 2.9 | GO:0031428 | box C/D snoRNP complex(GO:0031428) |
| 0.3 | 2.1 | GO:0000214 | tRNA-intron endonuclease complex(GO:0000214) |
| 0.3 | 2.9 | GO:0042587 | glycogen granule(GO:0042587) |
| 0.3 | 0.9 | GO:0030905 | retromer, tubulation complex(GO:0030905) |
| 0.3 | 1.7 | GO:0000444 | MIS12/MIND type complex(GO:0000444) |
| 0.3 | 2.0 | GO:0097197 | tetraspanin-enriched microdomain(GO:0097197) |
| 0.3 | 2.2 | GO:0005786 | signal recognition particle, endoplasmic reticulum targeting(GO:0005786) signal recognition particle(GO:0048500) |
| 0.3 | 1.9 | GO:0033588 | Elongator holoenzyme complex(GO:0033588) |
| 0.2 | 0.7 | GO:0071920 | cleavage body(GO:0071920) |
| 0.2 | 0.9 | GO:0045251 | mitochondrial electron transfer flavoprotein complex(GO:0017133) electron transfer flavoprotein complex(GO:0045251) |
| 0.2 | 1.4 | GO:0046696 | lipopolysaccharide receptor complex(GO:0046696) |
| 0.2 | 0.6 | GO:0031417 | NatC complex(GO:0031417) |
| 0.2 | 1.7 | GO:0008541 | proteasome regulatory particle, lid subcomplex(GO:0008541) |
| 0.2 | 1.3 | GO:0033061 | DNA recombinase mediator complex(GO:0033061) |
| 0.2 | 0.8 | GO:0071006 | U2-type catalytic step 1 spliceosome(GO:0071006) |
| 0.2 | 1.5 | GO:0017101 | aminoacyl-tRNA synthetase multienzyme complex(GO:0017101) |
| 0.2 | 11.9 | GO:0005581 | collagen trimer(GO:0005581) |
| 0.2 | 0.5 | GO:1990730 | VCP-NSFL1C complex(GO:1990730) |
| 0.2 | 0.8 | GO:0072487 | MSL complex(GO:0072487) |
| 0.2 | 0.8 | GO:0005784 | Sec61 translocon complex(GO:0005784) translocon complex(GO:0071256) |
| 0.2 | 1.6 | GO:1990023 | mitotic spindle midzone(GO:1990023) |
| 0.1 | 0.6 | GO:0071942 | XPC complex(GO:0071942) |
| 0.1 | 1.5 | GO:0019773 | proteasome core complex, alpha-subunit complex(GO:0019773) |
| 0.1 | 2.2 | GO:0005614 | interstitial matrix(GO:0005614) |
| 0.1 | 1.6 | GO:0005892 | acetylcholine-gated channel complex(GO:0005892) |
| 0.1 | 1.3 | GO:0000778 | condensed nuclear chromosome kinetochore(GO:0000778) |
| 0.1 | 0.4 | GO:0000814 | ESCRT II complex(GO:0000814) |
| 0.1 | 0.8 | GO:0005853 | eukaryotic translation elongation factor 1 complex(GO:0005853) |
| 0.1 | 0.5 | GO:0031095 | platelet dense tubular network membrane(GO:0031095) |
| 0.1 | 9.9 | GO:0005643 | nuclear pore(GO:0005643) |
| 0.1 | 5.6 | GO:0022627 | cytosolic small ribosomal subunit(GO:0022627) |
| 0.1 | 1.3 | GO:0031105 | septin complex(GO:0031105) |
| 0.1 | 8.3 | GO:0014704 | intercalated disc(GO:0014704) |
| 0.1 | 1.3 | GO:0031597 | cytosolic proteasome complex(GO:0031597) |
| 0.1 | 0.4 | GO:0016222 | procollagen-proline 4-dioxygenase complex(GO:0016222) |
| 0.1 | 2.5 | GO:0035098 | ESC/E(Z) complex(GO:0035098) |
| 0.1 | 0.7 | GO:0005956 | protein kinase CK2 complex(GO:0005956) |
| 0.1 | 0.7 | GO:0008278 | cohesin complex(GO:0008278) |
| 0.1 | 1.6 | GO:0001650 | fibrillar center(GO:0001650) |
| 0.1 | 0.7 | GO:0089701 | U2AF(GO:0089701) |
| 0.1 | 0.3 | GO:0033553 | rDNA heterochromatin(GO:0033553) |
| 0.1 | 1.0 | GO:0005885 | Arp2/3 protein complex(GO:0005885) |
| 0.1 | 2.6 | GO:0000314 | organellar small ribosomal subunit(GO:0000314) mitochondrial small ribosomal subunit(GO:0005763) |
| 0.1 | 1.0 | GO:0042788 | polysomal ribosome(GO:0042788) |
| 0.1 | 1.3 | GO:0005640 | nuclear outer membrane(GO:0005640) |
| 0.1 | 4.7 | GO:0005871 | kinesin complex(GO:0005871) |
| 0.1 | 0.4 | GO:0005672 | transcription factor TFIIA complex(GO:0005672) |
| 0.1 | 1.8 | GO:0005865 | striated muscle thin filament(GO:0005865) |
| 0.1 | 0.9 | GO:0071782 | endoplasmic reticulum tubular network(GO:0071782) |
| 0.1 | 1.1 | GO:0031588 | nucleotide-activated protein kinase complex(GO:0031588) |
| 0.1 | 1.2 | GO:0031083 | BLOC-1 complex(GO:0031083) |
| 0.1 | 4.1 | GO:0005720 | nuclear heterochromatin(GO:0005720) |
| 0.1 | 0.5 | GO:0005964 | phosphorylase kinase complex(GO:0005964) |
| 0.1 | 0.7 | GO:0005832 | chaperonin-containing T-complex(GO:0005832) |
| 0.1 | 3.7 | GO:0000932 | cytoplasmic mRNA processing body(GO:0000932) |
| 0.1 | 0.4 | GO:0032299 | ribonuclease H2 complex(GO:0032299) |
| 0.1 | 1.2 | GO:0005686 | U2 snRNP(GO:0005686) |
| 0.1 | 0.6 | GO:0070531 | BRCA1-A complex(GO:0070531) |
| 0.1 | 0.8 | GO:0097539 | ciliary transition fiber(GO:0097539) |
| 0.1 | 0.1 | GO:0005638 | lamin filament(GO:0005638) |
| 0.1 | 0.9 | GO:0031527 | filopodium membrane(GO:0031527) |
| 0.1 | 1.0 | GO:0070069 | cytochrome complex(GO:0070069) |
| 0.1 | 0.7 | GO:0000177 | cytoplasmic exosome (RNase complex)(GO:0000177) |
| 0.1 | 0.9 | GO:0032433 | filopodium tip(GO:0032433) |
| 0.0 | 2.2 | GO:0008023 | transcription elongation factor complex(GO:0008023) |
| 0.0 | 0.6 | GO:0036513 | Derlin-1 retrotranslocation complex(GO:0036513) |
| 0.0 | 0.2 | GO:0033185 | dolichol-phosphate-mannose synthase complex(GO:0033185) |
| 0.0 | 1.8 | GO:0000315 | organellar large ribosomal subunit(GO:0000315) mitochondrial large ribosomal subunit(GO:0005762) |
| 0.0 | 0.5 | GO:0005839 | proteasome core complex(GO:0005839) |
| 0.0 | 0.7 | GO:0036038 | MKS complex(GO:0036038) |
| 0.0 | 1.1 | GO:0031307 | integral component of mitochondrial outer membrane(GO:0031307) |
| 0.0 | 1.5 | GO:0005719 | nuclear euchromatin(GO:0005719) |
| 0.0 | 0.1 | GO:0000801 | central element(GO:0000801) |
| 0.0 | 1.1 | GO:0005680 | anaphase-promoting complex(GO:0005680) |
| 0.0 | 2.1 | GO:0005770 | late endosome(GO:0005770) |
| 0.0 | 0.6 | GO:0000506 | glycosylphosphatidylinositol-N-acetylglucosaminyltransferase (GPI-GnT) complex(GO:0000506) |
| 0.0 | 0.4 | GO:0000276 | mitochondrial proton-transporting ATP synthase complex, coupling factor F(o)(GO:0000276) |
| 0.0 | 0.1 | GO:0097543 | ciliary inversin compartment(GO:0097543) |
| 0.0 | 0.1 | GO:0001652 | granular component(GO:0001652) |
| 0.0 | 2.2 | GO:0005793 | endoplasmic reticulum-Golgi intermediate compartment(GO:0005793) |
| 0.0 | 0.4 | GO:0032039 | integrator complex(GO:0032039) |
| 0.0 | 0.5 | GO:0005736 | DNA-directed RNA polymerase I complex(GO:0005736) |
| 0.0 | 0.0 | GO:0070876 | SOSS complex(GO:0070876) |
| 0.0 | 5.8 | GO:0005777 | peroxisome(GO:0005777) microbody(GO:0042579) |
| 0.0 | 0.3 | GO:0042571 | immunoglobulin complex, circulating(GO:0042571) |
| 0.0 | 0.5 | GO:0071011 | precatalytic spliceosome(GO:0071011) |
| 0.0 | 2.4 | GO:0071013 | catalytic step 2 spliceosome(GO:0071013) |
| 0.0 | 2.0 | GO:0016234 | inclusion body(GO:0016234) |
| 0.0 | 1.4 | GO:0030964 | mitochondrial respiratory chain complex I(GO:0005747) NADH dehydrogenase complex(GO:0030964) respiratory chain complex I(GO:0045271) |
| 0.0 | 0.8 | GO:0034451 | centriolar satellite(GO:0034451) |
| 0.0 | 0.2 | GO:0030127 | COPII vesicle coat(GO:0030127) |
| 0.0 | 0.3 | GO:0000313 | organellar ribosome(GO:0000313) mitochondrial ribosome(GO:0005761) |
| 0.0 | 0.9 | GO:0032588 | trans-Golgi network membrane(GO:0032588) |
| 0.0 | 2.0 | GO:0001669 | acrosomal vesicle(GO:0001669) |
| 0.0 | 0.8 | GO:0032839 | dendrite cytoplasm(GO:0032839) |
| 0.0 | 2.9 | GO:0005840 | ribosome(GO:0005840) |
| 0.0 | 0.1 | GO:1990462 | omegasome membrane(GO:1903349) omegasome(GO:1990462) |
| 0.0 | 1.3 | GO:0031463 | Cul3-RING ubiquitin ligase complex(GO:0031463) |
| 0.0 | 1.3 | GO:0036064 | ciliary basal body(GO:0036064) |
| 0.0 | 0.5 | GO:0030131 | clathrin adaptor complex(GO:0030131) |
| 0.0 | 0.4 | GO:0033276 | transcription factor TFTC complex(GO:0033276) |
| 0.0 | 0.2 | GO:0032593 | insulin-responsive compartment(GO:0032593) |
| 0.0 | 0.1 | GO:0030688 | preribosome, small subunit precursor(GO:0030688) |
| 0.0 | 0.4 | GO:0000793 | condensed chromosome(GO:0000793) |
| 0.0 | 3.3 | GO:0031965 | nuclear membrane(GO:0031965) |
| 0.0 | 0.1 | GO:0042589 | zymogen granule membrane(GO:0042589) |
| 0.0 | 0.6 | GO:0030120 | vesicle coat(GO:0030120) |
| 0.0 | 1.9 | GO:0000784 | nuclear chromosome, telomeric region(GO:0000784) |
| 0.0 | 0.6 | GO:0008287 | protein serine/threonine phosphatase complex(GO:0008287) phosphatase complex(GO:1903293) |
| 0.0 | 1.3 | GO:0005875 | microtubule associated complex(GO:0005875) |
| 0.0 | 0.2 | GO:0030667 | secretory granule membrane(GO:0030667) |
| 0.0 | 0.7 | GO:0045171 | intercellular bridge(GO:0045171) |
| 0.0 | 0.5 | GO:0032281 | AMPA glutamate receptor complex(GO:0032281) |
| 0.0 | 2.2 | GO:0001726 | ruffle(GO:0001726) |
| 0.0 | 1.2 | GO:0005635 | nuclear envelope(GO:0005635) |
| 0.0 | 0.3 | GO:0031514 | motile cilium(GO:0031514) |
| 0.0 | 4.3 | GO:0005667 | transcription factor complex(GO:0005667) |
| 0.0 | 10.1 | GO:0005615 | extracellular space(GO:0005615) |
| 0.0 | 0.3 | GO:0032391 | photoreceptor connecting cilium(GO:0032391) |
| 0.0 | 0.5 | GO:0042645 | nucleoid(GO:0009295) mitochondrial nucleoid(GO:0042645) |
Gene overrepresentation in molecular_function category:
| Log-likelihood per target | Total log-likelihood | Term | Description |
|---|---|---|---|
| 3.9 | 11.6 | GO:0035605 | peptidyl-cysteine S-nitrosylase activity(GO:0035605) |
| 1.7 | 5.1 | GO:0004566 | beta-glucuronidase activity(GO:0004566) |
| 1.6 | 4.8 | GO:0003986 | acetyl-CoA hydrolase activity(GO:0003986) |
| 1.6 | 4.7 | GO:0009881 | photoreceptor activity(GO:0009881) |
| 1.5 | 6.1 | GO:0004459 | L-lactate dehydrogenase activity(GO:0004459) |
| 1.2 | 6.1 | GO:0008449 | N-acetylglucosamine-6-sulfatase activity(GO:0008449) |
| 1.2 | 7.1 | GO:0019841 | retinol binding(GO:0019841) |
| 1.2 | 6.9 | GO:0004332 | fructose-bisphosphate aldolase activity(GO:0004332) |
| 1.1 | 3.2 | GO:0004731 | purine-nucleoside phosphorylase activity(GO:0004731) |
| 1.0 | 4.9 | GO:0030618 | transforming growth factor beta receptor, pathway-specific cytoplasmic mediator activity(GO:0030618) |
| 0.8 | 2.4 | GO:0000402 | open form four-way junction DNA binding(GO:0000401) crossed form four-way junction DNA binding(GO:0000402) |
| 0.7 | 3.7 | GO:0004614 | phosphoglucomutase activity(GO:0004614) |
| 0.7 | 2.2 | GO:0030171 | voltage-gated proton channel activity(GO:0030171) |
| 0.7 | 2.8 | GO:0070976 | TIR domain binding(GO:0070976) |
| 0.7 | 2.1 | GO:0070052 | collagen V binding(GO:0070052) |
| 0.7 | 2.1 | GO:0005128 | erythropoietin receptor binding(GO:0005128) |
| 0.7 | 12.3 | GO:0030228 | lipoprotein particle receptor activity(GO:0030228) |
| 0.7 | 2.0 | GO:0001075 | transcription factor activity, RNA polymerase II core promoter sequence-specific binding involved in preinitiation complex assembly(GO:0001075) |
| 0.6 | 3.8 | GO:0008525 | phosphatidylcholine transporter activity(GO:0008525) |
| 0.6 | 2.5 | GO:0008131 | primary amine oxidase activity(GO:0008131) |
| 0.6 | 4.3 | GO:0005087 | Ran guanyl-nucleotide exchange factor activity(GO:0005087) |
| 0.6 | 5.6 | GO:0004634 | phosphopyruvate hydratase activity(GO:0004634) |
| 0.6 | 2.9 | GO:0004105 | choline-phosphate cytidylyltransferase activity(GO:0004105) |
| 0.6 | 8.4 | GO:0048407 | platelet-derived growth factor binding(GO:0048407) |
| 0.5 | 7.8 | GO:0015106 | bicarbonate transmembrane transporter activity(GO:0015106) |
| 0.5 | 6.9 | GO:0030881 | beta-2-microglobulin binding(GO:0030881) |
| 0.5 | 1.5 | GO:0015562 | efflux transmembrane transporter activity(GO:0015562) |
| 0.5 | 1.5 | GO:0004814 | arginine-tRNA ligase activity(GO:0004814) arginine binding(GO:0034618) |
| 0.5 | 1.4 | GO:0030519 | snoRNP binding(GO:0030519) |
| 0.4 | 2.2 | GO:0005047 | signal recognition particle binding(GO:0005047) endoplasmic reticulum signal peptide binding(GO:0030942) |
| 0.4 | 1.3 | GO:0047598 | 7-dehydrocholesterol reductase activity(GO:0047598) |
| 0.4 | 2.9 | GO:0070191 | methionine-R-sulfoxide reductase activity(GO:0070191) |
| 0.4 | 1.2 | GO:0035614 | snRNA stem-loop binding(GO:0035614) |
| 0.4 | 1.2 | GO:0008732 | threonine aldolase activity(GO:0004793) L-allo-threonine aldolase activity(GO:0008732) |
| 0.4 | 1.1 | GO:0003953 | NAD+ nucleosidase activity(GO:0003953) |
| 0.4 | 1.5 | GO:0030984 | kininogen binding(GO:0030984) |
| 0.4 | 1.9 | GO:0032767 | copper-dependent protein binding(GO:0032767) |
| 0.4 | 4.3 | GO:0016500 | protein-hormone receptor activity(GO:0016500) |
| 0.3 | 2.0 | GO:0046404 | ATP-dependent polydeoxyribonucleotide 5'-hydroxyl-kinase activity(GO:0046404) polydeoxyribonucleotide kinase activity(GO:0051733) |
| 0.3 | 1.0 | GO:0048045 | 4-hydroxybenzoate octaprenyltransferase activity(GO:0008412) protoheme IX farnesyltransferase activity(GO:0008495) (S)-2,3-di-O-geranylgeranylglyceryl phosphate synthase activity(GO:0043888) cadaverine aminopropyltransferase activity(GO:0043918) agmatine aminopropyltransferase activity(GO:0043919) 1,4-dihydroxy-2-naphthoate octaprenyltransferase activity(GO:0046428) trans-pentaprenyltranstransferase activity(GO:0048045) ATP dimethylallyltransferase activity(GO:0052622) ADP dimethylallyltransferase activity(GO:0052623) |
| 0.3 | 1.0 | GO:0044388 | tyrosine 3-monooxygenase activator activity(GO:0036470) L-dopa decarboxylase activator activity(GO:0036478) small protein activating enzyme binding(GO:0044388) cupric ion binding(GO:1903135) cuprous ion binding(GO:1903136) glyoxalase (glycolic acid-forming) activity(GO:1990422) |
| 0.3 | 4.1 | GO:0017070 | U6 snRNA binding(GO:0017070) |
| 0.3 | 1.2 | GO:0016230 | sphingomyelin phosphodiesterase activator activity(GO:0016230) |
| 0.3 | 1.2 | GO:0050347 | trans-hexaprenyltranstransferase activity(GO:0000010) trans-octaprenyltranstransferase activity(GO:0050347) |
| 0.3 | 6.6 | GO:0043539 | protein serine/threonine kinase activator activity(GO:0043539) |
| 0.3 | 0.6 | GO:0030621 | U4 snRNA binding(GO:0030621) |
| 0.3 | 1.7 | GO:0016813 | hydrolase activity, acting on carbon-nitrogen (but not peptide) bonds, in linear amidines(GO:0016813) |
| 0.3 | 1.7 | GO:0008494 | translation activator activity(GO:0008494) |
| 0.3 | 1.9 | GO:0031419 | cobalamin binding(GO:0031419) |
| 0.3 | 3.5 | GO:0008413 | 8-oxo-7,8-dihydroguanosine triphosphate pyrophosphatase activity(GO:0008413) |
| 0.2 | 1.0 | GO:0008802 | betaine-aldehyde dehydrogenase activity(GO:0008802) |
| 0.2 | 2.8 | GO:0004185 | serine-type carboxypeptidase activity(GO:0004185) |
| 0.2 | 0.9 | GO:1990460 | leptin receptor binding(GO:1990460) |
| 0.2 | 1.7 | GO:0019865 | immunoglobulin binding(GO:0019865) |
| 0.2 | 1.7 | GO:0048403 | brain-derived neurotrophic factor binding(GO:0048403) |
| 0.2 | 1.5 | GO:0043208 | glycosphingolipid binding(GO:0043208) |
| 0.2 | 2.0 | GO:0071933 | Arp2/3 complex binding(GO:0071933) |
| 0.2 | 2.4 | GO:1990226 | histone methyltransferase binding(GO:1990226) |
| 0.2 | 1.8 | GO:0005523 | tropomyosin binding(GO:0005523) |
| 0.2 | 0.6 | GO:0004923 | leukemia inhibitory factor receptor activity(GO:0004923) oncostatin-M receptor activity(GO:0004924) |
| 0.2 | 1.2 | GO:0051429 | corticotropin-releasing hormone receptor binding(GO:0051429) corticotropin-releasing hormone receptor 1 binding(GO:0051430) |
| 0.2 | 1.9 | GO:0030274 | LIM domain binding(GO:0030274) |
| 0.2 | 1.1 | GO:0004679 | AMP-activated protein kinase activity(GO:0004679) |
| 0.2 | 0.6 | GO:0004471 | malic enzyme activity(GO:0004470) malate dehydrogenase (decarboxylating) (NAD+) activity(GO:0004471) |
| 0.2 | 2.9 | GO:0042605 | peptide antigen binding(GO:0042605) |
| 0.2 | 0.9 | GO:0010858 | calcium-dependent protein kinase regulator activity(GO:0010858) |
| 0.2 | 1.6 | GO:0008484 | sulfuric ester hydrolase activity(GO:0008484) |
| 0.2 | 1.1 | GO:0043176 | amine binding(GO:0043176) |
| 0.2 | 1.1 | GO:0010997 | anaphase-promoting complex binding(GO:0010997) |
| 0.2 | 1.0 | GO:0035727 | lysophosphatidic acid binding(GO:0035727) lysophosphatidic acid receptor activity(GO:0070915) |
| 0.2 | 1.6 | GO:0004889 | acetylcholine-activated cation-selective channel activity(GO:0004889) |
| 0.2 | 0.5 | GO:0047066 | phospholipid-hydroperoxide glutathione peroxidase activity(GO:0047066) |
| 0.2 | 6.4 | GO:0035255 | ionotropic glutamate receptor binding(GO:0035255) |
| 0.1 | 0.4 | GO:0017057 | 6-phosphogluconolactonase activity(GO:0017057) |
| 0.1 | 0.6 | GO:0002054 | nucleobase binding(GO:0002054) |
| 0.1 | 1.0 | GO:0015204 | urea transmembrane transporter activity(GO:0015204) |
| 0.1 | 0.4 | GO:0003692 | left-handed Z-DNA binding(GO:0003692) |
| 0.1 | 1.4 | GO:0001134 | transcription factor activity, transcription factor recruiting(GO:0001134) |
| 0.1 | 1.0 | GO:0005094 | Rho GDP-dissociation inhibitor activity(GO:0005094) |
| 0.1 | 3.2 | GO:0008607 | phosphorylase kinase regulator activity(GO:0008607) |
| 0.1 | 0.8 | GO:0005005 | transmembrane-ephrin receptor activity(GO:0005005) |
| 0.1 | 2.0 | GO:0005537 | mannose binding(GO:0005537) |
| 0.1 | 2.4 | GO:0004602 | glutathione peroxidase activity(GO:0004602) |
| 0.1 | 0.4 | GO:0004830 | tryptophan-tRNA ligase activity(GO:0004830) |
| 0.1 | 1.0 | GO:0008097 | 5S rRNA binding(GO:0008097) |
| 0.1 | 0.9 | GO:0015189 | L-ornithine transmembrane transporter activity(GO:0000064) arginine transmembrane transporter activity(GO:0015181) L-lysine transmembrane transporter activity(GO:0015189) |
| 0.1 | 2.3 | GO:0004029 | aldehyde dehydrogenase (NAD) activity(GO:0004029) |
| 0.1 | 1.3 | GO:0051400 | BH domain binding(GO:0051400) |
| 0.1 | 1.4 | GO:0004862 | cAMP-dependent protein kinase inhibitor activity(GO:0004862) |
| 0.1 | 1.3 | GO:0003857 | 3-hydroxyacyl-CoA dehydrogenase activity(GO:0003857) |
| 0.1 | 0.7 | GO:0016453 | acetyl-CoA C-acetyltransferase activity(GO:0003985) C-acetyltransferase activity(GO:0016453) |
| 0.1 | 1.1 | GO:0035312 | 5'-3' exodeoxyribonuclease activity(GO:0035312) |
| 0.1 | 4.4 | GO:0017017 | MAP kinase tyrosine/serine/threonine phosphatase activity(GO:0017017) |
| 0.1 | 1.6 | GO:0016863 | intramolecular oxidoreductase activity, transposing C=C bonds(GO:0016863) |
| 0.1 | 1.3 | GO:0017049 | GTP-Rho binding(GO:0017049) |
| 0.1 | 1.5 | GO:0008301 | DNA binding, bending(GO:0008301) |
| 0.1 | 1.8 | GO:0015129 | lactate transmembrane transporter activity(GO:0015129) |
| 0.1 | 1.1 | GO:0008474 | palmitoyl-(protein) hydrolase activity(GO:0008474) palmitoyl hydrolase activity(GO:0098599) |
| 0.1 | 1.8 | GO:0003743 | translation initiation factor activity(GO:0003743) |
| 0.1 | 3.2 | GO:0017147 | Wnt-protein binding(GO:0017147) |
| 0.1 | 1.1 | GO:0070742 | C2H2 zinc finger domain binding(GO:0070742) |
| 0.1 | 0.4 | GO:0005093 | Rab GDP-dissociation inhibitor activity(GO:0005093) |
| 0.1 | 0.9 | GO:0015197 | peptide transporter activity(GO:0015197) |
| 0.1 | 2.0 | GO:0004298 | threonine-type endopeptidase activity(GO:0004298) threonine-type peptidase activity(GO:0070003) |
| 0.1 | 1.4 | GO:0001530 | lipopolysaccharide binding(GO:0001530) |
| 0.1 | 0.6 | GO:1990050 | phosphatidic acid transporter activity(GO:1990050) |
| 0.1 | 1.5 | GO:0010485 | H4 histone acetyltransferase activity(GO:0010485) |
| 0.1 | 3.7 | GO:0043027 | cysteine-type endopeptidase inhibitor activity involved in apoptotic process(GO:0043027) |
| 0.1 | 4.0 | GO:0004812 | aminoacyl-tRNA ligase activity(GO:0004812) |
| 0.1 | 0.8 | GO:0032564 | dATP binding(GO:0032564) |
| 0.1 | 0.7 | GO:0070290 | N-acylphosphatidylethanolamine-specific phospholipase D activity(GO:0070290) |
| 0.1 | 0.6 | GO:0045028 | G-protein coupled nucleotide receptor activity(GO:0001608) G-protein coupled purinergic nucleotide receptor activity(GO:0045028) |
| 0.1 | 1.7 | GO:0004653 | polypeptide N-acetylgalactosaminyltransferase activity(GO:0004653) |
| 0.1 | 2.1 | GO:0005528 | macrolide binding(GO:0005527) FK506 binding(GO:0005528) |
| 0.1 | 1.7 | GO:0003995 | acyl-CoA dehydrogenase activity(GO:0003995) |
| 0.1 | 0.4 | GO:0004656 | procollagen-proline 4-dioxygenase activity(GO:0004656) |
| 0.1 | 1.1 | GO:0031005 | filamin binding(GO:0031005) |
| 0.1 | 0.7 | GO:0033677 | DNA/RNA helicase activity(GO:0033677) |
| 0.1 | 1.3 | GO:0016857 | racemase and epimerase activity, acting on carbohydrates and derivatives(GO:0016857) |
| 0.1 | 3.5 | GO:0031369 | translation initiation factor binding(GO:0031369) |
| 0.1 | 2.1 | GO:0005070 | SH3/SH2 adaptor activity(GO:0005070) |
| 0.1 | 0.4 | GO:0008545 | JUN kinase kinase activity(GO:0008545) |
| 0.1 | 1.2 | GO:0070182 | DNA polymerase binding(GO:0070182) |
| 0.1 | 0.2 | GO:0019002 | GMP binding(GO:0019002) |
| 0.1 | 0.3 | GO:0004954 | icosanoid receptor activity(GO:0004953) prostanoid receptor activity(GO:0004954) prostaglandin receptor activity(GO:0004955) |
| 0.1 | 0.6 | GO:0038062 | protein tyrosine kinase collagen receptor activity(GO:0038062) |
| 0.1 | 4.7 | GO:0003777 | microtubule motor activity(GO:0003777) |
| 0.1 | 1.4 | GO:0005184 | neuropeptide hormone activity(GO:0005184) |
| 0.1 | 1.1 | GO:0015026 | coreceptor activity(GO:0015026) |
| 0.1 | 2.1 | GO:0050136 | NADH dehydrogenase (ubiquinone) activity(GO:0008137) NADH dehydrogenase (quinone) activity(GO:0050136) |
| 0.1 | 3.0 | GO:0000049 | tRNA binding(GO:0000049) |
| 0.1 | 2.5 | GO:0032452 | histone demethylase activity(GO:0032452) |
| 0.1 | 0.5 | GO:0004689 | phosphorylase kinase activity(GO:0004689) |
| 0.1 | 0.1 | GO:0016175 | superoxide-generating NADPH oxidase activity(GO:0016175) |
| 0.1 | 1.2 | GO:0004435 | phosphatidylinositol phospholipase C activity(GO:0004435) |
| 0.1 | 0.6 | GO:0043023 | ribosomal large subunit binding(GO:0043023) |
| 0.1 | 1.0 | GO:0042809 | vitamin D receptor binding(GO:0042809) |
| 0.1 | 0.2 | GO:0004582 | dolichyl-phosphate beta-D-mannosyltransferase activity(GO:0004582) |
| 0.1 | 0.7 | GO:0070411 | I-SMAD binding(GO:0070411) |
| 0.1 | 0.5 | GO:0103116 | alpha-D-galactofuranose transporter activity(GO:0103116) |
| 0.1 | 0.2 | GO:0055056 | D-glucose transmembrane transporter activity(GO:0055056) |
| 0.1 | 1.3 | GO:0018602 | sulfonate dioxygenase activity(GO:0000907) 2,4-dichlorophenoxyacetate alpha-ketoglutarate dioxygenase activity(GO:0018602) hypophosphite dioxygenase activity(GO:0034792) gibberellin 2-beta-dioxygenase activity(GO:0045543) C-19 gibberellin 2-beta-dioxygenase activity(GO:0052634) C-20 gibberellin 2-beta-dioxygenase activity(GO:0052635) |
| 0.1 | 0.7 | GO:0035497 | cAMP response element binding(GO:0035497) |
| 0.1 | 0.5 | GO:0005025 | transforming growth factor beta receptor activity, type I(GO:0005025) |
| 0.1 | 2.2 | GO:0030332 | cyclin binding(GO:0030332) |
| 0.1 | 1.4 | GO:0005227 | calcium activated cation channel activity(GO:0005227) |
| 0.1 | 1.2 | GO:0043325 | phosphatidylinositol-3,4-bisphosphate binding(GO:0043325) |
| 0.1 | 0.7 | GO:0035591 | signaling adaptor activity(GO:0035591) |
| 0.0 | 1.4 | GO:0035259 | glucocorticoid receptor binding(GO:0035259) |
| 0.0 | 1.0 | GO:0017056 | structural constituent of nuclear pore(GO:0017056) |
| 0.0 | 0.4 | GO:0004523 | RNA-DNA hybrid ribonuclease activity(GO:0004523) |
| 0.0 | 0.5 | GO:0031386 | protein tag(GO:0031386) |
| 0.0 | 4.4 | GO:0001158 | enhancer sequence-specific DNA binding(GO:0001158) |
| 0.0 | 0.3 | GO:0019211 | phosphatase activator activity(GO:0019211) |
| 0.0 | 1.9 | GO:0004867 | serine-type endopeptidase inhibitor activity(GO:0004867) |
| 0.0 | 8.2 | GO:0003729 | mRNA binding(GO:0003729) |
| 0.0 | 0.5 | GO:0034951 | pivalyl-CoA mutase activity(GO:0034784) o-hydroxylaminobenzoate mutase activity(GO:0034951) lupeol synthase activity(GO:0042299) beta-amyrin synthase activity(GO:0042300) baruol synthase activity(GO:0080011) |
| 0.0 | 0.2 | GO:1990189 | peptide-serine-N-acetyltransferase activity(GO:1990189) peptide-glutamate-N-acetyltransferase activity(GO:1990190) |
| 0.0 | 0.3 | GO:0005068 | transmembrane receptor protein tyrosine kinase adaptor activity(GO:0005068) |
| 0.0 | 0.8 | GO:0035380 | C-3 sterol dehydrogenase (C-4 sterol decarboxylase) activity(GO:0000252) mevaldate reductase activity(GO:0004495) gluconate dehydrogenase activity(GO:0008875) epoxide dehydrogenase activity(GO:0018451) 5-exo-hydroxycamphor dehydrogenase activity(GO:0018452) 2-hydroxytetrahydrofuran dehydrogenase activity(GO:0018453) acetoin dehydrogenase activity(GO:0019152) phenylcoumaran benzylic ether reductase activity(GO:0032442) D-xylose:NADP reductase activity(GO:0032866) L-arabinose:NADP reductase activity(GO:0032867) D-arabinitol dehydrogenase, D-ribulose forming (NADP+) activity(GO:0033709) (R)-(-)-1,2,3,4-tetrahydronaphthol dehydrogenase activity(GO:0034831) 3-hydroxymenthone dehydrogenase activity(GO:0034840) very long-chain-3-hydroxyacyl-CoA dehydrogenase activity(GO:0035380) dihydrotestosterone 17-beta-dehydrogenase activity(GO:0035410) (R)-2-hydroxyisocaproate dehydrogenase activity(GO:0043713) L-arabinose 1-dehydrogenase (NADP+) activity(GO:0044103) L-xylulose reductase (NAD+) activity(GO:0044105) 3-ketoglucose-reductase activity(GO:0048258) D-arabinitol dehydrogenase, D-xylulose forming (NADP+) activity(GO:0052677) |
| 0.0 | 0.9 | GO:0050750 | low-density lipoprotein particle receptor binding(GO:0050750) |
| 0.0 | 0.8 | GO:0003746 | translation elongation factor activity(GO:0003746) |
| 0.0 | 0.2 | GO:0031078 | histone deacetylase activity (H3-K14 specific)(GO:0031078) NAD-dependent histone deacetylase activity (H3-K14 specific)(GO:0032041) |
| 0.0 | 0.7 | GO:0044183 | protein binding involved in protein folding(GO:0044183) |
| 0.0 | 0.2 | GO:0015379 | potassium:chloride symporter activity(GO:0015379) potassium ion symporter activity(GO:0022820) |
| 0.0 | 0.1 | GO:0004069 | L-aspartate:2-oxoglutarate aminotransferase activity(GO:0004069) |
| 0.0 | 0.4 | GO:0008553 | hydrogen-exporting ATPase activity, phosphorylative mechanism(GO:0008553) |
| 0.0 | 0.4 | GO:0005487 | nucleocytoplasmic transporter activity(GO:0005487) |
| 0.0 | 0.5 | GO:0001054 | RNA polymerase I activity(GO:0001054) |
| 0.0 | 0.4 | GO:0016884 | carbon-nitrogen ligase activity, with glutamine as amido-N-donor(GO:0016884) |
| 0.0 | 1.2 | GO:0004709 | MAP kinase kinase kinase activity(GO:0004709) |
| 0.0 | 0.5 | GO:0005542 | folic acid binding(GO:0005542) |
| 0.0 | 1.5 | GO:0046875 | ephrin receptor binding(GO:0046875) |
| 0.0 | 0.1 | GO:0046624 | sphingolipid transporter activity(GO:0046624) |
| 0.0 | 0.3 | GO:0001163 | RNA polymerase I regulatory region sequence-specific DNA binding(GO:0001163) RNA polymerase I CORE element sequence-specific DNA binding(GO:0001164) |
| 0.0 | 0.1 | GO:0009041 | uridylate kinase activity(GO:0009041) |
| 0.0 | 15.6 | GO:0005198 | structural molecule activity(GO:0005198) |
| 0.0 | 0.1 | GO:0032027 | myosin light chain binding(GO:0032027) |
| 0.0 | 1.2 | GO:0004896 | cytokine receptor activity(GO:0004896) |
| 0.0 | 1.3 | GO:0005518 | collagen binding(GO:0005518) |
| 0.0 | 0.2 | GO:0017166 | vinculin binding(GO:0017166) |
| 0.0 | 0.1 | GO:0004174 | electron-transferring-flavoprotein dehydrogenase activity(GO:0004174) oxidoreductase activity, acting on the CH-NH group of donors, quinone or similar compound as acceptor(GO:0016649) |
| 0.0 | 0.7 | GO:0016831 | carboxy-lyase activity(GO:0016831) |
| 0.0 | 1.8 | GO:0004702 | receptor signaling protein serine/threonine kinase activity(GO:0004702) |
| 0.0 | 1.1 | GO:0048487 | beta-tubulin binding(GO:0048487) |
| 0.0 | 0.3 | GO:0030346 | protein phosphatase 2B binding(GO:0030346) |
| 0.0 | 1.1 | GO:0048365 | Rac GTPase binding(GO:0048365) |
| 0.0 | 1.3 | GO:0016628 | oxidoreductase activity, acting on the CH-CH group of donors, NAD or NADP as acceptor(GO:0016628) |
| 0.0 | 0.3 | GO:0035326 | enhancer binding(GO:0035326) |
| 0.0 | 0.1 | GO:0005149 | interleukin-1 receptor binding(GO:0005149) |
| 0.0 | 0.1 | GO:0005229 | intracellular calcium activated chloride channel activity(GO:0005229) |
| 0.0 | 0.9 | GO:0043022 | ribosome binding(GO:0043022) |
| 0.0 | 0.1 | GO:0004111 | creatine kinase activity(GO:0004111) |
| 0.0 | 3.7 | GO:0003924 | GTPase activity(GO:0003924) |
| 0.0 | 1.1 | GO:0003684 | damaged DNA binding(GO:0003684) |
| 0.0 | 1.0 | GO:0016765 | transferase activity, transferring alkyl or aryl (other than methyl) groups(GO:0016765) |
| 0.0 | 0.9 | GO:0061631 | ubiquitin conjugating enzyme activity(GO:0061631) |
| 0.0 | 0.6 | GO:0005179 | hormone activity(GO:0005179) |
| 0.0 | 1.2 | GO:0046332 | SMAD binding(GO:0046332) |
| 0.0 | 0.5 | GO:0005385 | zinc ion transmembrane transporter activity(GO:0005385) |
| 0.0 | 0.1 | GO:0015643 | toxic substance binding(GO:0015643) |
| 0.0 | 0.6 | GO:0031624 | ubiquitin conjugating enzyme binding(GO:0031624) |
| 0.0 | 0.1 | GO:0031735 | CCR10 chemokine receptor binding(GO:0031735) |
| 0.0 | 0.6 | GO:0008235 | metalloexopeptidase activity(GO:0008235) |
| 0.0 | 0.5 | GO:0003705 | transcription factor activity, RNA polymerase II distal enhancer sequence-specific binding(GO:0003705) |
| 0.0 | 0.6 | GO:0003725 | double-stranded RNA binding(GO:0003725) |
| 0.0 | 0.4 | GO:0001103 | RNA polymerase II repressing transcription factor binding(GO:0001103) |
| 0.0 | 0.4 | GO:0016790 | thiolester hydrolase activity(GO:0016790) |
| 0.0 | 0.6 | GO:0001948 | glycoprotein binding(GO:0001948) |
| 0.0 | 0.1 | GO:0019870 | potassium channel inhibitor activity(GO:0019870) |
| 0.0 | 0.3 | GO:0016676 | cytochrome-c oxidase activity(GO:0004129) heme-copper terminal oxidase activity(GO:0015002) oxidoreductase activity, acting on a heme group of donors, oxygen as acceptor(GO:0016676) |
| 0.0 | 0.4 | GO:0030507 | spectrin binding(GO:0030507) |
| 0.0 | 0.3 | GO:0051059 | NF-kappaB binding(GO:0051059) |
| 0.0 | 0.1 | GO:0000213 | tRNA-intron endonuclease activity(GO:0000213) endoribonuclease activity, producing 3'-phosphomonoesters(GO:0016892) |
| 0.0 | 0.2 | GO:0048020 | CCR chemokine receptor binding(GO:0048020) |
| 0.0 | 6.6 | GO:0042803 | protein homodimerization activity(GO:0042803) |
| 0.0 | 1.1 | GO:0001664 | G-protein coupled receptor binding(GO:0001664) |
| 0.0 | 0.1 | GO:0008889 | glycerophosphodiester phosphodiesterase activity(GO:0008889) |