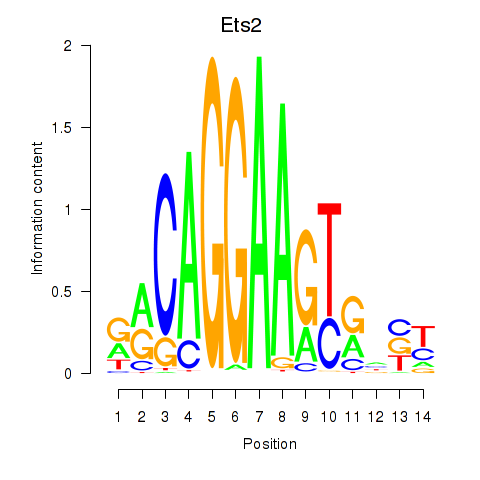
Motif ID: Ets2
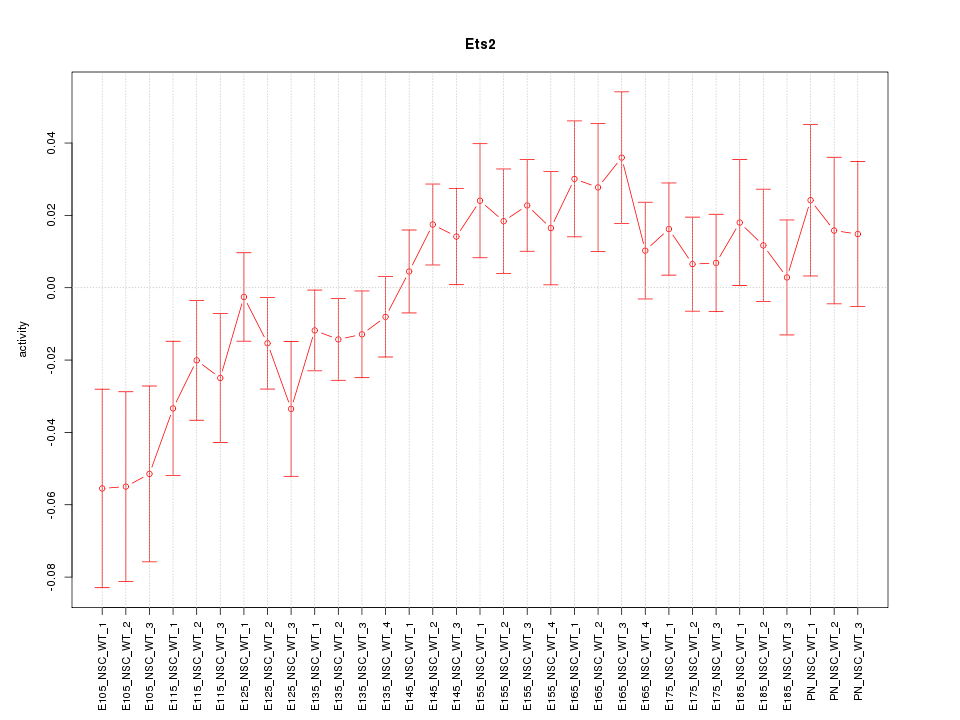
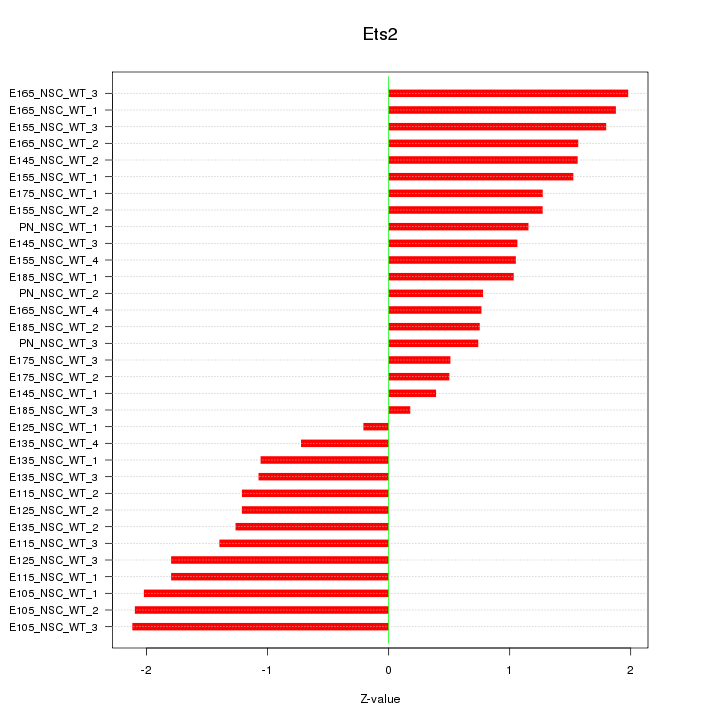
Z-value: 1.321
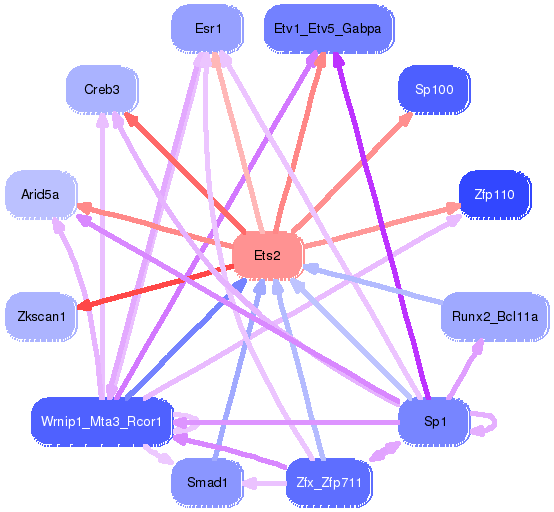
Transcription factors associated with Ets2:
| Gene Symbol | Entrez ID | Gene Name |
|---|---|---|
| Ets2 | ENSMUSG00000022895.8 | Ets2 |
Activity-expression correlation:
| Gene Symbol | Promoter | Pearson corr. coef. | P-value | Plot |
|---|---|---|---|---|
| Ets2 | mm10_v2_chr16_+_95702044_95702094 | 0.06 | 7.5e-01 | Click! |

Top targets:
Gene overrepresentation in biological_process category:
| Log-likelihood per target | Total log-likelihood | Term | Description |
|---|---|---|---|
| 1.5 | 1.5 | GO:0018307 | enzyme active site formation(GO:0018307) |
| 1.3 | 3.9 | GO:0019085 | early viral transcription(GO:0019085) |
| 1.3 | 5.0 | GO:0070425 | negative regulation of nucleotide-binding oligomerization domain containing signaling pathway(GO:0070425) negative regulation of nucleotide-binding oligomerization domain containing 2 signaling pathway(GO:0070433) |
| 1.0 | 5.8 | GO:0070863 | positive regulation of protein exit from endoplasmic reticulum(GO:0070863) |
| 0.8 | 2.4 | GO:0043201 | response to leucine(GO:0043201) cellular response to leucine(GO:0071233) |
| 0.8 | 7.2 | GO:0061088 | sequestering of zinc ion(GO:0032119) regulation of sequestering of zinc ion(GO:0061088) |
| 0.8 | 6.8 | GO:0036371 | protein localization to M-band(GO:0036309) protein localization to T-tubule(GO:0036371) |
| 0.7 | 2.8 | GO:0045653 | negative regulation of megakaryocyte differentiation(GO:0045653) |
| 0.7 | 2.1 | GO:0016344 | meiotic chromosome movement towards spindle pole(GO:0016344) |
| 0.7 | 0.7 | GO:0034241 | positive regulation of macrophage fusion(GO:0034241) |
| 0.7 | 2.1 | GO:0090327 | negative regulation of locomotion involved in locomotory behavior(GO:0090327) |
| 0.7 | 2.1 | GO:0019043 | positive regulation of transcription from RNA polymerase II promoter involved in unfolded protein response(GO:0006990) establishment of viral latency(GO:0019043) |
| 0.6 | 4.5 | GO:0060267 | positive regulation of respiratory burst(GO:0060267) |
| 0.6 | 2.5 | GO:0060715 | syncytiotrophoblast cell differentiation involved in labyrinthine layer development(GO:0060715) |
| 0.6 | 6.3 | GO:0090232 | positive regulation of spindle checkpoint(GO:0090232) |
| 0.6 | 3.6 | GO:0035469 | determination of pancreatic left/right asymmetry(GO:0035469) |
| 0.6 | 3.5 | GO:1902847 | macrophage proliferation(GO:0061517) microglial cell proliferation(GO:0061518) regulation of neuronal signal transduction(GO:1902847) positive regulation of tau-protein kinase activity(GO:1902949) |
| 0.6 | 2.3 | GO:0007228 | positive regulation of hh target transcription factor activity(GO:0007228) |
| 0.5 | 5.5 | GO:0048149 | behavioral response to ethanol(GO:0048149) |
| 0.5 | 2.6 | GO:0042117 | monocyte activation(GO:0042117) |
| 0.5 | 1.0 | GO:0016080 | synaptic vesicle targeting(GO:0016080) |
| 0.5 | 2.5 | GO:1900095 | regulation of dosage compensation by inactivation of X chromosome(GO:1900095) |
| 0.5 | 2.0 | GO:0045053 | protein retention in Golgi apparatus(GO:0045053) |
| 0.5 | 1.5 | GO:1904431 | positive regulation of t-circle formation(GO:1904431) |
| 0.5 | 1.4 | GO:1904569 | regulation of selenocysteine incorporation(GO:1904569) |
| 0.5 | 2.3 | GO:1901668 | regulation of superoxide dismutase activity(GO:1901668) |
| 0.5 | 7.3 | GO:0021902 | commitment of neuronal cell to specific neuron type in forebrain(GO:0021902) |
| 0.4 | 1.8 | GO:0090365 | regulation of mRNA modification(GO:0090365) |
| 0.4 | 4.0 | GO:0018095 | protein polyglutamylation(GO:0018095) |
| 0.4 | 1.2 | GO:0036092 | phosphatidylinositol-3-phosphate biosynthetic process(GO:0036092) |
| 0.4 | 2.0 | GO:2000574 | regulation of microtubule motor activity(GO:2000574) |
| 0.4 | 1.1 | GO:1903896 | positive regulation of IRE1-mediated unfolded protein response(GO:1903896) |
| 0.4 | 1.1 | GO:1902277 | negative regulation of pancreatic amylase secretion(GO:1902277) |
| 0.4 | 5.8 | GO:0060363 | cranial suture morphogenesis(GO:0060363) |
| 0.3 | 0.6 | GO:0043323 | positive regulation of natural killer cell degranulation(GO:0043323) |
| 0.3 | 2.5 | GO:0035635 | entry of bacterium into host cell(GO:0035635) regulation of entry of bacterium into host cell(GO:2000535) |
| 0.3 | 1.5 | GO:0071787 | endoplasmic reticulum tubular network assembly(GO:0071787) |
| 0.3 | 13.2 | GO:0047496 | vesicle transport along microtubule(GO:0047496) |
| 0.3 | 1.2 | GO:0086042 | cardiac muscle cell-cardiac muscle cell adhesion(GO:0086042) |
| 0.3 | 3.5 | GO:0034497 | protein localization to pre-autophagosomal structure(GO:0034497) |
| 0.3 | 13.9 | GO:0036465 | synaptic vesicle recycling(GO:0036465) |
| 0.3 | 1.1 | GO:0071105 | response to interleukin-11(GO:0071105) multinuclear osteoclast differentiation(GO:0072674) osteoclast fusion(GO:0072675) |
| 0.3 | 5.7 | GO:0035235 | ionotropic glutamate receptor signaling pathway(GO:0035235) |
| 0.3 | 1.5 | GO:0071361 | cellular response to ethanol(GO:0071361) |
| 0.3 | 1.3 | GO:0007256 | activation of JNKK activity(GO:0007256) |
| 0.3 | 1.0 | GO:1902774 | late endosome to lysosome transport(GO:1902774) |
| 0.2 | 1.5 | GO:0070072 | vacuolar proton-transporting V-type ATPase complex assembly(GO:0070072) |
| 0.2 | 4.2 | GO:0045792 | negative regulation of cell size(GO:0045792) |
| 0.2 | 1.7 | GO:0048102 | autophagic cell death(GO:0048102) |
| 0.2 | 0.9 | GO:0045896 | regulation of transcription during mitosis(GO:0045896) positive regulation of transcription during mitosis(GO:0045897) |
| 0.2 | 1.4 | GO:0006123 | mitochondrial electron transport, cytochrome c to oxygen(GO:0006123) |
| 0.2 | 1.2 | GO:0010032 | meiotic chromosome condensation(GO:0010032) |
| 0.2 | 1.8 | GO:0031848 | protection from non-homologous end joining at telomere(GO:0031848) |
| 0.2 | 0.9 | GO:0048304 | positive regulation of isotype switching to IgG isotypes(GO:0048304) |
| 0.2 | 0.9 | GO:0019276 | UDP-N-acetylgalactosamine metabolic process(GO:0019276) |
| 0.2 | 0.4 | GO:0060523 | prostate epithelial cord elongation(GO:0060523) |
| 0.2 | 1.7 | GO:0036506 | maintenance of unfolded protein(GO:0036506) protein insertion into ER membrane(GO:0045048) tail-anchored membrane protein insertion into ER membrane(GO:0071816) maintenance of unfolded protein involved in ERAD pathway(GO:1904378) |
| 0.2 | 3.8 | GO:0007095 | mitotic G2 DNA damage checkpoint(GO:0007095) |
| 0.2 | 3.1 | GO:2000096 | positive regulation of Wnt signaling pathway, planar cell polarity pathway(GO:2000096) |
| 0.2 | 2.5 | GO:1901898 | negative regulation of relaxation of muscle(GO:1901078) regulation of cell communication by electrical coupling involved in cardiac conduction(GO:1901844) negative regulation of relaxation of cardiac muscle(GO:1901898) |
| 0.2 | 3.5 | GO:0090161 | Golgi ribbon formation(GO:0090161) |
| 0.2 | 1.2 | GO:0044034 | negative stranded viral RNA replication(GO:0039689) multi-organism biosynthetic process(GO:0044034) |
| 0.2 | 0.8 | GO:0070537 | histone H2A K63-linked deubiquitination(GO:0070537) |
| 0.2 | 2.8 | GO:0043249 | erythrocyte maturation(GO:0043249) |
| 0.2 | 0.9 | GO:0071894 | histone H2B conserved C-terminal lysine ubiquitination(GO:0071894) |
| 0.2 | 1.3 | GO:0017196 | N-terminal peptidyl-methionine acetylation(GO:0017196) |
| 0.2 | 5.0 | GO:0015991 | energy coupled proton transmembrane transport, against electrochemical gradient(GO:0015988) ATP hydrolysis coupled proton transport(GO:0015991) ATP hydrolysis coupled transmembrane transport(GO:0090662) |
| 0.2 | 0.9 | GO:0070166 | enamel mineralization(GO:0070166) |
| 0.2 | 5.5 | GO:0072583 | clathrin-mediated endocytosis(GO:0072583) |
| 0.2 | 2.7 | GO:0060213 | regulation of nuclear-transcribed mRNA poly(A) tail shortening(GO:0060211) positive regulation of nuclear-transcribed mRNA poly(A) tail shortening(GO:0060213) |
| 0.2 | 0.5 | GO:0006624 | vacuolar protein processing(GO:0006624) |
| 0.2 | 0.8 | GO:0050651 | dermatan sulfate proteoglycan biosynthetic process(GO:0050651) |
| 0.2 | 1.0 | GO:0071712 | ER-associated misfolded protein catabolic process(GO:0071712) |
| 0.2 | 1.3 | GO:0097460 | ferrous iron import into cell(GO:0097460) |
| 0.2 | 6.0 | GO:0000038 | very long-chain fatty acid metabolic process(GO:0000038) |
| 0.2 | 3.5 | GO:0045725 | positive regulation of glycogen biosynthetic process(GO:0045725) |
| 0.2 | 0.9 | GO:0032534 | regulation of microvillus assembly(GO:0032534) |
| 0.2 | 2.9 | GO:2000505 | regulation of energy homeostasis(GO:2000505) |
| 0.1 | 2.4 | GO:0071801 | regulation of podosome assembly(GO:0071801) |
| 0.1 | 1.7 | GO:0006895 | Golgi to endosome transport(GO:0006895) |
| 0.1 | 2.8 | GO:0034315 | regulation of Arp2/3 complex-mediated actin nucleation(GO:0034315) |
| 0.1 | 3.2 | GO:0006829 | zinc II ion transport(GO:0006829) |
| 0.1 | 0.8 | GO:1990564 | protein ufmylation(GO:0071569) protein polyufmylation(GO:1990564) protein K69-linked ufmylation(GO:1990592) |
| 0.1 | 0.7 | GO:0006172 | ADP biosynthetic process(GO:0006172) |
| 0.1 | 24.4 | GO:0007266 | Rho protein signal transduction(GO:0007266) |
| 0.1 | 2.4 | GO:0001574 | ganglioside biosynthetic process(GO:0001574) |
| 0.1 | 0.3 | GO:0070488 | neutrophil aggregation(GO:0070488) |
| 0.1 | 1.1 | GO:1904152 | regulation of protein exit from endoplasmic reticulum(GO:0070861) negative regulation of protein exit from endoplasmic reticulum(GO:0070862) regulation of retrograde protein transport, ER to cytosol(GO:1904152) negative regulation of retrograde protein transport, ER to cytosol(GO:1904153) |
| 0.1 | 0.8 | GO:0023035 | CD40 signaling pathway(GO:0023035) protein linear polyubiquitination(GO:0097039) |
| 0.1 | 0.9 | GO:1901727 | positive regulation of histone deacetylase activity(GO:1901727) |
| 0.1 | 0.4 | GO:0090370 | negative regulation of cholesterol efflux(GO:0090370) |
| 0.1 | 5.7 | GO:0007585 | respiratory gaseous exchange(GO:0007585) |
| 0.1 | 5.2 | GO:0015914 | phospholipid transport(GO:0015914) |
| 0.1 | 2.3 | GO:0061099 | negative regulation of protein tyrosine kinase activity(GO:0061099) |
| 0.1 | 1.2 | GO:0006622 | protein targeting to lysosome(GO:0006622) |
| 0.1 | 1.1 | GO:0008105 | asymmetric protein localization(GO:0008105) |
| 0.1 | 1.6 | GO:0008209 | androgen metabolic process(GO:0008209) |
| 0.1 | 2.1 | GO:0006054 | N-acetylneuraminate metabolic process(GO:0006054) |
| 0.1 | 0.8 | GO:1902018 | negative regulation of cilium assembly(GO:1902018) |
| 0.1 | 5.8 | GO:0032088 | negative regulation of NF-kappaB transcription factor activity(GO:0032088) |
| 0.1 | 0.9 | GO:0032926 | negative regulation of activin receptor signaling pathway(GO:0032926) |
| 0.1 | 2.3 | GO:0046854 | phosphatidylinositol phosphorylation(GO:0046854) |
| 0.1 | 0.8 | GO:0046415 | urate metabolic process(GO:0046415) |
| 0.1 | 2.6 | GO:0034629 | cellular protein complex localization(GO:0034629) |
| 0.1 | 0.9 | GO:0016559 | peroxisome fission(GO:0016559) dicarboxylic acid catabolic process(GO:0043649) |
| 0.1 | 0.7 | GO:0000467 | exonucleolytic trimming involved in rRNA processing(GO:0000459) exonucleolytic trimming to generate mature 3'-end of 5.8S rRNA from tricistronic rRNA transcript (SSU-rRNA, 5.8S rRNA, LSU-rRNA)(GO:0000467) |
| 0.1 | 4.3 | GO:1902850 | mitotic spindle assembly(GO:0090307) microtubule cytoskeleton organization involved in mitosis(GO:1902850) |
| 0.1 | 1.2 | GO:1900454 | positive regulation of long term synaptic depression(GO:1900454) |
| 0.1 | 2.1 | GO:0007032 | endosome organization(GO:0007032) |
| 0.1 | 0.8 | GO:0030157 | pancreatic juice secretion(GO:0030157) |
| 0.1 | 0.3 | GO:0019355 | nicotinamide nucleotide biosynthetic process from aspartate(GO:0019355) 'de novo' NAD biosynthetic process(GO:0034627) 'de novo' NAD biosynthetic process from aspartate(GO:0034628) |
| 0.1 | 2.0 | GO:0002089 | lens morphogenesis in camera-type eye(GO:0002089) |
| 0.1 | 1.8 | GO:0045879 | negative regulation of smoothened signaling pathway(GO:0045879) |
| 0.1 | 1.0 | GO:0009072 | aromatic amino acid family metabolic process(GO:0009072) |
| 0.1 | 0.5 | GO:0071218 | cellular response to misfolded protein(GO:0071218) |
| 0.1 | 1.2 | GO:0000731 | DNA synthesis involved in DNA repair(GO:0000731) |
| 0.1 | 1.0 | GO:0045724 | positive regulation of cilium assembly(GO:0045724) |
| 0.1 | 1.1 | GO:0071108 | protein K48-linked deubiquitination(GO:0071108) |
| 0.0 | 2.1 | GO:1901998 | toxin transport(GO:1901998) |
| 0.0 | 0.6 | GO:1902287 | semaphorin-plexin signaling pathway involved in axon guidance(GO:1902287) |
| 0.0 | 0.8 | GO:0016558 | protein import into peroxisome matrix(GO:0016558) |
| 0.0 | 1.4 | GO:0035066 | positive regulation of histone acetylation(GO:0035066) |
| 0.0 | 0.4 | GO:0019363 | pyridine nucleotide biosynthetic process(GO:0019363) |
| 0.0 | 2.9 | GO:0060976 | coronary vasculature development(GO:0060976) |
| 0.0 | 0.1 | GO:0010726 | positive regulation of hydrogen peroxide metabolic process(GO:0010726) |
| 0.0 | 0.3 | GO:0006102 | isocitrate metabolic process(GO:0006102) |
| 0.0 | 2.1 | GO:0030148 | sphingolipid biosynthetic process(GO:0030148) |
| 0.0 | 0.2 | GO:2000643 | negative regulation of excitatory postsynaptic potential(GO:0090394) positive regulation of early endosome to late endosome transport(GO:2000643) |
| 0.0 | 1.5 | GO:0048843 | negative regulation of axon extension involved in axon guidance(GO:0048843) |
| 0.0 | 1.0 | GO:0050873 | brown fat cell differentiation(GO:0050873) |
| 0.0 | 0.3 | GO:0006488 | dolichol-linked oligosaccharide biosynthetic process(GO:0006488) |
| 0.0 | 0.5 | GO:0043984 | histone H4-K16 acetylation(GO:0043984) |
| 0.0 | 3.8 | GO:0030010 | establishment of cell polarity(GO:0030010) |
| 0.0 | 0.5 | GO:0005980 | polysaccharide catabolic process(GO:0000272) glycogen catabolic process(GO:0005980) glucan catabolic process(GO:0009251) cellular polysaccharide catabolic process(GO:0044247) |
| 0.0 | 0.4 | GO:0034314 | Arp2/3 complex-mediated actin nucleation(GO:0034314) |
| 0.0 | 0.3 | GO:0044804 | nucleophagy(GO:0044804) |
| 0.0 | 0.5 | GO:0014066 | regulation of phosphatidylinositol 3-kinase signaling(GO:0014066) |
| 0.0 | 2.0 | GO:0031123 | RNA 3'-end processing(GO:0031123) |
| 0.0 | 0.9 | GO:0000266 | mitochondrial fission(GO:0000266) |
| 0.0 | 6.2 | GO:0043087 | regulation of GTPase activity(GO:0043087) |
| 0.0 | 1.4 | GO:0035019 | somatic stem cell population maintenance(GO:0035019) |
| 0.0 | 0.9 | GO:0031146 | SCF-dependent proteasomal ubiquitin-dependent protein catabolic process(GO:0031146) |
| 0.0 | 0.1 | GO:0035166 | post-embryonic hemopoiesis(GO:0035166) |
| 0.0 | 0.2 | GO:0000729 | DNA double-strand break processing(GO:0000729) |
| 0.0 | 1.3 | GO:0042147 | retrograde transport, endosome to Golgi(GO:0042147) |
| 0.0 | 0.3 | GO:0051016 | barbed-end actin filament capping(GO:0051016) |
| 0.0 | 0.1 | GO:0006776 | vitamin A metabolic process(GO:0006776) |
| 0.0 | 0.1 | GO:0016255 | attachment of GPI anchor to protein(GO:0016255) |
| 0.0 | 2.5 | GO:0051262 | protein tetramerization(GO:0051262) |
| 0.0 | 0.2 | GO:0021942 | radial glia guided migration of Purkinje cell(GO:0021942) |
| 0.0 | 1.5 | GO:0016579 | protein deubiquitination(GO:0016579) |
| 0.0 | 0.0 | GO:0060729 | intestinal epithelial structure maintenance(GO:0060729) |
| 0.0 | 0.1 | GO:0000185 | activation of MAPKKK activity(GO:0000185) |
| 0.0 | 1.2 | GO:0001578 | microtubule bundle formation(GO:0001578) |
| 0.0 | 1.0 | GO:2001238 | positive regulation of extrinsic apoptotic signaling pathway(GO:2001238) |
| 0.0 | 1.0 | GO:1900046 | regulation of blood coagulation(GO:0030193) regulation of hemostasis(GO:1900046) |
| 0.0 | 1.8 | GO:0010977 | negative regulation of neuron projection development(GO:0010977) |
| 0.0 | 0.3 | GO:1901655 | cellular response to ketone(GO:1901655) |
| 0.0 | 0.3 | GO:0010800 | positive regulation of peptidyl-threonine phosphorylation(GO:0010800) |
| 0.0 | 1.4 | GO:0000209 | protein polyubiquitination(GO:0000209) |
| 0.0 | 0.2 | GO:0051457 | maintenance of protein location in nucleus(GO:0051457) |
| 0.0 | 0.5 | GO:0006376 | mRNA splice site selection(GO:0006376) |
| 0.0 | 0.2 | GO:0099500 | synaptic vesicle fusion to presynaptic active zone membrane(GO:0031629) vesicle fusion to plasma membrane(GO:0099500) |
| 0.0 | 1.5 | GO:0098656 | anion transmembrane transport(GO:0098656) |
| 0.0 | 0.2 | GO:0050435 | beta-amyloid metabolic process(GO:0050435) |
| 0.0 | 0.0 | GO:0007171 | activation of transmembrane receptor protein tyrosine kinase activity(GO:0007171) prolactin signaling pathway(GO:0038161) |
| 0.0 | 0.1 | GO:0019511 | peptidyl-proline hydroxylation(GO:0019511) |
| 0.0 | 0.4 | GO:0060395 | SMAD protein signal transduction(GO:0060395) |
Gene overrepresentation in cellular_component category:
| Log-likelihood per target | Total log-likelihood | Term | Description |
|---|---|---|---|
| 1.2 | 3.5 | GO:0005899 | insulin receptor complex(GO:0005899) |
| 0.7 | 5.8 | GO:0032937 | SREBP-SCAP-Insig complex(GO:0032937) |
| 0.7 | 4.3 | GO:0000235 | astral microtubule(GO:0000235) |
| 0.6 | 0.6 | GO:0070695 | FHF complex(GO:0070695) |
| 0.6 | 5.0 | GO:0033180 | proton-transporting V-type ATPase, V1 domain(GO:0033180) |
| 0.5 | 6.0 | GO:0031931 | TORC1 complex(GO:0031931) |
| 0.5 | 13.9 | GO:0005868 | cytoplasmic dynein complex(GO:0005868) |
| 0.5 | 3.5 | GO:0034366 | spherical high-density lipoprotein particle(GO:0034366) neurofibrillary tangle(GO:0097418) |
| 0.4 | 4.5 | GO:0071439 | clathrin complex(GO:0071439) |
| 0.4 | 1.3 | GO:0020018 | ciliary pocket(GO:0020016) ciliary pocket membrane(GO:0020018) |
| 0.4 | 5.0 | GO:0030056 | hemidesmosome(GO:0030056) |
| 0.4 | 1.2 | GO:0043625 | delta DNA polymerase complex(GO:0043625) |
| 0.4 | 1.2 | GO:0042585 | germinal vesicle(GO:0042585) |
| 0.4 | 2.6 | GO:0097197 | tetraspanin-enriched microdomain(GO:0097197) |
| 0.3 | 1.0 | GO:0070765 | gamma-secretase complex(GO:0070765) |
| 0.3 | 1.0 | GO:0036501 | UFD1-NPL4 complex(GO:0036501) |
| 0.3 | 8.7 | GO:0016581 | NuRD complex(GO:0016581) CHD-type complex(GO:0090545) |
| 0.3 | 4.7 | GO:0031045 | dense core granule(GO:0031045) |
| 0.3 | 6.1 | GO:0032279 | asymmetric synapse(GO:0032279) |
| 0.3 | 1.7 | GO:0070847 | core mediator complex(GO:0070847) |
| 0.3 | 6.8 | GO:0031430 | M band(GO:0031430) |
| 0.3 | 2.0 | GO:0060293 | P granule(GO:0043186) pole plasm(GO:0045495) germ plasm(GO:0060293) |
| 0.3 | 0.5 | GO:0098799 | outer mitochondrial membrane protein complex(GO:0098799) |
| 0.3 | 0.8 | GO:1990415 | Pex17p-Pex14p docking complex(GO:1990415) peroxisomal importomer complex(GO:1990429) |
| 0.3 | 2.0 | GO:0032584 | growth cone membrane(GO:0032584) |
| 0.3 | 2.0 | GO:0005774 | vacuolar membrane(GO:0005774) |
| 0.2 | 1.2 | GO:0035032 | phosphatidylinositol 3-kinase complex, class III(GO:0035032) |
| 0.2 | 1.0 | GO:0060053 | neurofilament cytoskeleton(GO:0060053) |
| 0.2 | 1.7 | GO:0071818 | BAT3 complex(GO:0071818) ER membrane insertion complex(GO:0072379) |
| 0.2 | 2.1 | GO:0030478 | actin cap(GO:0030478) |
| 0.2 | 3.5 | GO:0034045 | pre-autophagosomal structure membrane(GO:0034045) |
| 0.2 | 6.3 | GO:0055038 | recycling endosome membrane(GO:0055038) |
| 0.2 | 18.3 | GO:0005905 | clathrin-coated pit(GO:0005905) |
| 0.2 | 12.2 | GO:0031463 | Cul3-RING ubiquitin ligase complex(GO:0031463) |
| 0.2 | 0.8 | GO:0071797 | LUBAC complex(GO:0071797) |
| 0.2 | 1.2 | GO:0031313 | extrinsic component of endosome membrane(GO:0031313) |
| 0.2 | 4.1 | GO:0030673 | axolemma(GO:0030673) |
| 0.2 | 0.7 | GO:0019815 | B cell receptor complex(GO:0019815) |
| 0.2 | 1.3 | GO:0016593 | Cdc73/Paf1 complex(GO:0016593) |
| 0.2 | 1.5 | GO:0005892 | acetylcholine-gated channel complex(GO:0005892) |
| 0.1 | 1.6 | GO:0031258 | lamellipodium membrane(GO:0031258) |
| 0.1 | 1.8 | GO:0070419 | nonhomologous end joining complex(GO:0070419) |
| 0.1 | 1.0 | GO:0042589 | zymogen granule membrane(GO:0042589) |
| 0.1 | 1.0 | GO:0005869 | dynactin complex(GO:0005869) |
| 0.1 | 2.0 | GO:0030131 | clathrin adaptor complex(GO:0030131) |
| 0.1 | 0.8 | GO:0070552 | BRISC complex(GO:0070552) |
| 0.1 | 0.5 | GO:0072487 | MSL complex(GO:0072487) |
| 0.1 | 1.0 | GO:0030897 | HOPS complex(GO:0030897) |
| 0.1 | 1.2 | GO:0071203 | WASH complex(GO:0071203) |
| 0.1 | 0.9 | GO:0061700 | GATOR2 complex(GO:0061700) |
| 0.1 | 1.5 | GO:0033017 | sarcoplasmic reticulum membrane(GO:0033017) |
| 0.1 | 1.8 | GO:0034451 | centriolar satellite(GO:0034451) |
| 0.1 | 5.6 | GO:0000118 | histone deacetylase complex(GO:0000118) |
| 0.1 | 0.9 | GO:0031229 | integral component of nuclear inner membrane(GO:0005639) intrinsic component of nuclear inner membrane(GO:0031229) |
| 0.1 | 2.5 | GO:0005891 | voltage-gated calcium channel complex(GO:0005891) |
| 0.1 | 2.2 | GO:0005876 | spindle microtubule(GO:0005876) |
| 0.1 | 0.5 | GO:0005751 | mitochondrial respiratory chain complex IV(GO:0005751) |
| 0.1 | 0.8 | GO:0030126 | COPI vesicle coat(GO:0030126) |
| 0.1 | 4.8 | GO:0005930 | axoneme(GO:0005930) ciliary plasm(GO:0097014) |
| 0.1 | 1.1 | GO:0042470 | melanosome(GO:0042470) pigment granule(GO:0048770) |
| 0.1 | 4.3 | GO:0005875 | microtubule associated complex(GO:0005875) |
| 0.0 | 0.7 | GO:0035631 | CD40 receptor complex(GO:0035631) |
| 0.0 | 0.6 | GO:0001527 | microfibril(GO:0001527) |
| 0.0 | 1.8 | GO:0005801 | cis-Golgi network(GO:0005801) |
| 0.0 | 1.1 | GO:0030904 | retromer complex(GO:0030904) |
| 0.0 | 2.4 | GO:0030173 | integral component of Golgi membrane(GO:0030173) |
| 0.0 | 5.5 | GO:0031225 | anchored component of membrane(GO:0031225) |
| 0.0 | 2.7 | GO:0031985 | Golgi cisterna(GO:0031985) |
| 0.0 | 0.2 | GO:0097441 | basilar dendrite(GO:0097441) |
| 0.0 | 0.3 | GO:0032299 | ribonuclease H2 complex(GO:0032299) |
| 0.0 | 0.4 | GO:0005885 | Arp2/3 protein complex(GO:0005885) |
| 0.0 | 0.9 | GO:0005782 | peroxisomal matrix(GO:0005782) microbody lumen(GO:0031907) |
| 0.0 | 0.6 | GO:0031526 | brush border membrane(GO:0031526) |
| 0.0 | 3.7 | GO:0031514 | motile cilium(GO:0031514) |
| 0.0 | 1.7 | GO:0016529 | sarcoplasmic reticulum(GO:0016529) |
| 0.0 | 2.7 | GO:0055037 | recycling endosome(GO:0055037) |
| 0.0 | 5.4 | GO:0005777 | peroxisome(GO:0005777) microbody(GO:0042579) |
| 0.0 | 3.9 | GO:0030176 | integral component of endoplasmic reticulum membrane(GO:0030176) |
| 0.0 | 0.2 | GO:0097361 | CIA complex(GO:0097361) |
| 0.0 | 0.8 | GO:0080008 | Cul4-RING E3 ubiquitin ligase complex(GO:0080008) |
| 0.0 | 1.2 | GO:0014704 | intercalated disc(GO:0014704) |
| 0.0 | 0.4 | GO:0035327 | transcriptionally active chromatin(GO:0035327) |
| 0.0 | 3.3 | GO:0008021 | synaptic vesicle(GO:0008021) |
| 0.0 | 5.9 | GO:0045211 | postsynaptic membrane(GO:0045211) |
| 0.0 | 3.6 | GO:0098852 | lysosomal membrane(GO:0005765) lytic vacuole membrane(GO:0098852) |
| 0.0 | 1.5 | GO:0005758 | mitochondrial intermembrane space(GO:0005758) |
| 0.0 | 0.1 | GO:0045334 | clathrin-coated endocytic vesicle(GO:0045334) |
| 0.0 | 0.3 | GO:0031588 | nucleotide-activated protein kinase complex(GO:0031588) |
| 0.0 | 1.2 | GO:0070469 | respiratory chain(GO:0070469) |
| 0.0 | 0.3 | GO:0005942 | phosphatidylinositol 3-kinase complex(GO:0005942) |
| 0.0 | 0.7 | GO:0005811 | lipid particle(GO:0005811) |
| 0.0 | 0.2 | GO:0005605 | basal lamina(GO:0005605) |
| 0.0 | 0.1 | GO:0005964 | phosphorylase kinase complex(GO:0005964) |
| 0.0 | 1.8 | GO:0005764 | lytic vacuole(GO:0000323) lysosome(GO:0005764) |
| 0.0 | 0.2 | GO:0030914 | STAGA complex(GO:0030914) |
Gene overrepresentation in molecular_function category:
| Log-likelihood per target | Total log-likelihood | Term | Description |
|---|---|---|---|
| 2.6 | 12.8 | GO:0045503 | dynein light chain binding(GO:0045503) |
| 1.3 | 6.3 | GO:0050265 | RNA uridylyltransferase activity(GO:0050265) |
| 1.3 | 5.0 | GO:0005176 | ErbB-2 class receptor binding(GO:0005176) |
| 1.1 | 6.5 | GO:0015277 | kainate selective glutamate receptor activity(GO:0015277) |
| 1.0 | 3.1 | GO:0047256 | beta-galactosyl-N-acetylglucosaminylgalactosylglucosyl-ceramide beta-1,3-acetylglucosaminyltransferase activity(GO:0008457) lactosylceramide 1,3-N-acetyl-beta-D-glucosaminyltransferase activity(GO:0047256) |
| 0.7 | 4.0 | GO:0004887 | thyroid hormone receptor activity(GO:0004887) |
| 0.5 | 1.5 | GO:0005220 | inositol 1,4,5-trisphosphate-sensitive calcium-release channel activity(GO:0005220) |
| 0.4 | 2.1 | GO:0003835 | beta-galactoside alpha-2,6-sialyltransferase activity(GO:0003835) |
| 0.4 | 1.7 | GO:0001784 | phosphotyrosine binding(GO:0001784) |
| 0.4 | 2.4 | GO:0070728 | leucine binding(GO:0070728) |
| 0.4 | 1.6 | GO:0008240 | tripeptidyl-peptidase activity(GO:0008240) |
| 0.4 | 10.3 | GO:0005385 | zinc ion transmembrane transporter activity(GO:0005385) |
| 0.3 | 1.7 | GO:0019961 | interferon binding(GO:0019961) |
| 0.3 | 3.7 | GO:0031957 | very long-chain fatty acid-CoA ligase activity(GO:0031957) |
| 0.3 | 1.0 | GO:0001716 | L-amino-acid oxidase activity(GO:0001716) |
| 0.3 | 1.5 | GO:0004792 | thiosulfate sulfurtransferase activity(GO:0004792) |
| 0.3 | 1.5 | GO:0017108 | 5'-flap endonuclease activity(GO:0017108) |
| 0.3 | 0.8 | GO:0015143 | urate transmembrane transporter activity(GO:0015143) salt transmembrane transporter activity(GO:1901702) |
| 0.3 | 1.7 | GO:0016936 | galactoside binding(GO:0016936) |
| 0.2 | 0.7 | GO:0001888 | glucuronyl-galactosyl-proteoglycan 4-alpha-N-acetylglucosaminyltransferase activity(GO:0001888) |
| 0.2 | 1.0 | GO:0070012 | oligopeptidase activity(GO:0070012) |
| 0.2 | 0.7 | GO:0046899 | nucleoside triphosphate adenylate kinase activity(GO:0046899) |
| 0.2 | 2.2 | GO:0032050 | clathrin heavy chain binding(GO:0032050) |
| 0.2 | 1.2 | GO:0086080 | connexin binding(GO:0071253) protein binding involved in heterotypic cell-cell adhesion(GO:0086080) |
| 0.2 | 0.9 | GO:0034739 | histone deacetylase activity (H4-K16 specific)(GO:0034739) |
| 0.2 | 6.8 | GO:0008093 | cytoskeletal adaptor activity(GO:0008093) |
| 0.2 | 5.2 | GO:0051787 | misfolded protein binding(GO:0051787) |
| 0.2 | 3.3 | GO:0008430 | selenium binding(GO:0008430) |
| 0.2 | 3.3 | GO:0035612 | AP-2 adaptor complex binding(GO:0035612) |
| 0.2 | 1.1 | GO:0005166 | neurotrophin p75 receptor binding(GO:0005166) |
| 0.2 | 0.6 | GO:0031752 | D5 dopamine receptor binding(GO:0031752) |
| 0.2 | 2.1 | GO:0008140 | cAMP response element binding protein binding(GO:0008140) |
| 0.2 | 1.8 | GO:0035312 | 5'-3' exodeoxyribonuclease activity(GO:0035312) |
| 0.2 | 1.4 | GO:0035368 | selenocysteine insertion sequence binding(GO:0035368) |
| 0.2 | 1.3 | GO:0001135 | transcription factor activity, RNA polymerase II transcription factor recruiting(GO:0001135) |
| 0.2 | 9.8 | GO:0030276 | clathrin binding(GO:0030276) |
| 0.2 | 4.1 | GO:0030159 | receptor signaling complex scaffold activity(GO:0030159) |
| 0.2 | 1.3 | GO:0015091 | ferric iron transmembrane transporter activity(GO:0015091) trivalent inorganic cation transmembrane transporter activity(GO:0072510) |
| 0.2 | 6.7 | GO:0045296 | cadherin binding(GO:0045296) |
| 0.2 | 5.0 | GO:0046961 | proton-transporting ATPase activity, rotational mechanism(GO:0046961) |
| 0.2 | 0.8 | GO:0072542 | protein phosphatase activator activity(GO:0072542) |
| 0.2 | 1.0 | GO:0036435 | K48-linked polyubiquitin binding(GO:0036435) |
| 0.2 | 1.1 | GO:0051959 | dynein light intermediate chain binding(GO:0051959) |
| 0.2 | 19.1 | GO:0005089 | Rho guanyl-nucleotide exchange factor activity(GO:0005089) |
| 0.1 | 2.5 | GO:0044183 | protein binding involved in protein folding(GO:0044183) |
| 0.1 | 3.5 | GO:0070273 | phosphatidylinositol-4-phosphate binding(GO:0070273) |
| 0.1 | 3.5 | GO:0080025 | phosphatidylinositol-3,5-bisphosphate binding(GO:0080025) |
| 0.1 | 0.4 | GO:0031798 | type 1 metabotropic glutamate receptor binding(GO:0031798) RNA polymerase II transcription factor activity, estrogen-activated sequence-specific DNA binding(GO:0038052) |
| 0.1 | 3.0 | GO:0004012 | phospholipid-translocating ATPase activity(GO:0004012) |
| 0.1 | 1.1 | GO:0008121 | ubiquinol-cytochrome-c reductase activity(GO:0008121) oxidoreductase activity, acting on diphenols and related substances as donors(GO:0016679) oxidoreductase activity, acting on diphenols and related substances as donors, cytochrome as acceptor(GO:0016681) |
| 0.1 | 2.3 | GO:0032266 | phosphatidylinositol-3-phosphate binding(GO:0032266) |
| 0.1 | 13.4 | GO:0008565 | protein transporter activity(GO:0008565) |
| 0.1 | 0.6 | GO:0004430 | 1-phosphatidylinositol 4-kinase activity(GO:0004430) |
| 0.1 | 1.3 | GO:0030296 | protein tyrosine kinase activator activity(GO:0030296) |
| 0.1 | 0.3 | GO:0035662 | Toll-like receptor 4 binding(GO:0035662) |
| 0.1 | 4.6 | GO:0004683 | calmodulin-dependent protein kinase activity(GO:0004683) |
| 0.1 | 1.3 | GO:0005225 | volume-sensitive anion channel activity(GO:0005225) |
| 0.1 | 1.0 | GO:0051021 | GDP-dissociation inhibitor binding(GO:0051021) |
| 0.1 | 0.5 | GO:0001849 | complement component C1q binding(GO:0001849) |
| 0.1 | 0.4 | GO:0038132 | neuregulin binding(GO:0038132) |
| 0.1 | 1.3 | GO:0004596 | peptide alpha-N-acetyltransferase activity(GO:0004596) |
| 0.1 | 1.5 | GO:0016303 | 1-phosphatidylinositol-3-kinase activity(GO:0016303) |
| 0.1 | 0.3 | GO:0004449 | isocitrate dehydrogenase (NAD+) activity(GO:0004449) |
| 0.1 | 1.0 | GO:0102338 | fatty acid elongase activity(GO:0009922) 3-oxo-arachidoyl-CoA synthase activity(GO:0102336) 3-oxo-cerotoyl-CoA synthase activity(GO:0102337) 3-oxo-lignoceronyl-CoA synthase activity(GO:0102338) |
| 0.1 | 0.2 | GO:0008297 | single-stranded DNA exodeoxyribonuclease activity(GO:0008297) |
| 0.1 | 0.3 | GO:0004111 | creatine kinase activity(GO:0004111) |
| 0.1 | 0.8 | GO:0071933 | Arp2/3 complex binding(GO:0071933) |
| 0.1 | 11.3 | GO:0017137 | Rab GTPase binding(GO:0017137) |
| 0.1 | 2.1 | GO:0031690 | adrenergic receptor binding(GO:0031690) |
| 0.1 | 3.2 | GO:0005484 | SNAP receptor activity(GO:0005484) |
| 0.1 | 0.8 | GO:0016920 | pyroglutamyl-peptidase activity(GO:0016920) |
| 0.1 | 1.6 | GO:0003950 | NAD+ ADP-ribosyltransferase activity(GO:0003950) |
| 0.1 | 0.8 | GO:0008641 | small protein activating enzyme activity(GO:0008641) |
| 0.1 | 0.3 | GO:0004515 | nicotinamide-nucleotide adenylyltransferase activity(GO:0000309) nicotinate-nucleotide adenylyltransferase activity(GO:0004515) |
| 0.1 | 2.0 | GO:0045502 | dynein binding(GO:0045502) |
| 0.1 | 1.5 | GO:0001671 | ATPase activator activity(GO:0001671) |
| 0.1 | 1.3 | GO:0005164 | tumor necrosis factor receptor binding(GO:0005164) |
| 0.1 | 9.4 | GO:0017124 | SH3 domain binding(GO:0017124) |
| 0.1 | 0.8 | GO:0070064 | proline-rich region binding(GO:0070064) |
| 0.1 | 0.9 | GO:0016290 | palmitoyl-CoA hydrolase activity(GO:0016290) |
| 0.1 | 0.9 | GO:0005035 | tumor necrosis factor-activated receptor activity(GO:0005031) death receptor activity(GO:0005035) |
| 0.1 | 2.7 | GO:0004120 | calmodulin-dependent cyclic-nucleotide phosphodiesterase activity(GO:0004117) cGMP-stimulated cyclic-nucleotide phosphodiesterase activity(GO:0004118) cGMP-inhibited cyclic-nucleotide phosphodiesterase activity(GO:0004119) photoreceptor cyclic-nucleotide phosphodiesterase activity(GO:0004120) 7,8-dihydro-D-neopterin 2',3'-cyclic phosphate phosphodiesterase activity(GO:0044688) inositol phosphosphingolipid phospholipase activity(GO:0052712) inositol phosphorylceramide phospholipase activity(GO:0052713) mannosyl-inositol phosphorylceramide phospholipase activity(GO:0052714) mannosyl-diinositol phosphorylceramide phospholipase activity(GO:0052715) |
| 0.1 | 1.6 | GO:0043015 | gamma-tubulin binding(GO:0043015) |
| 0.1 | 0.5 | GO:0001871 | pattern binding(GO:0001871) polysaccharide binding(GO:0030247) |
| 0.1 | 1.7 | GO:0004407 | histone deacetylase activity(GO:0004407) protein deacetylase activity(GO:0033558) |
| 0.0 | 0.9 | GO:0043539 | protein serine/threonine kinase activator activity(GO:0043539) |
| 0.0 | 1.0 | GO:0005044 | scavenger receptor activity(GO:0005044) |
| 0.0 | 0.9 | GO:0003841 | 1-acylglycerol-3-phosphate O-acyltransferase activity(GO:0003841) |
| 0.0 | 1.2 | GO:0003887 | DNA-directed DNA polymerase activity(GO:0003887) |
| 0.0 | 1.5 | GO:0030215 | semaphorin receptor binding(GO:0030215) |
| 0.0 | 12.6 | GO:0070740 | tubulin-glutamic acid ligase activity(GO:0070740) |
| 0.0 | 0.3 | GO:0003958 | NADPH-hemoprotein reductase activity(GO:0003958) |
| 0.0 | 2.4 | GO:0003777 | microtubule motor activity(GO:0003777) |
| 0.0 | 2.2 | GO:0030374 | ligand-dependent nuclear receptor transcription coactivator activity(GO:0030374) |
| 0.0 | 0.3 | GO:0004523 | RNA-DNA hybrid ribonuclease activity(GO:0004523) |
| 0.0 | 3.1 | GO:0101005 | thiol-dependent ubiquitinyl hydrolase activity(GO:0036459) ubiquitinyl hydrolase activity(GO:0101005) |
| 0.0 | 0.7 | GO:0016922 | ligand-dependent nuclear receptor binding(GO:0016922) |
| 0.0 | 2.2 | GO:0043130 | ubiquitin binding(GO:0043130) |
| 0.0 | 2.4 | GO:0008376 | acetylgalactosaminyltransferase activity(GO:0008376) |
| 0.0 | 1.3 | GO:0048365 | Rac GTPase binding(GO:0048365) |
| 0.0 | 0.2 | GO:0046976 | histone methyltransferase activity (H3-K27 specific)(GO:0046976) |
| 0.0 | 0.3 | GO:0004679 | AMP-activated protein kinase activity(GO:0004679) |
| 0.0 | 3.0 | GO:0004702 | receptor signaling protein serine/threonine kinase activity(GO:0004702) |
| 0.0 | 1.1 | GO:0061631 | ubiquitin conjugating enzyme activity(GO:0061631) ubiquitin-like protein conjugating enzyme activity(GO:0061650) |
| 0.0 | 2.0 | GO:0019208 | phosphatase regulator activity(GO:0019208) |
| 0.0 | 4.5 | GO:0004842 | ubiquitin-protein transferase activity(GO:0004842) |
| 0.0 | 2.3 | GO:0008236 | serine-type peptidase activity(GO:0008236) |
| 0.0 | 0.3 | GO:0008179 | adenylate cyclase binding(GO:0008179) |
| 0.0 | 0.8 | GO:0005086 | ARF guanyl-nucleotide exchange factor activity(GO:0005086) |
| 0.0 | 0.1 | GO:0004954 | icosanoid receptor activity(GO:0004953) prostanoid receptor activity(GO:0004954) prostaglandin receptor activity(GO:0004955) |
| 0.0 | 0.3 | GO:0097602 | cullin family protein binding(GO:0097602) |
| 0.0 | 0.5 | GO:0016676 | cytochrome-c oxidase activity(GO:0004129) heme-copper terminal oxidase activity(GO:0015002) oxidoreductase activity, acting on a heme group of donors(GO:0016675) oxidoreductase activity, acting on a heme group of donors, oxygen as acceptor(GO:0016676) |
| 0.0 | 0.9 | GO:0005507 | copper ion binding(GO:0005507) |
| 0.0 | 0.2 | GO:0004438 | phosphatidylinositol-3-phosphatase activity(GO:0004438) |
| 0.0 | 0.8 | GO:0005200 | structural constituent of cytoskeleton(GO:0005200) |
| 0.0 | 0.7 | GO:0044824 | integrase activity(GO:0008907) T/G mismatch-specific endonuclease activity(GO:0043765) retroviral integrase activity(GO:0044823) retroviral 3' processing activity(GO:0044824) |
| 0.0 | 0.8 | GO:0005179 | hormone activity(GO:0005179) |
| 0.0 | 1.1 | GO:0008083 | growth factor activity(GO:0008083) |
| 0.0 | 0.1 | GO:0070628 | proteasome binding(GO:0070628) |