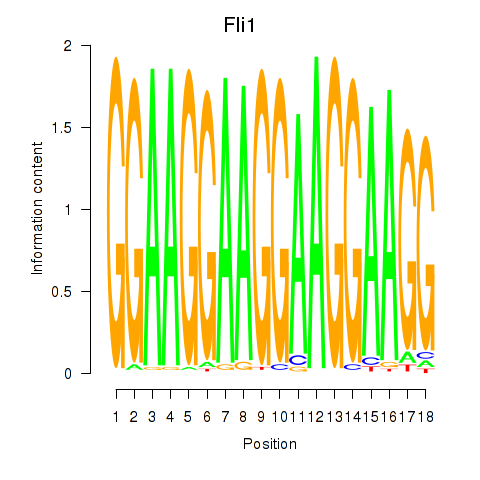
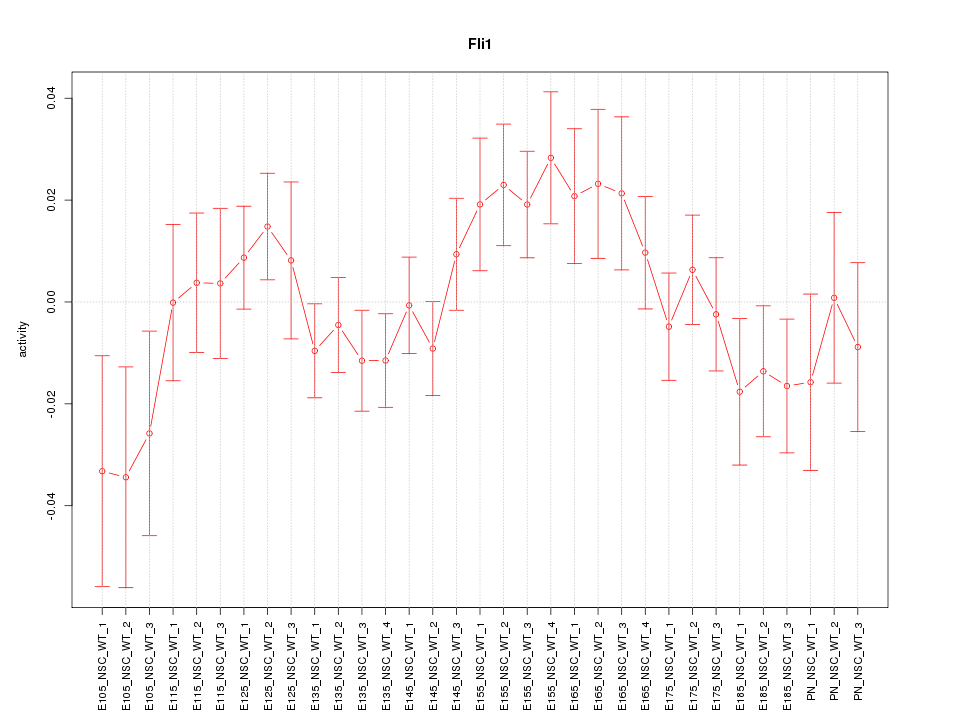
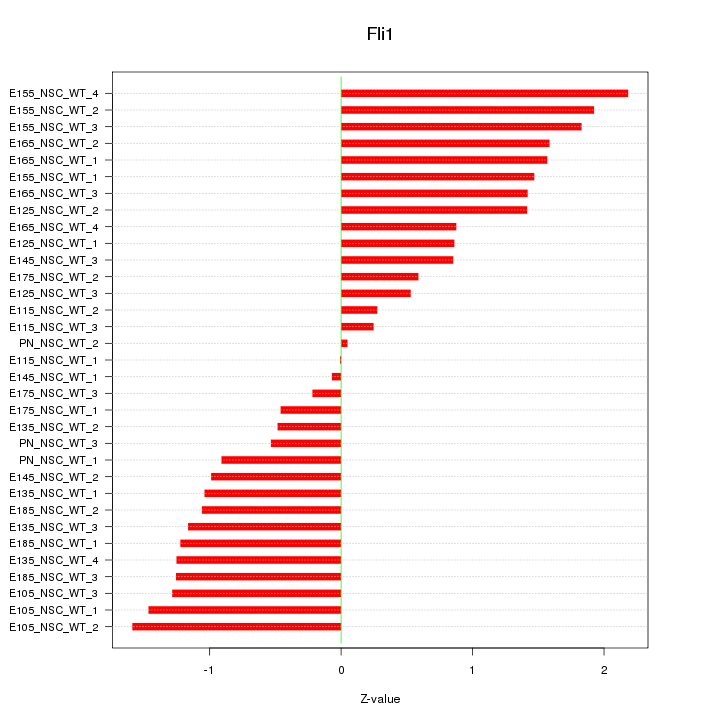
Motif ID: Fli1
Z-value: 1.143
Transcription factors associated with Fli1:
| Gene Symbol | Entrez ID | Gene Name |
|---|---|---|
| Fli1 | ENSMUSG00000016087.7 | Fli1 |
Activity-expression correlation:
| Gene Symbol | Promoter | Pearson corr. coef. | P-value | Plot |
|---|---|---|---|---|
| Fli1 | mm10_v2_chr9_-_32541589_32541602 | -0.44 | 1.0e-02 | Click! |

Top targets:
Gene overrepresentation in biological_process category:
| Log-likelihood per target | Total log-likelihood | Term | Description |
|---|---|---|---|
| 4.4 | 13.1 | GO:0002302 | CD8-positive, alpha-beta T cell differentiation involved in immune response(GO:0002302) |
| 1.8 | 39.8 | GO:0048268 | clathrin coat assembly(GO:0048268) |
| 1.0 | 3.9 | GO:1901491 | negative regulation of lymphangiogenesis(GO:1901491) |
| 0.9 | 10.4 | GO:0010650 | positive regulation of cell communication by electrical coupling(GO:0010650) positive regulation of membrane depolarization during cardiac muscle cell action potential(GO:1900827) |
| 0.9 | 3.6 | GO:0090024 | negative regulation of granulocyte chemotaxis(GO:0071623) negative regulation of neutrophil chemotaxis(GO:0090024) negative regulation of neutrophil migration(GO:1902623) |
| 0.9 | 10.2 | GO:0021942 | radial glia guided migration of Purkinje cell(GO:0021942) |
| 0.6 | 3.8 | GO:1903056 | regulation of lens fiber cell differentiation(GO:1902746) positive regulation of lens fiber cell differentiation(GO:1902748) regulation of melanosome organization(GO:1903056) |
| 0.5 | 4.6 | GO:0016198 | axon choice point recognition(GO:0016198) |
| 0.5 | 5.1 | GO:0032096 | negative regulation of response to food(GO:0032096) negative regulation of appetite(GO:0032099) |
| 0.3 | 1.0 | GO:1902528 | regulation of protein linear polyubiquitination(GO:1902528) positive regulation of protein linear polyubiquitination(GO:1902530) |
| 0.3 | 5.9 | GO:0045838 | positive regulation of membrane potential(GO:0045838) |
| 0.2 | 2.8 | GO:0019433 | triglyceride catabolic process(GO:0019433) |
| 0.2 | 4.2 | GO:0007095 | mitotic G2 DNA damage checkpoint(GO:0007095) |
| 0.2 | 0.6 | GO:0034287 | detection of carbohydrate stimulus(GO:0009730) detection of hexose stimulus(GO:0009732) detection of monosaccharide stimulus(GO:0034287) detection of glucose(GO:0051594) |
| 0.2 | 13.5 | GO:0042147 | retrograde transport, endosome to Golgi(GO:0042147) |
| 0.2 | 2.0 | GO:1901898 | negative regulation of relaxation of muscle(GO:1901078) regulation of cell communication by electrical coupling involved in cardiac conduction(GO:1901844) negative regulation of relaxation of cardiac muscle(GO:1901898) |
| 0.1 | 0.8 | GO:0034587 | piRNA metabolic process(GO:0034587) |
| 0.1 | 0.6 | GO:0042117 | monocyte activation(GO:0042117) |
| 0.1 | 0.9 | GO:0042518 | negative regulation of tyrosine phosphorylation of Stat3 protein(GO:0042518) |
| 0.1 | 9.8 | GO:0010923 | negative regulation of phosphatase activity(GO:0010923) |
| 0.1 | 0.8 | GO:0007342 | fusion of sperm to egg plasma membrane(GO:0007342) |
| 0.1 | 5.1 | GO:2001222 | regulation of neuron migration(GO:2001222) |
| 0.1 | 0.7 | GO:0001867 | complement activation, lectin pathway(GO:0001867) |
| 0.1 | 0.6 | GO:1901096 | regulation of autophagosome maturation(GO:1901096) |
| 0.1 | 0.6 | GO:0032483 | regulation of Rab protein signal transduction(GO:0032483) |
| 0.1 | 1.4 | GO:0046069 | cGMP catabolic process(GO:0046069) |
| 0.1 | 2.4 | GO:0015991 | energy coupled proton transmembrane transport, against electrochemical gradient(GO:0015988) ATP hydrolysis coupled proton transport(GO:0015991) ATP hydrolysis coupled transmembrane transport(GO:0090662) |
| 0.1 | 0.3 | GO:0015786 | UDP-glucose transport(GO:0015786) |
| 0.1 | 1.7 | GO:2000311 | regulation of alpha-amino-3-hydroxy-5-methyl-4-isoxazole propionate selective glutamate receptor activity(GO:2000311) |
| 0.1 | 0.7 | GO:1904707 | positive regulation of vascular smooth muscle cell proliferation(GO:1904707) |
| 0.1 | 0.2 | GO:0071336 | lung growth(GO:0060437) positive regulation of fat cell proliferation(GO:0070346) regulation of hair follicle cell proliferation(GO:0071336) positive regulation of hair follicle cell proliferation(GO:0071338) |
| 0.1 | 6.8 | GO:0008277 | regulation of G-protein coupled receptor protein signaling pathway(GO:0008277) |
| 0.1 | 0.5 | GO:0051152 | positive regulation of smooth muscle cell differentiation(GO:0051152) |
| 0.1 | 2.2 | GO:0090162 | establishment of epithelial cell polarity(GO:0090162) |
| 0.0 | 1.7 | GO:0033014 | porphyrin-containing compound biosynthetic process(GO:0006779) tetrapyrrole biosynthetic process(GO:0033014) |
| 0.0 | 3.9 | GO:0007631 | feeding behavior(GO:0007631) |
| 0.0 | 0.1 | GO:0043973 | histone H3-K4 acetylation(GO:0043973) |
| 0.0 | 0.3 | GO:0042940 | D-amino acid transport(GO:0042940) |
| 0.0 | 0.1 | GO:0048211 | Golgi vesicle docking(GO:0048211) |
| 0.0 | 0.9 | GO:0006914 | autophagy(GO:0006914) |
| 0.0 | 2.3 | GO:0006821 | chloride transport(GO:0006821) |
| 0.0 | 1.3 | GO:0070936 | protein K48-linked ubiquitination(GO:0070936) |
| 0.0 | 0.1 | GO:0042769 | DNA damage response, detection of DNA damage(GO:0042769) |
| 0.0 | 0.1 | GO:0040016 | embryonic cleavage(GO:0040016) |
| 0.0 | 0.7 | GO:0043388 | positive regulation of DNA binding(GO:0043388) |
| 0.0 | 0.5 | GO:0006890 | retrograde vesicle-mediated transport, Golgi to ER(GO:0006890) |
| 0.0 | 0.6 | GO:0045670 | regulation of osteoclast differentiation(GO:0045670) |
| 0.0 | 1.1 | GO:0031532 | actin cytoskeleton reorganization(GO:0031532) |
| 0.0 | 1.1 | GO:0016579 | protein deubiquitination(GO:0016579) |
| 0.0 | 0.4 | GO:0000184 | nuclear-transcribed mRNA catabolic process, nonsense-mediated decay(GO:0000184) |
Gene overrepresentation in cellular_component category:
| Log-likelihood per target | Total log-likelihood | Term | Description |
|---|---|---|---|
| 1.1 | 6.3 | GO:0044308 | axonal spine(GO:0044308) |
| 0.6 | 12.1 | GO:0014731 | spectrin-associated cytoskeleton(GO:0014731) |
| 0.5 | 6.8 | GO:0044292 | dendrite terminus(GO:0044292) |
| 0.3 | 0.8 | GO:0034667 | integrin alpha3-beta1 complex(GO:0034667) |
| 0.2 | 4.6 | GO:0031527 | filopodium membrane(GO:0031527) |
| 0.2 | 13.5 | GO:0045335 | phagocytic vesicle(GO:0045335) |
| 0.1 | 1.1 | GO:0001520 | outer dense fiber(GO:0001520) |
| 0.1 | 2.4 | GO:0033178 | proton-transporting two-sector ATPase complex, catalytic domain(GO:0033178) |
| 0.1 | 0.7 | GO:1990604 | IRE1-TRAF2-ASK1 complex(GO:1990604) |
| 0.1 | 9.0 | GO:0005913 | cell-cell adherens junction(GO:0005913) |
| 0.1 | 1.0 | GO:0001739 | sex chromatin(GO:0001739) |
| 0.1 | 0.6 | GO:0097197 | tetraspanin-enriched microdomain(GO:0097197) |
| 0.1 | 0.5 | GO:0044300 | cerebellar mossy fiber(GO:0044300) |
| 0.1 | 3.1 | GO:0009925 | basal plasma membrane(GO:0009925) |
| 0.0 | 2.0 | GO:0005891 | voltage-gated calcium channel complex(GO:0005891) |
| 0.0 | 0.6 | GO:0045180 | basal cortex(GO:0045180) |
| 0.0 | 1.7 | GO:0032281 | AMPA glutamate receptor complex(GO:0032281) |
| 0.0 | 42.1 | GO:0031410 | cytoplasmic vesicle(GO:0031410) |
| 0.0 | 0.7 | GO:0000795 | synaptonemal complex(GO:0000795) |
| 0.0 | 3.9 | GO:0031225 | anchored component of membrane(GO:0031225) |
| 0.0 | 2.2 | GO:0005923 | bicellular tight junction(GO:0005923) |
| 0.0 | 0.5 | GO:0071011 | precatalytic spliceosome(GO:0071011) |
| 0.0 | 1.4 | GO:0043204 | perikaryon(GO:0043204) |
| 0.0 | 0.3 | GO:0097440 | apical dendrite(GO:0097440) |
| 0.0 | 0.4 | GO:0030687 | preribosome, large subunit precursor(GO:0030687) |
Gene overrepresentation in molecular_function category:
| Log-likelihood per target | Total log-likelihood | Term | Description |
|---|---|---|---|
| 6.7 | 40.3 | GO:0032051 | clathrin light chain binding(GO:0032051) |
| 1.2 | 3.6 | GO:0004942 | anaphylatoxin receptor activity(GO:0004942) |
| 0.9 | 6.3 | GO:0004971 | AMPA glutamate receptor activity(GO:0004971) |
| 0.8 | 4.6 | GO:0035727 | lysophosphatidic acid binding(GO:0035727) |
| 0.4 | 6.8 | GO:0031681 | G-protein beta-subunit binding(GO:0031681) |
| 0.4 | 19.5 | GO:0045296 | cadherin binding(GO:0045296) |
| 0.3 | 3.5 | GO:0005229 | intracellular calcium activated chloride channel activity(GO:0005229) |
| 0.3 | 2.8 | GO:0004806 | triglyceride lipase activity(GO:0004806) |
| 0.2 | 13.5 | GO:0019003 | GDP binding(GO:0019003) |
| 0.2 | 13.2 | GO:0001102 | RNA polymerase II activating transcription factor binding(GO:0001102) |
| 0.2 | 2.4 | GO:0008553 | hydrogen-exporting ATPase activity, phosphorylative mechanism(GO:0008553) |
| 0.2 | 0.7 | GO:0031800 | type 3 metabotropic glutamate receptor binding(GO:0031800) |
| 0.1 | 3.8 | GO:0070412 | R-SMAD binding(GO:0070412) |
| 0.1 | 1.9 | GO:0008599 | protein phosphatase type 1 regulator activity(GO:0008599) |
| 0.1 | 0.6 | GO:0004340 | glucokinase activity(GO:0004340) hexokinase activity(GO:0004396) |
| 0.1 | 1.7 | GO:0008093 | cytoskeletal adaptor activity(GO:0008093) |
| 0.1 | 1.4 | GO:0030553 | cGMP binding(GO:0030553) |
| 0.1 | 10.4 | GO:0017137 | Rab GTPase binding(GO:0017137) |
| 0.1 | 0.7 | GO:0001846 | opsonin binding(GO:0001846) |
| 0.0 | 0.2 | GO:0005111 | type 2 fibroblast growth factor receptor binding(GO:0005111) |
| 0.0 | 1.7 | GO:0005245 | voltage-gated calcium channel activity(GO:0005245) |
| 0.0 | 0.4 | GO:0043008 | ATP-dependent protein binding(GO:0043008) |
| 0.0 | 2.8 | GO:0005249 | voltage-gated potassium channel activity(GO:0005249) |
| 0.0 | 1.3 | GO:0061631 | ubiquitin conjugating enzyme activity(GO:0061631) |
| 0.0 | 0.7 | GO:0005528 | macrolide binding(GO:0005527) FK506 binding(GO:0005528) |
| 0.0 | 0.5 | GO:0050253 | prenylcysteine methylesterase activity(GO:0010296) 1-oxa-2-oxocycloheptane lactonase activity(GO:0018731) sulfolactone hydrolase activity(GO:0018732) butyrolactone hydrolase activity(GO:0018734) endosulfan lactone lactonase activity(GO:0034892) L-ascorbate 6-phosphate lactonase activity(GO:0035460) Ser-tRNA(Thr) hydrolase activity(GO:0043905) Ala-tRNA(Pro) hydrolase activity(GO:0043906) Cys-tRNA(Pro) hydrolase activity(GO:0043907) Ser(Gly)-tRNA(Ala) hydrolase activity(GO:0043908) all-trans-retinyl-palmitate hydrolase, all-trans-retinol forming activity(GO:0047376) retinyl-palmitate esterase activity(GO:0050253) mannosyl-oligosaccharide 1,6-alpha-mannosidase activity(GO:0052767) mannosyl-oligosaccharide 1,3-alpha-mannosidase activity(GO:0052768) methyl indole-3-acetate esterase activity(GO:0080030) methyl salicylate esterase activity(GO:0080031) methyl jasmonate esterase activity(GO:0080032) |
| 0.0 | 0.8 | GO:0043236 | laminin binding(GO:0043236) |
| 0.0 | 3.3 | GO:0004702 | receptor signaling protein serine/threonine kinase activity(GO:0004702) |
| 0.0 | 0.9 | GO:0005086 | ARF guanyl-nucleotide exchange factor activity(GO:0005086) |
| 0.0 | 1.0 | GO:0043027 | cysteine-type endopeptidase inhibitor activity involved in apoptotic process(GO:0043027) |
| 0.0 | 0.9 | GO:0004120 | calmodulin-dependent cyclic-nucleotide phosphodiesterase activity(GO:0004117) cGMP-stimulated cyclic-nucleotide phosphodiesterase activity(GO:0004118) cGMP-inhibited cyclic-nucleotide phosphodiesterase activity(GO:0004119) photoreceptor cyclic-nucleotide phosphodiesterase activity(GO:0004120) 7,8-dihydro-D-neopterin 2',3'-cyclic phosphate phosphodiesterase activity(GO:0044688) inositol phosphosphingolipid phospholipase activity(GO:0052712) inositol phosphorylceramide phospholipase activity(GO:0052713) mannosyl-inositol phosphorylceramide phospholipase activity(GO:0052714) mannosyl-diinositol phosphorylceramide phospholipase activity(GO:0052715) |
| 0.0 | 0.1 | GO:0055131 | C3HC4-type RING finger domain binding(GO:0055131) |
| 0.0 | 0.7 | GO:0005112 | Notch binding(GO:0005112) |
| 0.0 | 0.1 | GO:0004614 | phosphoglucomutase activity(GO:0004614) |
| 0.0 | 0.3 | GO:0022889 | L-serine transmembrane transporter activity(GO:0015194) serine transmembrane transporter activity(GO:0022889) |
| 0.0 | 1.2 | GO:0004722 | protein serine/threonine phosphatase activity(GO:0004722) |
| 0.0 | 0.6 | GO:0042169 | SH2 domain binding(GO:0042169) |
| 0.0 | 0.5 | GO:0003785 | actin monomer binding(GO:0003785) |
| 0.0 | 0.6 | GO:0035035 | histone acetyltransferase binding(GO:0035035) |
| 0.0 | 0.2 | GO:0097027 | ubiquitin-protein transferase activator activity(GO:0097027) |
| 0.0 | 0.9 | GO:0042054 | histone methyltransferase activity(GO:0042054) |
| 0.0 | 0.3 | GO:0017161 | phosphohistidine phosphatase activity(GO:0008969) inositol-1,3,4-trisphosphate 4-phosphatase activity(GO:0017161) NADP phosphatase activity(GO:0019178) 5-amino-6-(5-phosphoribitylamino)uracil phosphatase activity(GO:0043726) phosphatidylinositol-3,5-bisphosphate 5-phosphatase activity(GO:0043813) inositol-1,3,4,5,6-pentakisphosphate 1-phosphatase activity(GO:0052825) inositol-3,4-bisphosphate 4-phosphatase activity(GO:0052828) inositol-1,3,4-trisphosphate 1-phosphatase activity(GO:0052829) inositol-1,3,4,6-tetrakisphosphate 6-phosphatase activity(GO:0052830) inositol-1,3,4,6-tetrakisphosphate 1-phosphatase activity(GO:0052831) phosphatidylinositol-1,4,5-trisphosphate 5-phosphatase activity(GO:0052867) IDP phosphatase activity(GO:1990003) |
| 0.0 | 1.3 | GO:0004843 | thiol-dependent ubiquitin-specific protease activity(GO:0004843) |
| 0.0 | 0.2 | GO:0008601 | protein phosphatase type 2A regulator activity(GO:0008601) |
| 0.0 | 0.3 | GO:0008757 | S-adenosylmethionine-dependent methyltransferase activity(GO:0008757) |