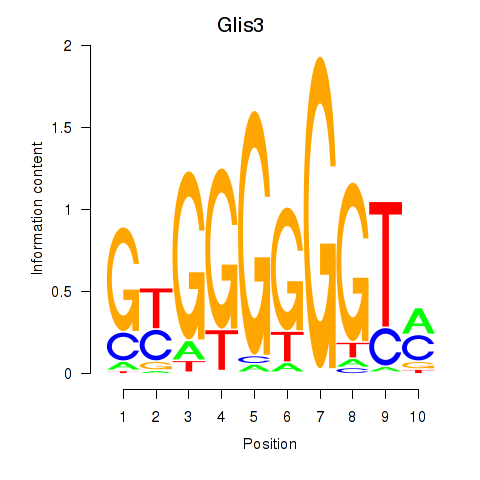
| 1.1 |
4.4 |
GO:0042414 |
epinephrine metabolic process(GO:0042414) |
| 1.0 |
9.1 |
GO:0010587 |
miRNA catabolic process(GO:0010587) |
| 1.0 |
3.9 |
GO:0097374 |
sensory neuron axon guidance(GO:0097374) |
| 0.8 |
4.2 |
GO:0070345 |
negative regulation of fat cell proliferation(GO:0070345) |
| 0.8 |
2.3 |
GO:0070172 |
oculomotor nerve development(GO:0021557) positive regulation of tooth mineralization(GO:0070172) |
| 0.6 |
2.9 |
GO:0048133 |
NK T cell differentiation(GO:0001865) germ-line stem cell division(GO:0042078) male germ-line stem cell asymmetric division(GO:0048133) regulation of NK T cell differentiation(GO:0051136) positive regulation of NK T cell differentiation(GO:0051138) germline stem cell asymmetric division(GO:0098728) |
| 0.6 |
1.7 |
GO:0003032 |
detection of oxygen(GO:0003032) |
| 0.5 |
2.2 |
GO:0051305 |
chromosome movement towards spindle pole(GO:0051305) |
| 0.5 |
1.5 |
GO:0071649 |
regulation of chemokine (C-C motif) ligand 5 production(GO:0071649) |
| 0.4 |
1.7 |
GO:1903265 |
positive regulation of tumor necrosis factor-mediated signaling pathway(GO:1903265) |
| 0.4 |
1.2 |
GO:0071336 |
lung growth(GO:0060437) positive regulation of fat cell proliferation(GO:0070346) regulation of hair follicle cell proliferation(GO:0071336) positive regulation of hair follicle cell proliferation(GO:0071338) |
| 0.4 |
1.1 |
GO:0060010 |
Sertoli cell fate commitment(GO:0060010) |
| 0.3 |
2.7 |
GO:0038028 |
insulin receptor signaling pathway via phosphatidylinositol 3-kinase(GO:0038028) |
| 0.3 |
1.0 |
GO:0035574 |
histone H4-K20 demethylation(GO:0035574) |
| 0.3 |
8.8 |
GO:0035115 |
embryonic forelimb morphogenesis(GO:0035115) |
| 0.3 |
1.0 |
GO:0072070 |
establishment or maintenance of polarity of embryonic epithelium(GO:0016332) trachea cartilage morphogenesis(GO:0060535) loop of Henle development(GO:0072070) metanephric loop of Henle development(GO:0072236) |
| 0.3 |
1.0 |
GO:0072718 |
response to cisplatin(GO:0072718) |
| 0.3 |
1.5 |
GO:0021993 |
initiation of neural tube closure(GO:0021993) |
| 0.3 |
5.0 |
GO:0021521 |
ventral spinal cord interneuron specification(GO:0021521) cell fate specification involved in pattern specification(GO:0060573) |
| 0.3 |
1.0 |
GO:0003431 |
growth plate cartilage chondrocyte development(GO:0003431) |
| 0.2 |
1.6 |
GO:1903377 |
negative regulation of oxidative stress-induced neuron intrinsic apoptotic signaling pathway(GO:1903377) |
| 0.2 |
4.1 |
GO:0038092 |
nodal signaling pathway(GO:0038092) |
| 0.2 |
1.8 |
GO:0006362 |
transcription elongation from RNA polymerase I promoter(GO:0006362) |
| 0.2 |
1.2 |
GO:0032346 |
positive regulation of aldosterone metabolic process(GO:0032346) positive regulation of aldosterone biosynthetic process(GO:0032349) |
| 0.2 |
1.6 |
GO:0033601 |
positive regulation of mammary gland epithelial cell proliferation(GO:0033601) regulation of wound healing, spreading of epidermal cells(GO:1903689) |
| 0.2 |
0.6 |
GO:0033128 |
positive regulation of reciprocal meiotic recombination(GO:0010845) negative regulation of histone phosphorylation(GO:0033128) |
| 0.2 |
0.8 |
GO:0043973 |
histone H3-K4 acetylation(GO:0043973) |
| 0.2 |
1.3 |
GO:0043353 |
enucleate erythrocyte differentiation(GO:0043353) hydrogen sulfide biosynthetic process(GO:0070814) |
| 0.2 |
0.5 |
GO:0035519 |
protein K29-linked ubiquitination(GO:0035519) |
| 0.2 |
0.5 |
GO:0003100 |
angiotensin mediated vasoconstriction involved in regulation of systemic arterial blood pressure(GO:0001998) regulation of blood vessel size by renin-angiotensin(GO:0002034) renal control of peripheral vascular resistance involved in regulation of systemic arterial blood pressure(GO:0003072) regulation of systemic arterial blood pressure by endothelin(GO:0003100) beta selection(GO:0043366) |
| 0.2 |
1.7 |
GO:0051574 |
positive regulation of histone H3-K9 methylation(GO:0051574) |
| 0.2 |
0.5 |
GO:0003360 |
brainstem development(GO:0003360) |
| 0.2 |
1.0 |
GO:0006452 |
translational frameshifting(GO:0006452) positive regulation of translational termination(GO:0045905) |
| 0.1 |
5.0 |
GO:0030513 |
positive regulation of BMP signaling pathway(GO:0030513) |
| 0.1 |
1.8 |
GO:0035721 |
intraciliary retrograde transport(GO:0035721) |
| 0.1 |
2.6 |
GO:0051602 |
response to electrical stimulus(GO:0051602) |
| 0.1 |
1.0 |
GO:0060665 |
regulation of branching involved in salivary gland morphogenesis by mesenchymal-epithelial signaling(GO:0060665) |
| 0.1 |
0.7 |
GO:0001771 |
immunological synapse formation(GO:0001771) |
| 0.1 |
0.4 |
GO:0046898 |
response to cycloheximide(GO:0046898) |
| 0.1 |
0.6 |
GO:0007296 |
vitellogenesis(GO:0007296) |
| 0.1 |
0.4 |
GO:0030240 |
skeletal muscle thin filament assembly(GO:0030240) |
| 0.1 |
0.4 |
GO:1902775 |
mitochondrial large ribosomal subunit assembly(GO:1902775) |
| 0.1 |
0.9 |
GO:0032780 |
negative regulation of ATPase activity(GO:0032780) |
| 0.1 |
0.3 |
GO:0051151 |
negative regulation of smooth muscle cell differentiation(GO:0051151) |
| 0.1 |
1.1 |
GO:0002467 |
germinal center formation(GO:0002467) |
| 0.1 |
1.3 |
GO:0033235 |
positive regulation of protein sumoylation(GO:0033235) |
| 0.1 |
0.2 |
GO:0060903 |
positive regulation of meiosis I(GO:0060903) |
| 0.0 |
1.5 |
GO:0046677 |
response to antibiotic(GO:0046677) |
| 0.0 |
0.9 |
GO:2000001 |
regulation of DNA damage checkpoint(GO:2000001) |
| 0.0 |
1.9 |
GO:0060325 |
face morphogenesis(GO:0060325) |
| 0.0 |
2.5 |
GO:0002209 |
behavioral fear response(GO:0001662) behavioral defense response(GO:0002209) |
| 0.0 |
0.7 |
GO:0043984 |
histone H4-K16 acetylation(GO:0043984) |
| 0.0 |
0.9 |
GO:0071385 |
cellular response to glucocorticoid stimulus(GO:0071385) |
| 0.0 |
0.3 |
GO:0070389 |
chaperone cofactor-dependent protein refolding(GO:0070389) |
| 0.0 |
0.4 |
GO:2001224 |
positive regulation of neuron migration(GO:2001224) |
| 0.0 |
1.4 |
GO:1902017 |
regulation of cilium assembly(GO:1902017) |
| 0.0 |
0.5 |
GO:0010667 |
negative regulation of cardiac muscle cell apoptotic process(GO:0010667) |
| 0.0 |
1.3 |
GO:0022904 |
respiratory electron transport chain(GO:0022904) |
| 0.0 |
0.6 |
GO:0035066 |
positive regulation of histone acetylation(GO:0035066) |
| 0.0 |
0.3 |
GO:0090190 |
positive regulation of mesonephros development(GO:0061213) positive regulation of branching involved in ureteric bud morphogenesis(GO:0090190) |
| 0.0 |
0.8 |
GO:0010762 |
regulation of fibroblast migration(GO:0010762) |
| 0.0 |
1.2 |
GO:0008584 |
male gonad development(GO:0008584) development of primary male sexual characteristics(GO:0046546) |
| 0.0 |
0.2 |
GO:0071577 |
zinc II ion transmembrane transport(GO:0071577) |
| 0.0 |
1.2 |
GO:0098792 |
xenophagy(GO:0098792) |
| 0.0 |
1.3 |
GO:0008203 |
cholesterol metabolic process(GO:0008203) |


