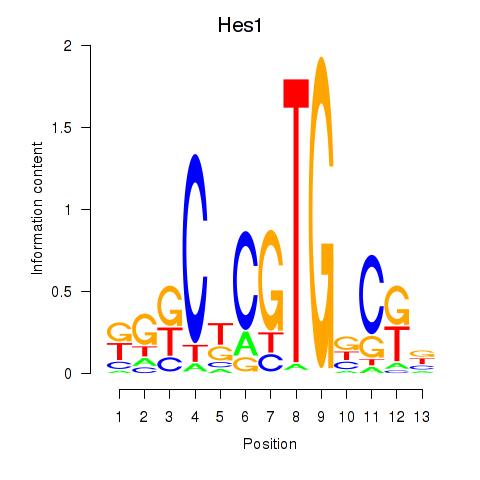
Motif ID: Hes1
Z-value: 1.087
Transcription factors associated with Hes1:
| Gene Symbol | Entrez ID | Gene Name |
|---|---|---|
| Hes1 | ENSMUSG00000022528.7 | Hes1 |
Activity-expression correlation:
| Gene Symbol | Promoter | Pearson corr. coef. | P-value | Plot |
|---|---|---|---|---|
| Hes1 | mm10_v2_chr16_+_30065333_30065351 | 0.83 | 3.1e-09 | Click! |

Top targets:
Gene overrepresentation in biological_process category:
| Log-likelihood per target | Total log-likelihood | Term | Description |
|---|---|---|---|
| 2.4 | 21.7 | GO:0045719 | negative regulation of glycogen biosynthetic process(GO:0045719) negative regulation of glycogen metabolic process(GO:0070874) |
| 0.8 | 3.2 | GO:1904565 | response to 1-oleoyl-sn-glycerol 3-phosphate(GO:1904565) cellular response to 1-oleoyl-sn-glycerol 3-phosphate(GO:1904566) |
| 0.8 | 2.4 | GO:0018298 | protein-chromophore linkage(GO:0018298) |
| 0.7 | 2.8 | GO:0003360 | brainstem development(GO:0003360) |
| 0.7 | 2.8 | GO:2000313 | fibroblast growth factor receptor signaling pathway involved in neural plate anterior/posterior pattern formation(GO:0060825) regulation of fibroblast growth factor receptor signaling pathway involved in neural plate anterior/posterior pattern formation(GO:2000313) |
| 0.7 | 2.0 | GO:0009177 | deoxyribonucleoside monophosphate biosynthetic process(GO:0009157) pyrimidine deoxyribonucleoside monophosphate biosynthetic process(GO:0009177) |
| 0.5 | 1.6 | GO:2000974 | negative regulation of pro-B cell differentiation(GO:2000974) |
| 0.5 | 3.3 | GO:0035087 | siRNA loading onto RISC involved in RNA interference(GO:0035087) |
| 0.5 | 1.6 | GO:0003195 | tricuspid valve development(GO:0003175) tricuspid valve morphogenesis(GO:0003186) tricuspid valve formation(GO:0003195) ascending aorta development(GO:0035905) ascending aorta morphogenesis(GO:0035910) |
| 0.5 | 2.8 | GO:0019336 | phenol-containing compound catabolic process(GO:0019336) |
| 0.5 | 1.4 | GO:0014738 | regulation of muscle hyperplasia(GO:0014738) muscle hyperplasia(GO:0014900) |
| 0.4 | 2.2 | GO:0060066 | oviduct development(GO:0060066) |
| 0.4 | 2.1 | GO:1900085 | negative regulation of peptidyl-tyrosine autophosphorylation(GO:1900085) |
| 0.4 | 2.6 | GO:0001842 | neural fold formation(GO:0001842) |
| 0.3 | 1.0 | GO:0070602 | regulation of centromeric sister chromatid cohesion(GO:0070602) |
| 0.3 | 1.8 | GO:0006452 | translational frameshifting(GO:0006452) positive regulation of translational termination(GO:0045905) |
| 0.3 | 0.9 | GO:0060399 | positive regulation of growth hormone receptor signaling pathway(GO:0060399) |
| 0.3 | 0.9 | GO:0021577 | hindbrain structural organization(GO:0021577) cerebellum structural organization(GO:0021589) |
| 0.3 | 0.8 | GO:0009174 | UMP biosynthetic process(GO:0006222) pyrimidine ribonucleoside monophosphate metabolic process(GO:0009173) pyrimidine ribonucleoside monophosphate biosynthetic process(GO:0009174) UMP metabolic process(GO:0046049) |
| 0.3 | 3.7 | GO:0060159 | regulation of dopamine receptor signaling pathway(GO:0060159) |
| 0.3 | 1.4 | GO:0048133 | NK T cell differentiation(GO:0001865) germ-line stem cell division(GO:0042078) male germ-line stem cell asymmetric division(GO:0048133) regulation of NK T cell differentiation(GO:0051136) positive regulation of NK T cell differentiation(GO:0051138) germline stem cell asymmetric division(GO:0098728) |
| 0.3 | 1.7 | GO:0006384 | transcription initiation from RNA polymerase III promoter(GO:0006384) |
| 0.3 | 1.4 | GO:0051387 | negative regulation of neurotrophin TRK receptor signaling pathway(GO:0051387) |
| 0.3 | 1.4 | GO:2000255 | negative regulation of male germ cell proliferation(GO:2000255) |
| 0.3 | 1.6 | GO:0034587 | piRNA metabolic process(GO:0034587) |
| 0.3 | 2.6 | GO:0030388 | fructose 1,6-bisphosphate metabolic process(GO:0030388) |
| 0.3 | 0.5 | GO:0075525 | viral translational termination-reinitiation(GO:0075525) |
| 0.2 | 1.5 | GO:0042535 | positive regulation of tumor necrosis factor biosynthetic process(GO:0042535) |
| 0.2 | 0.7 | GO:0033122 | regulation of purine nucleotide catabolic process(GO:0033121) negative regulation of purine nucleotide catabolic process(GO:0033122) regulation of cyclic-nucleotide phosphodiesterase activity(GO:0051342) negative regulation of cyclic-nucleotide phosphodiesterase activity(GO:0051344) |
| 0.2 | 1.2 | GO:0070345 | negative regulation of fat cell proliferation(GO:0070345) |
| 0.2 | 0.7 | GO:0006011 | UDP-glucose metabolic process(GO:0006011) glucose 1-phosphate metabolic process(GO:0019255) |
| 0.2 | 0.5 | GO:0000720 | pyrimidine dimer repair by nucleotide-excision repair(GO:0000720) |
| 0.2 | 0.9 | GO:0060032 | notochord regression(GO:0060032) |
| 0.2 | 1.0 | GO:0072757 | cellular response to camptothecin(GO:0072757) |
| 0.2 | 1.7 | GO:0035092 | sperm chromatin condensation(GO:0035092) |
| 0.2 | 1.6 | GO:0000050 | urea cycle(GO:0000050) urea metabolic process(GO:0019627) |
| 0.2 | 0.6 | GO:0071929 | alpha-tubulin acetylation(GO:0071929) |
| 0.2 | 1.0 | GO:0089700 | protein kinase D signaling(GO:0089700) |
| 0.2 | 0.6 | GO:2000195 | negative regulation of female gonad development(GO:2000195) |
| 0.2 | 0.8 | GO:0006478 | peptidyl-tyrosine sulfation(GO:0006478) |
| 0.2 | 1.4 | GO:0051004 | regulation of lipoprotein lipase activity(GO:0051004) |
| 0.2 | 1.4 | GO:0021913 | regulation of transcription from RNA polymerase II promoter involved in spinal cord motor neuron fate specification(GO:0021912) regulation of transcription from RNA polymerase II promoter involved in ventral spinal cord interneuron specification(GO:0021913) |
| 0.2 | 1.3 | GO:0061484 | hematopoietic stem cell homeostasis(GO:0061484) |
| 0.2 | 2.5 | GO:0045647 | negative regulation of erythrocyte differentiation(GO:0045647) |
| 0.2 | 1.7 | GO:0075522 | IRES-dependent viral translational initiation(GO:0075522) |
| 0.2 | 1.8 | GO:0070940 | dephosphorylation of RNA polymerase II C-terminal domain(GO:0070940) |
| 0.2 | 1.3 | GO:0030174 | regulation of DNA-dependent DNA replication initiation(GO:0030174) mitotic DNA replication checkpoint(GO:0033314) |
| 0.2 | 0.5 | GO:0072554 | blood vessel lumenization(GO:0072554) |
| 0.2 | 0.5 | GO:0046959 | habituation(GO:0046959) |
| 0.2 | 0.9 | GO:2000491 | positive regulation of hepatic stellate cell activation(GO:2000491) |
| 0.2 | 0.8 | GO:0090234 | cellular response to testosterone stimulus(GO:0071394) regulation of kinetochore assembly(GO:0090234) |
| 0.2 | 0.6 | GO:0006776 | vitamin A metabolic process(GO:0006776) |
| 0.1 | 1.1 | GO:0007016 | cytoskeletal anchoring at plasma membrane(GO:0007016) |
| 0.1 | 0.4 | GO:2000501 | natural killer cell chemotaxis(GO:0035747) regulation of natural killer cell chemotaxis(GO:2000501) |
| 0.1 | 0.4 | GO:0034035 | purine ribonucleoside bisphosphate metabolic process(GO:0034035) |
| 0.1 | 0.7 | GO:0045578 | negative regulation of B cell differentiation(GO:0045578) |
| 0.1 | 0.4 | GO:0034392 | negative regulation of smooth muscle cell apoptotic process(GO:0034392) |
| 0.1 | 1.5 | GO:0019262 | N-acetylneuraminate catabolic process(GO:0019262) |
| 0.1 | 1.7 | GO:0010388 | cullin deneddylation(GO:0010388) |
| 0.1 | 0.8 | GO:0032534 | regulation of microvillus assembly(GO:0032534) |
| 0.1 | 1.2 | GO:0043568 | positive regulation of insulin-like growth factor receptor signaling pathway(GO:0043568) |
| 0.1 | 0.4 | GO:1903265 | positive regulation of tumor necrosis factor-mediated signaling pathway(GO:1903265) |
| 0.1 | 0.8 | GO:0035437 | maintenance of protein localization in endoplasmic reticulum(GO:0035437) |
| 0.1 | 1.4 | GO:0006107 | oxaloacetate metabolic process(GO:0006107) |
| 0.1 | 1.5 | GO:0010225 | response to UV-C(GO:0010225) |
| 0.1 | 0.4 | GO:0045617 | negative regulation of keratinocyte differentiation(GO:0045617) |
| 0.1 | 2.0 | GO:0038092 | nodal signaling pathway(GO:0038092) |
| 0.1 | 1.4 | GO:0007190 | activation of adenylate cyclase activity(GO:0007190) |
| 0.1 | 2.0 | GO:0035873 | lactate transport(GO:0015727) lactate transmembrane transport(GO:0035873) plasma membrane lactate transport(GO:0035879) |
| 0.1 | 0.5 | GO:2001270 | regulation of cysteine-type endopeptidase activity involved in execution phase of apoptosis(GO:2001270) |
| 0.1 | 1.0 | GO:0019368 | fatty acid elongation, saturated fatty acid(GO:0019367) fatty acid elongation, unsaturated fatty acid(GO:0019368) fatty acid elongation, monounsaturated fatty acid(GO:0034625) fatty acid elongation, polyunsaturated fatty acid(GO:0034626) |
| 0.1 | 0.3 | GO:0046368 | GDP-L-fucose metabolic process(GO:0046368) |
| 0.1 | 0.3 | GO:1901301 | regulation of cargo loading into COPII-coated vesicle(GO:1901301) |
| 0.1 | 0.2 | GO:0032079 | positive regulation of endodeoxyribonuclease activity(GO:0032079) |
| 0.1 | 0.2 | GO:0006545 | glycine biosynthetic process(GO:0006545) |
| 0.1 | 1.5 | GO:0071260 | cellular response to mechanical stimulus(GO:0071260) |
| 0.1 | 0.2 | GO:1901675 | negative regulation of histone H3-K27 acetylation(GO:1901675) |
| 0.1 | 0.3 | GO:0045039 | protein import into mitochondrial inner membrane(GO:0045039) |
| 0.1 | 0.2 | GO:0006449 | regulation of translational termination(GO:0006449) |
| 0.1 | 0.8 | GO:0033182 | regulation of histone ubiquitination(GO:0033182) |
| 0.1 | 0.3 | GO:0035521 | monoubiquitinated histone deubiquitination(GO:0035521) monoubiquitinated histone H2A deubiquitination(GO:0035522) |
| 0.1 | 0.4 | GO:0015670 | carbon dioxide transport(GO:0015670) |
| 0.1 | 0.6 | GO:0034720 | histone H3-K4 demethylation(GO:0034720) |
| 0.1 | 1.8 | GO:0000413 | protein peptidyl-prolyl isomerization(GO:0000413) |
| 0.1 | 1.6 | GO:0009409 | response to cold(GO:0009409) |
| 0.1 | 1.5 | GO:0045672 | positive regulation of osteoclast differentiation(GO:0045672) |
| 0.1 | 0.9 | GO:0006614 | SRP-dependent cotranslational protein targeting to membrane(GO:0006614) |
| 0.1 | 2.0 | GO:0030513 | positive regulation of BMP signaling pathway(GO:0030513) |
| 0.1 | 1.8 | GO:0042149 | cellular response to glucose starvation(GO:0042149) |
| 0.1 | 0.4 | GO:0015015 | heparan sulfate proteoglycan biosynthetic process, enzymatic modification(GO:0015015) |
| 0.1 | 0.8 | GO:0035563 | positive regulation of chromatin binding(GO:0035563) |
| 0.1 | 0.1 | GO:0072034 | renal vesicle induction(GO:0072034) |
| 0.1 | 0.6 | GO:0071763 | nuclear membrane organization(GO:0071763) |
| 0.1 | 1.3 | GO:0045909 | positive regulation of vasodilation(GO:0045909) |
| 0.1 | 0.5 | GO:2000780 | negative regulation of DNA repair(GO:0045738) negative regulation of double-strand break repair(GO:2000780) |
| 0.1 | 0.2 | GO:0070459 | prolactin secretion(GO:0070459) |
| 0.1 | 0.7 | GO:0046697 | decidualization(GO:0046697) |
| 0.1 | 1.0 | GO:0031065 | positive regulation of histone deacetylation(GO:0031065) |
| 0.1 | 1.0 | GO:0030252 | growth hormone secretion(GO:0030252) |
| 0.1 | 2.3 | GO:0060325 | face morphogenesis(GO:0060325) |
| 0.0 | 1.5 | GO:0006879 | cellular iron ion homeostasis(GO:0006879) |
| 0.0 | 0.3 | GO:0006105 | succinate metabolic process(GO:0006105) |
| 0.0 | 0.5 | GO:0071578 | zinc II ion transmembrane import(GO:0071578) |
| 0.0 | 0.2 | GO:1904469 | MyD88-independent toll-like receptor signaling pathway(GO:0002756) positive regulation of tumor necrosis factor secretion(GO:1904469) |
| 0.0 | 0.5 | GO:0015677 | copper ion import(GO:0015677) |
| 0.0 | 0.3 | GO:0060017 | parathyroid gland development(GO:0060017) |
| 0.0 | 0.1 | GO:0044791 | modulation by host of viral release from host cell(GO:0044789) positive regulation by host of viral release from host cell(GO:0044791) |
| 0.0 | 0.9 | GO:0035067 | negative regulation of histone acetylation(GO:0035067) |
| 0.0 | 0.5 | GO:0039703 | viral RNA genome replication(GO:0039694) RNA replication(GO:0039703) |
| 0.0 | 0.5 | GO:1990126 | retrograde transport, endosome to plasma membrane(GO:1990126) |
| 0.0 | 0.7 | GO:0006516 | glycoprotein catabolic process(GO:0006516) |
| 0.0 | 0.4 | GO:0090435 | protein localization to nuclear envelope(GO:0090435) |
| 0.0 | 0.2 | GO:2001032 | regulation of double-strand break repair via nonhomologous end joining(GO:2001032) |
| 0.0 | 0.5 | GO:0090308 | regulation of methylation-dependent chromatin silencing(GO:0090308) |
| 0.0 | 0.7 | GO:0014741 | negative regulation of cardiac muscle hypertrophy(GO:0010614) negative regulation of muscle hypertrophy(GO:0014741) |
| 0.0 | 0.6 | GO:0030574 | collagen catabolic process(GO:0030574) |
| 0.0 | 0.7 | GO:0044381 | glucose import in response to insulin stimulus(GO:0044381) regulation of glucose import in response to insulin stimulus(GO:2001273) |
| 0.0 | 0.3 | GO:2000628 | regulation of miRNA metabolic process(GO:2000628) |
| 0.0 | 0.9 | GO:0032008 | positive regulation of TOR signaling(GO:0032008) |
| 0.0 | 0.5 | GO:0030150 | protein import into mitochondrial matrix(GO:0030150) |
| 0.0 | 0.6 | GO:0051044 | positive regulation of membrane protein ectodomain proteolysis(GO:0051044) |
| 0.0 | 2.1 | GO:0031960 | response to corticosteroid(GO:0031960) response to glucocorticoid(GO:0051384) |
| 0.0 | 0.4 | GO:0006750 | glutathione biosynthetic process(GO:0006750) |
| 0.0 | 0.2 | GO:0016255 | attachment of GPI anchor to protein(GO:0016255) |
| 0.0 | 0.5 | GO:0006515 | misfolded or incompletely synthesized protein catabolic process(GO:0006515) |
| 0.0 | 2.8 | GO:0051028 | mRNA transport(GO:0051028) |
| 0.0 | 0.6 | GO:0036075 | endochondral ossification(GO:0001958) replacement ossification(GO:0036075) |
| 0.0 | 2.4 | GO:0050772 | positive regulation of axonogenesis(GO:0050772) |
| 0.0 | 0.6 | GO:0032011 | ARF protein signal transduction(GO:0032011) regulation of ARF protein signal transduction(GO:0032012) |
| 0.0 | 0.2 | GO:1903025 | regulation of RNA polymerase II regulatory region sequence-specific DNA binding(GO:1903025) |
| 0.0 | 0.1 | GO:0019695 | choline metabolic process(GO:0019695) |
| 0.0 | 0.4 | GO:0034453 | microtubule anchoring(GO:0034453) |
| 0.0 | 0.1 | GO:0048752 | semicircular canal morphogenesis(GO:0048752) |
| 0.0 | 0.9 | GO:0006414 | translational elongation(GO:0006414) |
| 0.0 | 0.8 | GO:0002181 | cytoplasmic translation(GO:0002181) |
| 0.0 | 0.9 | GO:0006661 | phosphatidylinositol biosynthetic process(GO:0006661) |
| 0.0 | 0.4 | GO:0003416 | endochondral bone growth(GO:0003416) |
| 0.0 | 0.4 | GO:2000060 | positive regulation of protein ubiquitination involved in ubiquitin-dependent protein catabolic process(GO:2000060) |
| 0.0 | 0.5 | GO:0071456 | cellular response to hypoxia(GO:0071456) |
| 0.0 | 0.5 | GO:0018279 | protein N-linked glycosylation via asparagine(GO:0018279) |
| 0.0 | 0.7 | GO:0035058 | nonmotile primary cilium assembly(GO:0035058) |
| 0.0 | 0.6 | GO:0032755 | positive regulation of interleukin-6 production(GO:0032755) |
| 0.0 | 0.3 | GO:0006884 | cell volume homeostasis(GO:0006884) |
| 0.0 | 0.6 | GO:0007019 | microtubule depolymerization(GO:0007019) |
| 0.0 | 0.2 | GO:0048671 | negative regulation of collateral sprouting(GO:0048671) |
| 0.0 | 0.1 | GO:0010759 | positive regulation of macrophage chemotaxis(GO:0010759) |
| 0.0 | 0.1 | GO:0006366 | transcription from RNA polymerase II promoter(GO:0006366) |
| 0.0 | 0.7 | GO:0051289 | protein homotetramerization(GO:0051289) |
| 0.0 | 0.1 | GO:0070301 | cellular response to hydrogen peroxide(GO:0070301) |
| 0.0 | 0.7 | GO:0045727 | positive regulation of translation(GO:0045727) |
| 0.0 | 0.3 | GO:0002446 | neutrophil mediated immunity(GO:0002446) |
| 0.0 | 2.6 | GO:0019216 | regulation of lipid metabolic process(GO:0019216) |
| 0.0 | 0.1 | GO:0070389 | chaperone cofactor-dependent protein refolding(GO:0070389) |
Gene overrepresentation in cellular_component category:
| Log-likelihood per target | Total log-likelihood | Term | Description |
|---|---|---|---|
| 0.9 | 2.8 | GO:0097059 | CNTFR-CLCF1 complex(GO:0097059) |
| 0.5 | 1.6 | GO:0036488 | CHOP-C/EBP complex(GO:0036488) |
| 0.5 | 2.6 | GO:0044611 | nuclear pore inner ring(GO:0044611) |
| 0.5 | 1.9 | GO:0090537 | CERF complex(GO:0090537) |
| 0.3 | 2.0 | GO:0000214 | tRNA-intron endonuclease complex(GO:0000214) |
| 0.3 | 0.8 | GO:0031372 | UBC13-MMS2 complex(GO:0031372) |
| 0.2 | 0.7 | GO:0005785 | signal recognition particle receptor complex(GO:0005785) |
| 0.2 | 2.6 | GO:0035686 | sperm fibrous sheath(GO:0035686) |
| 0.2 | 0.9 | GO:1990131 | EGO complex(GO:0034448) Gtr1-Gtr2 GTPase complex(GO:1990131) |
| 0.2 | 1.3 | GO:0070578 | RISC-loading complex(GO:0070578) |
| 0.2 | 1.0 | GO:0000235 | astral microtubule(GO:0000235) |
| 0.2 | 2.2 | GO:0016342 | catenin complex(GO:0016342) |
| 0.2 | 0.8 | GO:0036056 | filtration diaphragm(GO:0036056) slit diaphragm(GO:0036057) |
| 0.2 | 1.4 | GO:0031254 | uropod(GO:0001931) cell trailing edge(GO:0031254) |
| 0.1 | 1.5 | GO:0005642 | annulate lamellae(GO:0005642) |
| 0.1 | 0.4 | GO:0097057 | TRAF2-GSTP1 complex(GO:0097057) |
| 0.1 | 0.9 | GO:0005853 | eukaryotic translation elongation factor 1 complex(GO:0005853) |
| 0.1 | 2.1 | GO:0034098 | VCP-NPL4-UFD1 AAA ATPase complex(GO:0034098) |
| 0.1 | 2.1 | GO:0032156 | septin cytoskeleton(GO:0032156) |
| 0.1 | 0.4 | GO:0035061 | interchromatin granule(GO:0035061) |
| 0.1 | 1.5 | GO:0031011 | Ino80 complex(GO:0031011) |
| 0.1 | 1.7 | GO:0034364 | high-density lipoprotein particle(GO:0034364) |
| 0.1 | 3.7 | GO:0032809 | neuronal cell body membrane(GO:0032809) |
| 0.1 | 1.2 | GO:0008250 | oligosaccharyltransferase complex(GO:0008250) |
| 0.1 | 0.3 | GO:0042719 | mitochondrial intermembrane space protein transporter complex(GO:0042719) |
| 0.1 | 0.6 | GO:0070652 | HAUS complex(GO:0070652) |
| 0.1 | 0.5 | GO:0097422 | tubular endosome(GO:0097422) |
| 0.1 | 1.5 | GO:0033276 | transcription factor TFTC complex(GO:0033276) |
| 0.1 | 1.6 | GO:0005666 | DNA-directed RNA polymerase III complex(GO:0005666) |
| 0.1 | 1.5 | GO:0016580 | Sin3 complex(GO:0016580) |
| 0.1 | 1.0 | GO:0005682 | U5 snRNP(GO:0005682) |
| 0.1 | 0.9 | GO:0097542 | ciliary tip(GO:0097542) |
| 0.1 | 0.9 | GO:0034663 | endoplasmic reticulum chaperone complex(GO:0034663) |
| 0.1 | 0.3 | GO:0034715 | pICln-Sm protein complex(GO:0034715) |
| 0.1 | 0.8 | GO:0042788 | polysomal ribosome(GO:0042788) |
| 0.1 | 0.2 | GO:0044530 | supraspliceosomal complex(GO:0044530) |
| 0.1 | 1.0 | GO:0030877 | beta-catenin destruction complex(GO:0030877) |
| 0.1 | 2.1 | GO:0005719 | nuclear euchromatin(GO:0005719) |
| 0.0 | 0.5 | GO:0031362 | anchored component of external side of plasma membrane(GO:0031362) |
| 0.0 | 0.7 | GO:0036038 | MKS complex(GO:0036038) |
| 0.0 | 1.9 | GO:0005788 | endoplasmic reticulum lumen(GO:0005788) |
| 0.0 | 0.3 | GO:0032937 | SREBP-SCAP-Insig complex(GO:0032937) |
| 0.0 | 1.7 | GO:0008180 | COP9 signalosome(GO:0008180) |
| 0.0 | 0.6 | GO:0043196 | varicosity(GO:0043196) |
| 0.0 | 0.6 | GO:0005671 | Ada2/Gcn5/Ada3 transcription activator complex(GO:0005671) |
| 0.0 | 1.3 | GO:0005790 | smooth endoplasmic reticulum(GO:0005790) |
| 0.0 | 1.7 | GO:0005844 | polysome(GO:0005844) |
| 0.0 | 0.2 | GO:0070552 | BRISC complex(GO:0070552) |
| 0.0 | 2.0 | GO:0031519 | PcG protein complex(GO:0031519) |
| 0.0 | 0.7 | GO:0016581 | NuRD complex(GO:0016581) CHD-type complex(GO:0090545) |
| 0.0 | 0.5 | GO:0001650 | fibrillar center(GO:0001650) |
| 0.0 | 0.2 | GO:0042765 | GPI-anchor transamidase complex(GO:0042765) |
| 0.0 | 3.5 | GO:0030139 | endocytic vesicle(GO:0030139) |
| 0.0 | 0.8 | GO:0000152 | nuclear ubiquitin ligase complex(GO:0000152) |
| 0.0 | 1.2 | GO:0000118 | histone deacetylase complex(GO:0000118) |
| 0.0 | 2.5 | GO:0031225 | anchored component of membrane(GO:0031225) |
| 0.0 | 1.4 | GO:0017053 | transcriptional repressor complex(GO:0017053) |
| 0.0 | 1.3 | GO:0001725 | stress fiber(GO:0001725) contractile actin filament bundle(GO:0097517) |
| 0.0 | 0.5 | GO:0005720 | nuclear heterochromatin(GO:0005720) |
| 0.0 | 0.5 | GO:0032588 | trans-Golgi network membrane(GO:0032588) |
| 0.0 | 0.5 | GO:0035861 | site of double-strand break(GO:0035861) |
| 0.0 | 0.4 | GO:0005838 | proteasome regulatory particle(GO:0005838) |
| 0.0 | 1.2 | GO:0005643 | nuclear pore(GO:0005643) |
| 0.0 | 1.3 | GO:0016591 | DNA-directed RNA polymerase II, holoenzyme(GO:0016591) |
| 0.0 | 0.2 | GO:0008290 | F-actin capping protein complex(GO:0008290) |
| 0.0 | 1.8 | GO:0034399 | nuclear periphery(GO:0034399) |
| 0.0 | 0.2 | GO:0017119 | Golgi transport complex(GO:0017119) |
| 0.0 | 0.9 | GO:0000932 | cytoplasmic mRNA processing body(GO:0000932) |
| 0.0 | 0.9 | GO:0016328 | lateral plasma membrane(GO:0016328) |
| 0.0 | 0.8 | GO:0005801 | cis-Golgi network(GO:0005801) |
| 0.0 | 1.4 | GO:0072372 | primary cilium(GO:0072372) |
| 0.0 | 4.3 | GO:0005667 | transcription factor complex(GO:0005667) |
| 0.0 | 1.3 | GO:0030176 | integral component of endoplasmic reticulum membrane(GO:0030176) |
| 0.0 | 0.5 | GO:0042645 | nucleoid(GO:0009295) mitochondrial nucleoid(GO:0042645) |
| 0.0 | 1.3 | GO:0022626 | cytosolic ribosome(GO:0022626) |
| 0.0 | 0.3 | GO:0010494 | cytoplasmic stress granule(GO:0010494) |
| 0.0 | 0.4 | GO:0000315 | organellar large ribosomal subunit(GO:0000315) mitochondrial large ribosomal subunit(GO:0005762) |
Gene overrepresentation in molecular_function category:
| Log-likelihood per target | Total log-likelihood | Term | Description |
|---|---|---|---|
| 1.0 | 21.7 | GO:0001784 | phosphotyrosine binding(GO:0001784) |
| 0.8 | 2.4 | GO:0009881 | photoreceptor activity(GO:0009881) |
| 0.7 | 2.2 | GO:0008732 | threonine aldolase activity(GO:0004793) L-allo-threonine aldolase activity(GO:0008732) |
| 0.5 | 3.2 | GO:0035727 | lysophosphatidic acid binding(GO:0035727) lysophosphatidic acid receptor activity(GO:0070915) |
| 0.5 | 1.6 | GO:0035939 | microsatellite binding(GO:0035939) |
| 0.5 | 2.8 | GO:0004897 | ciliary neurotrophic factor receptor activity(GO:0004897) |
| 0.5 | 1.8 | GO:0016018 | cyclosporin A binding(GO:0016018) |
| 0.4 | 2.6 | GO:0004332 | fructose-bisphosphate aldolase activity(GO:0004332) |
| 0.4 | 2.1 | GO:0070320 | inward rectifier potassium channel inhibitor activity(GO:0070320) |
| 0.4 | 1.3 | GO:0000340 | RNA 7-methylguanosine cap binding(GO:0000340) |
| 0.3 | 1.4 | GO:0004999 | vasoactive intestinal polypeptide receptor activity(GO:0004999) |
| 0.3 | 1.7 | GO:0001069 | regulatory region RNA binding(GO:0001069) |
| 0.3 | 2.0 | GO:0046404 | ATP-dependent polydeoxyribonucleotide 5'-hydroxyl-kinase activity(GO:0046404) polydeoxyribonucleotide kinase activity(GO:0051733) |
| 0.3 | 0.7 | GO:0004921 | interleukin-11 receptor activity(GO:0004921) interleukin-11 binding(GO:0019970) |
| 0.3 | 1.2 | GO:0008508 | bile acid:sodium symporter activity(GO:0008508) |
| 0.2 | 1.5 | GO:0000774 | adenyl-nucleotide exchange factor activity(GO:0000774) |
| 0.2 | 1.2 | GO:0008808 | cardiolipin synthase activity(GO:0008808) phosphatidyltransferase activity(GO:0030572) |
| 0.2 | 0.4 | GO:1990825 | sequence-specific mRNA binding(GO:1990825) |
| 0.2 | 0.6 | GO:0010484 | H3 histone acetyltransferase activity(GO:0010484) |
| 0.2 | 0.8 | GO:0008476 | protein-tyrosine sulfotransferase activity(GO:0008476) |
| 0.2 | 0.8 | GO:0046923 | ER retention sequence binding(GO:0046923) |
| 0.2 | 2.2 | GO:0045294 | alpha-catenin binding(GO:0045294) |
| 0.2 | 1.4 | GO:0016308 | 1-phosphatidylinositol-4-phosphate 5-kinase activity(GO:0016308) |
| 0.2 | 0.5 | GO:0004008 | copper-exporting ATPase activity(GO:0004008) copper-transporting ATPase activity(GO:0043682) |
| 0.2 | 2.9 | GO:0051920 | peroxiredoxin activity(GO:0051920) |
| 0.2 | 0.5 | GO:0097100 | oxidized purine nucleobase lesion DNA N-glycosylase activity(GO:0008534) supercoiled DNA binding(GO:0097100) |
| 0.2 | 1.4 | GO:0001206 | transcriptional repressor activity, RNA polymerase II distal enhancer sequence-specific binding(GO:0001206) |
| 0.2 | 0.6 | GO:0004954 | icosanoid receptor activity(GO:0004953) prostanoid receptor activity(GO:0004954) prostaglandin receptor activity(GO:0004955) |
| 0.1 | 1.2 | GO:0031995 | insulin-like growth factor II binding(GO:0031995) |
| 0.1 | 0.7 | GO:0005047 | signal recognition particle binding(GO:0005047) |
| 0.1 | 1.4 | GO:0001134 | transcription factor activity, transcription factor recruiting(GO:0001134) |
| 0.1 | 0.8 | GO:0046912 | transferase activity, transferring acyl groups, acyl groups converted into alkyl on transfer(GO:0046912) |
| 0.1 | 1.2 | GO:0004579 | dolichyl-diphosphooligosaccharide-protein glycotransferase activity(GO:0004579) |
| 0.1 | 0.8 | GO:0033142 | progesterone receptor binding(GO:0033142) |
| 0.1 | 1.9 | GO:0008574 | ATP-dependent microtubule motor activity, plus-end-directed(GO:0008574) |
| 0.1 | 2.0 | GO:0015129 | lactate transmembrane transporter activity(GO:0015129) |
| 0.1 | 2.6 | GO:0017056 | structural constituent of nuclear pore(GO:0017056) |
| 0.1 | 1.5 | GO:0017070 | U6 snRNA binding(GO:0017070) |
| 0.1 | 1.3 | GO:0004185 | serine-type carboxypeptidase activity(GO:0004185) |
| 0.1 | 0.3 | GO:0016635 | oxidoreductase activity, acting on the CH-CH group of donors, quinone or related compound as acceptor(GO:0016635) |
| 0.1 | 1.6 | GO:0001013 | RNA polymerase I regulatory region DNA binding(GO:0001013) |
| 0.1 | 1.1 | GO:0030274 | LIM domain binding(GO:0030274) |
| 0.1 | 0.9 | GO:0061133 | endopeptidase activator activity(GO:0061133) |
| 0.1 | 0.8 | GO:0008193 | tRNA guanylyltransferase activity(GO:0008193) |
| 0.1 | 0.5 | GO:0051880 | G-quadruplex DNA binding(GO:0051880) |
| 0.1 | 3.7 | GO:0001965 | G-protein alpha-subunit binding(GO:0001965) |
| 0.1 | 0.5 | GO:2001070 | starch binding(GO:2001070) |
| 0.1 | 0.4 | GO:0030292 | protein tyrosine kinase inhibitor activity(GO:0030292) |
| 0.1 | 1.0 | GO:0102338 | fatty acid elongase activity(GO:0009922) 3-oxo-arachidoyl-CoA synthase activity(GO:0102336) 3-oxo-cerotoyl-CoA synthase activity(GO:0102337) 3-oxo-lignoceronyl-CoA synthase activity(GO:0102338) |
| 0.1 | 1.5 | GO:0016857 | racemase and epimerase activity, acting on carbohydrates and derivatives(GO:0016857) |
| 0.1 | 0.8 | GO:0035197 | siRNA binding(GO:0035197) |
| 0.1 | 0.6 | GO:0032453 | histone demethylase activity (H3-K4 specific)(GO:0032453) |
| 0.1 | 0.7 | GO:0031545 | peptidyl-proline 4-dioxygenase activity(GO:0031545) |
| 0.1 | 1.8 | GO:0000993 | RNA polymerase II core binding(GO:0000993) |
| 0.1 | 1.5 | GO:0000400 | four-way junction DNA binding(GO:0000400) |
| 0.1 | 2.0 | GO:0043395 | heparan sulfate proteoglycan binding(GO:0043395) |
| 0.1 | 0.5 | GO:0008494 | translation activator activity(GO:0008494) |
| 0.1 | 1.6 | GO:0001056 | RNA polymerase III activity(GO:0001056) |
| 0.1 | 1.3 | GO:0070411 | I-SMAD binding(GO:0070411) |
| 0.1 | 2.7 | GO:0005158 | insulin receptor binding(GO:0005158) |
| 0.1 | 0.4 | GO:0016778 | diphosphotransferase activity(GO:0016778) |
| 0.1 | 0.8 | GO:0016500 | protein-hormone receptor activity(GO:0016500) |
| 0.1 | 0.7 | GO:0032557 | pyrimidine ribonucleotide binding(GO:0032557) |
| 0.1 | 1.7 | GO:0004707 | MAP kinase activity(GO:0004707) |
| 0.1 | 1.3 | GO:0017160 | Ral GTPase binding(GO:0017160) |
| 0.1 | 0.2 | GO:0033883 | pyridoxal phosphatase activity(GO:0033883) |
| 0.1 | 0.2 | GO:0004699 | calcium-independent protein kinase C activity(GO:0004699) |
| 0.1 | 2.4 | GO:0043425 | bHLH transcription factor binding(GO:0043425) |
| 0.1 | 1.2 | GO:0005521 | lamin binding(GO:0005521) |
| 0.1 | 0.1 | GO:0019153 | protein-disulfide reductase (glutathione) activity(GO:0019153) |
| 0.1 | 1.1 | GO:0015035 | protein disulfide oxidoreductase activity(GO:0015035) |
| 0.0 | 1.2 | GO:0030276 | clathrin binding(GO:0030276) |
| 0.0 | 1.2 | GO:0003746 | translation elongation factor activity(GO:0003746) |
| 0.0 | 2.8 | GO:0019955 | cytokine binding(GO:0019955) |
| 0.0 | 0.4 | GO:0015093 | ferrous iron transmembrane transporter activity(GO:0015093) |
| 0.0 | 0.5 | GO:0004089 | carbonate dehydratase activity(GO:0004089) |
| 0.0 | 0.6 | GO:0005035 | tumor necrosis factor-activated receptor activity(GO:0005031) death receptor activity(GO:0005035) |
| 0.0 | 0.9 | GO:0051787 | misfolded protein binding(GO:0051787) |
| 0.0 | 0.7 | GO:0008266 | poly(U) RNA binding(GO:0008266) |
| 0.0 | 2.3 | GO:0019003 | GDP binding(GO:0019003) |
| 0.0 | 3.2 | GO:0004222 | metalloendopeptidase activity(GO:0004222) |
| 0.0 | 0.8 | GO:0030371 | translation repressor activity(GO:0030371) |
| 0.0 | 0.1 | GO:0043175 | RNA polymerase core enzyme binding(GO:0043175) |
| 0.0 | 0.4 | GO:0031996 | thioesterase binding(GO:0031996) |
| 0.0 | 0.2 | GO:0048403 | brain-derived neurotrophic factor binding(GO:0048403) |
| 0.0 | 0.4 | GO:0031386 | protein tag(GO:0031386) |
| 0.0 | 0.7 | GO:0016667 | oxidoreductase activity, acting on a sulfur group of donors(GO:0016667) |
| 0.0 | 3.7 | GO:0001078 | transcriptional repressor activity, RNA polymerase II core promoter proximal region sequence-specific binding(GO:0001078) |
| 0.0 | 0.5 | GO:0001671 | ATPase activator activity(GO:0001671) |
| 0.0 | 0.4 | GO:0031702 | type 1 angiotensin receptor binding(GO:0031702) |
| 0.0 | 0.4 | GO:0016594 | glycine binding(GO:0016594) |
| 0.0 | 0.5 | GO:0070530 | K63-linked polyubiquitin binding(GO:0070530) |
| 0.0 | 0.1 | GO:0004104 | choline kinase activity(GO:0004103) cholinesterase activity(GO:0004104) choline binding(GO:0033265) |
| 0.0 | 0.5 | GO:0031492 | nucleosomal DNA binding(GO:0031492) |
| 0.0 | 0.8 | GO:0008536 | Ran GTPase binding(GO:0008536) |
| 0.0 | 0.8 | GO:0016831 | carboxy-lyase activity(GO:0016831) |
| 0.0 | 1.1 | GO:0004402 | histone acetyltransferase activity(GO:0004402) |
| 0.0 | 0.2 | GO:0005149 | interleukin-1 receptor binding(GO:0005149) |
| 0.0 | 0.8 | GO:0061631 | ubiquitin conjugating enzyme activity(GO:0061631) ubiquitin-like protein conjugating enzyme activity(GO:0061650) |
| 0.0 | 0.3 | GO:0042975 | peroxisome proliferator activated receptor binding(GO:0042975) |
| 0.0 | 0.1 | GO:0004667 | prostaglandin-D synthase activity(GO:0004667) |
| 0.0 | 0.6 | GO:0005086 | ARF guanyl-nucleotide exchange factor activity(GO:0005086) |
| 0.0 | 0.8 | GO:0033613 | activating transcription factor binding(GO:0033613) |
| 0.0 | 0.4 | GO:0008009 | chemokine activity(GO:0008009) |
| 0.0 | 0.6 | GO:0016811 | hydrolase activity, acting on carbon-nitrogen (but not peptide) bonds, in linear amides(GO:0016811) |
| 0.0 | 0.4 | GO:0034930 | N-acetylglucosamine 6-O-sulfotransferase activity(GO:0001517) heparan sulfate 2-O-sulfotransferase activity(GO:0004394) HNK-1 sulfotransferase activity(GO:0016232) heparan sulfate 6-O-sulfotransferase activity(GO:0017095) trans-9R,10R-dihydrodiolphenanthrene sulfotransferase activity(GO:0018721) 1-phenanthrol sulfotransferase activity(GO:0018722) 3-phenanthrol sulfotransferase activity(GO:0018723) 4-phenanthrol sulfotransferase activity(GO:0018724) trans-3,4-dihydrodiolphenanthrene sulfotransferase activity(GO:0018725) 9-phenanthrol sulfotransferase activity(GO:0018726) 2-phenanthrol sulfotransferase activity(GO:0018727) phenanthrol sulfotransferase activity(GO:0019111) 1-hydroxypyrene sulfotransferase activity(GO:0034930) proteoglycan sulfotransferase activity(GO:0050698) cholesterol sulfotransferase activity(GO:0051922) hydroxyjasmonate sulfotransferase activity(GO:0080131) |
| 0.0 | 0.6 | GO:0004879 | RNA polymerase II transcription factor activity, ligand-activated sequence-specific DNA binding(GO:0004879) transcription factor activity, direct ligand regulated sequence-specific DNA binding(GO:0098531) |
| 0.0 | 0.1 | GO:0019784 | NEDD8-specific protease activity(GO:0019784) |
| 0.0 | 0.3 | GO:0005112 | Notch binding(GO:0005112) |
| 0.0 | 1.4 | GO:0001047 | core promoter binding(GO:0001047) |