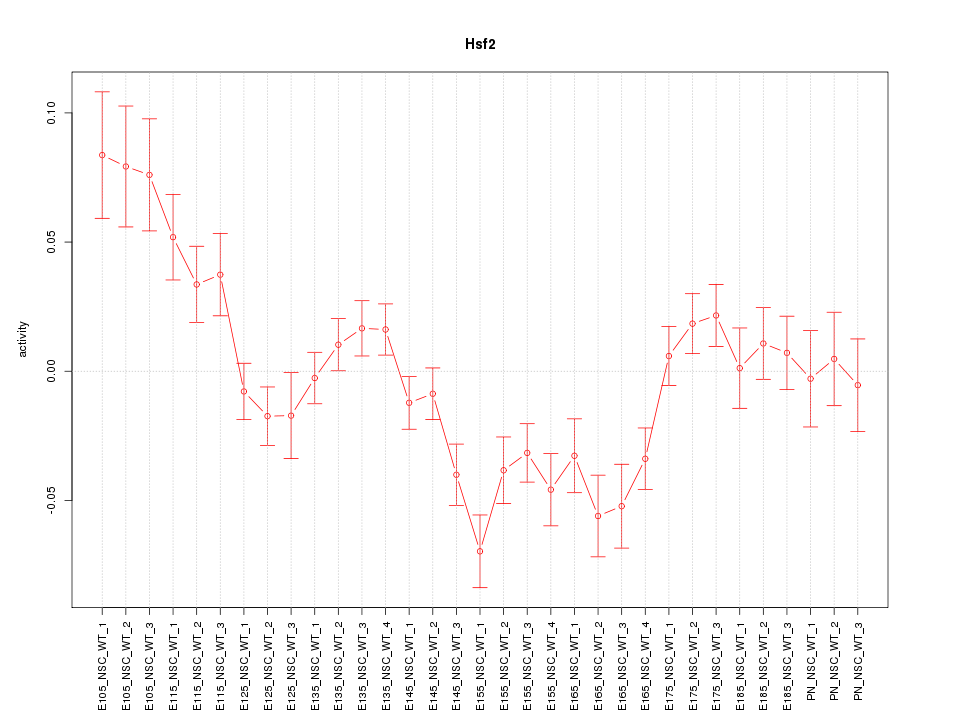
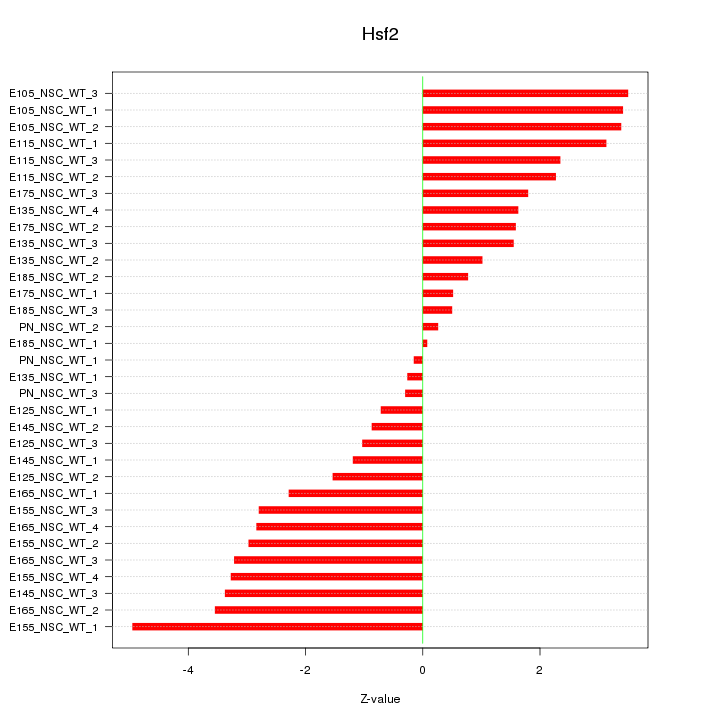
Motif ID: Hsf2
Z-value: 2.302

Transcription factors associated with Hsf2:
| Gene Symbol | Entrez ID | Gene Name |
|---|---|---|
| Hsf2 | ENSMUSG00000019878.7 | Hsf2 |
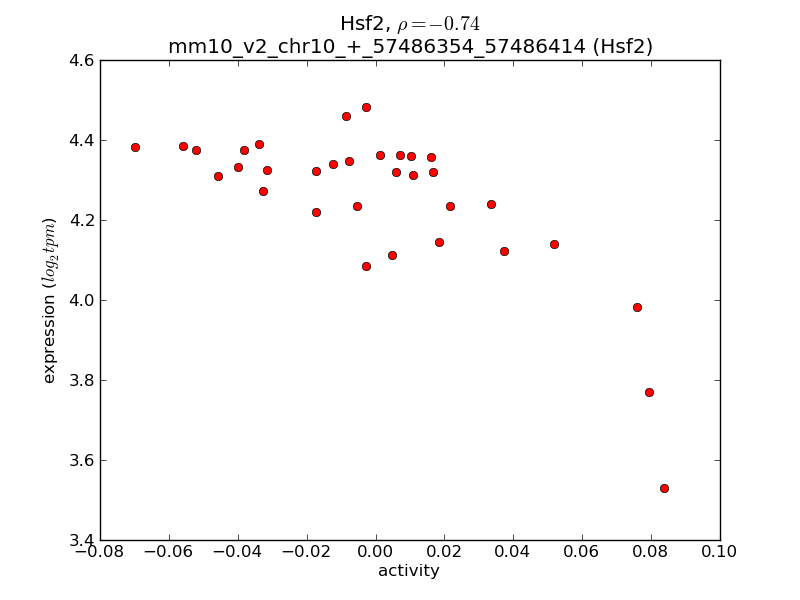
Activity-expression correlation:
| Gene Symbol | Promoter | Pearson corr. coef. | P-value | Plot |
|---|---|---|---|---|
| Hsf2 | mm10_v2_chr10_+_57486354_57486414 | -0.74 | 1.0e-06 | Click! |

Top targets:
Gene overrepresentation in biological_process category:
| Log-likelihood per target | Total log-likelihood | Term | Description |
|---|---|---|---|
| 3.7 | 14.9 | GO:0046552 | eye photoreceptor cell fate commitment(GO:0042706) photoreceptor cell fate commitment(GO:0046552) |
| 3.6 | 10.7 | GO:0070315 | G1 to G0 transition involved in cell differentiation(GO:0070315) |
| 3.1 | 9.3 | GO:0021759 | globus pallidus development(GO:0021759) |
| 2.6 | 7.9 | GO:0072076 | nephrogenic mesenchyme development(GO:0072076) |
| 1.9 | 5.7 | GO:0002842 | T cell mediated immune response to tumor cell(GO:0002424) regulation of T cell mediated immune response to tumor cell(GO:0002840) positive regulation of T cell mediated immune response to tumor cell(GO:0002842) |
| 1.8 | 9.1 | GO:2000981 | negative regulation of mechanoreceptor differentiation(GO:0045632) negative regulation of inner ear receptor cell differentiation(GO:2000981) |
| 1.7 | 8.5 | GO:0042535 | positive regulation of tumor necrosis factor biosynthetic process(GO:0042535) |
| 1.7 | 5.0 | GO:1900275 | negative regulation of phospholipase C activity(GO:1900275) |
| 1.7 | 26.6 | GO:0048387 | negative regulation of retinoic acid receptor signaling pathway(GO:0048387) |
| 1.7 | 8.3 | GO:1901164 | negative regulation of trophoblast cell migration(GO:1901164) |
| 1.6 | 6.6 | GO:0014846 | esophagus smooth muscle contraction(GO:0014846) |
| 1.6 | 6.4 | GO:0006529 | asparagine biosynthetic process(GO:0006529) |
| 1.5 | 4.6 | GO:0030421 | defecation(GO:0030421) |
| 1.5 | 4.6 | GO:0071603 | endothelial cell-cell adhesion(GO:0071603) |
| 1.5 | 4.4 | GO:0010757 | negative regulation of plasminogen activation(GO:0010757) |
| 1.3 | 6.5 | GO:0046598 | positive regulation of viral entry into host cell(GO:0046598) |
| 1.3 | 5.1 | GO:0002337 | B-1a B cell differentiation(GO:0002337) |
| 1.2 | 4.8 | GO:0045343 | MHC class I biosynthetic process(GO:0045341) regulation of MHC class I biosynthetic process(GO:0045343) positive regulation of MHC class I biosynthetic process(GO:0045345) |
| 1.2 | 3.5 | GO:1903225 | negative regulation of endodermal cell differentiation(GO:1903225) |
| 1.1 | 7.8 | GO:0043569 | negative regulation of insulin-like growth factor receptor signaling pathway(GO:0043569) |
| 1.1 | 5.5 | GO:0021914 | negative regulation of smoothened signaling pathway involved in ventral spinal cord patterning(GO:0021914) |
| 1.1 | 4.3 | GO:0048631 | regulation of skeletal muscle tissue growth(GO:0048631) |
| 1.0 | 3.1 | GO:1990046 | positive regulation of mitochondrial DNA replication(GO:0090297) regulation of cardiolipin metabolic process(GO:1900208) positive regulation of cardiolipin metabolic process(GO:1900210) stress-induced mitochondrial fusion(GO:1990046) |
| 1.0 | 3.0 | GO:0097278 | complement-dependent cytotoxicity(GO:0097278) |
| 1.0 | 3.0 | GO:0045819 | positive regulation of glycogen catabolic process(GO:0045819) |
| 0.9 | 2.8 | GO:1903054 | lysosomal membrane organization(GO:0097212) negative regulation of extracellular matrix organization(GO:1903054) positive regulation of protein folding(GO:1903334) |
| 0.9 | 2.7 | GO:0003278 | apoptotic process involved in heart morphogenesis(GO:0003278) |
| 0.9 | 5.4 | GO:0003433 | chondrocyte development involved in endochondral bone morphogenesis(GO:0003433) |
| 0.9 | 2.7 | GO:0003360 | brainstem development(GO:0003360) |
| 0.9 | 4.4 | GO:0006348 | chromatin silencing at telomere(GO:0006348) |
| 0.9 | 2.7 | GO:0035799 | ureter maturation(GO:0035799) |
| 0.9 | 4.3 | GO:0002457 | T cell antigen processing and presentation(GO:0002457) |
| 0.8 | 2.5 | GO:2000564 | regulation of MyD88-dependent toll-like receptor signaling pathway(GO:0034124) CD8-positive, alpha-beta T cell proliferation(GO:0035740) negative regulation of regulatory T cell differentiation(GO:0045590) regulation of CD8-positive, alpha-beta T cell proliferation(GO:2000564) |
| 0.8 | 3.3 | GO:0006203 | dGTP catabolic process(GO:0006203) dATP catabolic process(GO:0046061) |
| 0.8 | 11.2 | GO:0030238 | male sex determination(GO:0030238) |
| 0.8 | 2.4 | GO:0035021 | negative regulation of Rac protein signal transduction(GO:0035021) |
| 0.8 | 4.7 | GO:0043137 | DNA replication, removal of RNA primer(GO:0043137) |
| 0.8 | 4.7 | GO:1903690 | negative regulation of wound healing, spreading of epidermal cells(GO:1903690) |
| 0.8 | 3.8 | GO:0060040 | retinal bipolar neuron differentiation(GO:0060040) |
| 0.8 | 6.8 | GO:0045719 | negative regulation of glycogen biosynthetic process(GO:0045719) negative regulation of glycogen metabolic process(GO:0070874) |
| 0.8 | 14.3 | GO:0030213 | hyaluronan biosynthetic process(GO:0030213) |
| 0.8 | 2.3 | GO:0006434 | seryl-tRNA aminoacylation(GO:0006434) |
| 0.7 | 3.0 | GO:0007056 | spindle assembly involved in female meiosis(GO:0007056) positive regulation of oocyte development(GO:0060282) |
| 0.7 | 7.3 | GO:0060513 | prostatic bud formation(GO:0060513) |
| 0.7 | 1.5 | GO:0006933 | negative regulation of cell adhesion involved in substrate-bound cell migration(GO:0006933) |
| 0.7 | 5.1 | GO:0007296 | vitellogenesis(GO:0007296) |
| 0.7 | 5.7 | GO:0016081 | synaptic vesicle docking(GO:0016081) |
| 0.7 | 4.8 | GO:0032782 | bile acid secretion(GO:0032782) |
| 0.7 | 2.0 | GO:0018008 | N-terminal peptidyl-glycine N-myristoylation(GO:0018008) peptidyl-glycine modification(GO:0018201) |
| 0.7 | 2.0 | GO:0006597 | spermine biosynthetic process(GO:0006597) |
| 0.7 | 2.0 | GO:1904154 | protein localization to endoplasmic reticulum exit site(GO:0070973) positive regulation of retrograde protein transport, ER to cytosol(GO:1904154) |
| 0.6 | 1.9 | GO:0021698 | cerebellar cortex structural organization(GO:0021698) |
| 0.6 | 4.5 | GO:0032534 | regulation of microvillus assembly(GO:0032534) |
| 0.6 | 1.9 | GO:0019043 | establishment of viral latency(GO:0019043) |
| 0.6 | 1.9 | GO:0033566 | gamma-tubulin complex localization(GO:0033566) |
| 0.6 | 3.2 | GO:0003420 | regulation of growth plate cartilage chondrocyte proliferation(GO:0003420) |
| 0.6 | 5.6 | GO:0006104 | succinyl-CoA metabolic process(GO:0006104) |
| 0.6 | 5.0 | GO:0007195 | adenylate cyclase-inhibiting dopamine receptor signaling pathway(GO:0007195) |
| 0.6 | 5.4 | GO:1902913 | positive regulation of melanocyte differentiation(GO:0045636) positive regulation of neuroepithelial cell differentiation(GO:1902913) |
| 0.6 | 3.6 | GO:0002326 | B cell lineage commitment(GO:0002326) |
| 0.6 | 2.9 | GO:0072488 | nitrogen utilization(GO:0019740) ammonium transmembrane transport(GO:0072488) |
| 0.6 | 2.3 | GO:0042276 | error-prone translesion synthesis(GO:0042276) |
| 0.6 | 2.8 | GO:0010668 | ectodermal cell differentiation(GO:0010668) |
| 0.6 | 1.7 | GO:0071492 | cellular response to UV-A(GO:0071492) |
| 0.5 | 6.0 | GO:0045603 | positive regulation of endothelial cell differentiation(GO:0045603) |
| 0.5 | 13.8 | GO:0000413 | protein peptidyl-prolyl isomerization(GO:0000413) |
| 0.5 | 4.2 | GO:0033353 | S-adenosylmethionine cycle(GO:0033353) |
| 0.5 | 1.6 | GO:0035574 | histone H4-K20 demethylation(GO:0035574) |
| 0.5 | 1.6 | GO:0097089 | methyl-branched fatty acid metabolic process(GO:0097089) |
| 0.5 | 6.7 | GO:0046643 | regulation of gamma-delta T cell differentiation(GO:0045586) regulation of gamma-delta T cell activation(GO:0046643) |
| 0.5 | 3.1 | GO:0071883 | activation of MAPK activity by adrenergic receptor signaling pathway(GO:0071883) |
| 0.5 | 1.5 | GO:0097461 | ferric iron import(GO:0033216) ferric iron import into cell(GO:0097461) |
| 0.5 | 0.5 | GO:0007113 | endomitotic cell cycle(GO:0007113) |
| 0.5 | 6.2 | GO:0051451 | myoblast migration(GO:0051451) |
| 0.5 | 4.7 | GO:0051574 | positive regulation of histone H3-K9 methylation(GO:0051574) |
| 0.5 | 5.1 | GO:1990173 | protein localization to nuclear body(GO:1903405) protein localization to Cajal body(GO:1904867) regulation of protein localization to Cajal body(GO:1904869) positive regulation of protein localization to Cajal body(GO:1904871) protein localization to nucleoplasm(GO:1990173) |
| 0.5 | 4.2 | GO:0014883 | transition between fast and slow fiber(GO:0014883) |
| 0.5 | 2.8 | GO:0009235 | cobalamin metabolic process(GO:0009235) |
| 0.5 | 1.4 | GO:0060479 | lung epithelium development(GO:0060428) lung cell differentiation(GO:0060479) lung epithelial cell differentiation(GO:0060487) |
| 0.5 | 1.8 | GO:0033580 | protein glycosylation at cell surface(GO:0033575) protein galactosylation at cell surface(GO:0033580) protein galactosylation(GO:0042125) |
| 0.4 | 7.9 | GO:0045793 | positive regulation of cell size(GO:0045793) |
| 0.4 | 3.1 | GO:0014816 | skeletal muscle satellite cell differentiation(GO:0014816) |
| 0.4 | 1.7 | GO:0060021 | palate development(GO:0060021) |
| 0.4 | 3.5 | GO:0014807 | regulation of somitogenesis(GO:0014807) |
| 0.4 | 1.2 | GO:2000501 | natural killer cell chemotaxis(GO:0035747) regulation of natural killer cell chemotaxis(GO:2000501) |
| 0.4 | 0.8 | GO:0001803 | antibody-dependent cellular cytotoxicity(GO:0001788) type III hypersensitivity(GO:0001802) regulation of type III hypersensitivity(GO:0001803) positive regulation of type III hypersensitivity(GO:0001805) |
| 0.4 | 8.0 | GO:0035873 | lactate transport(GO:0015727) lactate transmembrane transport(GO:0035873) plasma membrane lactate transport(GO:0035879) |
| 0.4 | 1.6 | GO:1901163 | trophoblast cell migration(GO:0061450) regulation of trophoblast cell migration(GO:1901163) |
| 0.4 | 2.0 | GO:0060018 | astrocyte fate commitment(GO:0060018) |
| 0.4 | 1.6 | GO:2000195 | negative regulation of female gonad development(GO:2000195) |
| 0.4 | 5.1 | GO:0018126 | protein hydroxylation(GO:0018126) |
| 0.4 | 3.9 | GO:0060355 | positive regulation of cell adhesion molecule production(GO:0060355) |
| 0.4 | 6.5 | GO:0005980 | polysaccharide catabolic process(GO:0000272) glycogen catabolic process(GO:0005980) glucan catabolic process(GO:0009251) cellular polysaccharide catabolic process(GO:0044247) |
| 0.4 | 3.4 | GO:2001214 | positive regulation of vasculogenesis(GO:2001214) |
| 0.4 | 7.5 | GO:0051044 | positive regulation of membrane protein ectodomain proteolysis(GO:0051044) |
| 0.4 | 1.8 | GO:0070125 | mitochondrial translational elongation(GO:0070125) |
| 0.4 | 0.7 | GO:0032829 | regulation of CD4-positive, CD25-positive, alpha-beta regulatory T cell differentiation(GO:0032829) |
| 0.4 | 2.5 | GO:0033280 | response to vitamin D(GO:0033280) |
| 0.4 | 1.8 | GO:0060334 | regulation of interferon-gamma-mediated signaling pathway(GO:0060334) |
| 0.3 | 2.4 | GO:0060907 | positive regulation of macrophage cytokine production(GO:0060907) |
| 0.3 | 1.3 | GO:0051043 | regulation of membrane protein ectodomain proteolysis(GO:0051043) |
| 0.3 | 3.3 | GO:0045899 | positive regulation of RNA polymerase II transcriptional preinitiation complex assembly(GO:0045899) |
| 0.3 | 3.9 | GO:0000183 | chromatin silencing at rDNA(GO:0000183) |
| 0.3 | 3.2 | GO:0021891 | olfactory bulb interneuron development(GO:0021891) |
| 0.3 | 2.2 | GO:0031119 | tRNA pseudouridine synthesis(GO:0031119) |
| 0.3 | 1.6 | GO:0018171 | peptidyl-cysteine oxidation(GO:0018171) |
| 0.3 | 6.0 | GO:0060236 | regulation of mitotic spindle organization(GO:0060236) |
| 0.3 | 3.8 | GO:0015825 | L-serine transport(GO:0015825) |
| 0.3 | 2.2 | GO:0002862 | negative regulation of inflammatory response to antigenic stimulus(GO:0002862) |
| 0.3 | 4.7 | GO:0051084 | 'de novo' protein folding(GO:0006458) 'de novo' posttranslational protein folding(GO:0051084) |
| 0.3 | 2.3 | GO:1900262 | regulation of DNA-directed DNA polymerase activity(GO:1900262) positive regulation of DNA-directed DNA polymerase activity(GO:1900264) |
| 0.3 | 6.8 | GO:0042474 | middle ear morphogenesis(GO:0042474) |
| 0.3 | 2.8 | GO:0038166 | angiotensin-activated signaling pathway(GO:0038166) |
| 0.3 | 13.6 | GO:0045600 | positive regulation of fat cell differentiation(GO:0045600) |
| 0.3 | 4.6 | GO:0032287 | peripheral nervous system myelin maintenance(GO:0032287) |
| 0.3 | 0.5 | GO:0034238 | macrophage fusion(GO:0034238) regulation of macrophage fusion(GO:0034239) |
| 0.3 | 1.1 | GO:0006432 | phenylalanyl-tRNA aminoacylation(GO:0006432) |
| 0.3 | 1.1 | GO:1902268 | negative regulation of polyamine transmembrane transport(GO:1902268) |
| 0.3 | 3.1 | GO:0031274 | positive regulation of pseudopodium assembly(GO:0031274) |
| 0.3 | 1.8 | GO:0042572 | retinol metabolic process(GO:0042572) |
| 0.3 | 1.5 | GO:0000056 | ribosomal small subunit export from nucleus(GO:0000056) |
| 0.2 | 0.7 | GO:0001830 | trophectodermal cell fate commitment(GO:0001830) |
| 0.2 | 5.3 | GO:0000154 | rRNA modification(GO:0000154) |
| 0.2 | 1.7 | GO:0031053 | primary miRNA processing(GO:0031053) |
| 0.2 | 1.9 | GO:0048311 | mitochondrion distribution(GO:0048311) |
| 0.2 | 0.7 | GO:0033364 | mast cell secretory granule organization(GO:0033364) |
| 0.2 | 4.3 | GO:0042753 | positive regulation of circadian rhythm(GO:0042753) |
| 0.2 | 2.5 | GO:0046349 | amino sugar biosynthetic process(GO:0046349) |
| 0.2 | 4.8 | GO:0031572 | G2 DNA damage checkpoint(GO:0031572) |
| 0.2 | 3.0 | GO:0001522 | pseudouridine synthesis(GO:0001522) |
| 0.2 | 0.4 | GO:0002430 | complement receptor mediated signaling pathway(GO:0002430) |
| 0.2 | 2.3 | GO:0061299 | retina vasculature morphogenesis in camera-type eye(GO:0061299) |
| 0.2 | 0.6 | GO:0090370 | negative regulation of cholesterol efflux(GO:0090370) |
| 0.2 | 0.8 | GO:0051708 | intracellular transport of viral protein in host cell(GO:0019060) symbiont intracellular protein transport in host(GO:0030581) cytosol to ER transport(GO:0046967) intracellular protein transport in other organism involved in symbiotic interaction(GO:0051708) |
| 0.2 | 0.6 | GO:1900740 | regulation of protein insertion into mitochondrial membrane involved in apoptotic signaling pathway(GO:1900739) positive regulation of protein insertion into mitochondrial membrane involved in apoptotic signaling pathway(GO:1900740) |
| 0.2 | 1.2 | GO:0006627 | protein processing involved in protein targeting to mitochondrion(GO:0006627) |
| 0.2 | 8.7 | GO:0061077 | chaperone-mediated protein folding(GO:0061077) |
| 0.2 | 1.4 | GO:0071285 | cellular response to lithium ion(GO:0071285) |
| 0.2 | 0.6 | GO:0046022 | regulation of transcription from RNA polymerase II promoter, mitotic(GO:0046021) positive regulation of transcription from RNA polymerase II promoter during mitosis(GO:0046022) |
| 0.2 | 1.0 | GO:1905098 | negative regulation of guanyl-nucleotide exchange factor activity(GO:1905098) response to amino acid starvation(GO:1990928) |
| 0.2 | 2.0 | GO:0090557 | establishment of endothelial intestinal barrier(GO:0090557) |
| 0.2 | 2.3 | GO:0070986 | left/right axis specification(GO:0070986) |
| 0.2 | 1.0 | GO:1904338 | regulation of dopaminergic neuron differentiation(GO:1904338) |
| 0.2 | 1.4 | GO:0033184 | positive regulation of histone ubiquitination(GO:0033184) |
| 0.2 | 2.1 | GO:0006610 | ribosomal protein import into nucleus(GO:0006610) |
| 0.2 | 2.1 | GO:0071803 | positive regulation of podosome assembly(GO:0071803) |
| 0.2 | 0.7 | GO:0035616 | histone H2B conserved C-terminal lysine deubiquitination(GO:0035616) |
| 0.2 | 1.1 | GO:0015015 | heparan sulfate proteoglycan biosynthetic process, enzymatic modification(GO:0015015) |
| 0.2 | 0.9 | GO:0051490 | negative regulation of filopodium assembly(GO:0051490) |
| 0.2 | 0.5 | GO:0035928 | rRNA import into mitochondrion(GO:0035928) |
| 0.2 | 1.4 | GO:0006004 | fucose metabolic process(GO:0006004) |
| 0.2 | 0.5 | GO:0043201 | response to leucine(GO:0043201) cellular response to leucine(GO:0071233) |
| 0.2 | 3.1 | GO:0045662 | negative regulation of myoblast differentiation(GO:0045662) |
| 0.2 | 2.4 | GO:0002176 | male germ cell proliferation(GO:0002176) |
| 0.2 | 2.2 | GO:0035751 | regulation of lysosomal lumen pH(GO:0035751) |
| 0.2 | 1.5 | GO:0090244 | Wnt signaling pathway involved in somitogenesis(GO:0090244) |
| 0.2 | 3.2 | GO:0046596 | regulation of viral entry into host cell(GO:0046596) |
| 0.2 | 0.8 | GO:0007182 | common-partner SMAD protein phosphorylation(GO:0007182) |
| 0.2 | 3.2 | GO:0007520 | myoblast fusion(GO:0007520) |
| 0.2 | 0.6 | GO:0035262 | gonad morphogenesis(GO:0035262) |
| 0.2 | 1.7 | GO:0043517 | positive regulation of DNA damage response, signal transduction by p53 class mediator(GO:0043517) |
| 0.2 | 3.7 | GO:0048246 | macrophage chemotaxis(GO:0048246) |
| 0.2 | 0.8 | GO:0060838 | lymphatic endothelial cell fate commitment(GO:0060838) regulation of transcription involved in lymphatic endothelial cell fate commitment(GO:0060849) |
| 0.1 | 0.3 | GO:1904139 | microglial cell migration(GO:1904124) regulation of microglial cell migration(GO:1904139) |
| 0.1 | 4.4 | GO:0010972 | negative regulation of G2/M transition of mitotic cell cycle(GO:0010972) |
| 0.1 | 2.9 | GO:0042744 | hydrogen peroxide catabolic process(GO:0042744) |
| 0.1 | 0.7 | GO:0097501 | stress response to metal ion(GO:0097501) |
| 0.1 | 1.4 | GO:0033234 | negative regulation of protein sumoylation(GO:0033234) |
| 0.1 | 1.4 | GO:0046036 | GTP biosynthetic process(GO:0006183) CTP biosynthetic process(GO:0006241) CTP metabolic process(GO:0046036) |
| 0.1 | 2.7 | GO:0000028 | ribosomal small subunit assembly(GO:0000028) |
| 0.1 | 0.3 | GO:0040009 | regulation of growth rate(GO:0040009) |
| 0.1 | 2.4 | GO:0046855 | phosphorylated carbohydrate dephosphorylation(GO:0046838) inositol phosphate dephosphorylation(GO:0046855) |
| 0.1 | 0.5 | GO:0070213 | protein auto-ADP-ribosylation(GO:0070213) |
| 0.1 | 4.0 | GO:0006801 | superoxide metabolic process(GO:0006801) |
| 0.1 | 1.5 | GO:0000244 | spliceosomal tri-snRNP complex assembly(GO:0000244) |
| 0.1 | 1.1 | GO:0015937 | coenzyme A biosynthetic process(GO:0015937) |
| 0.1 | 2.2 | GO:0015812 | gamma-aminobutyric acid transport(GO:0015812) |
| 0.1 | 1.1 | GO:0021683 | cerebellar granular layer morphogenesis(GO:0021683) |
| 0.1 | 2.3 | GO:0002548 | monocyte chemotaxis(GO:0002548) |
| 0.1 | 0.8 | GO:0032790 | ribosome disassembly(GO:0032790) |
| 0.1 | 6.0 | GO:0002066 | columnar/cuboidal epithelial cell development(GO:0002066) |
| 0.1 | 9.2 | GO:0007601 | visual perception(GO:0007601) |
| 0.1 | 3.0 | GO:0000027 | ribosomal large subunit assembly(GO:0000027) |
| 0.1 | 1.1 | GO:0021796 | cerebral cortex regionalization(GO:0021796) |
| 0.1 | 3.6 | GO:0015909 | long-chain fatty acid transport(GO:0015909) |
| 0.1 | 1.4 | GO:0017144 | drug metabolic process(GO:0017144) |
| 0.1 | 3.5 | GO:2001238 | positive regulation of extrinsic apoptotic signaling pathway(GO:2001238) |
| 0.1 | 1.8 | GO:0045116 | protein neddylation(GO:0045116) |
| 0.1 | 8.7 | GO:0050772 | positive regulation of axonogenesis(GO:0050772) |
| 0.1 | 2.9 | GO:0051642 | centrosome localization(GO:0051642) |
| 0.1 | 0.8 | GO:0032261 | purine nucleotide salvage(GO:0032261) IMP salvage(GO:0032264) |
| 0.1 | 0.9 | GO:0031584 | toxin metabolic process(GO:0009404) activation of phospholipase D activity(GO:0031584) |
| 0.1 | 0.6 | GO:0015879 | carnitine transport(GO:0015879) |
| 0.1 | 2.6 | GO:0045103 | intermediate filament-based process(GO:0045103) |
| 0.1 | 1.0 | GO:0000479 | endonucleolytic cleavage of tricistronic rRNA transcript (SSU-rRNA, 5.8S rRNA, LSU-rRNA)(GO:0000479) |
| 0.1 | 0.5 | GO:0030579 | ubiquitin-dependent SMAD protein catabolic process(GO:0030579) |
| 0.1 | 4.1 | GO:0035690 | cellular response to drug(GO:0035690) |
| 0.1 | 0.4 | GO:0006564 | L-serine biosynthetic process(GO:0006564) |
| 0.1 | 1.5 | GO:0016226 | iron-sulfur cluster assembly(GO:0016226) metallo-sulfur cluster assembly(GO:0031163) |
| 0.1 | 1.1 | GO:0072673 | lamellipodium morphogenesis(GO:0072673) |
| 0.1 | 0.8 | GO:0060351 | cartilage development involved in endochondral bone morphogenesis(GO:0060351) |
| 0.1 | 1.7 | GO:0000462 | maturation of SSU-rRNA from tricistronic rRNA transcript (SSU-rRNA, 5.8S rRNA, LSU-rRNA)(GO:0000462) |
| 0.1 | 3.5 | GO:0010501 | RNA secondary structure unwinding(GO:0010501) |
| 0.1 | 2.6 | GO:0034605 | cellular response to heat(GO:0034605) |
| 0.1 | 1.6 | GO:0006509 | membrane protein ectodomain proteolysis(GO:0006509) |
| 0.1 | 1.5 | GO:0033146 | regulation of intracellular estrogen receptor signaling pathway(GO:0033146) |
| 0.1 | 0.5 | GO:0035405 | histone-threonine phosphorylation(GO:0035405) |
| 0.1 | 3.6 | GO:0050830 | defense response to Gram-positive bacterium(GO:0050830) |
| 0.1 | 0.4 | GO:0097264 | self proteolysis(GO:0097264) |
| 0.1 | 0.7 | GO:0098535 | de novo centriole assembly(GO:0098535) |
| 0.1 | 1.4 | GO:1902230 | negative regulation of intrinsic apoptotic signaling pathway in response to DNA damage(GO:1902230) |
| 0.1 | 1.2 | GO:0018149 | peptide cross-linking(GO:0018149) |
| 0.1 | 0.8 | GO:0010992 | ubiquitin homeostasis(GO:0010992) |
| 0.1 | 0.4 | GO:1903847 | regulation of aorta morphogenesis(GO:1903847) positive regulation of aorta morphogenesis(GO:1903849) |
| 0.1 | 0.6 | GO:0061179 | negative regulation of insulin secretion involved in cellular response to glucose stimulus(GO:0061179) |
| 0.1 | 9.9 | GO:0007160 | cell-matrix adhesion(GO:0007160) |
| 0.1 | 0.5 | GO:0040016 | embryonic cleavage(GO:0040016) |
| 0.1 | 0.5 | GO:0006686 | sphingomyelin biosynthetic process(GO:0006686) |
| 0.1 | 5.4 | GO:0032200 | telomere maintenance(GO:0000723) telomere organization(GO:0032200) |
| 0.1 | 1.1 | GO:2000398 | regulation of T cell differentiation in thymus(GO:0033081) regulation of thymocyte aggregation(GO:2000398) |
| 0.1 | 0.1 | GO:0000055 | ribosomal large subunit export from nucleus(GO:0000055) |
| 0.1 | 2.5 | GO:0048636 | positive regulation of striated muscle tissue development(GO:0045844) positive regulation of muscle organ development(GO:0048636) |
| 0.1 | 0.3 | GO:0090527 | actin filament reorganization(GO:0090527) |
| 0.1 | 0.1 | GO:0035743 | CD4-positive, alpha-beta T cell cytokine production(GO:0035743) T-helper 2 cell cytokine production(GO:0035745) |
| 0.1 | 0.2 | GO:0015712 | hexose phosphate transport(GO:0015712) glucose-6-phosphate transport(GO:0015760) phosphate ion transmembrane transport(GO:0035435) |
| 0.1 | 1.4 | GO:0006611 | protein export from nucleus(GO:0006611) |
| 0.1 | 1.6 | GO:0046470 | phosphatidylcholine metabolic process(GO:0046470) |
| 0.1 | 0.8 | GO:0060148 | positive regulation of posttranscriptional gene silencing(GO:0060148) |
| 0.1 | 3.4 | GO:0050796 | regulation of insulin secretion(GO:0050796) |
| 0.1 | 1.0 | GO:0043968 | histone H2A acetylation(GO:0043968) |
| 0.1 | 1.3 | GO:0048384 | retinoic acid receptor signaling pathway(GO:0048384) |
| 0.0 | 1.2 | GO:0032956 | regulation of actin cytoskeleton organization(GO:0032956) |
| 0.0 | 2.1 | GO:0006418 | tRNA aminoacylation for protein translation(GO:0006418) |
| 0.0 | 3.0 | GO:0051225 | spindle assembly(GO:0051225) |
| 0.0 | 3.3 | GO:0050885 | neuromuscular process controlling balance(GO:0050885) |
| 0.0 | 1.1 | GO:0007157 | heterophilic cell-cell adhesion via plasma membrane cell adhesion molecules(GO:0007157) |
| 0.0 | 1.4 | GO:0060612 | adipose tissue development(GO:0060612) |
| 0.0 | 4.6 | GO:0060348 | bone development(GO:0060348) |
| 0.0 | 0.4 | GO:0031954 | positive regulation of protein autophosphorylation(GO:0031954) |
| 0.0 | 0.9 | GO:0016180 | snRNA processing(GO:0016180) |
| 0.0 | 1.3 | GO:0017145 | stem cell division(GO:0017145) |
| 0.0 | 3.9 | GO:0051028 | mRNA transport(GO:0051028) |
| 0.0 | 2.0 | GO:0007127 | meiosis I(GO:0007127) |
| 0.0 | 0.4 | GO:0070914 | UV-damage excision repair(GO:0070914) |
| 0.0 | 1.4 | GO:1902653 | cholesterol biosynthetic process(GO:0006695) secondary alcohol biosynthetic process(GO:1902653) |
| 0.0 | 0.1 | GO:2000819 | regulation of nucleotide-excision repair(GO:2000819) |
| 0.0 | 1.6 | GO:0043154 | negative regulation of cysteine-type endopeptidase activity involved in apoptotic process(GO:0043154) |
| 0.0 | 0.2 | GO:2000279 | negative regulation of DNA biosynthetic process(GO:2000279) |
| 0.0 | 2.1 | GO:0006513 | protein monoubiquitination(GO:0006513) |
| 0.0 | 4.2 | GO:0008360 | regulation of cell shape(GO:0008360) |
| 0.0 | 0.2 | GO:0051482 | positive regulation of cytosolic calcium ion concentration involved in phospholipase C-activating G-protein coupled signaling pathway(GO:0051482) |
| 0.0 | 0.5 | GO:0042274 | ribosomal small subunit biogenesis(GO:0042274) |
| 0.0 | 0.3 | GO:0006532 | aspartate biosynthetic process(GO:0006532) |
| 0.0 | 0.8 | GO:0030488 | tRNA methylation(GO:0030488) |
| 0.0 | 2.3 | GO:0051099 | positive regulation of binding(GO:0051099) |
| 0.0 | 0.1 | GO:0031339 | negative regulation of vesicle fusion(GO:0031339) |
| 0.0 | 7.1 | GO:0032259 | methylation(GO:0032259) |
| 0.0 | 1.4 | GO:0016525 | negative regulation of angiogenesis(GO:0016525) |
| 0.0 | 0.5 | GO:0043029 | T cell homeostasis(GO:0043029) |
| 0.0 | 5.8 | GO:0007517 | muscle organ development(GO:0007517) |
| 0.0 | 0.1 | GO:0030576 | Cajal body organization(GO:0030576) |
| 0.0 | 0.5 | GO:0070536 | protein K63-linked deubiquitination(GO:0070536) |
| 0.0 | 0.5 | GO:0015758 | glucose transport(GO:0015758) |
| 0.0 | 0.1 | GO:0019249 | lactate biosynthetic process from pyruvate(GO:0019244) lactate biosynthetic process(GO:0019249) |
| 0.0 | 0.4 | GO:0010842 | retina layer formation(GO:0010842) |
| 0.0 | 0.2 | GO:0050860 | negative regulation of T cell receptor signaling pathway(GO:0050860) |
| 0.0 | 1.3 | GO:0010923 | negative regulation of phosphatase activity(GO:0010923) |
| 0.0 | 0.7 | GO:0000077 | DNA damage checkpoint(GO:0000077) |
| 0.0 | 0.4 | GO:0006220 | pyrimidine nucleotide metabolic process(GO:0006220) |
| 0.0 | 4.1 | GO:0016055 | Wnt signaling pathway(GO:0016055) cell-cell signaling by wnt(GO:0198738) |
| 0.0 | 0.0 | GO:1903071 | positive regulation of ER-associated ubiquitin-dependent protein catabolic process(GO:1903071) |
| 0.0 | 0.4 | GO:0010107 | potassium ion import(GO:0010107) |
| 0.0 | 0.1 | GO:0090043 | regulation of tubulin deacetylation(GO:0090043) |
| 0.0 | 1.0 | GO:0006413 | translational initiation(GO:0006413) |
| 0.0 | 0.6 | GO:0006891 | intra-Golgi vesicle-mediated transport(GO:0006891) |
| 0.0 | 0.5 | GO:0022904 | respiratory electron transport chain(GO:0022904) |
| 0.0 | 0.1 | GO:0070050 | neuron cellular homeostasis(GO:0070050) |
| 0.0 | 1.5 | GO:0001654 | eye development(GO:0001654) |
| 0.0 | 0.4 | GO:0009225 | nucleotide-sugar metabolic process(GO:0009225) |
| 0.0 | 0.1 | GO:0043402 | glucocorticoid mediated signaling pathway(GO:0043402) |
Gene overrepresentation in cellular_component category:
| Log-likelihood per target | Total log-likelihood | Term | Description |
|---|---|---|---|
| 2.9 | 8.6 | GO:0097512 | cardiac myofibril(GO:0097512) |
| 2.0 | 2.0 | GO:0036056 | filtration diaphragm(GO:0036056) slit diaphragm(GO:0036057) |
| 1.9 | 7.8 | GO:0036454 | insulin-like growth factor binding protein complex(GO:0016942) growth factor complex(GO:0036454) insulin-like growth factor ternary complex(GO:0042567) |
| 1.2 | 3.5 | GO:0005588 | collagen type V trimer(GO:0005588) |
| 1.0 | 3.0 | GO:0042585 | germinal vesicle(GO:0042585) |
| 1.0 | 5.0 | GO:0031523 | Myb complex(GO:0031523) |
| 1.0 | 5.7 | GO:0046696 | lipopolysaccharide receptor complex(GO:0046696) |
| 0.9 | 5.6 | GO:0030062 | mitochondrial tricarboxylic acid cycle enzyme complex(GO:0030062) |
| 0.9 | 2.7 | GO:0097059 | CNTFR-CLCF1 complex(GO:0097059) |
| 0.9 | 4.3 | GO:0008622 | epsilon DNA polymerase complex(GO:0008622) |
| 0.8 | 6.3 | GO:0005818 | aster(GO:0005818) |
| 0.7 | 5.1 | GO:0097524 | sperm plasma membrane(GO:0097524) |
| 0.7 | 5.7 | GO:0044300 | cerebellar mossy fiber(GO:0044300) |
| 0.7 | 2.8 | GO:0043202 | lysosomal lumen(GO:0043202) |
| 0.6 | 1.7 | GO:0031074 | nucleocytoplasmic shuttling complex(GO:0031074) |
| 0.6 | 2.8 | GO:0002193 | MAML1-RBP-Jkappa- ICN1 complex(GO:0002193) |
| 0.6 | 6.2 | GO:0031080 | nuclear pore outer ring(GO:0031080) |
| 0.6 | 7.2 | GO:0030061 | mitochondrial crista(GO:0030061) |
| 0.5 | 2.7 | GO:0030314 | junctional membrane complex(GO:0030314) |
| 0.5 | 4.1 | GO:0031428 | box C/D snoRNP complex(GO:0031428) |
| 0.5 | 4.8 | GO:0070531 | BRCA1-A complex(GO:0070531) |
| 0.5 | 5.1 | GO:0005832 | chaperonin-containing T-complex(GO:0005832) |
| 0.5 | 1.4 | GO:1903095 | microprocessor complex(GO:0070877) ribonuclease III complex(GO:1903095) |
| 0.4 | 2.1 | GO:0033553 | rDNA heterochromatin(GO:0033553) |
| 0.4 | 4.3 | GO:0000243 | commitment complex(GO:0000243) |
| 0.4 | 1.2 | GO:0042720 | mitochondrial inner membrane peptidase complex(GO:0042720) |
| 0.4 | 4.4 | GO:0031091 | platelet alpha granule(GO:0031091) extrinsic component of external side of plasma membrane(GO:0031232) |
| 0.4 | 2.0 | GO:0005784 | Sec61 translocon complex(GO:0005784) translocon complex(GO:0071256) |
| 0.4 | 1.1 | GO:0030905 | retromer, tubulation complex(GO:0030905) |
| 0.3 | 1.4 | GO:0002111 | BRCA2-BRAF35 complex(GO:0002111) |
| 0.3 | 16.1 | GO:0000307 | cyclin-dependent protein kinase holoenzyme complex(GO:0000307) |
| 0.3 | 1.3 | GO:0016222 | procollagen-proline 4-dioxygenase complex(GO:0016222) |
| 0.3 | 3.3 | GO:0031595 | nuclear proteasome complex(GO:0031595) |
| 0.3 | 2.2 | GO:0034364 | high-density lipoprotein particle(GO:0034364) |
| 0.3 | 4.5 | GO:0097539 | ciliary transition fiber(GO:0097539) |
| 0.3 | 3.0 | GO:0045298 | tubulin complex(GO:0045298) |
| 0.3 | 2.3 | GO:0031390 | Ctf18 RFC-like complex(GO:0031390) |
| 0.3 | 0.8 | GO:0071008 | U2-type post-mRNA release spliceosomal complex(GO:0071008) |
| 0.3 | 3.4 | GO:0043240 | Fanconi anaemia nuclear complex(GO:0043240) |
| 0.3 | 0.8 | GO:0032437 | cuticular plate(GO:0032437) |
| 0.3 | 2.0 | GO:0060091 | kinocilium(GO:0060091) |
| 0.3 | 1.8 | GO:0033256 | I-kappaB/NF-kappaB complex(GO:0033256) |
| 0.2 | 1.7 | GO:0097422 | tubular endosome(GO:0097422) |
| 0.2 | 3.5 | GO:0005640 | nuclear outer membrane(GO:0005640) |
| 0.2 | 3.2 | GO:0045180 | basal cortex(GO:0045180) |
| 0.2 | 3.0 | GO:0030126 | COPI vesicle coat(GO:0030126) |
| 0.2 | 3.1 | GO:0042101 | T cell receptor complex(GO:0042101) |
| 0.2 | 1.8 | GO:0071012 | catalytic step 1 spliceosome(GO:0071012) |
| 0.2 | 1.0 | GO:0005850 | eukaryotic translation initiation factor 2 complex(GO:0005850) |
| 0.2 | 3.5 | GO:0005665 | DNA-directed RNA polymerase II, core complex(GO:0005665) |
| 0.2 | 4.7 | GO:0035098 | ESC/E(Z) complex(GO:0035098) |
| 0.2 | 12.6 | GO:0016328 | lateral plasma membrane(GO:0016328) |
| 0.2 | 1.5 | GO:0045261 | mitochondrial proton-transporting ATP synthase complex, catalytic core F(1)(GO:0000275) proton-transporting ATP synthase complex, catalytic core F(1)(GO:0045261) |
| 0.2 | 1.0 | GO:0030688 | preribosome, small subunit precursor(GO:0030688) |
| 0.2 | 15.6 | GO:0005604 | basement membrane(GO:0005604) |
| 0.2 | 7.5 | GO:0022627 | cytosolic small ribosomal subunit(GO:0022627) |
| 0.1 | 1.7 | GO:0044232 | organelle membrane contact site(GO:0044232) |
| 0.1 | 3.6 | GO:0002102 | podosome(GO:0002102) |
| 0.1 | 7.7 | GO:0016459 | myosin complex(GO:0016459) |
| 0.1 | 1.9 | GO:0034518 | mRNA cap binding complex(GO:0005845) RNA cap binding complex(GO:0034518) |
| 0.1 | 2.8 | GO:0032839 | dendrite cytoplasm(GO:0032839) |
| 0.1 | 0.8 | GO:0042825 | TAP complex(GO:0042825) |
| 0.1 | 1.3 | GO:0008385 | IkappaB kinase complex(GO:0008385) |
| 0.1 | 0.4 | GO:0030015 | CCR4-NOT core complex(GO:0030015) |
| 0.1 | 6.4 | GO:0031985 | Golgi cisterna(GO:0031985) |
| 0.1 | 0.7 | GO:0042629 | mast cell granule(GO:0042629) |
| 0.1 | 1.5 | GO:0030877 | beta-catenin destruction complex(GO:0030877) |
| 0.1 | 4.5 | GO:0005834 | heterotrimeric G-protein complex(GO:0005834) |
| 0.1 | 9.1 | GO:0019897 | extrinsic component of plasma membrane(GO:0019897) |
| 0.1 | 3.3 | GO:0044295 | axonal growth cone(GO:0044295) |
| 0.1 | 2.8 | GO:0000788 | nuclear nucleosome(GO:0000788) |
| 0.1 | 0.7 | GO:0098536 | deuterosome(GO:0098536) |
| 0.1 | 1.9 | GO:0000930 | gamma-tubulin complex(GO:0000930) |
| 0.1 | 1.8 | GO:0032588 | trans-Golgi network membrane(GO:0032588) |
| 0.1 | 1.2 | GO:0031588 | nucleotide-activated protein kinase complex(GO:0031588) |
| 0.1 | 5.3 | GO:0016234 | inclusion body(GO:0016234) |
| 0.1 | 4.5 | GO:0005793 | endoplasmic reticulum-Golgi intermediate compartment(GO:0005793) |
| 0.1 | 1.6 | GO:0030134 | ER to Golgi transport vesicle(GO:0030134) |
| 0.1 | 3.5 | GO:0030667 | secretory granule membrane(GO:0030667) |
| 0.1 | 5.4 | GO:0030315 | T-tubule(GO:0030315) |
| 0.1 | 1.8 | GO:0031672 | A band(GO:0031672) |
| 0.1 | 3.6 | GO:0043209 | myelin sheath(GO:0043209) |
| 0.1 | 1.9 | GO:0051233 | spindle midzone(GO:0051233) |
| 0.1 | 1.4 | GO:0005697 | telomerase holoenzyme complex(GO:0005697) |
| 0.1 | 1.5 | GO:0046540 | U4/U6 x U5 tri-snRNP complex(GO:0046540) |
| 0.1 | 0.9 | GO:0071203 | WASH complex(GO:0071203) |
| 0.1 | 1.5 | GO:0030140 | trans-Golgi network transport vesicle(GO:0030140) |
| 0.1 | 8.5 | GO:0016324 | apical plasma membrane(GO:0016324) |
| 0.1 | 1.4 | GO:0045177 | apical part of cell(GO:0045177) |
| 0.1 | 0.9 | GO:0032039 | integrator complex(GO:0032039) |
| 0.1 | 0.9 | GO:0005671 | Ada2/Gcn5/Ada3 transcription activator complex(GO:0005671) |
| 0.1 | 2.9 | GO:0005882 | intermediate filament(GO:0005882) |
| 0.1 | 3.4 | GO:0005720 | nuclear heterochromatin(GO:0005720) |
| 0.1 | 2.6 | GO:0042645 | nucleoid(GO:0009295) mitochondrial nucleoid(GO:0042645) |
| 0.1 | 0.3 | GO:0032389 | MutLalpha complex(GO:0032389) |
| 0.1 | 2.8 | GO:0030136 | clathrin-coated vesicle(GO:0030136) |
| 0.1 | 1.2 | GO:0072562 | blood microparticle(GO:0072562) |
| 0.1 | 0.6 | GO:0031528 | microvillus membrane(GO:0031528) |
| 0.1 | 3.1 | GO:0030864 | cortical actin cytoskeleton(GO:0030864) |
| 0.1 | 1.3 | GO:0032420 | stereocilium(GO:0032420) |
| 0.0 | 5.5 | GO:0031225 | anchored component of membrane(GO:0031225) |
| 0.0 | 1.6 | GO:0005719 | nuclear euchromatin(GO:0005719) |
| 0.0 | 3.7 | GO:0016607 | nuclear speck(GO:0016607) |
| 0.0 | 6.6 | GO:0005802 | trans-Golgi network(GO:0005802) |
| 0.0 | 0.3 | GO:0071598 | neuronal ribonucleoprotein granule(GO:0071598) |
| 0.0 | 1.0 | GO:0043189 | NuA4 histone acetyltransferase complex(GO:0035267) H4/H2A histone acetyltransferase complex(GO:0043189) H4 histone acetyltransferase complex(GO:1902562) |
| 0.0 | 0.3 | GO:0071541 | eukaryotic translation initiation factor 3 complex, eIF3m(GO:0071541) |
| 0.0 | 0.4 | GO:0031209 | SCAR complex(GO:0031209) |
| 0.0 | 1.1 | GO:0005637 | nuclear inner membrane(GO:0005637) |
| 0.0 | 1.0 | GO:0015934 | large ribosomal subunit(GO:0015934) cytosolic large ribosomal subunit(GO:0022625) |
| 0.0 | 16.7 | GO:0009986 | cell surface(GO:0009986) |
| 0.0 | 3.3 | GO:0000784 | nuclear chromosome, telomeric region(GO:0000784) |
| 0.0 | 1.6 | GO:0005643 | nuclear pore(GO:0005643) |
| 0.0 | 1.2 | GO:0008023 | transcription elongation factor complex(GO:0008023) |
| 0.0 | 1.9 | GO:0005758 | mitochondrial intermembrane space(GO:0005758) |
| 0.0 | 3.1 | GO:0090575 | RNA polymerase II transcription factor complex(GO:0090575) |
| 0.0 | 8.1 | GO:0005667 | transcription factor complex(GO:0005667) |
| 0.0 | 4.3 | GO:0031965 | nuclear membrane(GO:0031965) |
| 0.0 | 0.3 | GO:0001741 | XY body(GO:0001741) |
| 0.0 | 1.2 | GO:0005811 | lipid particle(GO:0005811) |
| 0.0 | 1.0 | GO:0005903 | brush border(GO:0005903) |
| 0.0 | 1.3 | GO:0005746 | mitochondrial respiratory chain(GO:0005746) |
| 0.0 | 33.1 | GO:0005739 | mitochondrion(GO:0005739) |
| 0.0 | 0.2 | GO:0031011 | Ino80 complex(GO:0031011) |
| 0.0 | 0.9 | GO:0043197 | dendritic spine(GO:0043197) |
| 0.0 | 0.1 | GO:0035327 | transcriptionally active chromatin(GO:0035327) |
| 0.0 | 2.4 | GO:0005681 | spliceosomal complex(GO:0005681) |
| 0.0 | 0.8 | GO:0005581 | collagen trimer(GO:0005581) |
| 0.0 | 0.1 | GO:0016010 | dystrophin-associated glycoprotein complex(GO:0016010) glycoprotein complex(GO:0090665) |
| 0.0 | 0.2 | GO:0001917 | photoreceptor inner segment(GO:0001917) |
| 0.0 | 0.3 | GO:0030427 | site of polarized growth(GO:0030427) |
| 0.0 | 0.1 | GO:0031464 | Cul4A-RING E3 ubiquitin ligase complex(GO:0031464) |
| 0.0 | 2.9 | GO:0005764 | lytic vacuole(GO:0000323) lysosome(GO:0005764) |
Gene overrepresentation in molecular_function category:
| Log-likelihood per target | Total log-likelihood | Term | Description |
|---|---|---|---|
| 3.5 | 10.6 | GO:0005118 | sevenless binding(GO:0005118) |
| 2.2 | 6.5 | GO:0005534 | galactose binding(GO:0005534) |
| 2.0 | 7.9 | GO:0045131 | pre-mRNA branch point binding(GO:0045131) |
| 1.6 | 6.5 | GO:2001069 | glycogen binding(GO:2001069) |
| 1.6 | 6.4 | GO:0004066 | asparagine synthase (glutamine-hydrolyzing) activity(GO:0004066) |
| 1.3 | 10.7 | GO:0031432 | titin binding(GO:0031432) |
| 1.3 | 6.6 | GO:0008449 | N-acetylglucosamine-6-sulfatase activity(GO:0008449) |
| 1.3 | 6.3 | GO:0061676 | importin-alpha family protein binding(GO:0061676) |
| 1.3 | 5.1 | GO:0008802 | betaine-aldehyde dehydrogenase activity(GO:0008802) |
| 1.2 | 5.0 | GO:0034988 | Fc-gamma receptor I complex binding(GO:0034988) |
| 1.2 | 26.6 | GO:0070410 | co-SMAD binding(GO:0070410) |
| 1.2 | 8.3 | GO:0005094 | Rho GDP-dissociation inhibitor activity(GO:0005094) |
| 1.1 | 4.3 | GO:0016018 | cyclosporin A binding(GO:0016018) |
| 1.1 | 5.4 | GO:0032767 | copper-dependent protein binding(GO:0032767) |
| 1.0 | 3.1 | GO:1901611 | phosphatidylglycerol binding(GO:1901611) cardiolipin binding(GO:1901612) |
| 1.0 | 4.0 | GO:0004784 | superoxide dismutase activity(GO:0004784) oxidoreductase activity, acting on superoxide radicals as acceptor(GO:0016721) |
| 1.0 | 3.0 | GO:0000402 | open form four-way junction DNA binding(GO:0000401) crossed form four-way junction DNA binding(GO:0000402) |
| 1.0 | 7.8 | GO:0031995 | insulin-like growth factor II binding(GO:0031995) |
| 0.9 | 4.7 | GO:0017108 | 5'-flap endonuclease activity(GO:0017108) |
| 0.9 | 3.8 | GO:0008475 | procollagen-lysine 5-dioxygenase activity(GO:0008475) |
| 0.9 | 2.8 | GO:0031686 | A1 adenosine receptor binding(GO:0031686) |
| 0.9 | 3.7 | GO:0031727 | CCR2 chemokine receptor binding(GO:0031727) |
| 0.8 | 5.1 | GO:0002135 | CTP binding(GO:0002135) |
| 0.8 | 5.7 | GO:0043559 | insulin binding(GO:0043559) |
| 0.8 | 10.6 | GO:0008301 | DNA binding, bending(GO:0008301) |
| 0.8 | 9.3 | GO:0001161 | intronic transcription regulatory region sequence-specific DNA binding(GO:0001161) |
| 0.8 | 2.3 | GO:0004828 | serine-tRNA ligase activity(GO:0004828) |
| 0.7 | 3.7 | GO:0004095 | carnitine O-palmitoyltransferase activity(GO:0004095) |
| 0.7 | 2.2 | GO:0005110 | frizzled-2 binding(GO:0005110) |
| 0.7 | 2.2 | GO:0005332 | gamma-aminobutyric acid:sodium symporter activity(GO:0005332) |
| 0.7 | 6.2 | GO:0005212 | structural constituent of eye lens(GO:0005212) |
| 0.7 | 2.0 | GO:0004379 | glycylpeptide N-tetradecanoyltransferase activity(GO:0004379) |
| 0.7 | 2.0 | GO:0032052 | bile acid binding(GO:0032052) |
| 0.7 | 4.6 | GO:0043237 | laminin-1 binding(GO:0043237) |
| 0.6 | 1.9 | GO:0015038 | glutathione disulfide oxidoreductase activity(GO:0015038) protein-disulfide reductase (glutathione) activity(GO:0019153) |
| 0.6 | 8.2 | GO:0042288 | MHC class I protein binding(GO:0042288) |
| 0.6 | 4.2 | GO:0004013 | adenosylhomocysteinase activity(GO:0004013) trialkylsulfonium hydrolase activity(GO:0016802) |
| 0.6 | 3.6 | GO:0070644 | vitamin D response element binding(GO:0070644) |
| 0.6 | 2.4 | GO:0042731 | PH domain binding(GO:0042731) |
| 0.6 | 2.9 | GO:0004382 | guanosine-diphosphatase activity(GO:0004382) |
| 0.6 | 4.5 | GO:0070290 | N-acylphosphatidylethanolamine-specific phospholipase D activity(GO:0070290) |
| 0.5 | 1.6 | GO:0052740 | phosphatidylserine 1-acylhydrolase activity(GO:0052739) 1-acyl-2-lysophosphatidylserine acylhydrolase activity(GO:0052740) |
| 0.5 | 1.6 | GO:0035575 | histone demethylase activity (H4-K20 specific)(GO:0035575) |
| 0.5 | 11.9 | GO:0005528 | macrolide binding(GO:0005527) FK506 binding(GO:0005528) |
| 0.5 | 3.6 | GO:0055131 | C3HC4-type RING finger domain binding(GO:0055131) |
| 0.5 | 5.6 | GO:0034943 | acyl-CoA ligase activity(GO:0003996) 3-oxo-2-(2'-pentenyl)cyclopentane-1-octanoic acid CoA ligase activity(GO:0010435) 3-isopropenyl-6-oxoheptanoyl-CoA synthetase activity(GO:0018854) 2-oxo-delta3-4,5,5-trimethylcyclopentenylacetyl-CoA synthetase activity(GO:0018855) benzoyl acetate-CoA ligase activity(GO:0018856) 2,4-dichlorobenzoate-CoA ligase activity(GO:0018857) pivalate-CoA ligase activity(GO:0034783) cyclopropanecarboxylate-CoA ligase activity(GO:0034793) adipate-CoA ligase activity(GO:0034796) citronellyl-CoA ligase activity(GO:0034823) mentha-1,3-dione-CoA ligase activity(GO:0034841) thiophene-2-carboxylate-CoA ligase activity(GO:0034842) 2,4,4-trimethylpentanoate-CoA ligase activity(GO:0034865) cis-2-methyl-5-isopropylhexa-2,5-dienoate-CoA ligase activity(GO:0034942) trans-2-methyl-5-isopropylhexa-2,5-dienoate-CoA ligase activity(GO:0034943) branched-chain acyl-CoA synthetase (ADP-forming) activity(GO:0043759) aryl-CoA synthetase (ADP-forming) activity(GO:0043762) 3-hydroxypropionyl-CoA synthetase activity(GO:0043955) perillic acid:CoA ligase (ADP-forming) activity(GO:0052685) perillic acid:CoA ligase (AMP-forming) activity(GO:0052686) (3R)-3-isopropenyl-6-oxoheptanoate:CoA ligase (ADP-forming) activity(GO:0052687) (3R)-3-isopropenyl-6-oxoheptanoate:CoA ligase (AMP-forming) activity(GO:0052688) pristanate-CoA ligase activity(GO:0070251) malonyl-CoA synthetase activity(GO:0090409) |
| 0.5 | 1.5 | GO:0004140 | dephospho-CoA kinase activity(GO:0004140) |
| 0.5 | 8.0 | GO:0015129 | lactate transmembrane transporter activity(GO:0015129) |
| 0.5 | 7.5 | GO:0019855 | calcium channel inhibitor activity(GO:0019855) |
| 0.5 | 1.5 | GO:0008823 | cupric reductase activity(GO:0008823) ferric-chelate reductase (NADPH) activity(GO:0052851) |
| 0.5 | 3.3 | GO:0036402 | proteasome-activating ATPase activity(GO:0036402) |
| 0.5 | 3.3 | GO:0015016 | [heparan sulfate]-glucosamine N-sulfotransferase activity(GO:0015016) |
| 0.5 | 3.3 | GO:0032554 | purine deoxyribonucleotide binding(GO:0032554) |
| 0.5 | 4.5 | GO:0042301 | phosphate ion binding(GO:0042301) |
| 0.4 | 2.7 | GO:0004897 | ciliary neurotrophic factor receptor activity(GO:0004897) |
| 0.4 | 11.6 | GO:0071837 | HMG box domain binding(GO:0071837) |
| 0.4 | 4.3 | GO:0001055 | RNA polymerase II activity(GO:0001055) |
| 0.4 | 3.0 | GO:0035174 | histone serine kinase activity(GO:0035174) |
| 0.4 | 1.7 | GO:0070883 | pre-miRNA binding(GO:0070883) |
| 0.4 | 5.0 | GO:0070097 | delta-catenin binding(GO:0070097) |
| 0.4 | 9.2 | GO:0016676 | cytochrome-c oxidase activity(GO:0004129) heme-copper terminal oxidase activity(GO:0015002) oxidoreductase activity, acting on a heme group of donors, oxygen as acceptor(GO:0016676) |
| 0.4 | 2.8 | GO:0031419 | cobalamin binding(GO:0031419) |
| 0.4 | 3.2 | GO:0035242 | protein-arginine omega-N asymmetric methyltransferase activity(GO:0035242) |
| 0.4 | 2.3 | GO:0031957 | very long-chain fatty acid-CoA ligase activity(GO:0031957) |
| 0.4 | 3.4 | GO:0004634 | phosphopyruvate hydratase activity(GO:0004634) |
| 0.4 | 4.1 | GO:0016151 | nickel cation binding(GO:0016151) |
| 0.4 | 3.7 | GO:0008474 | palmitoyl-(protein) hydrolase activity(GO:0008474) palmitoyl hydrolase activity(GO:0098599) |
| 0.4 | 3.3 | GO:0004128 | cytochrome-b5 reductase activity, acting on NAD(P)H(GO:0004128) |
| 0.4 | 5.1 | GO:0022889 | L-serine transmembrane transporter activity(GO:0015194) serine transmembrane transporter activity(GO:0022889) |
| 0.4 | 5.8 | GO:0008307 | structural constituent of muscle(GO:0008307) |
| 0.4 | 1.1 | GO:0047066 | phospholipid-hydroperoxide glutathione peroxidase activity(GO:0047066) |
| 0.4 | 1.4 | GO:0042806 | fucose binding(GO:0042806) |
| 0.3 | 16.1 | GO:0097472 | cyclin-dependent protein serine/threonine kinase activity(GO:0004693) cyclin-dependent protein kinase activity(GO:0097472) |
| 0.3 | 10.1 | GO:0005112 | Notch binding(GO:0005112) |
| 0.3 | 3.0 | GO:0034713 | type I transforming growth factor beta receptor binding(GO:0034713) |
| 0.3 | 5.3 | GO:0009982 | pseudouridine synthase activity(GO:0009982) |
| 0.3 | 6.8 | GO:0001784 | phosphotyrosine binding(GO:0001784) |
| 0.3 | 1.5 | GO:0016176 | superoxide-generating NADPH oxidase activator activity(GO:0016176) |
| 0.3 | 1.8 | GO:0047276 | N-acetyllactosaminide 3-alpha-galactosyltransferase activity(GO:0047276) |
| 0.3 | 1.8 | GO:1990932 | 5.8S rRNA binding(GO:1990932) |
| 0.3 | 3.6 | GO:1990226 | histone methyltransferase binding(GO:1990226) |
| 0.3 | 1.2 | GO:0003810 | protein-glutamine gamma-glutamyltransferase activity(GO:0003810) |
| 0.3 | 1.7 | GO:0005173 | stem cell factor receptor binding(GO:0005173) |
| 0.3 | 1.1 | GO:0071987 | WD40-repeat domain binding(GO:0071987) |
| 0.3 | 1.1 | GO:1990460 | leptin receptor binding(GO:1990460) |
| 0.3 | 3.6 | GO:0000983 | transcription factor activity, RNA polymerase II core promoter sequence-specific(GO:0000983) |
| 0.3 | 1.4 | GO:0008392 | arachidonic acid monooxygenase activity(GO:0008391) arachidonic acid epoxygenase activity(GO:0008392) |
| 0.3 | 3.3 | GO:0034946 | 2-oxoglutaryl-CoA thioesterase activity(GO:0034843) 2,4,4-trimethyl-3-oxopentanoyl-CoA thioesterase activity(GO:0034869) 3-isopropylbut-3-enoyl-CoA thioesterase activity(GO:0034946) glutaryl-CoA hydrolase activity(GO:0044466) |
| 0.3 | 0.8 | GO:0019770 | IgG receptor activity(GO:0019770) |
| 0.3 | 1.3 | GO:0004656 | procollagen-proline 4-dioxygenase activity(GO:0004656) |
| 0.3 | 1.1 | GO:0008073 | ornithine decarboxylase inhibitor activity(GO:0008073) |
| 0.3 | 4.4 | GO:0010485 | H4 histone acetyltransferase activity(GO:0010485) |
| 0.3 | 1.8 | GO:0019788 | NEDD8 transferase activity(GO:0019788) |
| 0.2 | 2.0 | GO:0000182 | rDNA binding(GO:0000182) |
| 0.2 | 1.5 | GO:1990829 | C-rich single-stranded DNA binding(GO:1990829) |
| 0.2 | 8.6 | GO:0030291 | protein serine/threonine kinase inhibitor activity(GO:0030291) |
| 0.2 | 4.2 | GO:0005540 | hyaluronic acid binding(GO:0005540) |
| 0.2 | 1.4 | GO:0001758 | retinal dehydrogenase activity(GO:0001758) 3-chloroallyl aldehyde dehydrogenase activity(GO:0004028) |
| 0.2 | 2.0 | GO:0051018 | protein kinase A binding(GO:0051018) |
| 0.2 | 1.3 | GO:0004886 | 9-cis retinoic acid receptor activity(GO:0004886) |
| 0.2 | 2.0 | GO:0008329 | signaling pattern recognition receptor activity(GO:0008329) pattern recognition receptor activity(GO:0038187) |
| 0.2 | 1.1 | GO:0004826 | phenylalanine-tRNA ligase activity(GO:0004826) |
| 0.2 | 2.3 | GO:0003689 | DNA clamp loader activity(GO:0003689) protein-DNA loading ATPase activity(GO:0033170) |
| 0.2 | 1.0 | GO:0051022 | Rho GDP-dissociation inhibitor binding(GO:0051022) |
| 0.2 | 1.4 | GO:0005049 | nuclear export signal receptor activity(GO:0005049) |
| 0.2 | 0.6 | GO:0005124 | scavenger receptor binding(GO:0005124) |
| 0.2 | 6.5 | GO:0016538 | cyclin-dependent protein serine/threonine kinase regulator activity(GO:0016538) |
| 0.2 | 1.0 | GO:0034511 | U3 snoRNA binding(GO:0034511) |
| 0.2 | 2.9 | GO:0016805 | dipeptidase activity(GO:0016805) |
| 0.2 | 5.4 | GO:0005201 | extracellular matrix structural constituent(GO:0005201) |
| 0.2 | 3.2 | GO:0015026 | coreceptor activity(GO:0015026) |
| 0.2 | 4.1 | GO:0017049 | GTP-Rho binding(GO:0017049) |
| 0.2 | 2.9 | GO:0008519 | ammonium transmembrane transporter activity(GO:0008519) |
| 0.2 | 0.4 | GO:0042813 | Wnt-activated receptor activity(GO:0042813) |
| 0.2 | 3.1 | GO:0005078 | MAP-kinase scaffold activity(GO:0005078) |
| 0.2 | 6.5 | GO:0043027 | cysteine-type endopeptidase inhibitor activity involved in apoptotic process(GO:0043027) |
| 0.2 | 8.3 | GO:0004867 | serine-type endopeptidase inhibitor activity(GO:0004867) |
| 0.2 | 6.6 | GO:0005109 | frizzled binding(GO:0005109) |
| 0.2 | 1.0 | GO:0003854 | 3-beta-hydroxy-delta5-steroid dehydrogenase activity(GO:0003854) |
| 0.2 | 3.7 | GO:0017147 | Wnt-protein binding(GO:0017147) |
| 0.2 | 5.5 | GO:0032452 | histone demethylase activity(GO:0032452) |
| 0.2 | 6.0 | GO:0070888 | E-box binding(GO:0070888) |
| 0.2 | 0.5 | GO:0016493 | C-C chemokine receptor activity(GO:0016493) |
| 0.2 | 1.3 | GO:0016308 | 1-phosphatidylinositol-4-phosphate 5-kinase activity(GO:0016308) |
| 0.2 | 1.6 | GO:0005160 | transforming growth factor beta receptor binding(GO:0005160) |
| 0.2 | 5.4 | GO:0004364 | glutathione transferase activity(GO:0004364) |
| 0.2 | 4.8 | GO:0043014 | alpha-tubulin binding(GO:0043014) |
| 0.1 | 0.4 | GO:0001847 | opsonin receptor activity(GO:0001847) anaphylatoxin receptor activity(GO:0004942) |
| 0.1 | 2.1 | GO:0001013 | RNA polymerase I regulatory region DNA binding(GO:0001013) RNA polymerase I regulatory region sequence-specific DNA binding(GO:0001163) RNA polymerase I CORE element sequence-specific DNA binding(GO:0001164) |
| 0.1 | 1.6 | GO:0031418 | L-ascorbic acid binding(GO:0031418) |
| 0.1 | 0.4 | GO:0004647 | phosphoserine phosphatase activity(GO:0004647) |
| 0.1 | 1.9 | GO:0043024 | ribosomal small subunit binding(GO:0043024) |
| 0.1 | 0.3 | GO:0000403 | Y-form DNA binding(GO:0000403) |
| 0.1 | 1.3 | GO:0008191 | metalloendopeptidase inhibitor activity(GO:0008191) |
| 0.1 | 2.3 | GO:0032794 | GTPase activating protein binding(GO:0032794) |
| 0.1 | 1.9 | GO:0005355 | glucose transmembrane transporter activity(GO:0005355) |
| 0.1 | 3.5 | GO:0008009 | chemokine activity(GO:0008009) |
| 0.1 | 2.7 | GO:0003746 | translation elongation factor activity(GO:0003746) |
| 0.1 | 7.6 | GO:0005125 | cytokine activity(GO:0005125) |
| 0.1 | 4.3 | GO:0017069 | snRNA binding(GO:0017069) |
| 0.1 | 1.3 | GO:0001530 | lipopolysaccharide binding(GO:0001530) |
| 0.1 | 0.8 | GO:0003876 | AMP deaminase activity(GO:0003876) adenosine-phosphate deaminase activity(GO:0047623) |
| 0.1 | 0.5 | GO:0003941 | L-serine ammonia-lyase activity(GO:0003941) |
| 0.1 | 0.5 | GO:0033188 | sphingomyelin synthase activity(GO:0033188) ceramide cholinephosphotransferase activity(GO:0047493) |
| 0.1 | 0.5 | GO:0035184 | histone threonine kinase activity(GO:0035184) |
| 0.1 | 2.4 | GO:0043325 | phosphatidylinositol-3,4-bisphosphate binding(GO:0043325) |
| 0.1 | 1.2 | GO:0016208 | AMP binding(GO:0016208) |
| 0.1 | 0.4 | GO:0001224 | RNA polymerase II transcription cofactor binding(GO:0001224) RNA polymerase II transcription corepressor binding(GO:0001226) |
| 0.1 | 0.8 | GO:0001972 | retinoic acid binding(GO:0001972) |
| 0.1 | 0.5 | GO:0048495 | Roundabout binding(GO:0048495) |
| 0.1 | 3.4 | GO:0043774 | UDP-N-acetylmuramoylalanyl-D-glutamyl-2,6-diaminopimelate-D-alanyl-D-alanine ligase activity(GO:0008766) ribosomal S6-glutamic acid ligase activity(GO:0018169) coenzyme F420-0 gamma-glutamyl ligase activity(GO:0043773) coenzyme F420-2 alpha-glutamyl ligase activity(GO:0043774) protein-glycine ligase activity(GO:0070735) protein-glycine ligase activity, initiating(GO:0070736) protein-glycine ligase activity, elongating(GO:0070737) tubulin-glycine ligase activity(GO:0070738) |
| 0.1 | 0.3 | GO:0004069 | L-aspartate:2-oxoglutarate aminotransferase activity(GO:0004069) |
| 0.1 | 5.3 | GO:0003743 | translation initiation factor activity(GO:0003743) |
| 0.1 | 2.3 | GO:0003887 | DNA-directed DNA polymerase activity(GO:0003887) |
| 0.1 | 1.7 | GO:0003924 | GTPase activity(GO:0003924) |
| 0.1 | 0.2 | GO:0030249 | guanylate cyclase regulator activity(GO:0030249) |
| 0.1 | 1.4 | GO:0000400 | four-way junction DNA binding(GO:0000400) |
| 0.1 | 12.2 | GO:0051015 | actin filament binding(GO:0051015) |
| 0.1 | 0.5 | GO:0008097 | 5S rRNA binding(GO:0008097) |
| 0.1 | 4.7 | GO:0003725 | double-stranded RNA binding(GO:0003725) |
| 0.1 | 0.8 | GO:0070182 | DNA polymerase binding(GO:0070182) |
| 0.1 | 1.1 | GO:0044183 | protein binding involved in protein folding(GO:0044183) |
| 0.1 | 3.4 | GO:0019955 | cytokine binding(GO:0019955) |
| 0.1 | 18.9 | GO:0001077 | transcriptional activator activity, RNA polymerase II core promoter proximal region sequence-specific binding(GO:0001077) |
| 0.1 | 0.3 | GO:0001069 | regulatory region RNA binding(GO:0001069) |
| 0.1 | 4.5 | GO:0008083 | growth factor activity(GO:0008083) |
| 0.1 | 2.0 | GO:0016765 | transferase activity, transferring alkyl or aryl (other than methyl) groups(GO:0016765) |
| 0.1 | 1.7 | GO:0008139 | nuclear localization sequence binding(GO:0008139) |
| 0.1 | 3.5 | GO:0008186 | ATP-dependent RNA helicase activity(GO:0004004) RNA-dependent ATPase activity(GO:0008186) |
| 0.1 | 0.2 | GO:0001639 | PLC activating G-protein coupled glutamate receptor activity(GO:0001639) |
| 0.1 | 0.3 | GO:0045028 | G-protein coupled nucleotide receptor activity(GO:0001608) G-protein coupled purinergic nucleotide receptor activity(GO:0045028) |
| 0.1 | 1.8 | GO:0005504 | fatty acid binding(GO:0005504) |
| 0.1 | 0.6 | GO:0005149 | interleukin-1 receptor binding(GO:0005149) |
| 0.1 | 8.4 | GO:0008237 | metallopeptidase activity(GO:0008237) |
| 0.1 | 1.8 | GO:0051059 | NF-kappaB binding(GO:0051059) |
| 0.1 | 1.1 | GO:0036002 | pre-mRNA binding(GO:0036002) |
| 0.1 | 0.2 | GO:0071633 | dihydroceramidase activity(GO:0071633) |
| 0.1 | 2.1 | GO:0004812 | aminoacyl-tRNA ligase activity(GO:0004812) |
| 0.1 | 1.5 | GO:0001965 | G-protein alpha-subunit binding(GO:0001965) |
| 0.1 | 0.5 | GO:0045125 | bioactive lipid receptor activity(GO:0045125) |
| 0.0 | 1.1 | GO:0005234 | extracellular-glutamate-gated ion channel activity(GO:0005234) |
| 0.0 | 9.0 | GO:0008757 | S-adenosylmethionine-dependent methyltransferase activity(GO:0008757) |
| 0.0 | 1.5 | GO:0050840 | extracellular matrix binding(GO:0050840) |
| 0.0 | 0.8 | GO:0016859 | peptidyl-prolyl cis-trans isomerase activity(GO:0003755) cis-trans isomerase activity(GO:0016859) |
| 0.0 | 4.6 | GO:0001228 | transcriptional activator activity, RNA polymerase II transcription regulatory region sequence-specific binding(GO:0001228) |
| 0.0 | 1.1 | GO:0034930 | N-acetylglucosamine 6-O-sulfotransferase activity(GO:0001517) heparan sulfate 2-O-sulfotransferase activity(GO:0004394) HNK-1 sulfotransferase activity(GO:0016232) heparan sulfate 6-O-sulfotransferase activity(GO:0017095) trans-9R,10R-dihydrodiolphenanthrene sulfotransferase activity(GO:0018721) 1-phenanthrol sulfotransferase activity(GO:0018722) 3-phenanthrol sulfotransferase activity(GO:0018723) 4-phenanthrol sulfotransferase activity(GO:0018724) trans-3,4-dihydrodiolphenanthrene sulfotransferase activity(GO:0018725) 9-phenanthrol sulfotransferase activity(GO:0018726) 2-phenanthrol sulfotransferase activity(GO:0018727) phenanthrol sulfotransferase activity(GO:0019111) 1-hydroxypyrene sulfotransferase activity(GO:0034930) proteoglycan sulfotransferase activity(GO:0050698) cholesterol sulfotransferase activity(GO:0051922) hydroxyjasmonate sulfotransferase activity(GO:0080131) |
| 0.0 | 4.5 | GO:0030165 | PDZ domain binding(GO:0030165) |
| 0.0 | 0.8 | GO:0017025 | TBP-class protein binding(GO:0017025) |
| 0.0 | 1.6 | GO:0003705 | transcription factor activity, RNA polymerase II distal enhancer sequence-specific binding(GO:0003705) |
| 0.0 | 9.3 | GO:0003735 | structural constituent of ribosome(GO:0003735) |
| 0.0 | 1.1 | GO:0050136 | NADH dehydrogenase (ubiquinone) activity(GO:0008137) NADH dehydrogenase (quinone) activity(GO:0050136) |
| 0.0 | 0.5 | GO:0008641 | small protein activating enzyme activity(GO:0008641) |
| 0.0 | 0.2 | GO:0015114 | phosphate ion transmembrane transporter activity(GO:0015114) |
| 0.0 | 0.7 | GO:0003841 | 1-acylglycerol-3-phosphate O-acyltransferase activity(GO:0003841) lysophosphatidic acid acyltransferase activity(GO:0042171) |
| 0.0 | 0.3 | GO:0031386 | protein tag(GO:0031386) |
| 0.0 | 4.7 | GO:0017137 | Rab GTPase binding(GO:0017137) |
| 0.0 | 1.7 | GO:0031593 | polyubiquitin binding(GO:0031593) |
| 0.0 | 2.7 | GO:0001078 | transcriptional repressor activity, RNA polymerase II core promoter proximal region sequence-specific binding(GO:0001078) |
| 0.0 | 0.3 | GO:0005225 | volume-sensitive anion channel activity(GO:0005225) |
| 0.0 | 0.7 | GO:0005385 | zinc ion transmembrane transporter activity(GO:0005385) |
| 0.0 | 2.8 | GO:0016627 | oxidoreductase activity, acting on the CH-CH group of donors(GO:0016627) |
| 0.0 | 0.5 | GO:0032183 | SUMO binding(GO:0032183) |
| 0.0 | 0.5 | GO:0003950 | NAD+ ADP-ribosyltransferase activity(GO:0003950) |
| 0.0 | 0.7 | GO:0042162 | telomeric DNA binding(GO:0042162) |
| 0.0 | 0.7 | GO:0019107 | myristoyltransferase activity(GO:0019107) |
| 0.0 | 0.1 | GO:0004459 | L-lactate dehydrogenase activity(GO:0004459) |
| 0.0 | 0.1 | GO:0019776 | Atg8 ligase activity(GO:0019776) |
| 0.0 | 1.2 | GO:0004252 | serine-type endopeptidase activity(GO:0004252) |
| 0.0 | 1.8 | GO:0019783 | ubiquitin-like protein-specific protease activity(GO:0019783) |
| 0.0 | 0.3 | GO:0051879 | Hsp90 protein binding(GO:0051879) |
| 0.0 | 0.7 | GO:0005518 | collagen binding(GO:0005518) |
| 0.0 | 1.0 | GO:0004722 | protein serine/threonine phosphatase activity(GO:0004722) |
| 0.0 | 0.2 | GO:0030544 | Hsp70 protein binding(GO:0030544) |
| 0.0 | 0.2 | GO:0050253 | prenylcysteine methylesterase activity(GO:0010296) 1-oxa-2-oxocycloheptane lactonase activity(GO:0018731) sulfolactone hydrolase activity(GO:0018732) butyrolactone hydrolase activity(GO:0018734) endosulfan lactone lactonase activity(GO:0034892) L-ascorbate 6-phosphate lactonase activity(GO:0035460) Ser-tRNA(Thr) hydrolase activity(GO:0043905) Ala-tRNA(Pro) hydrolase activity(GO:0043906) Cys-tRNA(Pro) hydrolase activity(GO:0043907) Ser(Gly)-tRNA(Ala) hydrolase activity(GO:0043908) all-trans-retinyl-palmitate hydrolase, all-trans-retinol forming activity(GO:0047376) retinyl-palmitate esterase activity(GO:0050253) mannosyl-oligosaccharide 1,6-alpha-mannosidase activity(GO:0052767) mannosyl-oligosaccharide 1,3-alpha-mannosidase activity(GO:0052768) methyl indole-3-acetate esterase activity(GO:0080030) methyl salicylate esterase activity(GO:0080031) methyl jasmonate esterase activity(GO:0080032) |
| 0.0 | 0.0 | GO:0052658 | inositol-1,4,5-trisphosphate 5-phosphatase activity(GO:0052658) |
| 0.0 | 0.8 | GO:0003697 | single-stranded DNA binding(GO:0003697) |
| 0.0 | 0.5 | GO:0003727 | single-stranded RNA binding(GO:0003727) |
| 0.0 | 0.0 | GO:0003956 | NAD(P)+-protein-arginine ADP-ribosyltransferase activity(GO:0003956) |