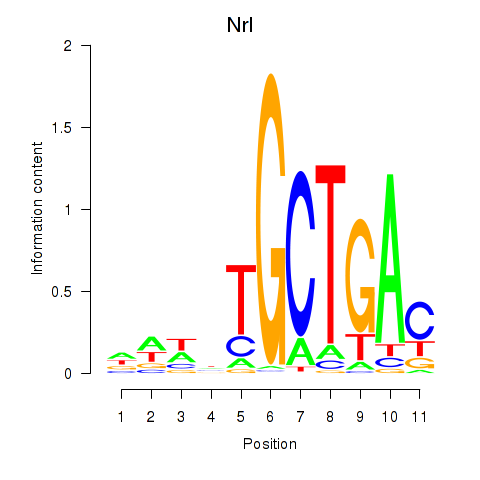
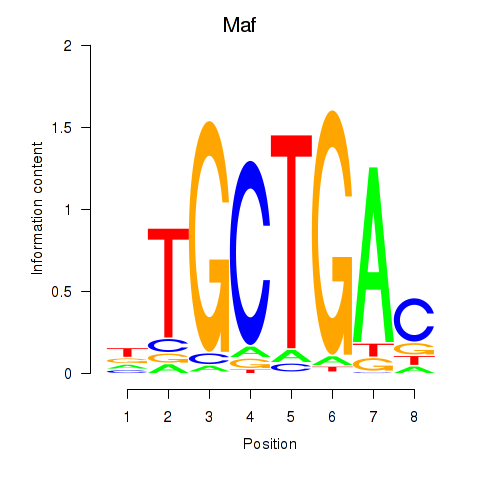
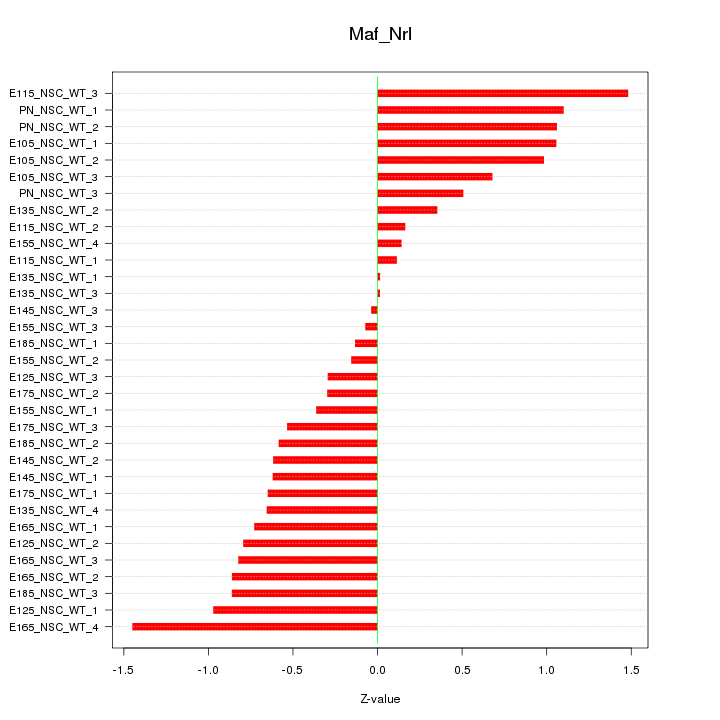
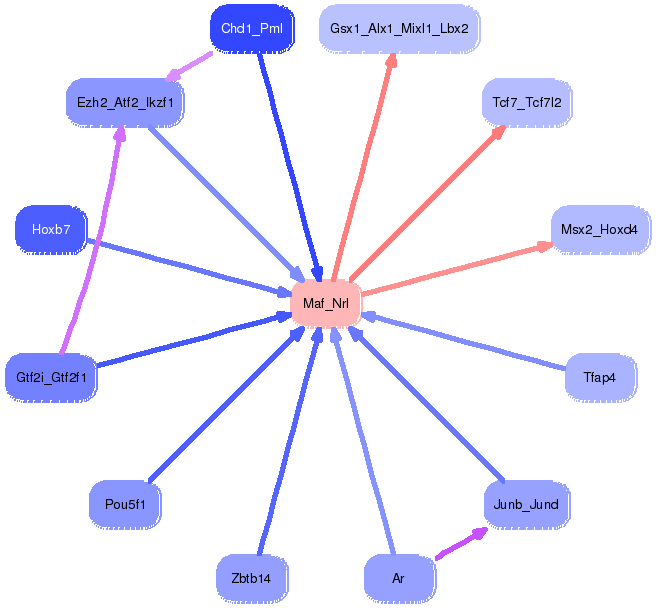
Motif ID: Maf_Nrl
Z-value: 0.707
Transcription factors associated with Maf_Nrl:
| Gene Symbol | Entrez ID | Gene Name |
|---|---|---|
| Maf | ENSMUSG00000055435.6 | Maf |
| Nrl | ENSMUSG00000040632.9 | Nrl |
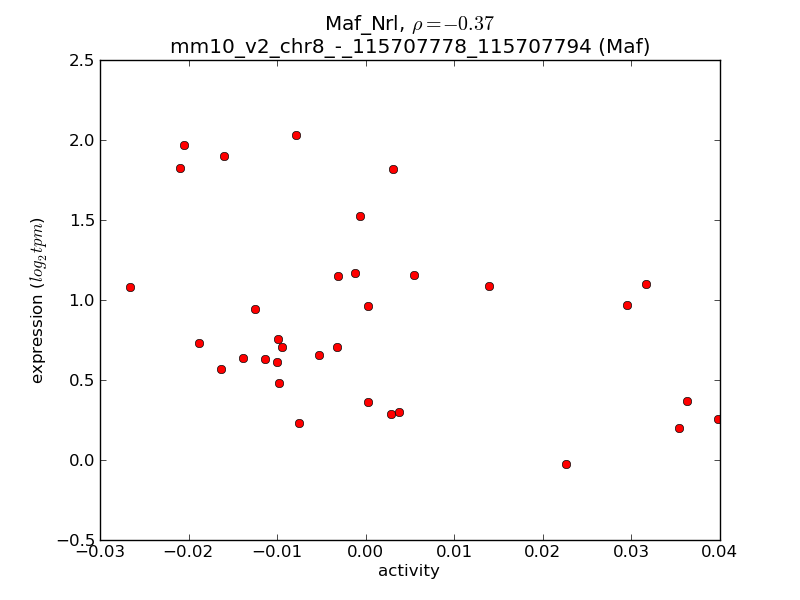
Activity-expression correlation:
| Gene Symbol | Promoter | Pearson corr. coef. | P-value | Plot |
|---|---|---|---|---|
| Maf | mm10_v2_chr8_-_115707778_115707794 | -0.37 | 3.2e-02 | Click! |


Top targets:
Gene overrepresentation in biological_process category:
| Log-likelihood per target | Total log-likelihood | Term | Description |
|---|---|---|---|
| 2.8 | 13.8 | GO:0015671 | oxygen transport(GO:0015671) |
| 1.6 | 4.8 | GO:0070315 | G1 to G0 transition involved in cell differentiation(GO:0070315) |
| 1.5 | 6.2 | GO:0060741 | prostate gland stromal morphogenesis(GO:0060741) |
| 0.9 | 2.8 | GO:0003104 | positive regulation of glomerular filtration(GO:0003104) cell communication by chemical coupling(GO:0010643) |
| 0.8 | 2.3 | GO:0048014 | Tie signaling pathway(GO:0048014) |
| 0.6 | 2.5 | GO:0042905 | 9-cis-retinoic acid biosynthetic process(GO:0042904) 9-cis-retinoic acid metabolic process(GO:0042905) |
| 0.5 | 1.6 | GO:0048818 | embryonic nail plate morphogenesis(GO:0035880) positive regulation of hair follicle maturation(GO:0048818) positive regulation of catagen(GO:0051795) frontal suture morphogenesis(GO:0060364) |
| 0.4 | 3.9 | GO:0021984 | adenohypophysis development(GO:0021984) |
| 0.4 | 1.3 | GO:1903225 | negative regulation of endodermal cell differentiation(GO:1903225) |
| 0.4 | 1.1 | GO:0060596 | mammary placode formation(GO:0060596) |
| 0.4 | 3.4 | GO:0061436 | establishment of skin barrier(GO:0061436) |
| 0.4 | 1.1 | GO:0051892 | negative regulation of cardioblast differentiation(GO:0051892) |
| 0.4 | 1.4 | GO:1900623 | positive regulation of keratinocyte proliferation(GO:0010838) positive regulation of hyaluronan biosynthetic process(GO:1900127) regulation of monocyte aggregation(GO:1900623) positive regulation of monocyte aggregation(GO:1900625) |
| 0.3 | 2.2 | GO:0048625 | myoblast fate commitment(GO:0048625) |
| 0.3 | 1.7 | GO:2000210 | positive regulation of anoikis(GO:2000210) |
| 0.3 | 0.8 | GO:0030070 | insulin processing(GO:0030070) |
| 0.3 | 2.2 | GO:0042573 | retinoic acid metabolic process(GO:0042573) |
| 0.2 | 2.2 | GO:0060770 | negative regulation of epithelial cell proliferation involved in prostate gland development(GO:0060770) |
| 0.2 | 1.5 | GO:0051461 | protein import into peroxisome matrix, docking(GO:0016560) regulation of corticotropin secretion(GO:0051459) positive regulation of corticotropin secretion(GO:0051461) |
| 0.2 | 0.6 | GO:0015920 | regulation of phosphatidylcholine catabolic process(GO:0010899) lipopolysaccharide transport(GO:0015920) |
| 0.2 | 0.6 | GO:2000670 | positive regulation of dendritic cell apoptotic process(GO:2000670) |
| 0.2 | 1.1 | GO:0090383 | phagosome acidification(GO:0090383) |
| 0.2 | 0.8 | GO:0021764 | amygdala development(GO:0021764) |
| 0.2 | 0.8 | GO:0038018 | Wnt receptor catabolic process(GO:0038018) |
| 0.1 | 0.4 | GO:0048496 | maintenance of organ identity(GO:0048496) |
| 0.1 | 0.4 | GO:0001830 | trophectodermal cell fate commitment(GO:0001830) |
| 0.1 | 0.4 | GO:0032962 | positive regulation of inositol trisphosphate biosynthetic process(GO:0032962) |
| 0.1 | 0.4 | GO:0040009 | regulation of growth rate(GO:0040009) protein poly-ADP-ribosylation(GO:0070212) |
| 0.1 | 0.4 | GO:0021577 | hindbrain structural organization(GO:0021577) cerebellum structural organization(GO:0021589) |
| 0.1 | 2.2 | GO:0071577 | zinc II ion transmembrane transport(GO:0071577) |
| 0.1 | 0.7 | GO:0042795 | snRNA transcription from RNA polymerase II promoter(GO:0042795) |
| 0.1 | 0.4 | GO:0001550 | ovarian cumulus expansion(GO:0001550) fused antrum stage(GO:0048165) |
| 0.1 | 0.8 | GO:0007406 | negative regulation of neuroblast proliferation(GO:0007406) |
| 0.1 | 0.6 | GO:2000672 | negative regulation of motor neuron apoptotic process(GO:2000672) |
| 0.1 | 0.3 | GO:0046900 | tetrahydrofolylpolyglutamate metabolic process(GO:0046900) |
| 0.1 | 2.0 | GO:0090005 | negative regulation of establishment of protein localization to plasma membrane(GO:0090005) |
| 0.1 | 0.5 | GO:0010701 | positive regulation of norepinephrine secretion(GO:0010701) |
| 0.1 | 0.6 | GO:0006027 | glycosaminoglycan catabolic process(GO:0006027) |
| 0.1 | 1.0 | GO:0036123 | histone H3-K9 dimethylation(GO:0036123) |
| 0.1 | 0.8 | GO:0006003 | fructose 2,6-bisphosphate metabolic process(GO:0006003) |
| 0.1 | 0.2 | GO:0035910 | ascending aorta development(GO:0035905) ascending aorta morphogenesis(GO:0035910) |
| 0.1 | 0.3 | GO:0001661 | conditioned taste aversion(GO:0001661) |
| 0.1 | 0.7 | GO:0060665 | regulation of branching involved in salivary gland morphogenesis by mesenchymal-epithelial signaling(GO:0060665) |
| 0.1 | 0.2 | GO:0002554 | serotonin secretion by platelet(GO:0002554) interleukin-3 production(GO:0032632) beta selection(GO:0043366) |
| 0.1 | 0.3 | GO:2000271 | positive regulation of fibroblast apoptotic process(GO:2000271) |
| 0.1 | 0.5 | GO:0032782 | bile acid secretion(GO:0032782) positive regulation of peroxisome proliferator activated receptor signaling pathway(GO:0035360) |
| 0.1 | 0.2 | GO:0032513 | negative regulation of protein phosphatase type 2B activity(GO:0032513) |
| 0.1 | 1.1 | GO:0050849 | negative regulation of calcium-mediated signaling(GO:0050849) |
| 0.1 | 0.4 | GO:2001270 | regulation of cysteine-type endopeptidase activity involved in execution phase of apoptosis(GO:2001270) |
| 0.1 | 0.3 | GO:1901165 | positive regulation of trophoblast cell migration(GO:1901165) |
| 0.1 | 1.3 | GO:0042517 | positive regulation of tyrosine phosphorylation of Stat3 protein(GO:0042517) |
| 0.1 | 1.0 | GO:0048387 | negative regulation of retinoic acid receptor signaling pathway(GO:0048387) |
| 0.1 | 0.2 | GO:0015960 | diadenosine polyphosphate biosynthetic process(GO:0015960) diadenosine tetraphosphate metabolic process(GO:0015965) diadenosine tetraphosphate biosynthetic process(GO:0015966) |
| 0.1 | 0.2 | GO:0015712 | hexose phosphate transport(GO:0015712) glucose-6-phosphate transport(GO:0015760) phosphate ion transmembrane transport(GO:0035435) |
| 0.1 | 1.0 | GO:0070050 | neuron cellular homeostasis(GO:0070050) |
| 0.1 | 0.4 | GO:2001269 | positive regulation of cysteine-type endopeptidase activity involved in apoptotic signaling pathway(GO:2001269) |
| 0.1 | 0.3 | GO:0042256 | mature ribosome assembly(GO:0042256) |
| 0.1 | 0.2 | GO:0003345 | proepicardium cell migration involved in pericardium morphogenesis(GO:0003345) |
| 0.1 | 0.2 | GO:2000427 | positive regulation of apoptotic cell clearance(GO:2000427) |
| 0.1 | 0.3 | GO:0030644 | cellular chloride ion homeostasis(GO:0030644) |
| 0.1 | 0.6 | GO:0051001 | negative regulation of nitric-oxide synthase activity(GO:0051001) |
| 0.0 | 0.2 | GO:0021506 | anterior neuropore closure(GO:0021506) neuropore closure(GO:0021995) |
| 0.0 | 1.4 | GO:1902230 | negative regulation of intrinsic apoptotic signaling pathway in response to DNA damage(GO:1902230) |
| 0.0 | 0.2 | GO:0060032 | notochord regression(GO:0060032) |
| 0.0 | 0.1 | GO:0034392 | negative regulation of smooth muscle cell apoptotic process(GO:0034392) |
| 0.0 | 1.3 | GO:0032467 | positive regulation of cytokinesis(GO:0032467) |
| 0.0 | 0.1 | GO:1901731 | calcium-mediated signaling using extracellular calcium source(GO:0035585) positive regulation of platelet aggregation(GO:1901731) |
| 0.0 | 0.4 | GO:1902231 | positive regulation of intrinsic apoptotic signaling pathway in response to DNA damage(GO:1902231) |
| 0.0 | 0.6 | GO:0090136 | epithelial cell-cell adhesion(GO:0090136) |
| 0.0 | 0.3 | GO:0005513 | detection of calcium ion(GO:0005513) |
| 0.0 | 0.3 | GO:0043518 | negative regulation of DNA damage response, signal transduction by p53 class mediator(GO:0043518) |
| 0.0 | 0.7 | GO:0035873 | lactate transport(GO:0015727) lactate transmembrane transport(GO:0035873) plasma membrane lactate transport(GO:0035879) |
| 0.0 | 0.9 | GO:0060216 | definitive hemopoiesis(GO:0060216) |
| 0.0 | 0.6 | GO:0042753 | positive regulation of circadian rhythm(GO:0042753) |
| 0.0 | 0.1 | GO:0038128 | ERBB2 signaling pathway(GO:0038128) |
| 0.0 | 0.4 | GO:0006829 | zinc II ion transport(GO:0006829) |
| 0.0 | 0.5 | GO:0016339 | calcium-dependent cell-cell adhesion via plasma membrane cell adhesion molecules(GO:0016339) |
| 0.0 | 1.0 | GO:0045880 | positive regulation of smoothened signaling pathway(GO:0045880) |
| 0.0 | 0.8 | GO:0007638 | mechanosensory behavior(GO:0007638) |
| 0.0 | 0.7 | GO:0046856 | phosphatidylinositol dephosphorylation(GO:0046856) |
| 0.0 | 2.2 | GO:0050885 | neuromuscular process controlling balance(GO:0050885) |
| 0.0 | 0.1 | GO:0010511 | serotonin receptor signaling pathway(GO:0007210) regulation of phosphatidylinositol biosynthetic process(GO:0010511) |
| 0.0 | 0.5 | GO:0009303 | rRNA transcription(GO:0009303) |
| 0.0 | 1.0 | GO:0019915 | lipid storage(GO:0019915) |
| 0.0 | 0.1 | GO:0001827 | inner cell mass cell fate commitment(GO:0001827) |
| 0.0 | 0.1 | GO:0007258 | JUN phosphorylation(GO:0007258) |
| 0.0 | 0.3 | GO:0043248 | proteasome assembly(GO:0043248) |
| 0.0 | 0.4 | GO:0000423 | macromitophagy(GO:0000423) mitophagy in response to mitochondrial depolarization(GO:0098779) response to mitochondrial depolarisation(GO:0098780) |
| 0.0 | 0.2 | GO:0090244 | Wnt signaling pathway involved in somitogenesis(GO:0090244) |
| 0.0 | 0.5 | GO:0035886 | vascular smooth muscle cell differentiation(GO:0035886) |
| 0.0 | 0.1 | GO:0060838 | lymphatic endothelial cell fate commitment(GO:0060838) regulation of transcription involved in lymphatic endothelial cell fate commitment(GO:0060849) |
| 0.0 | 0.2 | GO:0032486 | Rap protein signal transduction(GO:0032486) |
| 0.0 | 0.3 | GO:0045722 | positive regulation of gluconeogenesis(GO:0045722) |
| 0.0 | 1.2 | GO:0006888 | ER to Golgi vesicle-mediated transport(GO:0006888) |
| 0.0 | 0.5 | GO:0031365 | N-terminal protein amino acid modification(GO:0031365) |
| 0.0 | 0.1 | GO:0033184 | positive regulation of histone ubiquitination(GO:0033184) |
| 0.0 | 0.7 | GO:0051489 | regulation of filopodium assembly(GO:0051489) |
| 0.0 | 0.5 | GO:0070979 | protein K11-linked ubiquitination(GO:0070979) |
| 0.0 | 0.3 | GO:0051044 | positive regulation of membrane protein ectodomain proteolysis(GO:0051044) |
| 0.0 | 0.5 | GO:0006739 | NADP metabolic process(GO:0006739) |
| 0.0 | 0.4 | GO:0006099 | tricarboxylic acid cycle(GO:0006099) |
| 0.0 | 0.2 | GO:0046929 | negative regulation of neurotransmitter secretion(GO:0046929) |
| 0.0 | 0.1 | GO:0040016 | embryonic cleavage(GO:0040016) |
| 0.0 | 0.1 | GO:0007603 | phototransduction, visible light(GO:0007603) |
| 0.0 | 0.2 | GO:0070584 | mitochondrion morphogenesis(GO:0070584) |
| 0.0 | 0.7 | GO:0006446 | regulation of translational initiation(GO:0006446) |
| 0.0 | 0.2 | GO:0006744 | ubiquinone biosynthetic process(GO:0006744) |
| 0.0 | 0.1 | GO:0035562 | negative regulation of chromatin binding(GO:0035562) |
| 0.0 | 0.6 | GO:0042633 | molting cycle(GO:0042303) hair cycle(GO:0042633) |
Gene overrepresentation in cellular_component category:
| Log-likelihood per target | Total log-likelihood | Term | Description |
|---|---|---|---|
| 1.7 | 13.8 | GO:0005833 | hemoglobin complex(GO:0005833) |
| 1.2 | 4.9 | GO:0036454 | insulin-like growth factor binding protein complex(GO:0016942) growth factor complex(GO:0036454) insulin-like growth factor ternary complex(GO:0042567) |
| 0.4 | 1.3 | GO:0005588 | collagen type V trimer(GO:0005588) |
| 0.4 | 1.5 | GO:0017071 | intracellular cyclic nucleotide activated cation channel complex(GO:0017071) |
| 0.3 | 2.2 | GO:0071664 | beta-catenin-TCF7L2 complex(GO:0070369) catenin-TCF7L2 complex(GO:0071664) |
| 0.3 | 3.4 | GO:0005916 | fascia adherens(GO:0005916) |
| 0.3 | 0.8 | GO:0043540 | 6-phosphofructo-2-kinase/fructose-2,6-biphosphatase complex(GO:0043540) |
| 0.2 | 1.0 | GO:0033553 | rDNA heterochromatin(GO:0033553) |
| 0.1 | 0.4 | GO:0097543 | ciliary inversin compartment(GO:0097543) |
| 0.1 | 1.2 | GO:0030008 | TRAPP complex(GO:0030008) |
| 0.1 | 1.8 | GO:0043203 | axon hillock(GO:0043203) |
| 0.1 | 0.4 | GO:0005940 | septin ring(GO:0005940) |
| 0.1 | 1.3 | GO:0030057 | desmosome(GO:0030057) |
| 0.1 | 0.7 | GO:0016281 | eukaryotic translation initiation factor 4F complex(GO:0016281) |
| 0.1 | 0.2 | GO:0044299 | C-fiber(GO:0044299) |
| 0.1 | 0.5 | GO:0046581 | intercellular canaliculus(GO:0046581) |
| 0.1 | 1.1 | GO:0016010 | dystrophin-associated glycoprotein complex(GO:0016010) glycoprotein complex(GO:0090665) |
| 0.1 | 0.8 | GO:0031045 | dense core granule(GO:0031045) |
| 0.1 | 0.2 | GO:0019815 | B cell receptor complex(GO:0019815) |
| 0.1 | 0.7 | GO:0008250 | oligosaccharyltransferase complex(GO:0008250) |
| 0.1 | 0.3 | GO:0048787 | presynaptic active zone membrane(GO:0048787) |
| 0.0 | 0.5 | GO:0070761 | pre-snoRNP complex(GO:0070761) |
| 0.0 | 0.6 | GO:0031528 | microvillus membrane(GO:0031528) |
| 0.0 | 0.4 | GO:0034709 | methylosome(GO:0034709) |
| 0.0 | 0.1 | GO:0044302 | dentate gyrus mossy fiber(GO:0044302) |
| 0.0 | 0.4 | GO:0045252 | oxoglutarate dehydrogenase complex(GO:0045252) |
| 0.0 | 2.0 | GO:0009925 | basal plasma membrane(GO:0009925) |
| 0.0 | 3.3 | GO:0030315 | T-tubule(GO:0030315) |
| 0.0 | 0.9 | GO:0002102 | podosome(GO:0002102) |
| 0.0 | 0.1 | GO:0031095 | platelet dense tubular network membrane(GO:0031095) |
| 0.0 | 0.4 | GO:0034663 | endoplasmic reticulum chaperone complex(GO:0034663) |
| 0.0 | 0.1 | GO:0070436 | Grb2-EGFR complex(GO:0070436) |
| 0.0 | 0.1 | GO:0002193 | MAML1-RBP-Jkappa- ICN1 complex(GO:0002193) |
| 0.0 | 0.4 | GO:0016327 | apicolateral plasma membrane(GO:0016327) |
| 0.0 | 0.4 | GO:0035631 | CD40 receptor complex(GO:0035631) |
| 0.0 | 0.6 | GO:0032839 | dendrite cytoplasm(GO:0032839) |
| 0.0 | 0.6 | GO:0016581 | NuRD complex(GO:0016581) CHD-type complex(GO:0090545) |
| 0.0 | 1.1 | GO:0045335 | phagocytic vesicle(GO:0045335) |
| 0.0 | 1.3 | GO:0005758 | mitochondrial intermembrane space(GO:0005758) |
| 0.0 | 0.3 | GO:0008305 | integrin complex(GO:0008305) protein complex involved in cell adhesion(GO:0098636) |
| 0.0 | 0.5 | GO:0032590 | dendrite membrane(GO:0032590) |
| 0.0 | 0.6 | GO:0035145 | exon-exon junction complex(GO:0035145) |
| 0.0 | 2.1 | GO:0031225 | anchored component of membrane(GO:0031225) |
| 0.0 | 2.0 | GO:0005884 | actin filament(GO:0005884) |
| 0.0 | 0.3 | GO:0005852 | eukaryotic translation initiation factor 3 complex(GO:0005852) |
| 0.0 | 1.0 | GO:0005811 | lipid particle(GO:0005811) |
| 0.0 | 0.7 | GO:0016459 | myosin complex(GO:0016459) |
| 0.0 | 0.6 | GO:0005902 | microvillus(GO:0005902) |
| 0.0 | 0.9 | GO:0005882 | intermediate filament(GO:0005882) |
| 0.0 | 0.1 | GO:0032045 | guanyl-nucleotide exchange factor complex(GO:0032045) |
| 0.0 | 0.7 | GO:0008023 | transcription elongation factor complex(GO:0008023) |
| 0.0 | 0.2 | GO:0097542 | ciliary tip(GO:0097542) |
| 0.0 | 0.3 | GO:0005838 | proteasome regulatory particle(GO:0005838) |
| 0.0 | 0.4 | GO:0030687 | preribosome, large subunit precursor(GO:0030687) |
| 0.0 | 0.1 | GO:0031313 | extrinsic component of endosome membrane(GO:0031313) |
| 0.0 | 1.1 | GO:0016363 | nuclear matrix(GO:0016363) |
| 0.0 | 0.2 | GO:0016580 | Sin3 complex(GO:0016580) |
| 0.0 | 0.6 | GO:0000118 | histone deacetylase complex(GO:0000118) |
| 0.0 | 1.7 | GO:0005770 | late endosome(GO:0005770) |
| 0.0 | 0.2 | GO:0030877 | beta-catenin destruction complex(GO:0030877) |
| 0.0 | 0.2 | GO:0033017 | sarcoplasmic reticulum membrane(GO:0033017) |
Gene overrepresentation in molecular_function category:
| Log-likelihood per target | Total log-likelihood | Term | Description |
|---|---|---|---|
| 3.5 | 13.8 | GO:0031721 | hemoglobin alpha binding(GO:0031721) |
| 0.7 | 2.2 | GO:0016494 | C-X-C chemokine receptor activity(GO:0016494) C-X-C chemokine binding(GO:0019958) |
| 0.6 | 4.8 | GO:0031432 | titin binding(GO:0031432) |
| 0.6 | 2.8 | GO:0071253 | connexin binding(GO:0071253) |
| 0.5 | 1.4 | GO:0050501 | hyaluronan synthase activity(GO:0050501) |
| 0.4 | 2.5 | GO:0001758 | retinal dehydrogenase activity(GO:0001758) 3-chloroallyl aldehyde dehydrogenase activity(GO:0004028) |
| 0.3 | 1.5 | GO:0005052 | peroxisome matrix targeting signal-1 binding(GO:0005052) |
| 0.2 | 0.7 | GO:0005105 | type 1 fibroblast growth factor receptor binding(GO:0005105) |
| 0.2 | 4.3 | GO:0004181 | metallocarboxypeptidase activity(GO:0004181) |
| 0.2 | 0.7 | GO:0034597 | phosphatidylinositol-4,5-bisphosphate 4-phosphatase activity(GO:0034597) |
| 0.2 | 1.1 | GO:0004614 | phosphoglucomutase activity(GO:0004614) |
| 0.2 | 4.9 | GO:0043539 | protein serine/threonine kinase activator activity(GO:0043539) |
| 0.2 | 0.6 | GO:0001875 | lipopolysaccharide receptor activity(GO:0001875) |
| 0.2 | 1.8 | GO:0005212 | structural constituent of eye lens(GO:0005212) |
| 0.2 | 0.7 | GO:0005008 | hepatocyte growth factor-activated receptor activity(GO:0005008) |
| 0.1 | 0.6 | GO:0016936 | galactoside binding(GO:0016936) |
| 0.1 | 1.8 | GO:0005522 | profilin binding(GO:0005522) |
| 0.1 | 0.4 | GO:0031686 | A1 adenosine receptor binding(GO:0031686) |
| 0.1 | 2.2 | GO:0004029 | aldehyde dehydrogenase (NAD) activity(GO:0004029) |
| 0.1 | 0.4 | GO:0097100 | oxidized purine nucleobase lesion DNA N-glycosylase activity(GO:0008534) supercoiled DNA binding(GO:0097100) |
| 0.1 | 1.0 | GO:0046974 | histone methyltransferase activity (H3-K9 specific)(GO:0046974) |
| 0.1 | 0.3 | GO:0001565 | phorbol ester receptor activity(GO:0001565) non-kinase phorbol ester receptor activity(GO:0001566) |
| 0.1 | 0.8 | GO:0070095 | fructose-6-phosphate binding(GO:0070095) |
| 0.1 | 0.3 | GO:0070905 | serine binding(GO:0070905) |
| 0.1 | 2.2 | GO:0045295 | gamma-catenin binding(GO:0045295) |
| 0.1 | 0.4 | GO:0032422 | purine-rich negative regulatory element binding(GO:0032422) |
| 0.1 | 2.2 | GO:0008432 | JUN kinase binding(GO:0008432) |
| 0.1 | 1.0 | GO:0008190 | eukaryotic initiation factor 4E binding(GO:0008190) |
| 0.1 | 0.7 | GO:0004579 | dolichyl-diphosphooligosaccharide-protein glycotransferase activity(GO:0004579) |
| 0.1 | 0.3 | GO:0004111 | creatine kinase activity(GO:0004111) |
| 0.1 | 0.3 | GO:0070051 | fibrinogen binding(GO:0070051) |
| 0.1 | 2.2 | GO:0005385 | zinc ion transmembrane transporter activity(GO:0005385) |
| 0.1 | 2.1 | GO:0043395 | heparan sulfate proteoglycan binding(GO:0043395) |
| 0.1 | 0.9 | GO:0035925 | mRNA 3'-UTR AU-rich region binding(GO:0035925) |
| 0.1 | 0.6 | GO:0045294 | alpha-catenin binding(GO:0045294) |
| 0.1 | 1.0 | GO:0015197 | peptide transporter activity(GO:0015197) |
| 0.1 | 0.9 | GO:0005172 | vascular endothelial growth factor receptor binding(GO:0005172) |
| 0.1 | 0.6 | GO:0017034 | Rap guanyl-nucleotide exchange factor activity(GO:0017034) |
| 0.1 | 0.5 | GO:0003958 | NADPH-hemoprotein reductase activity(GO:0003958) |
| 0.1 | 0.4 | GO:0003910 | DNA ligase activity(GO:0003909) DNA ligase (ATP) activity(GO:0003910) |
| 0.1 | 0.2 | GO:0035939 | microsatellite binding(GO:0035939) |
| 0.1 | 0.2 | GO:0031727 | CCR2 chemokine receptor binding(GO:0031727) |
| 0.0 | 0.4 | GO:0005025 | transforming growth factor beta receptor activity, type I(GO:0005025) |
| 0.0 | 0.5 | GO:1990226 | histone methyltransferase binding(GO:1990226) |
| 0.0 | 0.4 | GO:0004591 | oxoglutarate dehydrogenase (succinyl-transferring) activity(GO:0004591) |
| 0.0 | 0.2 | GO:0050347 | trans-hexaprenyltranstransferase activity(GO:0000010) trans-octaprenyltranstransferase activity(GO:0050347) |
| 0.0 | 1.2 | GO:0005070 | SH3/SH2 adaptor activity(GO:0005070) |
| 0.0 | 0.7 | GO:0015129 | lactate transmembrane transporter activity(GO:0015129) |
| 0.0 | 0.5 | GO:0015271 | outward rectifier potassium channel activity(GO:0015271) |
| 0.0 | 0.8 | GO:0005044 | scavenger receptor activity(GO:0005044) |
| 0.0 | 1.8 | GO:0004867 | serine-type endopeptidase inhibitor activity(GO:0004867) |
| 0.0 | 1.3 | GO:0005201 | extracellular matrix structural constituent(GO:0005201) |
| 0.0 | 1.4 | GO:0017112 | Rab guanyl-nucleotide exchange factor activity(GO:0017112) |
| 0.0 | 3.4 | GO:0031490 | chromatin DNA binding(GO:0031490) |
| 0.0 | 0.2 | GO:0004716 | receptor signaling protein tyrosine kinase activity(GO:0004716) |
| 0.0 | 1.2 | GO:0052771 | coenzyme F390-A hydrolase activity(GO:0052770) coenzyme F390-G hydrolase activity(GO:0052771) |
| 0.0 | 0.6 | GO:0043747 | protein-N-terminal asparagine amidohydrolase activity(GO:0008418) UDP-3-O-[3-hydroxymyristoyl] N-acetylglucosamine deacetylase activity(GO:0008759) iprodione amidohydrolase activity(GO:0018748) (3,5-dichlorophenylurea)acetate amidohydrolase activity(GO:0018749) 4'-(2-hydroxyisopropyl)phenylurea amidohydrolase activity(GO:0034571) didemethylisoproturon amidohydrolase activity(GO:0034573) N-isopropylacetanilide amidohydrolase activity(GO:0034576) N-cyclohexylformamide amidohydrolase activity(GO:0034781) isonicotinic acid hydrazide hydrolase activity(GO:0034876) cis-aconitamide amidase activity(GO:0034882) gamma-N-formylaminovinylacetate hydrolase activity(GO:0034885) N2-acetyl-L-lysine deacetylase activity(GO:0043747) O-succinylbenzoate synthase activity(GO:0043748) indoleacetamide hydrolase activity(GO:0043864) N-acetylcitrulline deacetylase activity(GO:0043909) N-acetylgalactosamine-6-phosphate deacetylase activity(GO:0047419) diacetylchitobiose deacetylase activity(GO:0052773) chitooligosaccharide deacetylase activity(GO:0052790) |
| 0.0 | 0.2 | GO:0015114 | phosphate ion transmembrane transporter activity(GO:0015114) |
| 0.0 | 1.1 | GO:0004177 | aminopeptidase activity(GO:0004177) |
| 0.0 | 1.7 | GO:0004714 | transmembrane receptor protein tyrosine kinase activity(GO:0004714) |
| 0.0 | 0.4 | GO:0008327 | methyl-CpG binding(GO:0008327) |
| 0.0 | 4.4 | GO:0001227 | transcriptional repressor activity, RNA polymerase II transcription regulatory region sequence-specific binding(GO:0001227) |
| 0.0 | 0.6 | GO:0031435 | mitogen-activated protein kinase kinase kinase binding(GO:0031435) |
| 0.0 | 0.2 | GO:0005540 | hyaluronic acid binding(GO:0005540) |
| 0.0 | 0.3 | GO:0015269 | calcium-activated potassium channel activity(GO:0015269) |
| 0.0 | 0.2 | GO:0048185 | activin binding(GO:0048185) |
| 0.0 | 0.6 | GO:0046966 | thyroid hormone receptor binding(GO:0046966) |
| 0.0 | 0.1 | GO:0004993 | G-protein coupled serotonin receptor activity(GO:0004993) serotonin binding(GO:0051378) serotonin receptor activity(GO:0099589) |
| 0.0 | 0.4 | GO:0051787 | misfolded protein binding(GO:0051787) |
| 0.0 | 0.9 | GO:0030507 | spectrin binding(GO:0030507) |
| 0.0 | 0.6 | GO:0005109 | frizzled binding(GO:0005109) |
| 0.0 | 0.1 | GO:0001972 | retinoic acid binding(GO:0001972) |
| 0.0 | 0.3 | GO:0048156 | tau protein binding(GO:0048156) |
| 0.0 | 0.5 | GO:0001105 | RNA polymerase II transcription coactivator activity(GO:0001105) |
| 0.0 | 0.3 | GO:0070064 | proline-rich region binding(GO:0070064) |
| 0.0 | 1.4 | GO:0001085 | RNA polymerase II transcription factor binding(GO:0001085) |
| 0.0 | 0.5 | GO:0004812 | aminoacyl-tRNA ligase activity(GO:0004812) |
| 0.0 | 0.1 | GO:0015279 | store-operated calcium channel activity(GO:0015279) |
| 0.0 | 0.4 | GO:0050840 | extracellular matrix binding(GO:0050840) |
| 0.0 | 0.1 | GO:0045322 | unmethylated CpG binding(GO:0045322) |
| 0.0 | 0.5 | GO:0061631 | ubiquitin conjugating enzyme activity(GO:0061631) |
|
|
|
|