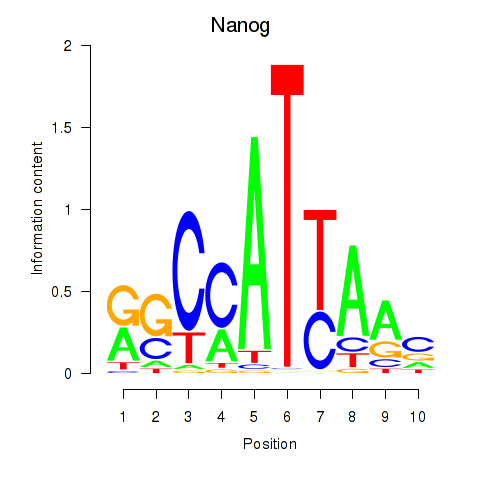
Motif ID: Nanog
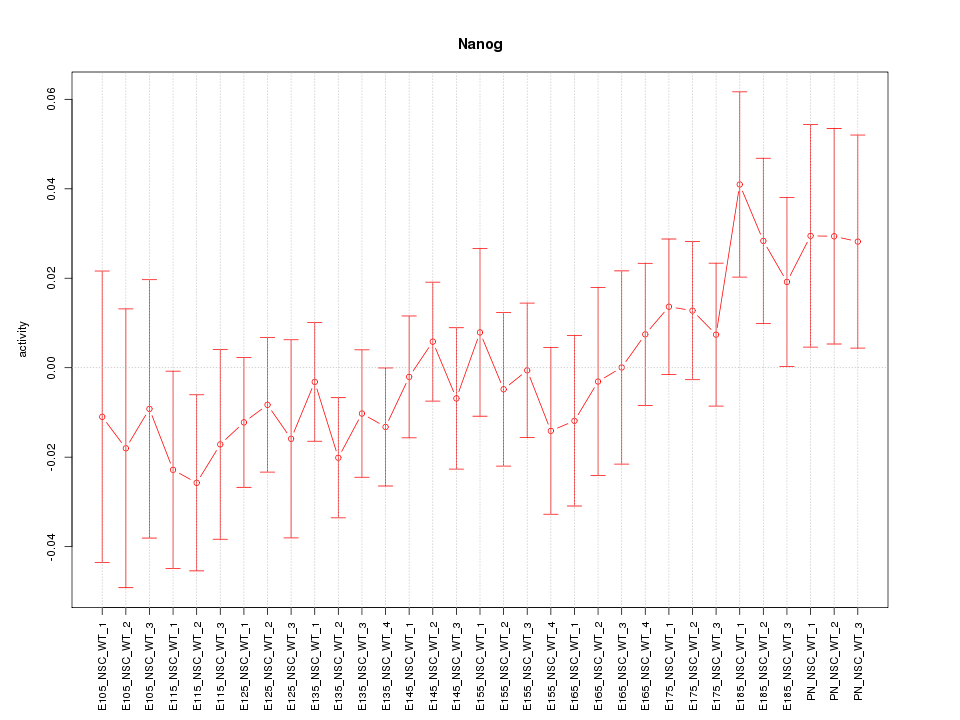
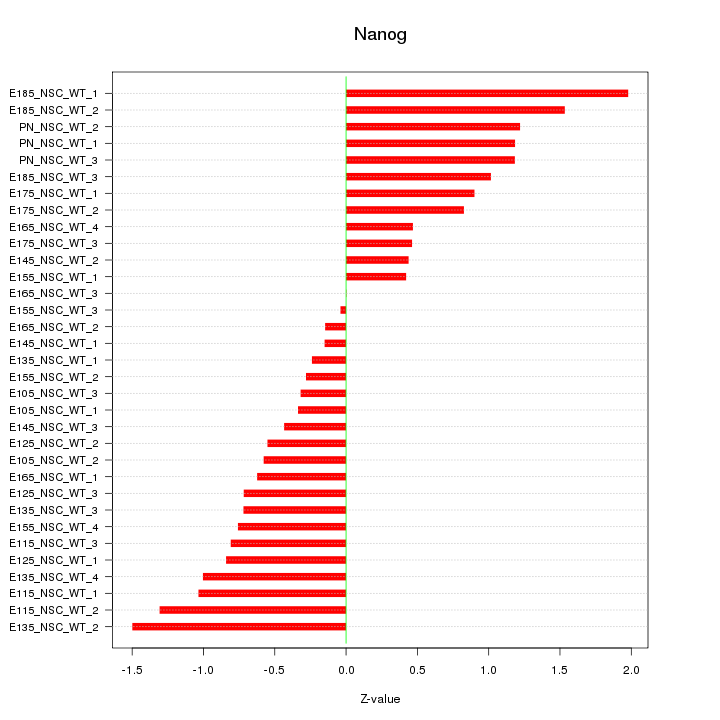
Z-value: 0.862
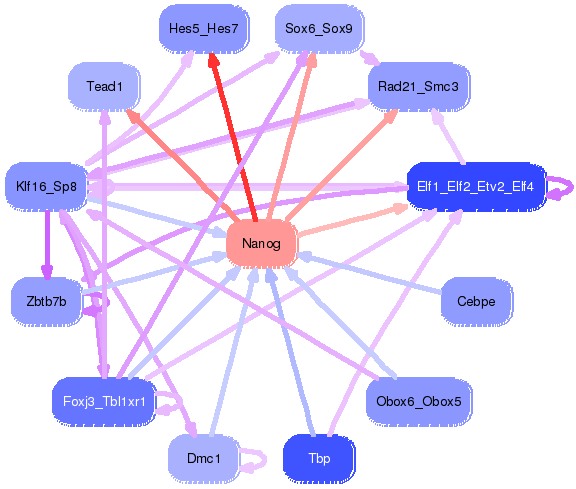
Transcription factors associated with Nanog:
| Gene Symbol | Entrez ID | Gene Name |
|---|---|---|
| Nanog | ENSMUSG00000012396.6 | Nanog |
Activity-expression correlation:
| Gene Symbol | Promoter | Pearson corr. coef. | P-value | Plot |
|---|---|---|---|---|
| Nanog | mm10_v2_chr6_+_122707489_122707608 | 0.46 | 7.3e-03 | Click! |

Top targets:
Gene overrepresentation in biological_process category:
| Log-likelihood per target | Total log-likelihood | Term | Description |
|---|---|---|---|
| 1.6 | 9.8 | GO:1902847 | macrophage proliferation(GO:0061517) microglial cell proliferation(GO:0061518) regulation of neuronal signal transduction(GO:1902847) positive regulation of tau-protein kinase activity(GO:1902949) |
| 1.2 | 4.6 | GO:2000346 | negative regulation of hepatocyte proliferation(GO:2000346) |
| 0.9 | 2.6 | GO:0002678 | positive regulation of chronic inflammatory response(GO:0002678) |
| 0.8 | 3.2 | GO:2000974 | negative regulation of pro-B cell differentiation(GO:2000974) |
| 0.7 | 4.9 | GO:0015808 | L-alanine transport(GO:0015808) |
| 0.7 | 2.7 | GO:0042360 | vitamin E metabolic process(GO:0042360) |
| 0.6 | 4.5 | GO:0015840 | urea transport(GO:0015840) urea transmembrane transport(GO:0071918) |
| 0.6 | 3.5 | GO:1902261 | positive regulation of delayed rectifier potassium channel activity(GO:1902261) positive regulation of voltage-gated potassium channel activity(GO:1903818) |
| 0.6 | 1.7 | GO:0070671 | monocyte extravasation(GO:0035696) activation of meiosis involved in egg activation(GO:0060466) response to interleukin-12(GO:0070671) positive regulation of acrosome reaction(GO:2000344) regulation of monocyte extravasation(GO:2000437) |
| 0.6 | 1.7 | GO:0019676 | ammonia assimilation cycle(GO:0019676) |
| 0.4 | 2.1 | GO:1904721 | regulation of mRNA cleavage(GO:0031437) negative regulation of mRNA cleavage(GO:0031438) negative regulation of immunoglobulin secretion(GO:0051025) negative regulation of ribonuclease activity(GO:0060701) negative regulation of endoribonuclease activity(GO:0060702) regulation of mRNA endonucleolytic cleavage involved in unfolded protein response(GO:1904720) negative regulation of mRNA endonucleolytic cleavage involved in unfolded protein response(GO:1904721) |
| 0.4 | 6.5 | GO:1901629 | regulation of presynaptic membrane organization(GO:1901629) |
| 0.4 | 1.4 | GO:0021564 | glossopharyngeal nerve development(GO:0021563) vagus nerve development(GO:0021564) |
| 0.3 | 0.6 | GO:1903895 | negative regulation of IRE1-mediated unfolded protein response(GO:1903895) |
| 0.3 | 0.9 | GO:0070649 | meiotic chromosome movement towards spindle pole(GO:0016344) formin-nucleated actin cable assembly(GO:0070649) |
| 0.3 | 1.9 | GO:0030579 | ubiquitin-dependent SMAD protein catabolic process(GO:0030579) |
| 0.3 | 1.0 | GO:0071596 | ubiquitin-dependent protein catabolic process via the N-end rule pathway(GO:0071596) |
| 0.2 | 1.2 | GO:0010991 | negative regulation of SMAD protein complex assembly(GO:0010991) |
| 0.2 | 1.6 | GO:0071361 | cellular response to ethanol(GO:0071361) |
| 0.2 | 0.7 | GO:0002447 | eosinophil activation involved in immune response(GO:0002278) eosinophil mediated immunity(GO:0002447) eosinophil degranulation(GO:0043308) |
| 0.2 | 1.1 | GO:0031915 | positive regulation of synaptic plasticity(GO:0031915) positive regulation of receptor binding(GO:1900122) |
| 0.2 | 1.0 | GO:0098735 | positive regulation of the force of heart contraction(GO:0098735) |
| 0.2 | 0.6 | GO:0030070 | insulin processing(GO:0030070) |
| 0.2 | 4.1 | GO:0001886 | endothelial cell morphogenesis(GO:0001886) |
| 0.2 | 0.7 | GO:0045113 | regulation of integrin biosynthetic process(GO:0045113) |
| 0.2 | 7.4 | GO:0007212 | dopamine receptor signaling pathway(GO:0007212) |
| 0.2 | 0.8 | GO:0014719 | skeletal muscle satellite cell activation(GO:0014719) |
| 0.2 | 0.6 | GO:2001032 | regulation of double-strand break repair via nonhomologous end joining(GO:2001032) |
| 0.2 | 0.6 | GO:0006742 | NADP catabolic process(GO:0006742) pyridine nucleotide catabolic process(GO:0019364) |
| 0.1 | 0.9 | GO:1903056 | regulation of lens fiber cell differentiation(GO:1902746) positive regulation of lens fiber cell differentiation(GO:1902748) regulation of melanosome organization(GO:1903056) |
| 0.1 | 3.4 | GO:0002091 | negative regulation of receptor internalization(GO:0002091) |
| 0.1 | 0.4 | GO:0019065 | receptor-mediated endocytosis of virus by host cell(GO:0019065) endocytosis involved in viral entry into host cell(GO:0075509) |
| 0.1 | 1.6 | GO:1900383 | regulation of synaptic plasticity by receptor localization to synapse(GO:1900383) |
| 0.1 | 1.3 | GO:0034983 | peptidyl-lysine deacetylation(GO:0034983) regulation of skeletal muscle fiber development(GO:0048742) |
| 0.1 | 0.4 | GO:0072092 | ureteric bud invasion(GO:0072092) |
| 0.1 | 1.4 | GO:0014883 | transition between fast and slow fiber(GO:0014883) positive regulation of stem cell population maintenance(GO:1902459) |
| 0.1 | 0.3 | GO:2000642 | negative regulation of early endosome to late endosome transport(GO:2000642) |
| 0.1 | 0.7 | GO:0006361 | transcription initiation from RNA polymerase I promoter(GO:0006361) termination of RNA polymerase I transcription(GO:0006363) |
| 0.1 | 0.5 | GO:0010025 | wax biosynthetic process(GO:0010025) wax metabolic process(GO:0010166) |
| 0.1 | 1.0 | GO:0035520 | monoubiquitinated protein deubiquitination(GO:0035520) |
| 0.1 | 0.7 | GO:0006621 | protein retention in ER lumen(GO:0006621) |
| 0.1 | 0.3 | GO:0010616 | negative regulation of cardiac muscle adaptation(GO:0010616) |
| 0.1 | 0.3 | GO:1904742 | protein poly-ADP-ribosylation(GO:0070212) regulation of telomeric DNA binding(GO:1904742) |
| 0.1 | 1.0 | GO:2000741 | positive regulation of mesenchymal stem cell differentiation(GO:2000741) |
| 0.1 | 0.4 | GO:0015824 | proline transport(GO:0015824) |
| 0.1 | 0.7 | GO:2000301 | negative regulation of synaptic vesicle exocytosis(GO:2000301) |
| 0.1 | 0.6 | GO:0002674 | negative regulation of acute inflammatory response(GO:0002674) |
| 0.1 | 2.7 | GO:0050873 | brown fat cell differentiation(GO:0050873) |
| 0.1 | 0.5 | GO:0035989 | tendon development(GO:0035989) |
| 0.1 | 0.9 | GO:0000083 | regulation of transcription involved in G1/S transition of mitotic cell cycle(GO:0000083) |
| 0.1 | 0.2 | GO:0006553 | lysine metabolic process(GO:0006553) |
| 0.1 | 2.3 | GO:0036075 | endochondral ossification(GO:0001958) replacement ossification(GO:0036075) |
| 0.1 | 3.2 | GO:0071300 | cellular response to retinoic acid(GO:0071300) |
| 0.1 | 0.5 | GO:0042518 | negative regulation of tyrosine phosphorylation of Stat3 protein(GO:0042518) |
| 0.1 | 3.1 | GO:0045744 | negative regulation of G-protein coupled receptor protein signaling pathway(GO:0045744) |
| 0.1 | 2.2 | GO:0097178 | ruffle assembly(GO:0097178) |
| 0.1 | 3.6 | GO:0005978 | glycogen biosynthetic process(GO:0005978) glucan biosynthetic process(GO:0009250) |
| 0.1 | 0.4 | GO:0018243 | protein O-linked glycosylation via threonine(GO:0018243) |
| 0.1 | 0.9 | GO:0071168 | protein localization to chromatin(GO:0071168) |
| 0.1 | 0.2 | GO:0001978 | regulation of systemic arterial blood pressure by carotid sinus baroreceptor feedback(GO:0001978) |
| 0.1 | 0.7 | GO:0048305 | immunoglobulin secretion(GO:0048305) |
| 0.1 | 0.4 | GO:0048169 | regulation of long-term neuronal synaptic plasticity(GO:0048169) |
| 0.0 | 0.3 | GO:0001867 | complement activation, lectin pathway(GO:0001867) |
| 0.0 | 0.6 | GO:0097186 | amelogenesis(GO:0097186) |
| 0.0 | 0.3 | GO:0001302 | replicative cell aging(GO:0001302) |
| 0.0 | 0.9 | GO:0006471 | protein ADP-ribosylation(GO:0006471) |
| 0.0 | 0.3 | GO:0006686 | sphingomyelin biosynthetic process(GO:0006686) |
| 0.0 | 0.2 | GO:0015816 | glycine transport(GO:0015816) |
| 0.0 | 1.7 | GO:0043666 | regulation of phosphoprotein phosphatase activity(GO:0043666) |
| 0.0 | 0.5 | GO:0035721 | intraciliary retrograde transport(GO:0035721) |
| 0.0 | 0.1 | GO:1900220 | semaphorin-plexin signaling pathway involved in bone trabecula morphogenesis(GO:1900220) |
| 0.0 | 0.3 | GO:0071243 | cellular response to arsenic-containing substance(GO:0071243) |
| 0.0 | 0.2 | GO:0017196 | N-terminal peptidyl-methionine acetylation(GO:0017196) |
| 0.0 | 0.8 | GO:1902043 | positive regulation of extrinsic apoptotic signaling pathway via death domain receptors(GO:1902043) |
| 0.0 | 0.4 | GO:0050858 | negative regulation of antigen receptor-mediated signaling pathway(GO:0050858) negative regulation of T cell receptor signaling pathway(GO:0050860) |
| 0.0 | 1.3 | GO:0003341 | cilium movement(GO:0003341) |
| 0.0 | 1.2 | GO:0046329 | negative regulation of JNK cascade(GO:0046329) |
| 0.0 | 0.2 | GO:0071712 | ER-associated misfolded protein catabolic process(GO:0071712) |
| 0.0 | 0.7 | GO:0010738 | regulation of protein kinase A signaling(GO:0010738) |
| 0.0 | 0.3 | GO:0035269 | protein O-linked mannosylation(GO:0035269) |
| 0.0 | 0.6 | GO:2000058 | regulation of protein ubiquitination involved in ubiquitin-dependent protein catabolic process(GO:2000058) |
| 0.0 | 1.7 | GO:0007173 | epidermal growth factor receptor signaling pathway(GO:0007173) |
| 0.0 | 0.1 | GO:1902260 | negative regulation of delayed rectifier potassium channel activity(GO:1902260) negative regulation of voltage-gated potassium channel activity(GO:1903817) |
| 0.0 | 0.1 | GO:0089711 | L-glutamate transmembrane transport(GO:0089711) |
| 0.0 | 3.0 | GO:0098780 | mitophagy in response to mitochondrial depolarization(GO:0098779) response to mitochondrial depolarisation(GO:0098780) |
| 0.0 | 1.8 | GO:0000079 | regulation of cyclin-dependent protein serine/threonine kinase activity(GO:0000079) |
| 0.0 | 1.0 | GO:0046324 | regulation of glucose import(GO:0046324) |
| 0.0 | 0.2 | GO:0000467 | exonucleolytic trimming involved in rRNA processing(GO:0000459) exonucleolytic trimming to generate mature 3'-end of 5.8S rRNA from tricistronic rRNA transcript (SSU-rRNA, 5.8S rRNA, LSU-rRNA)(GO:0000467) |
| 0.0 | 0.5 | GO:0061014 | positive regulation of mRNA catabolic process(GO:0061014) |
| 0.0 | 2.7 | GO:0008654 | phospholipid biosynthetic process(GO:0008654) |
| 0.0 | 1.4 | GO:0030148 | sphingolipid biosynthetic process(GO:0030148) |
| 0.0 | 0.5 | GO:0034723 | DNA replication-dependent nucleosome assembly(GO:0006335) DNA replication-dependent nucleosome organization(GO:0034723) |
| 0.0 | 0.4 | GO:0001829 | trophectodermal cell differentiation(GO:0001829) |
| 0.0 | 1.3 | GO:0072332 | intrinsic apoptotic signaling pathway by p53 class mediator(GO:0072332) |
| 0.0 | 0.3 | GO:0071480 | cellular response to gamma radiation(GO:0071480) |
| 0.0 | 0.4 | GO:0006376 | mRNA splice site selection(GO:0006376) |
Gene overrepresentation in cellular_component category:
| Log-likelihood per target | Total log-likelihood | Term | Description |
|---|---|---|---|
| 1.4 | 9.8 | GO:0034366 | spherical high-density lipoprotein particle(GO:0034366) neurofibrillary tangle(GO:0097418) |
| 0.5 | 2.7 | GO:0036056 | filtration diaphragm(GO:0036056) slit diaphragm(GO:0036057) |
| 0.4 | 3.6 | GO:0042587 | glycogen granule(GO:0042587) |
| 0.2 | 7.4 | GO:0001917 | photoreceptor inner segment(GO:0001917) |
| 0.2 | 0.9 | GO:0000798 | nuclear cohesin complex(GO:0000798) nuclear meiotic cohesin complex(GO:0034991) |
| 0.2 | 0.7 | GO:0070032 | synaptobrevin 2-SNAP-25-syntaxin-1a-complexin I complex(GO:0070032) synaptobrevin 2-SNAP-25-syntaxin-1a-complexin II complex(GO:0070033) |
| 0.1 | 1.4 | GO:0005614 | interstitial matrix(GO:0005614) |
| 0.1 | 3.9 | GO:0032281 | AMPA glutamate receptor complex(GO:0032281) |
| 0.1 | 5.4 | GO:0005882 | intermediate filament(GO:0005882) |
| 0.1 | 1.7 | GO:0097386 | glial cell projection(GO:0097386) |
| 0.1 | 1.5 | GO:0005605 | basal lamina(GO:0005605) |
| 0.1 | 0.2 | GO:0036501 | UFD1-NPL4 complex(GO:0036501) |
| 0.1 | 0.4 | GO:0033269 | internode region of axon(GO:0033269) |
| 0.1 | 1.4 | GO:0016581 | NuRD complex(GO:0016581) CHD-type complex(GO:0090545) |
| 0.1 | 4.2 | GO:0016529 | sarcoplasmic reticulum(GO:0016529) |
| 0.0 | 0.9 | GO:0071004 | U2-type prespliceosome(GO:0071004) |
| 0.0 | 0.2 | GO:0033093 | Weibel-Palade body(GO:0033093) |
| 0.0 | 0.5 | GO:0005892 | acetylcholine-gated channel complex(GO:0005892) |
| 0.0 | 0.9 | GO:0045334 | clathrin-coated endocytic vesicle(GO:0045334) |
| 0.0 | 0.3 | GO:0032009 | early phagosome(GO:0032009) |
| 0.0 | 0.8 | GO:0001891 | phagocytic cup(GO:0001891) |
| 0.0 | 0.5 | GO:0098643 | fibrillar collagen trimer(GO:0005583) banded collagen fibril(GO:0098643) |
| 0.0 | 0.5 | GO:0042405 | nuclear inclusion body(GO:0042405) |
| 0.0 | 0.8 | GO:0071565 | nBAF complex(GO:0071565) |
| 0.0 | 0.5 | GO:0031512 | motile primary cilium(GO:0031512) |
| 0.0 | 0.3 | GO:0000138 | Golgi trans cisterna(GO:0000138) |
| 0.0 | 0.2 | GO:0071204 | histone pre-mRNA 3'end processing complex(GO:0071204) |
| 0.0 | 1.2 | GO:0031901 | early endosome membrane(GO:0031901) |
| 0.0 | 0.3 | GO:0001673 | male germ cell nucleus(GO:0001673) |
| 0.0 | 1.0 | GO:0014704 | intercalated disc(GO:0014704) |
| 0.0 | 1.6 | GO:0030864 | cortical actin cytoskeleton(GO:0030864) |
| 0.0 | 1.3 | GO:0000118 | histone deacetylase complex(GO:0000118) |
| 0.0 | 1.3 | GO:0005930 | axoneme(GO:0005930) ciliary plasm(GO:0097014) |
| 0.0 | 3.8 | GO:0045211 | postsynaptic membrane(GO:0045211) |
| 0.0 | 0.5 | GO:0000788 | nuclear nucleosome(GO:0000788) |
| 0.0 | 0.7 | GO:0030173 | integral component of Golgi membrane(GO:0030173) |
| 0.0 | 0.6 | GO:0005788 | endoplasmic reticulum lumen(GO:0005788) |
| 0.0 | 2.4 | GO:0005770 | late endosome(GO:0005770) |
| 0.0 | 0.7 | GO:0005902 | microvillus(GO:0005902) |
| 0.0 | 0.1 | GO:0002116 | semaphorin receptor complex(GO:0002116) |
| 0.0 | 0.9 | GO:0000502 | proteasome complex(GO:0000502) |
| 0.0 | 0.2 | GO:0032391 | photoreceptor connecting cilium(GO:0032391) |
| 0.0 | 1.3 | GO:0005769 | early endosome(GO:0005769) |
| 0.0 | 2.1 | GO:0009986 | cell surface(GO:0009986) |
Gene overrepresentation in molecular_function category:
| Log-likelihood per target | Total log-likelihood | Term | Description |
|---|---|---|---|
| 0.8 | 4.5 | GO:0015265 | urea channel activity(GO:0015265) |
| 0.7 | 5.4 | GO:0015193 | L-proline transmembrane transporter activity(GO:0015193) |
| 0.6 | 1.7 | GO:0016880 | acid-ammonia (or amide) ligase activity(GO:0016880) |
| 0.5 | 1.6 | GO:0005220 | inositol 1,4,5-trisphosphate-sensitive calcium-release channel activity(GO:0005220) |
| 0.4 | 2.7 | GO:0070699 | type II activin receptor binding(GO:0070699) |
| 0.4 | 9.5 | GO:0051787 | misfolded protein binding(GO:0051787) |
| 0.4 | 2.1 | GO:0060698 | endoribonuclease inhibitor activity(GO:0060698) |
| 0.4 | 2.6 | GO:0001609 | G-protein coupled adenosine receptor activity(GO:0001609) |
| 0.3 | 1.0 | GO:0052740 | phosphatidylserine 1-acylhydrolase activity(GO:0052739) 1-acyl-2-lysophosphatidylserine acylhydrolase activity(GO:0052740) |
| 0.3 | 0.8 | GO:0047256 | beta-galactosyl-N-acetylglucosaminylgalactosylglucosyl-ceramide beta-1,3-acetylglucosaminyltransferase activity(GO:0008457) lactosylceramide 1,3-N-acetyl-beta-D-glucosaminyltransferase activity(GO:0047256) |
| 0.3 | 2.1 | GO:0048495 | Roundabout binding(GO:0048495) |
| 0.3 | 1.0 | GO:0086038 | calcium:sodium antiporter activity involved in regulation of cardiac muscle cell membrane potential(GO:0086038) |
| 0.2 | 4.3 | GO:0034237 | protein kinase A regulatory subunit binding(GO:0034237) |
| 0.2 | 3.4 | GO:0042043 | neurexin family protein binding(GO:0042043) |
| 0.2 | 1.5 | GO:0018741 | alkyl sulfatase activity(GO:0018741) endosulfan hemisulfate sulfatase activity(GO:0034889) endosulfan sulfate hydrolase activity(GO:0034902) |
| 0.2 | 2.6 | GO:0004861 | cyclin-dependent protein serine/threonine kinase inhibitor activity(GO:0004861) |
| 0.2 | 0.5 | GO:0042284 | sphingolipid delta-4 desaturase activity(GO:0042284) |
| 0.2 | 3.9 | GO:0043395 | heparan sulfate proteoglycan binding(GO:0043395) |
| 0.2 | 0.6 | GO:0089720 | caspase binding(GO:0089720) |
| 0.1 | 0.6 | GO:0005432 | calcium:sodium antiporter activity(GO:0005432) |
| 0.1 | 0.7 | GO:0003828 | alpha-N-acetylneuraminate alpha-2,8-sialyltransferase activity(GO:0003828) |
| 0.1 | 2.7 | GO:0043325 | phosphatidylinositol-3,4-bisphosphate binding(GO:0043325) |
| 0.1 | 2.1 | GO:0005540 | hyaluronic acid binding(GO:0005540) |
| 0.1 | 0.6 | GO:0032795 | heterotrimeric G-protein binding(GO:0032795) |
| 0.1 | 0.6 | GO:0046975 | histone methyltransferase activity (H3-K36 specific)(GO:0046975) |
| 0.1 | 0.4 | GO:0019911 | structural constituent of myelin sheath(GO:0019911) |
| 0.1 | 0.5 | GO:0050062 | long-chain-fatty-acyl-CoA reductase activity(GO:0050062) fatty-acyl-CoA reductase (alcohol-forming) activity(GO:0080019) |
| 0.1 | 0.6 | GO:0070191 | methionine-R-sulfoxide reductase activity(GO:0070191) |
| 0.1 | 0.5 | GO:0052833 | inositol monophosphate 1-phosphatase activity(GO:0008934) inositol monophosphate 3-phosphatase activity(GO:0052832) inositol monophosphate 4-phosphatase activity(GO:0052833) inositol monophosphate phosphatase activity(GO:0052834) |
| 0.1 | 2.2 | GO:0003785 | actin monomer binding(GO:0003785) |
| 0.1 | 1.7 | GO:0005521 | lamin binding(GO:0005521) |
| 0.1 | 0.5 | GO:0051959 | dynein light intermediate chain binding(GO:0051959) |
| 0.1 | 0.3 | GO:0033188 | sphingomyelin synthase activity(GO:0033188) ceramide cholinephosphotransferase activity(GO:0047493) |
| 0.1 | 1.3 | GO:0031078 | histone deacetylase activity (H3-K14 specific)(GO:0031078) NAD-dependent histone deacetylase activity (H3-K14 specific)(GO:0032041) |
| 0.1 | 1.4 | GO:0003841 | 1-acylglycerol-3-phosphate O-acyltransferase activity(GO:0003841) |
| 0.1 | 1.1 | GO:0004407 | histone deacetylase activity(GO:0004407) |
| 0.1 | 2.0 | GO:0070412 | R-SMAD binding(GO:0070412) |
| 0.1 | 0.3 | GO:0004563 | beta-N-acetylhexosaminidase activity(GO:0004563) |
| 0.1 | 0.3 | GO:0052630 | CTP:2,3-di-O-geranylgeranyl-sn-glycero-1-phosphate cytidyltransferase activity(GO:0043338) phospholactate guanylyltransferase activity(GO:0043814) ATP:coenzyme F420 adenylyltransferase activity(GO:0043910) UDP-N-acetylgalactosamine diphosphorylase activity(GO:0052630) |
| 0.1 | 0.2 | GO:0071207 | histone pre-mRNA stem-loop binding(GO:0071207) |
| 0.0 | 1.8 | GO:0032266 | phosphatidylinositol-3-phosphate binding(GO:0032266) |
| 0.0 | 1.0 | GO:0043422 | protein kinase B binding(GO:0043422) |
| 0.0 | 3.5 | GO:0019888 | protein phosphatase regulator activity(GO:0019888) |
| 0.0 | 1.1 | GO:0001968 | fibronectin binding(GO:0001968) |
| 0.0 | 12.2 | GO:0005096 | GTPase activator activity(GO:0005096) |
| 0.0 | 0.2 | GO:0008321 | Ral guanyl-nucleotide exchange factor activity(GO:0008321) |
| 0.0 | 1.6 | GO:0046875 | ephrin receptor binding(GO:0046875) |
| 0.0 | 0.2 | GO:0015187 | glycine transmembrane transporter activity(GO:0015187) |
| 0.0 | 0.3 | GO:0015651 | quaternary ammonium group transmembrane transporter activity(GO:0015651) |
| 0.0 | 1.7 | GO:0030971 | receptor tyrosine kinase binding(GO:0030971) |
| 0.0 | 0.2 | GO:0036435 | K48-linked polyubiquitin binding(GO:0036435) |
| 0.0 | 0.6 | GO:0004551 | nucleotide diphosphatase activity(GO:0004551) |
| 0.0 | 0.7 | GO:0031434 | mitogen-activated protein kinase kinase binding(GO:0031434) |
| 0.0 | 0.2 | GO:0019865 | immunoglobulin binding(GO:0019865) |
| 0.0 | 0.1 | GO:0005250 | A-type (transient outward) potassium channel activity(GO:0005250) |
| 0.0 | 0.5 | GO:0004298 | threonine-type endopeptidase activity(GO:0004298) threonine-type peptidase activity(GO:0070003) |
| 0.0 | 0.4 | GO:0004653 | polypeptide N-acetylgalactosaminyltransferase activity(GO:0004653) |
| 0.0 | 0.4 | GO:0010485 | H4 histone acetyltransferase activity(GO:0010485) |
| 0.0 | 0.5 | GO:0016661 | oxidoreductase activity, acting on other nitrogenous compounds as donors(GO:0016661) |
| 0.0 | 0.6 | GO:0015175 | neutral amino acid transmembrane transporter activity(GO:0015175) |
| 0.0 | 0.4 | GO:0004198 | calcium-dependent cysteine-type endopeptidase activity(GO:0004198) |
| 0.0 | 3.0 | GO:0001078 | transcriptional repressor activity, RNA polymerase II core promoter proximal region sequence-specific binding(GO:0001078) |
| 0.0 | 0.2 | GO:0015643 | toxic substance binding(GO:0015643) |
| 0.0 | 0.2 | GO:0008526 | phosphatidylinositol transporter activity(GO:0008526) |
| 0.0 | 1.3 | GO:0002039 | p53 binding(GO:0002039) |
| 0.0 | 1.2 | GO:0035064 | methylated histone binding(GO:0035064) |
| 0.0 | 0.5 | GO:0005201 | extracellular matrix structural constituent(GO:0005201) |
| 0.0 | 0.7 | GO:0005484 | SNAP receptor activity(GO:0005484) |
| 0.0 | 0.3 | GO:0003950 | NAD+ ADP-ribosyltransferase activity(GO:0003950) |
| 0.0 | 1.4 | GO:0008201 | heparin binding(GO:0008201) |
| 0.0 | 0.7 | GO:0044824 | integrase activity(GO:0008907) T/G mismatch-specific endonuclease activity(GO:0043765) retroviral integrase activity(GO:0044823) retroviral 3' processing activity(GO:0044824) |
| 0.0 | 0.1 | GO:0015277 | kainate selective glutamate receptor activity(GO:0015277) |
| 0.0 | 0.1 | GO:0017154 | semaphorin receptor activity(GO:0017154) |
| 0.0 | 0.7 | GO:0019003 | GDP binding(GO:0019003) |
| 0.0 | 0.7 | GO:0051087 | chaperone binding(GO:0051087) |