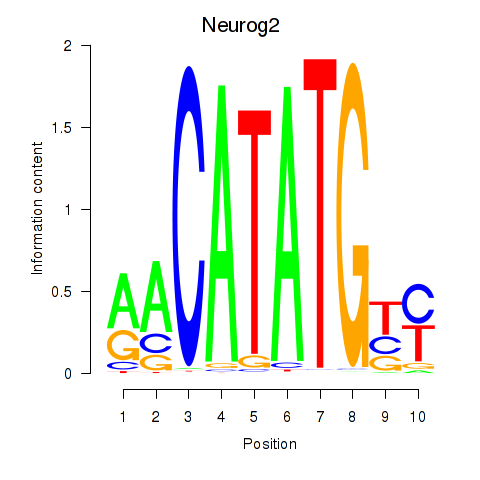
Motif ID: Neurog2
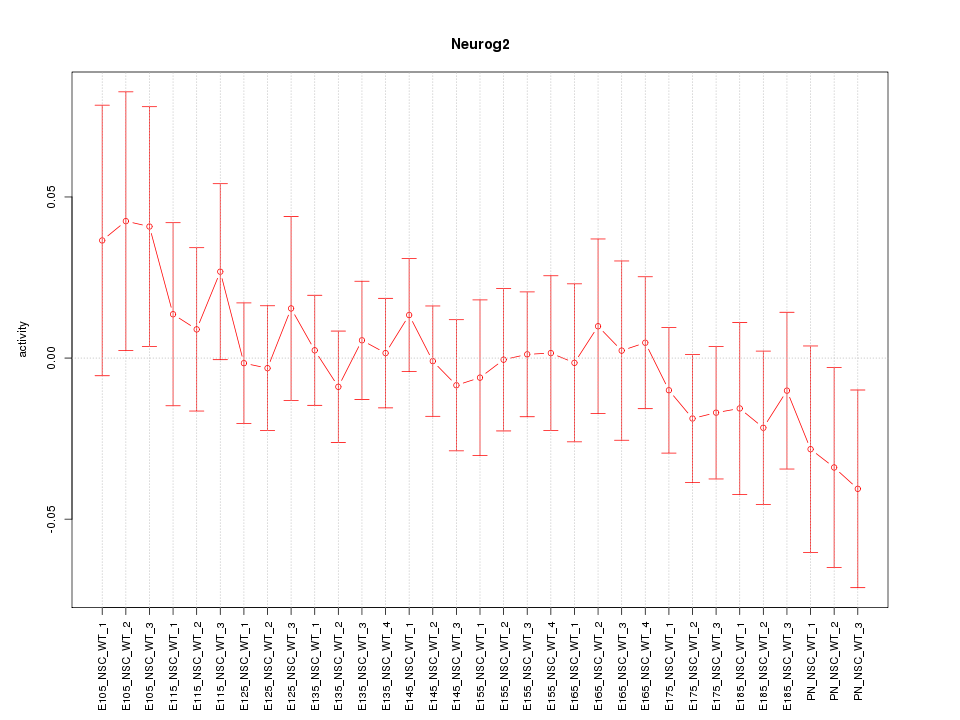
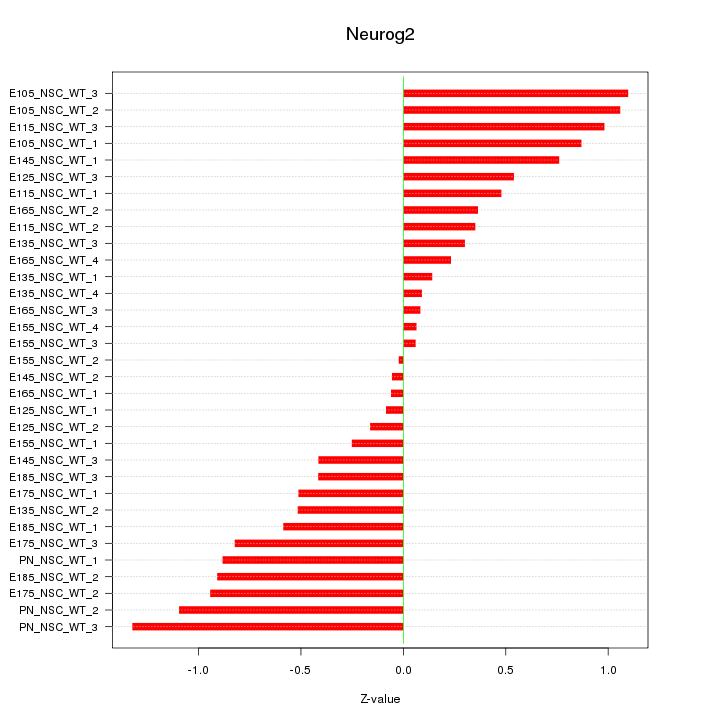
Z-value: 0.628
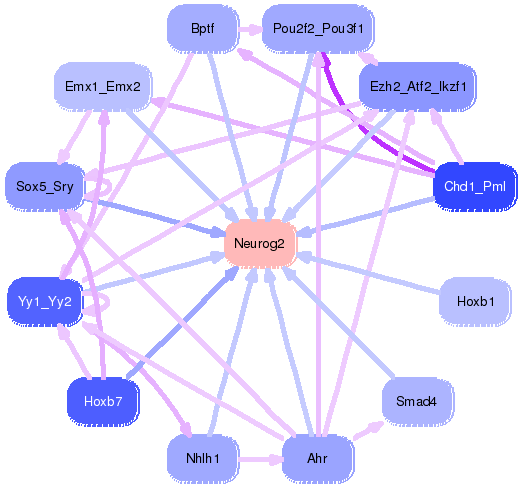
Transcription factors associated with Neurog2:
| Gene Symbol | Entrez ID | Gene Name |
|---|---|---|
| Neurog2 | ENSMUSG00000027967.7 | Neurog2 |
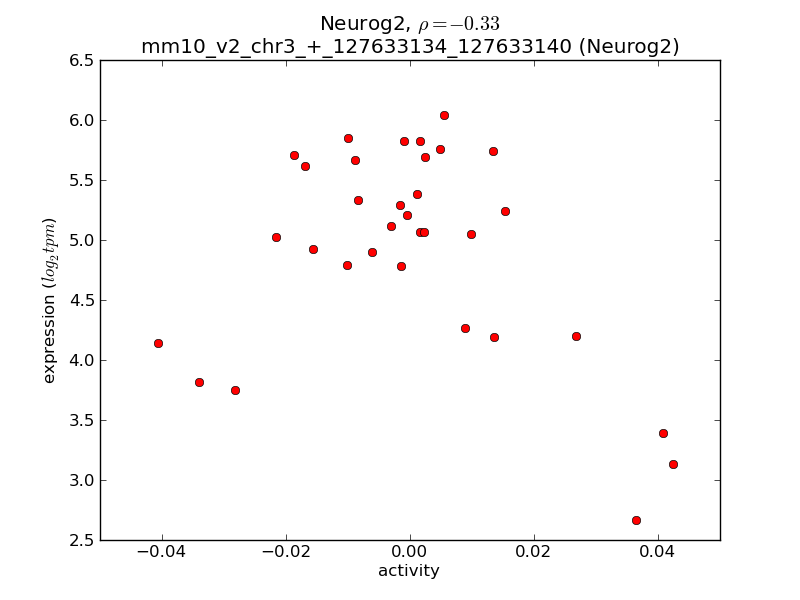
Activity-expression correlation:
| Gene Symbol | Promoter | Pearson corr. coef. | P-value | Plot |
|---|---|---|---|---|
| Neurog2 | mm10_v2_chr3_+_127633134_127633140 | -0.33 | 6.5e-02 | Click! |

Top targets:
Gene overrepresentation in biological_process category:
| Log-likelihood per target | Total log-likelihood | Term | Description |
|---|---|---|---|
| 1.1 | 6.8 | GO:0032796 | uropod organization(GO:0032796) |
| 1.1 | 3.2 | GO:0002159 | desmosome assembly(GO:0002159) adherens junction maintenance(GO:0034334) intermediate filament bundle assembly(GO:0045110) maintenance of organ identity(GO:0048496) |
| 0.5 | 2.1 | GO:0042905 | 9-cis-retinoic acid biosynthetic process(GO:0042904) 9-cis-retinoic acid metabolic process(GO:0042905) |
| 0.5 | 2.0 | GO:0046294 | formaldehyde catabolic process(GO:0046294) |
| 0.5 | 2.8 | GO:0006452 | translational frameshifting(GO:0006452) positive regulation of translational termination(GO:0045905) |
| 0.4 | 1.2 | GO:0001732 | formation of cytoplasmic translation initiation complex(GO:0001732) |
| 0.4 | 3.6 | GO:0045198 | establishment of epithelial cell apical/basal polarity(GO:0045198) |
| 0.4 | 1.1 | GO:1902396 | protein localization to bicellular tight junction(GO:1902396) |
| 0.3 | 1.0 | GO:1900041 | negative regulation of interleukin-2 secretion(GO:1900041) |
| 0.3 | 1.5 | GO:0042636 | negative regulation of hair cycle(GO:0042636) negative regulation of hair follicle development(GO:0051799) positive regulation of ovulation(GO:0060279) |
| 0.3 | 6.0 | GO:0046685 | response to arsenic-containing substance(GO:0046685) |
| 0.3 | 1.4 | GO:0070171 | negative regulation of tooth mineralization(GO:0070171) |
| 0.3 | 1.4 | GO:2000483 | negative regulation of interleukin-8 secretion(GO:2000483) |
| 0.2 | 1.4 | GO:0006177 | GMP biosynthetic process(GO:0006177) |
| 0.2 | 1.9 | GO:0006398 | mRNA 3'-end processing by stem-loop binding and cleavage(GO:0006398) |
| 0.2 | 0.6 | GO:0048211 | Golgi vesicle docking(GO:0048211) |
| 0.2 | 0.6 | GO:0006419 | alanyl-tRNA aminoacylation(GO:0006419) |
| 0.2 | 1.0 | GO:0034227 | tRNA thio-modification(GO:0034227) |
| 0.2 | 2.7 | GO:0033623 | regulation of integrin activation(GO:0033623) |
| 0.2 | 0.8 | GO:1900864 | mitochondrial tRNA modification(GO:0070900) mitochondrial RNA modification(GO:1900864) |
| 0.2 | 0.5 | GO:0032829 | positive regulation of T cell anergy(GO:0002669) positive regulation of lymphocyte anergy(GO:0002913) regulation of CD4-positive, CD25-positive, alpha-beta regulatory T cell differentiation(GO:0032829) negative regulation of interleukin-2 biosynthetic process(GO:0045085) negative regulation of isotype switching to IgE isotypes(GO:0048294) |
| 0.1 | 0.3 | GO:2000097 | regulation of smooth muscle cell-matrix adhesion(GO:2000097) |
| 0.1 | 0.4 | GO:0002331 | pre-B cell allelic exclusion(GO:0002331) |
| 0.1 | 0.3 | GO:0072070 | loop of Henle development(GO:0072070) metanephric loop of Henle development(GO:0072236) |
| 0.1 | 0.5 | GO:0042256 | mature ribosome assembly(GO:0042256) |
| 0.1 | 0.3 | GO:0048539 | bone marrow development(GO:0048539) |
| 0.1 | 1.2 | GO:0031340 | positive regulation of vesicle fusion(GO:0031340) |
| 0.1 | 1.1 | GO:0009048 | dosage compensation by inactivation of X chromosome(GO:0009048) |
| 0.1 | 1.4 | GO:0000028 | ribosomal small subunit assembly(GO:0000028) |
| 0.1 | 0.7 | GO:2000480 | negative regulation of cAMP-dependent protein kinase activity(GO:2000480) |
| 0.1 | 0.5 | GO:0033147 | negative regulation of intracellular estrogen receptor signaling pathway(GO:0033147) |
| 0.1 | 0.6 | GO:0010650 | positive regulation of cell communication by electrical coupling(GO:0010650) positive regulation of membrane depolarization during cardiac muscle cell action potential(GO:1900827) |
| 0.1 | 0.1 | GO:0010455 | positive regulation of cell fate commitment(GO:0010455) regulation of transcription from RNA polymerase II promoter involved in spinal cord motor neuron fate specification(GO:0021912) regulation of transcription from RNA polymerase II promoter involved in ventral spinal cord interneuron specification(GO:0021913) |
| 0.0 | 0.7 | GO:0090141 | positive regulation of mitochondrial fission(GO:0090141) |
| 0.0 | 0.7 | GO:0033523 | endodermal cell fate commitment(GO:0001711) histone H2B ubiquitination(GO:0033523) |
| 0.0 | 0.4 | GO:0007221 | positive regulation of transcription of Notch receptor target(GO:0007221) |
| 0.0 | 0.2 | GO:0043490 | malate-aspartate shuttle(GO:0043490) |
| 0.0 | 0.5 | GO:0033572 | transferrin transport(GO:0033572) |
| 0.0 | 0.3 | GO:0043416 | regulation of skeletal muscle tissue regeneration(GO:0043416) |
| 0.0 | 0.4 | GO:0048386 | positive regulation of retinoic acid receptor signaling pathway(GO:0048386) |
| 0.0 | 1.1 | GO:0015985 | energy coupled proton transport, down electrochemical gradient(GO:0015985) ATP synthesis coupled proton transport(GO:0015986) |
| 0.0 | 0.7 | GO:0034390 | smooth muscle cell apoptotic process(GO:0034390) regulation of smooth muscle cell apoptotic process(GO:0034391) cGMP catabolic process(GO:0046069) |
| 0.0 | 1.2 | GO:0010972 | negative regulation of G2/M transition of mitotic cell cycle(GO:0010972) |
| 0.0 | 1.4 | GO:1902476 | chloride transmembrane transport(GO:1902476) |
| 0.0 | 0.1 | GO:0006545 | glycine biosynthetic process(GO:0006545) |
| 0.0 | 1.2 | GO:0016445 | somatic diversification of immunoglobulins(GO:0016445) |
| 0.0 | 0.4 | GO:0031507 | heterochromatin assembly(GO:0031507) |
| 0.0 | 0.7 | GO:0095500 | acetylcholine receptor signaling pathway(GO:0095500) postsynaptic signal transduction(GO:0098926) signal transduction involved in cellular response to ammonium ion(GO:1903831) response to acetylcholine(GO:1905144) cellular response to acetylcholine(GO:1905145) |
| 0.0 | 0.4 | GO:1902857 | positive regulation of nonmotile primary cilium assembly(GO:1902857) |
| 0.0 | 2.1 | GO:0007405 | neuroblast proliferation(GO:0007405) |
| 0.0 | 0.5 | GO:0042517 | positive regulation of tyrosine phosphorylation of Stat3 protein(GO:0042517) |
| 0.0 | 0.5 | GO:0042753 | positive regulation of circadian rhythm(GO:0042753) |
| 0.0 | 0.2 | GO:2000381 | negative regulation of mesoderm development(GO:2000381) |
| 0.0 | 0.9 | GO:0070534 | protein K63-linked ubiquitination(GO:0070534) |
| 0.0 | 0.9 | GO:0043029 | T cell homeostasis(GO:0043029) |
| 0.0 | 0.3 | GO:0009083 | branched-chain amino acid catabolic process(GO:0009083) |
| 0.0 | 0.3 | GO:0003334 | keratinocyte development(GO:0003334) |
| 0.0 | 2.0 | GO:0048015 | phosphatidylinositol-mediated signaling(GO:0048015) |
| 0.0 | 0.3 | GO:0097062 | dendritic spine maintenance(GO:0097062) |
| 0.0 | 0.0 | GO:0000480 | endonucleolytic cleavage in 5'-ETS of tricistronic rRNA transcript (SSU-rRNA, 5.8S rRNA, LSU-rRNA)(GO:0000480) |
| 0.0 | 0.5 | GO:0016574 | histone ubiquitination(GO:0016574) |
| 0.0 | 0.2 | GO:0010603 | regulation of cytoplasmic mRNA processing body assembly(GO:0010603) |
Gene overrepresentation in cellular_component category:
| Log-likelihood per target | Total log-likelihood | Term | Description |
|---|---|---|---|
| 0.5 | 1.5 | GO:0043512 | inhibin A complex(GO:0043512) |
| 0.3 | 3.0 | GO:0034993 | microtubule organizing center attachment site(GO:0034992) LINC complex(GO:0034993) |
| 0.3 | 2.8 | GO:0005642 | annulate lamellae(GO:0005642) |
| 0.3 | 6.8 | GO:0001891 | phagocytic cup(GO:0001891) |
| 0.3 | 3.2 | GO:0030057 | desmosome(GO:0030057) |
| 0.2 | 2.1 | GO:1990023 | mitotic spindle midzone(GO:1990023) |
| 0.1 | 1.2 | GO:0071541 | eukaryotic translation initiation factor 3 complex, eIF3m(GO:0071541) |
| 0.1 | 0.5 | GO:0030015 | CCR4-NOT core complex(GO:0030015) |
| 0.1 | 0.3 | GO:1990879 | CST complex(GO:1990879) |
| 0.1 | 0.7 | GO:0016593 | Cdc73/Paf1 complex(GO:0016593) |
| 0.1 | 1.2 | GO:0000974 | Prp19 complex(GO:0000974) |
| 0.1 | 5.8 | GO:0014704 | intercalated disc(GO:0014704) |
| 0.1 | 0.7 | GO:0016272 | prefoldin complex(GO:0016272) |
| 0.1 | 0.6 | GO:0000243 | commitment complex(GO:0000243) |
| 0.1 | 0.7 | GO:0000276 | mitochondrial proton-transporting ATP synthase complex, coupling factor F(o)(GO:0000276) |
| 0.1 | 0.2 | GO:0034457 | Mpp10 complex(GO:0034457) |
| 0.0 | 0.5 | GO:0001739 | sex chromatin(GO:0001739) |
| 0.0 | 1.9 | GO:0015030 | Cajal body(GO:0015030) |
| 0.0 | 4.2 | GO:0001725 | stress fiber(GO:0001725) contractile actin filament bundle(GO:0097517) |
| 0.0 | 0.3 | GO:0045261 | mitochondrial proton-transporting ATP synthase complex, catalytic core F(1)(GO:0000275) proton-transporting ATP synthase complex, catalytic core F(1)(GO:0045261) |
| 0.0 | 0.4 | GO:0005677 | chromatin silencing complex(GO:0005677) |
| 0.0 | 1.0 | GO:0030904 | retromer complex(GO:0030904) |
| 0.0 | 1.1 | GO:0031012 | extracellular matrix(GO:0031012) |
| 0.0 | 1.4 | GO:0022627 | cytosolic small ribosomal subunit(GO:0022627) |
| 0.0 | 0.3 | GO:0044453 | nuclear membrane part(GO:0044453) |
| 0.0 | 0.3 | GO:0005868 | cytoplasmic dynein complex(GO:0005868) |
| 0.0 | 0.8 | GO:0000314 | organellar small ribosomal subunit(GO:0000314) mitochondrial small ribosomal subunit(GO:0005763) |
| 0.0 | 1.2 | GO:0031201 | SNARE complex(GO:0031201) |
| 0.0 | 1.5 | GO:0022626 | cytosolic ribosome(GO:0022626) |
| 0.0 | 0.1 | GO:0070552 | BRISC complex(GO:0070552) |
| 0.0 | 1.5 | GO:0005814 | centriole(GO:0005814) |
| 0.0 | 0.5 | GO:0000315 | organellar large ribosomal subunit(GO:0000315) mitochondrial large ribosomal subunit(GO:0005762) |
| 0.0 | 1.4 | GO:0017053 | transcriptional repressor complex(GO:0017053) |
| 0.0 | 0.8 | GO:0005778 | peroxisomal membrane(GO:0005778) microbody membrane(GO:0031903) |
Gene overrepresentation in molecular_function category:
| Log-likelihood per target | Total log-likelihood | Term | Description |
|---|---|---|---|
| 0.7 | 6.8 | GO:0032036 | myosin heavy chain binding(GO:0032036) |
| 0.7 | 2.0 | GO:0018738 | S-formylglutathione hydrolase activity(GO:0018738) |
| 0.4 | 6.0 | GO:0015106 | bicarbonate transmembrane transporter activity(GO:0015106) |
| 0.4 | 1.4 | GO:0003938 | IMP dehydrogenase activity(GO:0003938) |
| 0.3 | 2.1 | GO:0001758 | retinal dehydrogenase activity(GO:0001758) 3-chloroallyl aldehyde dehydrogenase activity(GO:0004028) |
| 0.3 | 2.0 | GO:0008494 | translation activator activity(GO:0008494) |
| 0.3 | 3.2 | GO:0045294 | alpha-catenin binding(GO:0045294) |
| 0.3 | 1.5 | GO:0070699 | type II activin receptor binding(GO:0070699) |
| 0.2 | 2.8 | GO:0017070 | U6 snRNA binding(GO:0017070) |
| 0.2 | 0.6 | GO:0004813 | alanine-tRNA ligase activity(GO:0004813) |
| 0.2 | 2.6 | GO:0031005 | filamin binding(GO:0031005) |
| 0.1 | 2.0 | GO:0004435 | phosphatidylinositol phospholipase C activity(GO:0004435) |
| 0.1 | 0.7 | GO:0048101 | calcium- and calmodulin-regulated 3',5'-cyclic-GMP phosphodiesterase activity(GO:0048101) |
| 0.1 | 0.7 | GO:0030550 | acetylcholine receptor inhibitor activity(GO:0030550) |
| 0.1 | 1.3 | GO:0070180 | large ribosomal subunit rRNA binding(GO:0070180) |
| 0.1 | 0.5 | GO:0051525 | NFAT protein binding(GO:0051525) |
| 0.1 | 0.7 | GO:0050815 | phosphoserine binding(GO:0050815) |
| 0.1 | 1.4 | GO:0005247 | voltage-gated chloride channel activity(GO:0005247) |
| 0.1 | 0.5 | GO:0001226 | RNA polymerase II transcription corepressor binding(GO:0001226) |
| 0.1 | 0.5 | GO:0098811 | transcriptional activator activity, RNA polymerase II transcription factor binding(GO:0001190) transcriptional repressor activity, RNA polymerase II activating transcription factor binding(GO:0098811) |
| 0.1 | 0.6 | GO:0070181 | small ribosomal subunit rRNA binding(GO:0070181) |
| 0.1 | 0.3 | GO:0034916 | 4-methyloctanoyl-CoA dehydrogenase activity(GO:0034580) naphthyl-2-methyl-succinyl-CoA dehydrogenase activity(GO:0034845) 2-methylhexanoyl-CoA dehydrogenase activity(GO:0034916) propionyl-CoA dehydrogenase activity(GO:0043820) thiol-driven fumarate reductase activity(GO:0043830) coenzyme F420-dependent 2,4,6-trinitrophenol reductase activity(GO:0052758) coenzyme F420-dependent 2,4,6-trinitrophenol hydride reductase activity(GO:0052759) coenzyme F420-dependent 2,4-dinitrophenol reductase activity(GO:0052760) |
| 0.1 | 1.4 | GO:0001968 | fibronectin binding(GO:0001968) |
| 0.0 | 0.6 | GO:0043008 | ATP-dependent protein binding(GO:0043008) |
| 0.0 | 0.7 | GO:0004862 | cAMP-dependent protein kinase inhibitor activity(GO:0004862) |
| 0.0 | 0.3 | GO:0035381 | extracellular ATP-gated cation channel activity(GO:0004931) ATP-gated ion channel activity(GO:0035381) |
| 0.0 | 0.2 | GO:0015183 | L-aspartate transmembrane transporter activity(GO:0015183) |
| 0.0 | 0.7 | GO:0044183 | protein binding involved in protein folding(GO:0044183) |
| 0.0 | 0.1 | GO:0008732 | threonine aldolase activity(GO:0004793) L-allo-threonine aldolase activity(GO:0008732) |
| 0.0 | 0.2 | GO:0004984 | olfactory receptor activity(GO:0004984) |
| 0.0 | 2.3 | GO:0003743 | translation initiation factor activity(GO:0003743) |
| 0.0 | 0.6 | GO:0035497 | cAMP response element binding(GO:0035497) |
| 0.0 | 0.3 | GO:0098505 | G-rich strand telomeric DNA binding(GO:0098505) |
| 0.0 | 1.2 | GO:0005544 | calcium-dependent phospholipid binding(GO:0005544) |
| 0.0 | 0.3 | GO:0046933 | proton-transporting ATP synthase activity, rotational mechanism(GO:0046933) |
| 0.0 | 1.4 | GO:0005518 | collagen binding(GO:0005518) |
| 0.0 | 1.0 | GO:0000049 | tRNA binding(GO:0000049) |
| 0.0 | 1.1 | GO:0042974 | retinoic acid receptor binding(GO:0042974) |
| 0.0 | 0.6 | GO:0017069 | snRNA binding(GO:0017069) |
| 0.0 | 0.2 | GO:0050692 | DBD domain binding(GO:0050692) |
| 0.0 | 0.3 | GO:0071837 | HMG box domain binding(GO:0071837) |
| 0.0 | 0.7 | GO:0035035 | histone acetyltransferase binding(GO:0035035) |
| 0.0 | 0.1 | GO:0046976 | histone methyltransferase activity (H3-K27 specific)(GO:0046976) |
| 0.0 | 0.5 | GO:0008536 | Ran GTPase binding(GO:0008536) |
| 0.0 | 0.5 | GO:0005158 | insulin receptor binding(GO:0005158) |
| 0.0 | 0.8 | GO:0004252 | serine-type endopeptidase activity(GO:0004252) |
| 0.0 | 0.8 | GO:0009019 | tRNA (guanine-N1-)-methyltransferase activity(GO:0009019) |