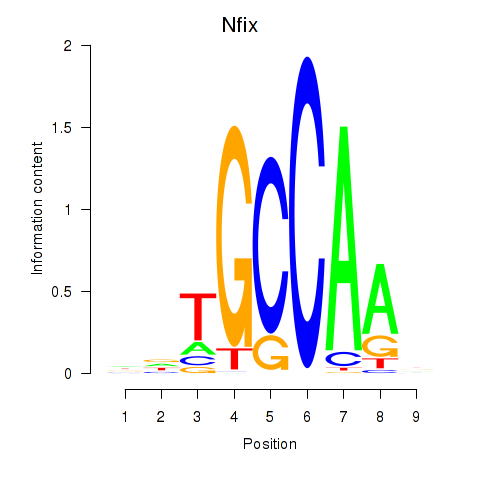
Motif ID: Nfix
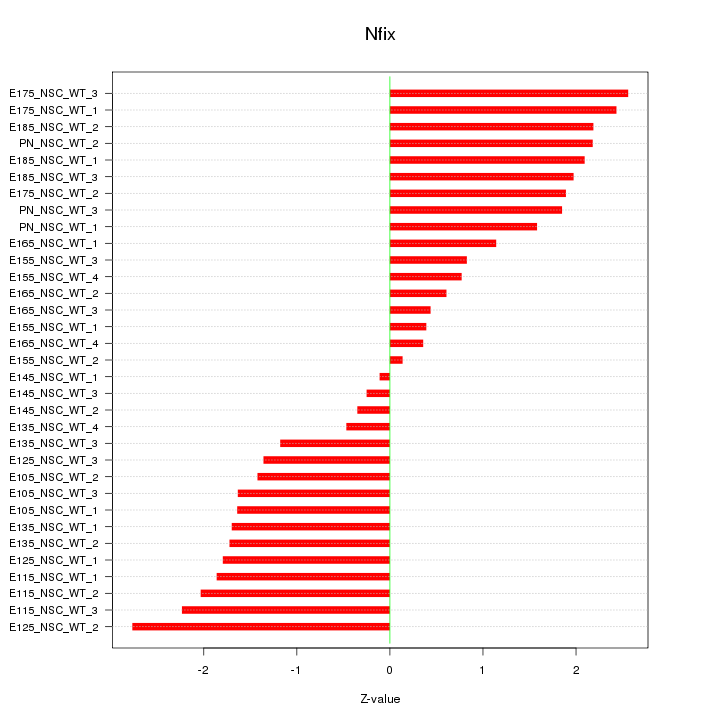
Z-value: 1.592
Transcription factors associated with Nfix:
| Gene Symbol | Entrez ID | Gene Name |
|---|---|---|
| Nfix | ENSMUSG00000001911.10 | Nfix |
Activity-expression correlation:
| Gene Symbol | Promoter | Pearson corr. coef. | P-value | Plot |
|---|---|---|---|---|
| Nfix | mm10_v2_chr8_-_84800344_84800378 | 0.77 | 1.7e-07 | Click! |

Top targets:
Gene overrepresentation in biological_process category:
| Log-likelihood per target | Total log-likelihood | Term | Description |
|---|---|---|---|
| 3.5 | 14.2 | GO:0019372 | lipoxygenase pathway(GO:0019372) |
| 3.1 | 18.6 | GO:0010624 | regulation of Schwann cell proliferation(GO:0010624) |
| 3.0 | 30.0 | GO:0015721 | bile acid and bile salt transport(GO:0015721) |
| 2.2 | 6.6 | GO:0014809 | regulation of skeletal muscle contraction by regulation of release of sequestered calcium ion(GO:0014809) |
| 1.9 | 34.3 | GO:0060134 | prepulse inhibition(GO:0060134) |
| 1.8 | 5.5 | GO:0003195 | tricuspid valve development(GO:0003175) tricuspid valve morphogenesis(GO:0003186) tricuspid valve formation(GO:0003195) right ventricular cardiac muscle tissue morphogenesis(GO:0003221) |
| 1.8 | 8.9 | GO:0051045 | negative regulation of membrane protein ectodomain proteolysis(GO:0051045) |
| 1.7 | 5.0 | GO:0021529 | spinal cord oligodendrocyte cell differentiation(GO:0021529) spinal cord oligodendrocyte cell fate specification(GO:0021530) |
| 1.3 | 8.0 | GO:0060718 | chorionic trophoblast cell differentiation(GO:0060718) |
| 1.2 | 7.4 | GO:0015840 | urea transport(GO:0015840) urea transmembrane transport(GO:0071918) |
| 1.1 | 6.7 | GO:0043415 | positive regulation of skeletal muscle tissue regeneration(GO:0043415) |
| 1.1 | 5.6 | GO:0047484 | regulation of response to osmotic stress(GO:0047484) |
| 1.1 | 3.2 | GO:0038095 | positive regulation of mast cell cytokine production(GO:0032765) Fc-epsilon receptor signaling pathway(GO:0038095) |
| 1.0 | 2.9 | GO:0007521 | muscle cell fate determination(GO:0007521) cellular response to parathyroid hormone stimulus(GO:0071374) positive regulation of macrophage apoptotic process(GO:2000111) |
| 0.9 | 5.5 | GO:1903056 | regulation of lens fiber cell differentiation(GO:1902746) positive regulation of lens fiber cell differentiation(GO:1902748) regulation of melanosome organization(GO:1903056) |
| 0.9 | 15.3 | GO:0032060 | bleb assembly(GO:0032060) |
| 0.8 | 1.7 | GO:0061588 | calcium activated phospholipid scrambling(GO:0061588) calcium activated phosphatidylserine scrambling(GO:0061589) calcium activated phosphatidylcholine scrambling(GO:0061590) calcium activated galactosylceramide scrambling(GO:0061591) |
| 0.8 | 3.9 | GO:1900170 | negative regulation of glucocorticoid mediated signaling pathway(GO:1900170) |
| 0.7 | 20.5 | GO:0010866 | regulation of triglyceride biosynthetic process(GO:0010866) |
| 0.7 | 2.1 | GO:1903054 | negative regulation of extracellular matrix organization(GO:1903054) |
| 0.7 | 4.8 | GO:0051611 | negative regulation of neurotransmitter uptake(GO:0051581) serotonin uptake(GO:0051610) regulation of serotonin uptake(GO:0051611) negative regulation of serotonin uptake(GO:0051612) |
| 0.7 | 8.2 | GO:1904321 | response to forskolin(GO:1904321) cellular response to forskolin(GO:1904322) |
| 0.7 | 6.1 | GO:0050957 | equilibrioception(GO:0050957) |
| 0.7 | 2.0 | GO:0048352 | neural plate mediolateral regionalization(GO:0021998) mesoderm structural organization(GO:0048338) paraxial mesoderm structural organization(GO:0048352) |
| 0.6 | 5.2 | GO:0036371 | protein localization to M-band(GO:0036309) protein localization to T-tubule(GO:0036371) |
| 0.6 | 1.1 | GO:0035910 | ascending aorta development(GO:0035905) ascending aorta morphogenesis(GO:0035910) |
| 0.6 | 7.4 | GO:1901898 | negative regulation of relaxation of muscle(GO:1901078) negative regulation of relaxation of cardiac muscle(GO:1901898) |
| 0.6 | 2.3 | GO:0006668 | sphinganine-1-phosphate metabolic process(GO:0006668) |
| 0.5 | 2.7 | GO:0030643 | cellular phosphate ion homeostasis(GO:0030643) cellular trivalent inorganic anion homeostasis(GO:0072502) |
| 0.5 | 4.8 | GO:0060662 | tube lumen cavitation(GO:0060605) salivary gland cavitation(GO:0060662) |
| 0.5 | 2.0 | GO:2000211 | regulation of glutamate metabolic process(GO:2000211) |
| 0.5 | 1.4 | GO:0014028 | notochord formation(GO:0014028) |
| 0.5 | 3.2 | GO:0070447 | positive regulation of oligodendrocyte progenitor proliferation(GO:0070447) |
| 0.4 | 1.6 | GO:0035617 | stress granule disassembly(GO:0035617) |
| 0.4 | 2.7 | GO:0033563 | dorsal/ventral axon guidance(GO:0033563) |
| 0.4 | 1.5 | GO:0097167 | circadian regulation of translation(GO:0097167) |
| 0.3 | 6.6 | GO:0050650 | chondroitin sulfate proteoglycan biosynthetic process(GO:0050650) |
| 0.3 | 1.2 | GO:0060745 | mammary gland branching involved in pregnancy(GO:0060745) |
| 0.3 | 3.1 | GO:1902231 | positive regulation of intrinsic apoptotic signaling pathway in response to DNA damage(GO:1902231) |
| 0.3 | 2.1 | GO:0019532 | oxalate transport(GO:0019532) |
| 0.3 | 2.1 | GO:1903441 | protein localization to ciliary membrane(GO:1903441) |
| 0.3 | 10.3 | GO:0032728 | positive regulation of interferon-beta production(GO:0032728) |
| 0.3 | 1.4 | GO:0045006 | DNA deamination(GO:0045006) |
| 0.3 | 3.9 | GO:0021902 | commitment of neuronal cell to specific neuron type in forebrain(GO:0021902) |
| 0.2 | 1.0 | GO:0006049 | UDP-N-acetylglucosamine catabolic process(GO:0006049) |
| 0.2 | 3.1 | GO:0021860 | pyramidal neuron development(GO:0021860) |
| 0.2 | 3.4 | GO:2000310 | regulation of N-methyl-D-aspartate selective glutamate receptor activity(GO:2000310) |
| 0.2 | 2.0 | GO:0048251 | elastic fiber assembly(GO:0048251) |
| 0.2 | 6.1 | GO:0035641 | locomotory exploration behavior(GO:0035641) |
| 0.2 | 1.3 | GO:1900028 | negative regulation of ruffle assembly(GO:1900028) |
| 0.2 | 1.9 | GO:0015868 | purine ribonucleotide transport(GO:0015868) |
| 0.2 | 1.0 | GO:0015671 | oxygen transport(GO:0015671) |
| 0.2 | 0.8 | GO:0033030 | negative regulation of neutrophil apoptotic process(GO:0033030) |
| 0.2 | 1.4 | GO:0045200 | establishment or maintenance of neuroblast polarity(GO:0045196) establishment of neuroblast polarity(GO:0045200) |
| 0.2 | 2.2 | GO:0048520 | positive regulation of behavior(GO:0048520) |
| 0.2 | 1.2 | GO:1904217 | regulation of CDP-diacylglycerol-serine O-phosphatidyltransferase activity(GO:1904217) positive regulation of CDP-diacylglycerol-serine O-phosphatidyltransferase activity(GO:1904219) regulation of serine C-palmitoyltransferase activity(GO:1904220) positive regulation of serine C-palmitoyltransferase activity(GO:1904222) |
| 0.2 | 4.6 | GO:0007214 | gamma-aminobutyric acid signaling pathway(GO:0007214) |
| 0.2 | 1.1 | GO:0016584 | nucleosome positioning(GO:0016584) |
| 0.1 | 3.7 | GO:0033622 | integrin activation(GO:0033622) |
| 0.1 | 0.7 | GO:0006689 | ganglioside catabolic process(GO:0006689) |
| 0.1 | 0.5 | GO:0045896 | regulation of transcription during mitosis(GO:0045896) positive regulation of transcription during mitosis(GO:0045897) |
| 0.1 | 1.3 | GO:0046415 | urate metabolic process(GO:0046415) |
| 0.1 | 0.6 | GO:0070427 | nucleotide-binding oligomerization domain containing 1 signaling pathway(GO:0070427) |
| 0.1 | 4.7 | GO:0061003 | positive regulation of dendritic spine morphogenesis(GO:0061003) |
| 0.1 | 1.9 | GO:0043011 | myeloid dendritic cell differentiation(GO:0043011) |
| 0.1 | 1.2 | GO:0086036 | regulation of cardiac muscle cell membrane potential(GO:0086036) |
| 0.1 | 1.7 | GO:0002115 | store-operated calcium entry(GO:0002115) |
| 0.1 | 0.3 | GO:0014719 | skeletal muscle satellite cell activation(GO:0014719) |
| 0.1 | 0.6 | GO:0048009 | insulin-like growth factor receptor signaling pathway(GO:0048009) |
| 0.1 | 1.0 | GO:0051967 | negative regulation of synaptic transmission, glutamatergic(GO:0051967) |
| 0.1 | 1.9 | GO:0007095 | mitotic G2 DNA damage checkpoint(GO:0007095) |
| 0.1 | 1.5 | GO:0045792 | negative regulation of cell size(GO:0045792) |
| 0.1 | 0.6 | GO:0032929 | negative regulation of superoxide anion generation(GO:0032929) |
| 0.1 | 4.5 | GO:0060612 | adipose tissue development(GO:0060612) |
| 0.1 | 7.2 | GO:0030032 | lamellipodium assembly(GO:0030032) |
| 0.1 | 2.4 | GO:0042462 | eye photoreceptor cell development(GO:0042462) |
| 0.1 | 0.3 | GO:0038128 | ERBB2 signaling pathway(GO:0038128) |
| 0.1 | 3.5 | GO:0045599 | negative regulation of fat cell differentiation(GO:0045599) |
| 0.1 | 0.7 | GO:0009404 | toxin metabolic process(GO:0009404) |
| 0.1 | 1.9 | GO:0007189 | adenylate cyclase-activating G-protein coupled receptor signaling pathway(GO:0007189) |
| 0.1 | 3.7 | GO:2000179 | positive regulation of neural precursor cell proliferation(GO:2000179) |
| 0.1 | 0.2 | GO:2000574 | regulation of microtubule motor activity(GO:2000574) |
| 0.1 | 2.4 | GO:0036075 | endochondral ossification(GO:0001958) replacement ossification(GO:0036075) |
| 0.1 | 0.4 | GO:0006621 | protein retention in ER lumen(GO:0006621) |
| 0.1 | 3.7 | GO:0046889 | positive regulation of lipid biosynthetic process(GO:0046889) |
| 0.1 | 0.4 | GO:0036506 | maintenance of unfolded protein(GO:0036506) protein insertion into ER membrane(GO:0045048) tail-anchored membrane protein insertion into ER membrane(GO:0071816) maintenance of unfolded protein involved in ERAD pathway(GO:1904378) |
| 0.1 | 1.7 | GO:0006024 | glycosaminoglycan biosynthetic process(GO:0006024) |
| 0.1 | 1.7 | GO:0031365 | N-terminal protein amino acid modification(GO:0031365) |
| 0.1 | 0.2 | GO:0000350 | generation of catalytic spliceosome for second transesterification step(GO:0000350) |
| 0.0 | 5.8 | GO:0007605 | sensory perception of sound(GO:0007605) |
| 0.0 | 0.5 | GO:0010457 | centriole-centriole cohesion(GO:0010457) |
| 0.0 | 8.0 | GO:0031032 | actomyosin structure organization(GO:0031032) |
| 0.0 | 0.8 | GO:0006182 | cGMP biosynthetic process(GO:0006182) |
| 0.0 | 2.5 | GO:0021954 | central nervous system neuron development(GO:0021954) |
| 0.0 | 0.8 | GO:0007340 | acrosome reaction(GO:0007340) |
| 0.0 | 2.4 | GO:0061077 | chaperone-mediated protein folding(GO:0061077) |
| 0.0 | 3.3 | GO:0019722 | calcium-mediated signaling(GO:0019722) |
| 0.0 | 1.3 | GO:0008542 | visual learning(GO:0008542) |
| 0.0 | 0.5 | GO:0044550 | secondary metabolite biosynthetic process(GO:0044550) |
| 0.0 | 0.8 | GO:0033014 | porphyrin-containing compound biosynthetic process(GO:0006779) tetrapyrrole biosynthetic process(GO:0033014) |
| 0.0 | 0.3 | GO:1900153 | regulation of nuclear-transcribed mRNA catabolic process, deadenylation-dependent decay(GO:1900151) positive regulation of nuclear-transcribed mRNA catabolic process, deadenylation-dependent decay(GO:1900153) |
| 0.0 | 1.8 | GO:0042384 | cilium assembly(GO:0042384) |
| 0.0 | 0.5 | GO:0071480 | cellular response to gamma radiation(GO:0071480) |
| 0.0 | 0.3 | GO:0008299 | isoprenoid biosynthetic process(GO:0008299) |
Gene overrepresentation in cellular_component category:
| Log-likelihood per target | Total log-likelihood | Term | Description |
|---|---|---|---|
| 4.7 | 18.6 | GO:0097450 | astrocyte end-foot(GO:0097450) |
| 2.2 | 6.6 | GO:0014802 | terminal cisterna(GO:0014802) |
| 0.9 | 4.6 | GO:0038039 | G-protein coupled receptor heterodimeric complex(GO:0038039) |
| 0.6 | 2.3 | GO:0031838 | haptoglobin-hemoglobin complex(GO:0031838) |
| 0.3 | 7.4 | GO:0000930 | gamma-tubulin complex(GO:0000930) |
| 0.3 | 2.5 | GO:0097433 | dense body(GO:0097433) |
| 0.3 | 7.8 | GO:0043218 | compact myelin(GO:0043218) |
| 0.3 | 2.5 | GO:0097442 | CA3 pyramidal cell dendrite(GO:0097442) |
| 0.3 | 2.0 | GO:0034750 | Scrib-APC-beta-catenin complex(GO:0034750) |
| 0.2 | 5.2 | GO:0031430 | M band(GO:0031430) |
| 0.2 | 3.4 | GO:0016327 | apicolateral plasma membrane(GO:0016327) |
| 0.2 | 1.0 | GO:0032983 | kainate selective glutamate receptor complex(GO:0032983) |
| 0.2 | 1.0 | GO:0033270 | paranode region of axon(GO:0033270) |
| 0.2 | 19.7 | GO:0031225 | anchored component of membrane(GO:0031225) |
| 0.2 | 2.0 | GO:0001527 | microfibril(GO:0001527) |
| 0.2 | 14.7 | GO:0005814 | centriole(GO:0005814) |
| 0.1 | 6.1 | GO:0032420 | stereocilium(GO:0032420) |
| 0.1 | 2.6 | GO:0035327 | transcriptionally active chromatin(GO:0035327) |
| 0.1 | 1.6 | GO:0035253 | ciliary rootlet(GO:0035253) |
| 0.1 | 1.5 | GO:0031931 | TORC1 complex(GO:0031931) |
| 0.1 | 1.9 | GO:0005922 | connexon complex(GO:0005922) |
| 0.1 | 4.8 | GO:0005790 | smooth endoplasmic reticulum(GO:0005790) |
| 0.1 | 1.1 | GO:0008074 | guanylate cyclase complex, soluble(GO:0008074) |
| 0.1 | 1.8 | GO:0034451 | centriolar satellite(GO:0034451) |
| 0.1 | 3.1 | GO:0016581 | NuRD complex(GO:0016581) CHD-type complex(GO:0090545) |
| 0.1 | 2.7 | GO:0071565 | nBAF complex(GO:0071565) |
| 0.1 | 43.3 | GO:0005911 | cell-cell junction(GO:0005911) |
| 0.1 | 4.0 | GO:0005834 | heterotrimeric G-protein complex(GO:0005834) |
| 0.1 | 1.2 | GO:0030061 | mitochondrial crista(GO:0030061) |
| 0.1 | 1.7 | GO:0005797 | Golgi medial cisterna(GO:0005797) |
| 0.1 | 4.1 | GO:0005791 | rough endoplasmic reticulum(GO:0005791) |
| 0.1 | 0.7 | GO:0042582 | primary lysosome(GO:0005766) azurophil granule(GO:0042582) |
| 0.1 | 0.2 | GO:0043083 | synaptic cleft(GO:0043083) |
| 0.1 | 0.4 | GO:0071818 | BAT3 complex(GO:0071818) ER membrane insertion complex(GO:0072379) |
| 0.1 | 15.6 | GO:0031012 | extracellular matrix(GO:0031012) |
| 0.1 | 45.1 | GO:0005887 | integral component of plasma membrane(GO:0005887) |
| 0.0 | 0.1 | GO:1990423 | RZZ complex(GO:1990423) |
| 0.0 | 1.3 | GO:0043195 | terminal bouton(GO:0043195) |
| 0.0 | 2.4 | GO:0005905 | clathrin-coated pit(GO:0005905) |
| 0.0 | 5.4 | GO:0045121 | membrane raft(GO:0045121) membrane microdomain(GO:0098857) |
| 0.0 | 2.7 | GO:0000118 | histone deacetylase complex(GO:0000118) |
| 0.0 | 0.3 | GO:0030991 | intraciliary transport particle A(GO:0030991) |
| 0.0 | 0.3 | GO:0043034 | costamere(GO:0043034) |
| 0.0 | 0.5 | GO:0043679 | axon terminus(GO:0043679) |
| 0.0 | 0.3 | GO:0001891 | phagocytic cup(GO:0001891) |
| 0.0 | 4.9 | GO:0014069 | postsynaptic density(GO:0014069) postsynaptic specialization(GO:0099572) |
| 0.0 | 1.1 | GO:0000786 | nucleosome(GO:0000786) |
| 0.0 | 1.7 | GO:0045177 | apical part of cell(GO:0045177) |
| 0.0 | 0.4 | GO:0005801 | cis-Golgi network(GO:0005801) |
| 0.0 | 2.1 | GO:0031965 | nuclear membrane(GO:0031965) |
Gene overrepresentation in molecular_function category:
| Log-likelihood per target | Total log-likelihood | Term | Description |
|---|---|---|---|
| 7.5 | 30.0 | GO:0015349 | thyroid hormone transmembrane transporter activity(GO:0015349) |
| 1.6 | 4.7 | GO:0004686 | elongation factor-2 kinase activity(GO:0004686) |
| 1.2 | 7.4 | GO:0015265 | urea channel activity(GO:0015265) |
| 1.1 | 6.6 | GO:0015018 | galactosylgalactosylxylosylprotein 3-beta-glucuronosyltransferase activity(GO:0015018) |
| 1.0 | 3.9 | GO:0038049 | glucocorticoid receptor activity(GO:0004883) transcription factor activity, ligand-activated RNA polymerase II transcription factor binding(GO:0038049) glucocorticoid-activated RNA polymerase II transcription factor binding transcription factor activity(GO:0038051) |
| 0.8 | 4.6 | GO:0004965 | G-protein coupled GABA receptor activity(GO:0004965) |
| 0.8 | 32.2 | GO:0005504 | fatty acid binding(GO:0005504) |
| 0.7 | 8.9 | GO:0008191 | metalloendopeptidase inhibitor activity(GO:0008191) |
| 0.6 | 1.9 | GO:0001716 | L-amino-acid oxidase activity(GO:0001716) |
| 0.6 | 4.0 | GO:0031821 | G-protein coupled serotonin receptor binding(GO:0031821) |
| 0.6 | 2.3 | GO:0031721 | haptoglobin binding(GO:0031720) hemoglobin alpha binding(GO:0031721) |
| 0.5 | 4.1 | GO:0005004 | GPI-linked ephrin receptor activity(GO:0005004) |
| 0.4 | 1.3 | GO:0015143 | urate transmembrane transporter activity(GO:0015143) salt transmembrane transporter activity(GO:1901702) |
| 0.4 | 1.2 | GO:0031798 | type 1 metabotropic glutamate receptor binding(GO:0031798) RNA polymerase II transcription factor activity, estrogen-activated sequence-specific DNA binding(GO:0038052) |
| 0.4 | 8.0 | GO:0005520 | insulin-like growth factor binding(GO:0005520) |
| 0.4 | 2.5 | GO:0015091 | ferric iron transmembrane transporter activity(GO:0015091) trivalent inorganic cation transmembrane transporter activity(GO:0072510) |
| 0.3 | 2.7 | GO:0001618 | virus receptor activity(GO:0001618) |
| 0.3 | 1.0 | GO:0005344 | oxygen transporter activity(GO:0005344) |
| 0.3 | 2.7 | GO:0048495 | Roundabout binding(GO:0048495) |
| 0.3 | 2.0 | GO:0098821 | BMP receptor activity(GO:0098821) |
| 0.3 | 1.9 | GO:0008294 | calcium- and calmodulin-responsive adenylate cyclase activity(GO:0008294) |
| 0.3 | 2.5 | GO:0005519 | cytoskeletal regulatory protein binding(GO:0005519) |
| 0.3 | 13.3 | GO:0001205 | transcriptional activator activity, RNA polymerase II distal enhancer sequence-specific binding(GO:0001205) |
| 0.3 | 1.2 | GO:0086038 | calcium:sodium antiporter activity involved in regulation of cardiac muscle cell membrane potential(GO:0086038) |
| 0.3 | 1.7 | GO:0008499 | UDP-galactose:beta-N-acetylglucosamine beta-1,3-galactosyltransferase activity(GO:0008499) |
| 0.3 | 5.2 | GO:0008093 | cytoskeletal adaptor activity(GO:0008093) |
| 0.3 | 3.2 | GO:0001223 | transcription coactivator binding(GO:0001223) |
| 0.2 | 1.0 | GO:0003827 | alpha-1,3-mannosylglycoprotein 2-beta-N-acetylglucosaminyltransferase activity(GO:0003827) |
| 0.2 | 1.4 | GO:0004984 | olfactory receptor activity(GO:0004984) |
| 0.2 | 17.5 | GO:0005200 | structural constituent of cytoskeleton(GO:0005200) |
| 0.2 | 1.3 | GO:0000774 | adenyl-nucleotide exchange factor activity(GO:0000774) |
| 0.2 | 7.4 | GO:0043015 | gamma-tubulin binding(GO:0043015) |
| 0.2 | 2.1 | GO:0019531 | oxalate transmembrane transporter activity(GO:0019531) |
| 0.2 | 1.7 | GO:0005540 | hyaluronic acid binding(GO:0005540) |
| 0.2 | 1.0 | GO:0015277 | kainate selective glutamate receptor activity(GO:0015277) |
| 0.2 | 3.1 | GO:0004435 | phosphatidylinositol phospholipase C activity(GO:0004435) |
| 0.2 | 1.9 | GO:0005243 | gap junction channel activity(GO:0005243) |
| 0.2 | 1.7 | GO:0005229 | intracellular calcium activated chloride channel activity(GO:0005229) |
| 0.1 | 0.6 | GO:0004064 | arylesterase activity(GO:0004064) |
| 0.1 | 2.0 | GO:0051010 | microtubule plus-end binding(GO:0051010) |
| 0.1 | 0.7 | GO:0004499 | N,N-dimethylaniline monooxygenase activity(GO:0004499) |
| 0.1 | 5.1 | GO:0005201 | extracellular matrix structural constituent(GO:0005201) |
| 0.1 | 2.7 | GO:0102391 | decanoate--CoA ligase activity(GO:0102391) |
| 0.1 | 1.7 | GO:0015279 | store-operated calcium channel activity(GO:0015279) |
| 0.1 | 0.7 | GO:0097322 | 7SK snRNA binding(GO:0097322) |
| 0.1 | 0.7 | GO:0004563 | beta-N-acetylhexosaminidase activity(GO:0004563) |
| 0.1 | 0.5 | GO:0034739 | histone deacetylase activity (H4-K16 specific)(GO:0034739) |
| 0.1 | 0.8 | GO:0034916 | oxidoreductase activity, acting on the CH-CH group of donors, oxygen as acceptor(GO:0016634) 4-methyloctanoyl-CoA dehydrogenase activity(GO:0034580) naphthyl-2-methyl-succinyl-CoA dehydrogenase activity(GO:0034845) 2-methylhexanoyl-CoA dehydrogenase activity(GO:0034916) propionyl-CoA dehydrogenase activity(GO:0043820) thiol-driven fumarate reductase activity(GO:0043830) coenzyme F420-dependent 2,4,6-trinitrophenol reductase activity(GO:0052758) coenzyme F420-dependent 2,4,6-trinitrophenol hydride reductase activity(GO:0052759) coenzyme F420-dependent 2,4-dinitrophenol reductase activity(GO:0052760) |
| 0.1 | 3.1 | GO:0009931 | calcium-dependent protein serine/threonine kinase activity(GO:0009931) |
| 0.1 | 1.1 | GO:0004383 | guanylate cyclase activity(GO:0004383) |
| 0.1 | 0.8 | GO:0008440 | inositol-1,4,5-trisphosphate 3-kinase activity(GO:0008440) |
| 0.1 | 1.6 | GO:0008574 | ATP-dependent microtubule motor activity, plus-end-directed(GO:0008574) |
| 0.1 | 0.9 | GO:0018741 | alkyl sulfatase activity(GO:0018741) endosulfan hemisulfate sulfatase activity(GO:0034889) endosulfan sulfate hydrolase activity(GO:0034902) |
| 0.1 | 0.4 | GO:0046923 | ER retention sequence binding(GO:0046923) |
| 0.1 | 3.3 | GO:0043014 | alpha-tubulin binding(GO:0043014) |
| 0.1 | 1.9 | GO:0005035 | tumor necrosis factor-activated receptor activity(GO:0005031) death receptor activity(GO:0005035) |
| 0.1 | 2.3 | GO:0017161 | phosphohistidine phosphatase activity(GO:0008969) inositol-1,3,4-trisphosphate 4-phosphatase activity(GO:0017161) NADP phosphatase activity(GO:0019178) 5-amino-6-(5-phosphoribitylamino)uracil phosphatase activity(GO:0043726) phosphatidylinositol-3,5-bisphosphate 5-phosphatase activity(GO:0043813) inositol-1,3,4,5,6-pentakisphosphate 1-phosphatase activity(GO:0052825) inositol-3,4-bisphosphate 4-phosphatase activity(GO:0052828) inositol-1,3,4-trisphosphate 1-phosphatase activity(GO:0052829) inositol-1,3,4,6-tetrakisphosphate 6-phosphatase activity(GO:0052830) inositol-1,3,4,6-tetrakisphosphate 1-phosphatase activity(GO:0052831) phosphatidylinositol-1,4,5-trisphosphate 5-phosphatase activity(GO:0052867) IDP phosphatase activity(GO:1990003) |
| 0.1 | 0.6 | GO:0046912 | transferase activity, transferring acyl groups, acyl groups converted into alkyl on transfer(GO:0046912) |
| 0.1 | 1.6 | GO:0008599 | protein phosphatase type 1 regulator activity(GO:0008599) |
| 0.1 | 0.6 | GO:0008139 | nuclear localization sequence binding(GO:0008139) |
| 0.1 | 8.1 | GO:0017048 | Rho GTPase binding(GO:0017048) |
| 0.1 | 2.4 | GO:0005528 | macrolide binding(GO:0005527) FK506 binding(GO:0005528) |
| 0.1 | 1.2 | GO:0022889 | L-serine transmembrane transporter activity(GO:0015194) serine transmembrane transporter activity(GO:0022889) |
| 0.1 | 9.3 | GO:0005089 | Rho guanyl-nucleotide exchange factor activity(GO:0005089) |
| 0.1 | 10.1 | GO:0001078 | transcriptional repressor activity, RNA polymerase II core promoter proximal region sequence-specific binding(GO:0001078) |
| 0.1 | 3.1 | GO:0004712 | protein serine/threonine/tyrosine kinase activity(GO:0004712) |
| 0.1 | 5.9 | GO:0004222 | metalloendopeptidase activity(GO:0004222) |
| 0.1 | 6.4 | GO:0008565 | protein transporter activity(GO:0008565) |
| 0.0 | 0.6 | GO:0034450 | ubiquitin-ubiquitin ligase activity(GO:0034450) |
| 0.0 | 1.5 | GO:0070888 | E-box binding(GO:0070888) |
| 0.0 | 1.4 | GO:0048487 | beta-tubulin binding(GO:0048487) |
| 0.0 | 0.2 | GO:0000386 | second spliceosomal transesterification activity(GO:0000386) |
| 0.0 | 2.2 | GO:0003707 | steroid hormone receptor activity(GO:0003707) |
| 0.0 | 2.8 | GO:0005178 | integrin binding(GO:0005178) |
| 0.0 | 1.4 | GO:0046875 | ephrin receptor binding(GO:0046875) |
| 0.0 | 0.5 | GO:0071949 | FAD binding(GO:0071949) |
| 0.0 | 0.4 | GO:0070628 | proteasome binding(GO:0070628) ubiquitin-specific protease binding(GO:1990381) |
| 0.0 | 11.2 | GO:0005509 | calcium ion binding(GO:0005509) |
| 0.0 | 1.9 | GO:0004702 | receptor signaling protein serine/threonine kinase activity(GO:0004702) |
| 0.0 | 1.0 | GO:0003777 | microtubule motor activity(GO:0003777) |
| 0.0 | 0.2 | GO:0005044 | scavenger receptor activity(GO:0005044) |
| 0.0 | 10.0 | GO:0008270 | zinc ion binding(GO:0008270) |