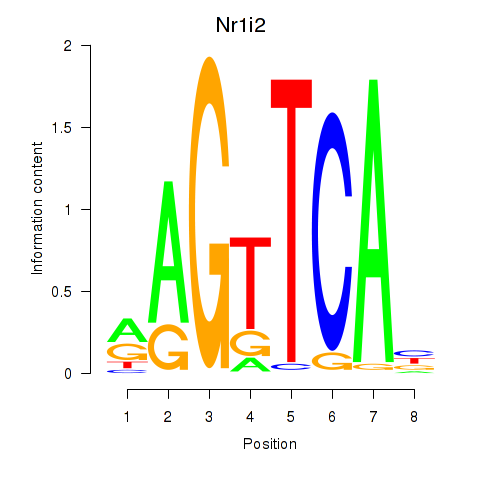
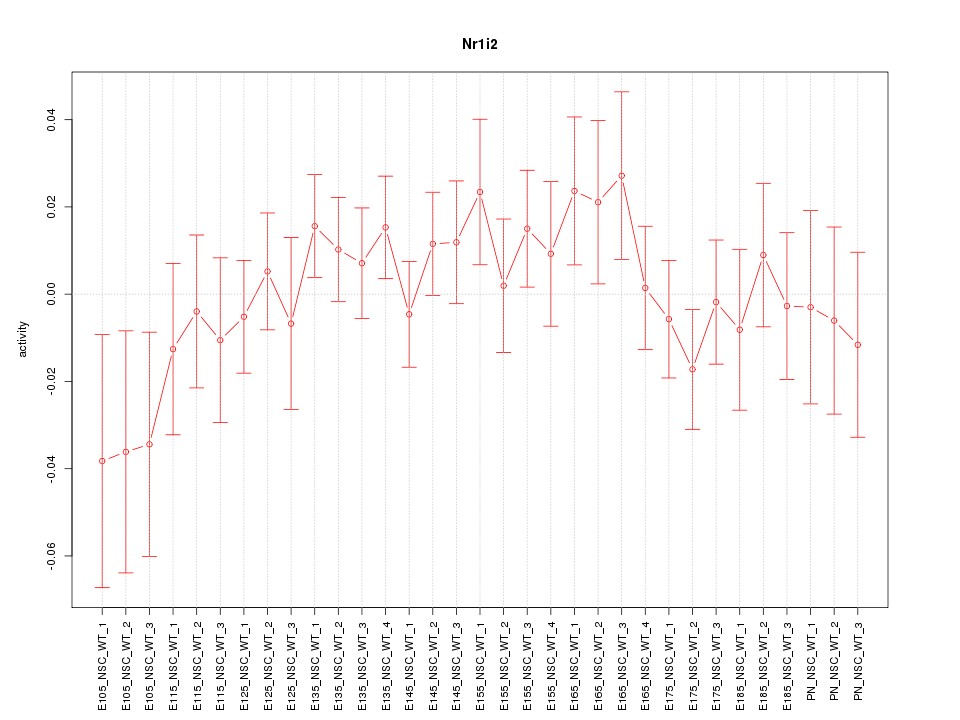
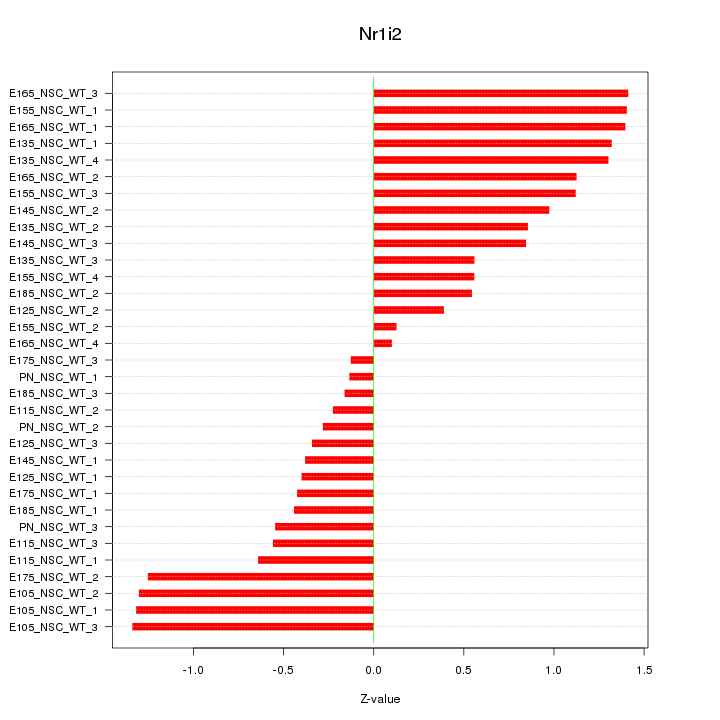
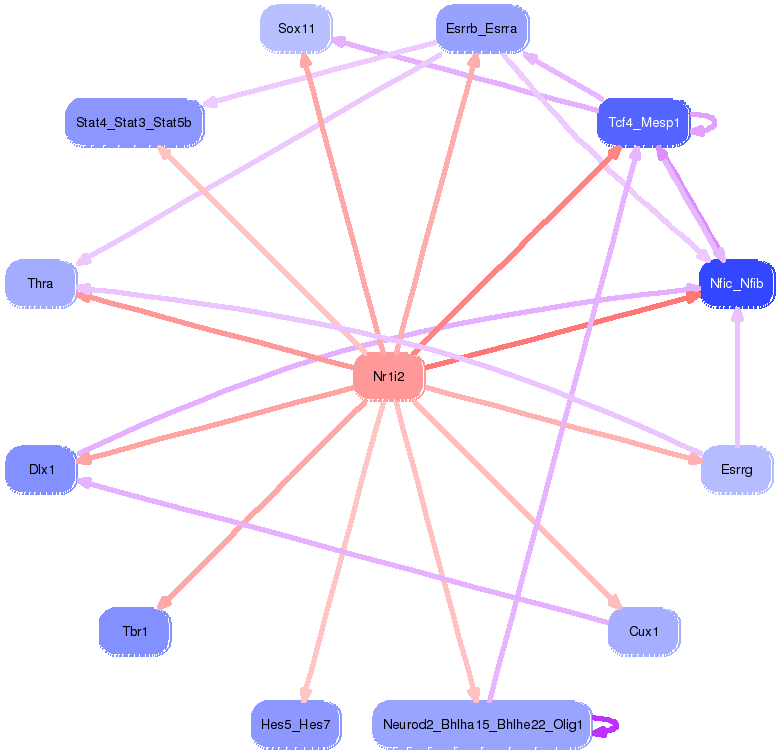
Motif ID: Nr1i2
Z-value: 0.856
Transcription factors associated with Nr1i2:
| Gene Symbol | Entrez ID | Gene Name |
|---|---|---|
| Nr1i2 | ENSMUSG00000022809.4 | Nr1i2 |

Top targets:
Gene overrepresentation in biological_process category:
| Log-likelihood per target | Total log-likelihood | Term | Description |
|---|---|---|---|
| 1.6 | 6.5 | GO:2000795 | negative regulation of epithelial cell proliferation involved in lung morphogenesis(GO:2000795) |
| 1.3 | 3.8 | GO:0071929 | alpha-tubulin acetylation(GO:0071929) |
| 1.1 | 3.3 | GO:0021933 | radial glia guided migration of cerebellar granule cell(GO:0021933) |
| 0.9 | 2.8 | GO:0017055 | negative regulation of RNA polymerase II transcriptional preinitiation complex assembly(GO:0017055) |
| 0.9 | 2.7 | GO:0021577 | hindbrain structural organization(GO:0021577) cerebellum structural organization(GO:0021589) |
| 0.8 | 2.4 | GO:0032430 | positive regulation of phospholipase A2 activity(GO:0032430) activation of meiosis involved in egg activation(GO:0060466) |
| 0.7 | 2.2 | GO:0021893 | cerebral cortex GABAergic interneuron fate commitment(GO:0021893) |
| 0.7 | 3.3 | GO:0019236 | response to pheromone(GO:0019236) |
| 0.6 | 1.9 | GO:0060023 | soft palate development(GO:0060023) |
| 0.6 | 6.2 | GO:0042118 | endothelial cell activation(GO:0042118) |
| 0.6 | 2.2 | GO:0010808 | positive regulation of synaptic vesicle priming(GO:0010808) |
| 0.5 | 1.5 | GO:0071677 | positive regulation of mononuclear cell migration(GO:0071677) |
| 0.5 | 1.5 | GO:2000620 | positive regulation of histone H4-K16 acetylation(GO:2000620) |
| 0.5 | 3.0 | GO:1901524 | regulation of autophagosome maturation(GO:1901096) regulation of macromitophagy(GO:1901524) negative regulation of macromitophagy(GO:1901525) |
| 0.5 | 1.9 | GO:1990743 | protein sialylation(GO:1990743) |
| 0.5 | 4.4 | GO:0036371 | protein localization to M-band(GO:0036309) protein localization to T-tubule(GO:0036371) |
| 0.5 | 3.6 | GO:0061368 | behavioral response to chemical pain(GO:0061366) behavioral response to formalin induced pain(GO:0061368) |
| 0.4 | 4.4 | GO:0007379 | segment specification(GO:0007379) |
| 0.4 | 2.1 | GO:0010991 | negative regulation of SMAD protein complex assembly(GO:0010991) |
| 0.4 | 2.1 | GO:0021856 | cerebral cortex tangential migration using cell-axon interactions(GO:0021824) gonadotrophin-releasing hormone neuronal migration to the hypothalamus(GO:0021828) hypothalamic tangential migration using cell-axon interactions(GO:0021856) facioacoustic ganglion development(GO:1903375) |
| 0.4 | 0.8 | GO:1903147 | negative regulation of mitophagy(GO:1903147) |
| 0.4 | 1.6 | GO:0035609 | C-terminal protein deglutamylation(GO:0035609) |
| 0.4 | 2.0 | GO:0097116 | gephyrin clustering involved in postsynaptic density assembly(GO:0097116) |
| 0.4 | 1.9 | GO:0001661 | conditioned taste aversion(GO:0001661) |
| 0.4 | 1.1 | GO:1901731 | calcium-mediated signaling using extracellular calcium source(GO:0035585) positive regulation of platelet aggregation(GO:1901731) |
| 0.4 | 2.9 | GO:0061002 | negative regulation of dendritic spine morphogenesis(GO:0061002) |
| 0.4 | 1.8 | GO:2000255 | negative regulation of male germ cell proliferation(GO:2000255) |
| 0.4 | 1.1 | GO:1904457 | positive regulation of neuronal action potential(GO:1904457) |
| 0.3 | 2.0 | GO:0042985 | negative regulation of amyloid precursor protein biosynthetic process(GO:0042985) |
| 0.3 | 3.1 | GO:1903608 | protein localization to cytoplasmic stress granule(GO:1903608) |
| 0.3 | 0.9 | GO:0060060 | post-embryonic retina morphogenesis in camera-type eye(GO:0060060) |
| 0.3 | 1.1 | GO:0072365 | regulation of cellular ketone metabolic process by negative regulation of transcription from RNA polymerase II promoter(GO:0072365) |
| 0.3 | 0.8 | GO:0086017 | Purkinje myocyte action potential(GO:0086017) |
| 0.3 | 2.4 | GO:0090043 | regulation of tubulin deacetylation(GO:0090043) |
| 0.3 | 0.8 | GO:0046340 | diacylglycerol catabolic process(GO:0046340) |
| 0.3 | 1.6 | GO:0006172 | ADP biosynthetic process(GO:0006172) |
| 0.2 | 2.7 | GO:0032096 | negative regulation of response to food(GO:0032096) negative regulation of appetite(GO:0032099) |
| 0.2 | 0.8 | GO:1902268 | negative regulation of polyamine transmembrane transport(GO:1902268) |
| 0.2 | 1.1 | GO:0006659 | phosphatidylserine biosynthetic process(GO:0006659) negative regulation of phospholipid biosynthetic process(GO:0071072) |
| 0.2 | 1.0 | GO:0030240 | skeletal muscle thin filament assembly(GO:0030240) |
| 0.2 | 2.6 | GO:0043252 | sodium-independent organic anion transport(GO:0043252) |
| 0.2 | 1.1 | GO:1903690 | negative regulation of wound healing, spreading of epidermal cells(GO:1903690) |
| 0.2 | 2.3 | GO:0051823 | regulation of synapse structural plasticity(GO:0051823) |
| 0.2 | 3.5 | GO:0035235 | ionotropic glutamate receptor signaling pathway(GO:0035235) |
| 0.2 | 4.2 | GO:0032011 | ARF protein signal transduction(GO:0032011) regulation of ARF protein signal transduction(GO:0032012) |
| 0.2 | 0.8 | GO:0090168 | Golgi reassembly(GO:0090168) |
| 0.2 | 1.8 | GO:0070886 | positive regulation of calcineurin-NFAT signaling cascade(GO:0070886) |
| 0.2 | 1.4 | GO:0071420 | cellular response to histamine(GO:0071420) |
| 0.1 | 2.1 | GO:0000042 | protein targeting to Golgi(GO:0000042) |
| 0.1 | 0.4 | GO:1904685 | positive regulation of metalloendopeptidase activity(GO:1904685) |
| 0.1 | 0.6 | GO:1900157 | regulation of bone mineralization involved in bone maturation(GO:1900157) |
| 0.1 | 2.6 | GO:0045793 | positive regulation of cell size(GO:0045793) |
| 0.1 | 0.7 | GO:0070164 | negative regulation of adiponectin secretion(GO:0070164) |
| 0.1 | 0.3 | GO:0097212 | lysosomal membrane organization(GO:0097212) |
| 0.1 | 0.7 | GO:2000822 | regulation of fear response(GO:1903365) positive regulation of fear response(GO:1903367) regulation of behavioral fear response(GO:2000822) positive regulation of behavioral fear response(GO:2000987) |
| 0.1 | 1.7 | GO:0010457 | centriole-centriole cohesion(GO:0010457) |
| 0.1 | 1.2 | GO:0033169 | histone H3-K9 demethylation(GO:0033169) |
| 0.1 | 0.9 | GO:0045200 | establishment or maintenance of neuroblast polarity(GO:0045196) establishment of neuroblast polarity(GO:0045200) |
| 0.1 | 1.4 | GO:0007220 | Notch receptor processing(GO:0007220) |
| 0.1 | 2.2 | GO:0016339 | calcium-dependent cell-cell adhesion via plasma membrane cell adhesion molecules(GO:0016339) |
| 0.1 | 0.5 | GO:0015871 | choline transport(GO:0015871) negative regulation of RIG-I signaling pathway(GO:0039536) |
| 0.1 | 2.4 | GO:0006054 | N-acetylneuraminate metabolic process(GO:0006054) |
| 0.1 | 1.8 | GO:0048172 | regulation of short-term neuronal synaptic plasticity(GO:0048172) |
| 0.1 | 0.8 | GO:1903715 | regulation of aerobic respiration(GO:1903715) |
| 0.1 | 0.5 | GO:2000048 | negative regulation of cell-cell adhesion mediated by cadherin(GO:2000048) |
| 0.1 | 1.4 | GO:0000083 | regulation of transcription involved in G1/S transition of mitotic cell cycle(GO:0000083) |
| 0.1 | 0.3 | GO:0019805 | quinolinate biosynthetic process(GO:0019805) |
| 0.1 | 2.5 | GO:0048026 | positive regulation of mRNA splicing, via spliceosome(GO:0048026) |
| 0.1 | 1.1 | GO:0031665 | negative regulation of lipopolysaccharide-mediated signaling pathway(GO:0031665) |
| 0.1 | 1.2 | GO:0019368 | fatty acid elongation, saturated fatty acid(GO:0019367) fatty acid elongation, unsaturated fatty acid(GO:0019368) fatty acid elongation, monounsaturated fatty acid(GO:0034625) fatty acid elongation, polyunsaturated fatty acid(GO:0034626) |
| 0.1 | 0.4 | GO:0002024 | diet induced thermogenesis(GO:0002024) adaptive thermogenesis(GO:1990845) |
| 0.1 | 0.6 | GO:1900028 | negative regulation of ruffle assembly(GO:1900028) |
| 0.1 | 2.0 | GO:0099517 | anterograde synaptic vesicle transport(GO:0048490) synaptic vesicle cytoskeletal transport(GO:0099514) synaptic vesicle transport along microtubule(GO:0099517) |
| 0.1 | 0.9 | GO:0071472 | cellular response to salt stress(GO:0071472) |
| 0.1 | 2.6 | GO:0008053 | mitochondrial fusion(GO:0008053) |
| 0.1 | 0.4 | GO:0060447 | bud outgrowth involved in lung branching(GO:0060447) |
| 0.1 | 0.6 | GO:0016557 | peroxisome membrane biogenesis(GO:0016557) |
| 0.1 | 0.7 | GO:0007296 | vitellogenesis(GO:0007296) |
| 0.1 | 2.8 | GO:0060749 | mammary gland alveolus development(GO:0060749) mammary gland lobule development(GO:0061377) |
| 0.1 | 0.9 | GO:0060736 | prostate gland growth(GO:0060736) |
| 0.1 | 1.5 | GO:0030574 | collagen catabolic process(GO:0030574) |
| 0.1 | 0.2 | GO:0014873 | response to muscle activity involved in regulation of muscle adaptation(GO:0014873) |
| 0.1 | 1.9 | GO:0009409 | response to cold(GO:0009409) |
| 0.1 | 0.3 | GO:1904177 | regulation of adipose tissue development(GO:1904177) |
| 0.1 | 0.3 | GO:0045925 | positive regulation of female receptivity(GO:0045925) |
| 0.1 | 1.6 | GO:0048268 | clathrin coat assembly(GO:0048268) |
| 0.1 | 0.7 | GO:0015909 | long-chain fatty acid transport(GO:0015909) |
| 0.1 | 1.0 | GO:0033327 | Leydig cell differentiation(GO:0033327) |
| 0.1 | 0.6 | GO:0051645 | Golgi localization(GO:0051645) |
| 0.1 | 0.2 | GO:1990414 | replication-born double-strand break repair via sister chromatid exchange(GO:1990414) |
| 0.1 | 1.2 | GO:0010640 | regulation of platelet-derived growth factor receptor signaling pathway(GO:0010640) |
| 0.1 | 0.7 | GO:0070842 | aggresome assembly(GO:0070842) |
| 0.1 | 0.5 | GO:0071549 | response to dexamethasone(GO:0071548) cellular response to dexamethasone stimulus(GO:0071549) |
| 0.1 | 0.2 | GO:0032095 | regulation of response to food(GO:0032095) |
| 0.1 | 1.1 | GO:0002495 | antigen processing and presentation of peptide antigen via MHC class II(GO:0002495) |
| 0.1 | 0.8 | GO:1902260 | negative regulation of delayed rectifier potassium channel activity(GO:1902260) negative regulation of voltage-gated potassium channel activity(GO:1903817) |
| 0.1 | 0.4 | GO:0010561 | negative regulation of glycoprotein biosynthetic process(GO:0010561) |
| 0.1 | 0.5 | GO:0023021 | termination of signal transduction(GO:0023021) |
| 0.1 | 0.2 | GO:0033602 | negative regulation of dopamine secretion(GO:0033602) |
| 0.1 | 2.2 | GO:0000186 | activation of MAPKK activity(GO:0000186) |
| 0.1 | 0.8 | GO:0007190 | activation of adenylate cyclase activity(GO:0007190) |
| 0.1 | 1.4 | GO:0014047 | glutamate secretion(GO:0014047) |
| 0.1 | 1.0 | GO:0007205 | protein kinase C-activating G-protein coupled receptor signaling pathway(GO:0007205) |
| 0.1 | 0.2 | GO:0098915 | membrane repolarization during ventricular cardiac muscle cell action potential(GO:0098915) |
| 0.1 | 0.2 | GO:0034729 | histone H3-K79 methylation(GO:0034729) |
| 0.1 | 0.3 | GO:0051315 | attachment of mitotic spindle microtubules to kinetochore(GO:0051315) |
| 0.1 | 1.4 | GO:0018345 | protein palmitoylation(GO:0018345) |
| 0.0 | 0.1 | GO:0018214 | peptidyl-glutamic acid carboxylation(GO:0017187) protein carboxylation(GO:0018214) |
| 0.0 | 0.3 | GO:1903071 | positive regulation of ER-associated ubiquitin-dependent protein catabolic process(GO:1903071) |
| 0.0 | 1.3 | GO:0002063 | chondrocyte development(GO:0002063) |
| 0.0 | 0.2 | GO:2001023 | regulation of response to drug(GO:2001023) |
| 0.0 | 0.3 | GO:0035871 | protein K11-linked deubiquitination(GO:0035871) |
| 0.0 | 0.5 | GO:0061179 | negative regulation of insulin secretion involved in cellular response to glucose stimulus(GO:0061179) |
| 0.0 | 1.0 | GO:2000772 | regulation of cellular senescence(GO:2000772) |
| 0.0 | 0.5 | GO:1900383 | regulation of synaptic plasticity by receptor localization to synapse(GO:1900383) |
| 0.0 | 0.3 | GO:0098734 | protein depalmitoylation(GO:0002084) macromolecule depalmitoylation(GO:0098734) |
| 0.0 | 0.7 | GO:0072643 | interferon-gamma secretion(GO:0072643) |
| 0.0 | 0.9 | GO:0010614 | negative regulation of cardiac muscle hypertrophy(GO:0010614) |
| 0.0 | 0.3 | GO:0051036 | regulation of endosome size(GO:0051036) |
| 0.0 | 0.3 | GO:0015840 | urea transport(GO:0015840) urea transmembrane transport(GO:0071918) |
| 0.0 | 0.6 | GO:0045956 | positive regulation of calcium ion-dependent exocytosis(GO:0045956) |
| 0.0 | 0.7 | GO:1901897 | regulation of relaxation of cardiac muscle(GO:1901897) |
| 0.0 | 0.3 | GO:0019370 | leukotriene biosynthetic process(GO:0019370) |
| 0.0 | 0.2 | GO:0015812 | gamma-aminobutyric acid transport(GO:0015812) |
| 0.0 | 0.4 | GO:0006622 | protein targeting to lysosome(GO:0006622) |
| 0.0 | 0.8 | GO:0035641 | locomotory exploration behavior(GO:0035641) |
| 0.0 | 0.1 | GO:0034975 | protein folding in endoplasmic reticulum(GO:0034975) |
| 0.0 | 0.4 | GO:0014807 | regulation of somitogenesis(GO:0014807) |
| 0.0 | 0.2 | GO:0034116 | positive regulation of heterotypic cell-cell adhesion(GO:0034116) |
| 0.0 | 1.2 | GO:1902476 | chloride transmembrane transport(GO:1902476) |
| 0.0 | 1.2 | GO:0032728 | positive regulation of interferon-beta production(GO:0032728) |
| 0.0 | 0.6 | GO:2000352 | negative regulation of endothelial cell apoptotic process(GO:2000352) |
| 0.0 | 0.1 | GO:0090296 | regulation of mitochondrial DNA replication(GO:0090296) negative regulation of mitochondrial DNA replication(GO:0090298) |
| 0.0 | 0.2 | GO:0090611 | ubiquitin-independent protein catabolic process via the multivesicular body sorting pathway(GO:0090611) positive regulation of extracellular exosome assembly(GO:1903553) |
| 0.0 | 1.5 | GO:0045668 | negative regulation of osteoblast differentiation(GO:0045668) |
| 0.0 | 1.6 | GO:0033138 | positive regulation of peptidyl-serine phosphorylation(GO:0033138) |
| 0.0 | 0.8 | GO:0060765 | regulation of androgen receptor signaling pathway(GO:0060765) |
| 0.0 | 0.6 | GO:0001574 | ganglioside biosynthetic process(GO:0001574) |
| 0.0 | 0.3 | GO:0045974 | miRNA mediated inhibition of translation(GO:0035278) negative regulation of translation, ncRNA-mediated(GO:0040033) regulation of translation, ncRNA-mediated(GO:0045974) |
| 0.0 | 0.2 | GO:0006488 | dolichol-linked oligosaccharide biosynthetic process(GO:0006488) |
| 0.0 | 1.0 | GO:0032292 | myelination in peripheral nervous system(GO:0022011) peripheral nervous system axon ensheathment(GO:0032292) |
| 0.0 | 1.2 | GO:0048843 | negative regulation of axon extension involved in axon guidance(GO:0048843) negative chemotaxis(GO:0050919) |
| 0.0 | 1.4 | GO:0045670 | regulation of osteoclast differentiation(GO:0045670) |
| 0.0 | 2.2 | GO:0030032 | lamellipodium assembly(GO:0030032) |
| 0.0 | 0.6 | GO:0033006 | regulation of mast cell activation involved in immune response(GO:0033006) regulation of mast cell degranulation(GO:0043304) |
| 0.0 | 0.4 | GO:1902624 | positive regulation of granulocyte chemotaxis(GO:0071624) positive regulation of neutrophil chemotaxis(GO:0090023) positive regulation of neutrophil migration(GO:1902624) |
| 0.0 | 1.0 | GO:0045599 | negative regulation of fat cell differentiation(GO:0045599) |
| 0.0 | 0.1 | GO:0002035 | brain renin-angiotensin system(GO:0002035) |
| 0.0 | 1.4 | GO:0099643 | neurotransmitter secretion(GO:0007269) signal release from synapse(GO:0099643) |
| 0.0 | 0.8 | GO:0015991 | energy coupled proton transmembrane transport, against electrochemical gradient(GO:0015988) ATP hydrolysis coupled proton transport(GO:0015991) ATP hydrolysis coupled transmembrane transport(GO:0090662) |
| 0.0 | 0.3 | GO:0007214 | gamma-aminobutyric acid signaling pathway(GO:0007214) |
| 0.0 | 0.3 | GO:0097066 | response to thyroid hormone(GO:0097066) |
| 0.0 | 0.6 | GO:0070584 | mitochondrion morphogenesis(GO:0070584) |
| 0.0 | 0.2 | GO:1901673 | regulation of mitotic spindle assembly(GO:1901673) |
| 0.0 | 1.1 | GO:0018107 | peptidyl-threonine phosphorylation(GO:0018107) |
| 0.0 | 0.5 | GO:0006198 | cAMP catabolic process(GO:0006198) |
| 0.0 | 0.4 | GO:0051974 | negative regulation of telomerase activity(GO:0051974) |
| 0.0 | 1.3 | GO:0019319 | hexose biosynthetic process(GO:0019319) |
| 0.0 | 0.2 | GO:1900037 | regulation of cellular response to hypoxia(GO:1900037) |
| 0.0 | 0.8 | GO:0008542 | visual learning(GO:0008542) |
| 0.0 | 0.2 | GO:0043552 | positive regulation of phosphatidylinositol 3-kinase activity(GO:0043552) |
| 0.0 | 0.6 | GO:0019933 | cAMP-mediated signaling(GO:0019933) |
| 0.0 | 1.7 | GO:0001578 | microtubule bundle formation(GO:0001578) |
| 0.0 | 2.1 | GO:0006342 | chromatin silencing(GO:0006342) |
| 0.0 | 0.3 | GO:0045653 | negative regulation of megakaryocyte differentiation(GO:0045653) |
| 0.0 | 0.3 | GO:0032469 | endoplasmic reticulum calcium ion homeostasis(GO:0032469) |
| 0.0 | 0.7 | GO:0034605 | cellular response to heat(GO:0034605) |
| 0.0 | 0.8 | GO:0017158 | regulation of calcium ion-dependent exocytosis(GO:0017158) |
| 0.0 | 2.4 | GO:0071805 | potassium ion transmembrane transport(GO:0071805) |
| 0.0 | 1.9 | GO:0007286 | spermatid development(GO:0007286) |
| 0.0 | 0.6 | GO:0007050 | cell cycle arrest(GO:0007050) |
| 0.0 | 0.2 | GO:0019348 | dolichol metabolic process(GO:0019348) |
| 0.0 | 1.2 | GO:0050770 | regulation of axonogenesis(GO:0050770) |
| 0.0 | 0.2 | GO:0048096 | chromatin-mediated maintenance of transcription(GO:0048096) |
| 0.0 | 0.3 | GO:0019835 | cytolysis(GO:0019835) |
| 0.0 | 0.8 | GO:0007157 | heterophilic cell-cell adhesion via plasma membrane cell adhesion molecules(GO:0007157) |
| 0.0 | 0.1 | GO:0046416 | D-amino acid metabolic process(GO:0046416) |
| 0.0 | 0.6 | GO:0031146 | SCF-dependent proteasomal ubiquitin-dependent protein catabolic process(GO:0031146) |
| 0.0 | 1.2 | GO:0032436 | positive regulation of proteasomal ubiquitin-dependent protein catabolic process(GO:0032436) |
| 0.0 | 1.4 | GO:1903955 | positive regulation of protein targeting to mitochondrion(GO:1903955) |
| 0.0 | 0.2 | GO:0048875 | chemical homeostasis within a tissue(GO:0048875) |
| 0.0 | 0.2 | GO:0043508 | negative regulation of JUN kinase activity(GO:0043508) |
| 0.0 | 0.4 | GO:0043392 | negative regulation of DNA binding(GO:0043392) |
| 0.0 | 0.1 | GO:0046085 | adenosine metabolic process(GO:0046085) |
| 0.0 | 0.3 | GO:0043153 | entrainment of circadian clock by photoperiod(GO:0043153) |
| 0.0 | 0.1 | GO:0071397 | cellular response to cholesterol(GO:0071397) |
| 0.0 | 0.8 | GO:0031338 | regulation of vesicle fusion(GO:0031338) |
| 0.0 | 0.4 | GO:0001782 | B cell homeostasis(GO:0001782) |
| 0.0 | 0.2 | GO:0035999 | tetrahydrofolate interconversion(GO:0035999) |
| 0.0 | 0.4 | GO:0000381 | regulation of alternative mRNA splicing, via spliceosome(GO:0000381) |
| 0.0 | 0.3 | GO:0048025 | negative regulation of mRNA splicing, via spliceosome(GO:0048025) |
| 0.0 | 0.2 | GO:0030575 | nuclear body organization(GO:0030575) |
| 0.0 | 0.2 | GO:0021796 | cerebral cortex regionalization(GO:0021796) |
| 0.0 | 0.2 | GO:0015985 | energy coupled proton transport, down electrochemical gradient(GO:0015985) ATP synthesis coupled proton transport(GO:0015986) |
| 0.0 | 0.4 | GO:0008156 | negative regulation of DNA replication(GO:0008156) |
| 0.0 | 0.4 | GO:0070936 | protein K48-linked ubiquitination(GO:0070936) |
| 0.0 | 0.1 | GO:0043374 | CD8-positive, alpha-beta T cell differentiation(GO:0043374) |
| 0.0 | 0.7 | GO:0006906 | vesicle fusion(GO:0006906) |
| 0.0 | 0.5 | GO:0007173 | epidermal growth factor receptor signaling pathway(GO:0007173) |
| 0.0 | 1.1 | GO:1990138 | neuron projection extension(GO:1990138) |
| 0.0 | 0.2 | GO:0006308 | DNA catabolic process(GO:0006308) |
| 0.0 | 0.1 | GO:0010971 | positive regulation of G2/M transition of mitotic cell cycle(GO:0010971) positive regulation of cell cycle G2/M phase transition(GO:1902751) |
| 0.0 | 0.3 | GO:0042491 | auditory receptor cell differentiation(GO:0042491) |
Gene overrepresentation in cellular_component category:
| Log-likelihood per target | Total log-likelihood | Term | Description |
|---|---|---|---|
| 0.8 | 3.1 | GO:0097165 | nuclear stress granule(GO:0097165) |
| 0.6 | 3.8 | GO:0097427 | microtubule bundle(GO:0097427) |
| 0.6 | 2.3 | GO:1990316 | ATG1/ULK1 kinase complex(GO:1990316) |
| 0.5 | 5.5 | GO:0043083 | synaptic cleft(GO:0043083) |
| 0.4 | 1.3 | GO:0044194 | cytolytic granule(GO:0044194) |
| 0.4 | 1.1 | GO:0030981 | cortical microtubule cytoskeleton(GO:0030981) |
| 0.3 | 6.5 | GO:0044300 | cerebellar mossy fiber(GO:0044300) |
| 0.3 | 1.1 | GO:0031095 | platelet dense tubular network membrane(GO:0031095) |
| 0.2 | 1.1 | GO:0044316 | cone cell pedicle(GO:0044316) |
| 0.2 | 1.6 | GO:0001520 | outer dense fiber(GO:0001520) |
| 0.2 | 1.9 | GO:0000138 | Golgi trans cisterna(GO:0000138) |
| 0.2 | 2.7 | GO:0043203 | axon hillock(GO:0043203) |
| 0.2 | 9.5 | GO:0030672 | synaptic vesicle membrane(GO:0030672) exocytic vesicle membrane(GO:0099501) |
| 0.2 | 2.0 | GO:1904115 | axon cytoplasm(GO:1904115) |
| 0.2 | 4.4 | GO:0031430 | M band(GO:0031430) |
| 0.1 | 1.3 | GO:0033180 | proton-transporting V-type ATPase, V1 domain(GO:0033180) |
| 0.1 | 0.5 | GO:0043202 | lysosomal lumen(GO:0043202) |
| 0.1 | 0.4 | GO:1990879 | CST complex(GO:1990879) |
| 0.1 | 3.4 | GO:0031307 | integral component of mitochondrial outer membrane(GO:0031307) |
| 0.1 | 1.6 | GO:0008385 | IkappaB kinase complex(GO:0008385) |
| 0.1 | 2.0 | GO:1902710 | GABA receptor complex(GO:1902710) GABA-A receptor complex(GO:1902711) |
| 0.1 | 0.5 | GO:0016035 | zeta DNA polymerase complex(GO:0016035) |
| 0.1 | 1.7 | GO:0042101 | T cell receptor complex(GO:0042101) |
| 0.1 | 0.3 | GO:1990037 | Lewy body core(GO:1990037) |
| 0.1 | 6.8 | GO:0042734 | presynaptic membrane(GO:0042734) |
| 0.1 | 2.9 | GO:0032809 | neuronal cell body membrane(GO:0032809) |
| 0.1 | 2.4 | GO:0051233 | spindle midzone(GO:0051233) |
| 0.1 | 3.7 | GO:0008023 | transcription elongation factor complex(GO:0008023) |
| 0.1 | 0.1 | GO:0097629 | extrinsic component of omegasome membrane(GO:0097629) |
| 0.1 | 3.4 | GO:0030173 | integral component of Golgi membrane(GO:0030173) |
| 0.1 | 1.9 | GO:0005868 | cytoplasmic dynein complex(GO:0005868) |
| 0.1 | 0.3 | GO:0032280 | symmetric synapse(GO:0032280) |
| 0.1 | 2.2 | GO:0030427 | site of polarized growth(GO:0030427) |
| 0.1 | 0.5 | GO:0042599 | lamellar body(GO:0042599) |
| 0.1 | 2.2 | GO:0060170 | ciliary membrane(GO:0060170) |
| 0.1 | 2.2 | GO:0031901 | early endosome membrane(GO:0031901) |
| 0.1 | 0.3 | GO:0035032 | phosphatidylinositol 3-kinase complex, class III(GO:0035032) |
| 0.1 | 0.8 | GO:0034706 | voltage-gated sodium channel complex(GO:0001518) sodium channel complex(GO:0034706) |
| 0.0 | 1.6 | GO:0005721 | pericentric heterochromatin(GO:0005721) |
| 0.0 | 0.3 | GO:0005638 | lamin filament(GO:0005638) |
| 0.0 | 2.9 | GO:0005844 | polysome(GO:0005844) |
| 0.0 | 0.1 | GO:0008282 | ATP-sensitive potassium channel complex(GO:0008282) |
| 0.0 | 1.6 | GO:0097440 | apical dendrite(GO:0097440) |
| 0.0 | 0.2 | GO:0033185 | dolichol-phosphate-mannose synthase complex(GO:0033185) |
| 0.0 | 1.4 | GO:0015030 | Cajal body(GO:0015030) |
| 0.0 | 0.2 | GO:0042382 | paraspeckles(GO:0042382) |
| 0.0 | 1.1 | GO:0030660 | Golgi-associated vesicle membrane(GO:0030660) |
| 0.0 | 2.7 | GO:0000786 | nucleosome(GO:0000786) |
| 0.0 | 0.8 | GO:0000407 | pre-autophagosomal structure(GO:0000407) |
| 0.0 | 0.3 | GO:0000815 | ESCRT III complex(GO:0000815) |
| 0.0 | 1.6 | GO:0030118 | clathrin coat(GO:0030118) |
| 0.0 | 3.4 | GO:0031234 | extrinsic component of cytoplasmic side of plasma membrane(GO:0031234) |
| 0.0 | 0.4 | GO:0036038 | MKS complex(GO:0036038) |
| 0.0 | 0.3 | GO:0030137 | COPI-coated vesicle(GO:0030137) |
| 0.0 | 3.1 | GO:0010008 | endosome membrane(GO:0010008) |
| 0.0 | 0.2 | GO:0045261 | mitochondrial proton-transporting ATP synthase complex, catalytic core F(1)(GO:0000275) proton-transporting ATP synthase complex, catalytic core F(1)(GO:0045261) |
| 0.0 | 1.5 | GO:0031463 | Cul3-RING ubiquitin ligase complex(GO:0031463) |
| 0.0 | 2.3 | GO:0005814 | centriole(GO:0005814) |
| 0.0 | 1.1 | GO:0030136 | clathrin-coated vesicle(GO:0030136) |
| 0.0 | 6.4 | GO:0060076 | excitatory synapse(GO:0060076) |
| 0.0 | 0.1 | GO:0005797 | Golgi medial cisterna(GO:0005797) |
| 0.0 | 1.9 | GO:0005884 | actin filament(GO:0005884) |
| 0.0 | 0.4 | GO:0005782 | peroxisomal matrix(GO:0005782) microbody lumen(GO:0031907) |
| 0.0 | 0.7 | GO:0045171 | intercellular bridge(GO:0045171) |
| 0.0 | 0.9 | GO:0014704 | intercalated disc(GO:0014704) |
| 0.0 | 0.1 | GO:0030688 | preribosome, small subunit precursor(GO:0030688) |
| 0.0 | 0.1 | GO:0033553 | rDNA heterochromatin(GO:0033553) |
| 0.0 | 0.2 | GO:0000506 | glycosylphosphatidylinositol-N-acetylglucosaminyltransferase (GPI-GnT) complex(GO:0000506) |
| 0.0 | 0.5 | GO:0072372 | primary cilium(GO:0072372) |
| 0.0 | 1.1 | GO:0016363 | nuclear matrix(GO:0016363) |
| 0.0 | 1.1 | GO:0043679 | axon terminus(GO:0043679) |
| 0.0 | 0.1 | GO:0072546 | ER membrane protein complex(GO:0072546) |
| 0.0 | 0.6 | GO:0032587 | ruffle membrane(GO:0032587) |
| 0.0 | 0.2 | GO:0005779 | integral component of peroxisomal membrane(GO:0005779) |
| 0.0 | 0.6 | GO:0019005 | SCF ubiquitin ligase complex(GO:0019005) |
Gene overrepresentation in molecular_function category:
| Log-likelihood per target | Total log-likelihood | Term | Description |
|---|---|---|---|
| 1.6 | 6.2 | GO:0001011 | transcription factor activity, sequence-specific DNA binding, RNA polymerase recruiting(GO:0001011) transcription factor activity, TFIIB-class binding(GO:0001087) |
| 1.0 | 2.9 | GO:0031798 | type 1 metabotropic glutamate receptor binding(GO:0031798) |
| 0.9 | 2.8 | GO:0002153 | steroid receptor RNA activator RNA binding(GO:0002153) |
| 0.9 | 4.3 | GO:0003835 | beta-galactoside alpha-2,6-sialyltransferase activity(GO:0003835) |
| 0.6 | 2.6 | GO:0001640 | adenylate cyclase inhibiting G-protein coupled glutamate receptor activity(GO:0001640) |
| 0.6 | 1.8 | GO:0050656 | 3'-phosphoadenosine 5'-phosphosulfate binding(GO:0050656) |
| 0.6 | 3.5 | GO:0015277 | kainate selective glutamate receptor activity(GO:0015277) |
| 0.4 | 1.8 | GO:0004667 | prostaglandin-D synthase activity(GO:0004667) |
| 0.4 | 1.4 | GO:0005237 | inhibitory extracellular ligand-gated ion channel activity(GO:0005237) |
| 0.3 | 2.0 | GO:0003828 | alpha-N-acetylneuraminate alpha-2,8-sialyltransferase activity(GO:0003828) |
| 0.2 | 2.6 | GO:0015347 | sodium-independent organic anion transmembrane transporter activity(GO:0015347) |
| 0.2 | 2.6 | GO:0038191 | neuropilin binding(GO:0038191) |
| 0.2 | 4.0 | GO:0008599 | protein phosphatase type 1 regulator activity(GO:0008599) |
| 0.2 | 0.8 | GO:0071532 | ornithine decarboxylase inhibitor activity(GO:0008073) ankyrin repeat binding(GO:0071532) |
| 0.2 | 6.5 | GO:0001106 | RNA polymerase II transcription corepressor activity(GO:0001106) |
| 0.2 | 3.3 | GO:0035613 | RNA stem-loop binding(GO:0035613) |
| 0.2 | 3.8 | GO:0005184 | neuropeptide hormone activity(GO:0005184) |
| 0.2 | 2.0 | GO:0097109 | neuroligin family protein binding(GO:0097109) |
| 0.2 | 2.9 | GO:0050811 | GABA receptor binding(GO:0050811) |
| 0.2 | 0.6 | GO:0008332 | low voltage-gated calcium channel activity(GO:0008332) |
| 0.1 | 0.4 | GO:0004879 | RNA polymerase II transcription factor activity, ligand-activated sequence-specific DNA binding(GO:0004879) transcription factor activity, direct ligand regulated sequence-specific DNA binding(GO:0098531) |
| 0.1 | 1.2 | GO:0032454 | histone demethylase activity (H3-K9 specific)(GO:0032454) |
| 0.1 | 4.3 | GO:0008093 | cytoskeletal adaptor activity(GO:0008093) |
| 0.1 | 1.6 | GO:0004017 | adenylate kinase activity(GO:0004017) |
| 0.1 | 0.4 | GO:0004980 | melanocortin receptor activity(GO:0004977) melanocyte-stimulating hormone receptor activity(GO:0004980) |
| 0.1 | 0.8 | GO:0055131 | C3HC4-type RING finger domain binding(GO:0055131) |
| 0.1 | 2.6 | GO:0004198 | calcium-dependent cysteine-type endopeptidase activity(GO:0004198) |
| 0.1 | 0.7 | GO:0004095 | carnitine O-palmitoyltransferase activity(GO:0004095) |
| 0.1 | 0.3 | GO:1990825 | sequence-specific mRNA binding(GO:1990825) |
| 0.1 | 0.8 | GO:0042134 | rRNA primary transcript binding(GO:0042134) |
| 0.1 | 4.6 | GO:0005086 | ARF guanyl-nucleotide exchange factor activity(GO:0005086) |
| 0.1 | 0.8 | GO:0008294 | calcium- and calmodulin-responsive adenylate cyclase activity(GO:0008294) |
| 0.1 | 1.4 | GO:0035014 | phosphatidylinositol 3-kinase regulator activity(GO:0035014) |
| 0.1 | 0.8 | GO:0086006 | voltage-gated sodium channel activity involved in cardiac muscle cell action potential(GO:0086006) |
| 0.1 | 0.7 | GO:0015379 | potassium:chloride symporter activity(GO:0015379) potassium ion symporter activity(GO:0022820) |
| 0.1 | 0.5 | GO:0008392 | arachidonic acid monooxygenase activity(GO:0008391) arachidonic acid epoxygenase activity(GO:0008392) |
| 0.1 | 3.0 | GO:0005251 | delayed rectifier potassium channel activity(GO:0005251) |
| 0.1 | 0.6 | GO:0016936 | galactoside binding(GO:0016936) |
| 0.1 | 1.2 | GO:0102338 | fatty acid elongase activity(GO:0009922) 3-oxo-arachidoyl-CoA synthase activity(GO:0102336) 3-oxo-cerotoyl-CoA synthase activity(GO:0102337) 3-oxo-lignoceronyl-CoA synthase activity(GO:0102338) |
| 0.1 | 1.9 | GO:0005540 | hyaluronic acid binding(GO:0005540) |
| 0.1 | 0.8 | GO:0001162 | RNA polymerase II intronic transcription regulatory region sequence-specific DNA binding(GO:0001162) |
| 0.1 | 0.8 | GO:0008121 | ubiquinol-cytochrome-c reductase activity(GO:0008121) oxidoreductase activity, acting on diphenols and related substances as donors(GO:0016679) oxidoreductase activity, acting on diphenols and related substances as donors, cytochrome as acceptor(GO:0016681) |
| 0.1 | 0.7 | GO:0051959 | dynein light intermediate chain binding(GO:0051959) |
| 0.1 | 3.1 | GO:0017091 | AU-rich element binding(GO:0017091) |
| 0.1 | 1.1 | GO:0034943 | acyl-CoA ligase activity(GO:0003996) 3-oxo-2-(2'-pentenyl)cyclopentane-1-octanoic acid CoA ligase activity(GO:0010435) 3-isopropenyl-6-oxoheptanoyl-CoA synthetase activity(GO:0018854) 2-oxo-delta3-4,5,5-trimethylcyclopentenylacetyl-CoA synthetase activity(GO:0018855) benzoyl acetate-CoA ligase activity(GO:0018856) 2,4-dichlorobenzoate-CoA ligase activity(GO:0018857) pivalate-CoA ligase activity(GO:0034783) cyclopropanecarboxylate-CoA ligase activity(GO:0034793) adipate-CoA ligase activity(GO:0034796) citronellyl-CoA ligase activity(GO:0034823) mentha-1,3-dione-CoA ligase activity(GO:0034841) thiophene-2-carboxylate-CoA ligase activity(GO:0034842) 2,4,4-trimethylpentanoate-CoA ligase activity(GO:0034865) cis-2-methyl-5-isopropylhexa-2,5-dienoate-CoA ligase activity(GO:0034942) trans-2-methyl-5-isopropylhexa-2,5-dienoate-CoA ligase activity(GO:0034943) branched-chain acyl-CoA synthetase (ADP-forming) activity(GO:0043759) aryl-CoA synthetase (ADP-forming) activity(GO:0043762) 3-hydroxypropionyl-CoA synthetase activity(GO:0043955) perillic acid:CoA ligase (ADP-forming) activity(GO:0052685) perillic acid:CoA ligase (AMP-forming) activity(GO:0052686) (3R)-3-isopropenyl-6-oxoheptanoate:CoA ligase (ADP-forming) activity(GO:0052687) (3R)-3-isopropenyl-6-oxoheptanoate:CoA ligase (AMP-forming) activity(GO:0052688) pristanate-CoA ligase activity(GO:0070251) malonyl-CoA synthetase activity(GO:0090409) |
| 0.1 | 3.2 | GO:0004709 | MAP kinase kinase kinase activity(GO:0004709) |
| 0.1 | 1.6 | GO:0004181 | metallocarboxypeptidase activity(GO:0004181) |
| 0.1 | 0.2 | GO:0031871 | proteinase activated receptor binding(GO:0031871) |
| 0.1 | 1.4 | GO:0005242 | inward rectifier potassium channel activity(GO:0005242) |
| 0.1 | 2.9 | GO:0004364 | glutathione transferase activity(GO:0004364) |
| 0.1 | 0.2 | GO:0004698 | calcium-dependent protein kinase C activity(GO:0004698) |
| 0.1 | 1.7 | GO:0043325 | phosphatidylinositol-3,4-bisphosphate binding(GO:0043325) |
| 0.1 | 2.7 | GO:0042169 | SH2 domain binding(GO:0042169) |
| 0.1 | 0.5 | GO:0070742 | C2H2 zinc finger domain binding(GO:0070742) |
| 0.1 | 0.6 | GO:0003836 | beta-galactoside (CMP) alpha-2,3-sialyltransferase activity(GO:0003836) |
| 0.1 | 2.1 | GO:0005112 | Notch binding(GO:0005112) |
| 0.1 | 0.8 | GO:0004176 | ATP-dependent peptidase activity(GO:0004176) |
| 0.1 | 0.2 | GO:0008109 | N-acetyllactosaminide beta-1,6-N-acetylglucosaminyltransferase activity(GO:0008109) |
| 0.1 | 1.5 | GO:0005104 | fibroblast growth factor receptor binding(GO:0005104) |
| 0.1 | 1.1 | GO:0002162 | dystroglycan binding(GO:0002162) |
| 0.1 | 4.6 | GO:0061733 | peptide-lysine-N-acetyltransferase activity(GO:0061733) |
| 0.1 | 1.4 | GO:0043274 | phospholipase binding(GO:0043274) |
| 0.1 | 2.1 | GO:0070412 | R-SMAD binding(GO:0070412) |
| 0.1 | 1.1 | GO:0042287 | MHC protein binding(GO:0042287) |
| 0.1 | 0.2 | GO:0019166 | trans-2-enoyl-CoA reductase (NADPH) activity(GO:0019166) |
| 0.1 | 1.4 | GO:0019706 | protein-cysteine S-palmitoyltransferase activity(GO:0019706) |
| 0.1 | 1.5 | GO:0046961 | proton-transporting ATPase activity, rotational mechanism(GO:0046961) |
| 0.1 | 2.3 | GO:0005544 | calcium-dependent phospholipid binding(GO:0005544) |
| 0.1 | 1.4 | GO:0031624 | ubiquitin conjugating enzyme binding(GO:0031624) |
| 0.1 | 1.0 | GO:0005452 | inorganic anion exchanger activity(GO:0005452) |
| 0.1 | 0.6 | GO:0005522 | profilin binding(GO:0005522) |
| 0.1 | 0.2 | GO:0005332 | gamma-aminobutyric acid:sodium symporter activity(GO:0005332) |
| 0.1 | 0.2 | GO:0046997 | sarcosine dehydrogenase activity(GO:0008480) oxidoreductase activity, acting on the CH-NH group of donors, flavin as acceptor(GO:0046997) |
| 0.1 | 0.3 | GO:0019841 | retinol binding(GO:0019841) |
| 0.0 | 0.3 | GO:0015265 | urea channel activity(GO:0015265) |
| 0.0 | 0.2 | GO:1990380 | Lys48-specific deubiquitinase activity(GO:1990380) |
| 0.0 | 2.0 | GO:0005546 | phosphatidylinositol-4,5-bisphosphate binding(GO:0005546) |
| 0.0 | 0.8 | GO:0005078 | MAP-kinase scaffold activity(GO:0005078) |
| 0.0 | 0.9 | GO:0097602 | cullin family protein binding(GO:0097602) |
| 0.0 | 0.4 | GO:0005041 | low-density lipoprotein receptor activity(GO:0005041) |
| 0.0 | 0.5 | GO:0016888 | endodeoxyribonuclease activity, producing 5'-phosphomonoesters(GO:0016888) |
| 0.0 | 0.3 | GO:0019784 | NEDD8-specific protease activity(GO:0019784) |
| 0.0 | 0.5 | GO:0019531 | bicarbonate transmembrane transporter activity(GO:0015106) oxalate transmembrane transporter activity(GO:0019531) |
| 0.0 | 1.6 | GO:0005158 | insulin receptor binding(GO:0005158) |
| 0.0 | 0.2 | GO:0009378 | four-way junction helicase activity(GO:0009378) |
| 0.0 | 2.1 | GO:0044824 | integrase activity(GO:0008907) T/G mismatch-specific endonuclease activity(GO:0043765) retroviral integrase activity(GO:0044823) retroviral 3' processing activity(GO:0044824) |
| 0.0 | 0.3 | GO:0004767 | sphingomyelin phosphodiesterase activity(GO:0004767) |
| 0.0 | 0.6 | GO:0004890 | GABA-A receptor activity(GO:0004890) |
| 0.0 | 1.1 | GO:0030215 | semaphorin receptor binding(GO:0030215) |
| 0.0 | 0.3 | GO:0016004 | phospholipase activator activity(GO:0016004) lipase activator activity(GO:0060229) |
| 0.0 | 0.2 | GO:0008603 | cAMP-dependent protein kinase regulator activity(GO:0008603) |
| 0.0 | 6.8 | GO:0003714 | transcription corepressor activity(GO:0003714) |
| 0.0 | 0.4 | GO:0010521 | telomerase inhibitor activity(GO:0010521) |
| 0.0 | 0.4 | GO:0034450 | ubiquitin-ubiquitin ligase activity(GO:0034450) |
| 0.0 | 0.1 | GO:0008488 | gamma-glutamyl carboxylase activity(GO:0008488) |
| 0.0 | 0.7 | GO:0015035 | protein disulfide oxidoreductase activity(GO:0015035) |
| 0.0 | 0.4 | GO:0045236 | CXCR chemokine receptor binding(GO:0045236) |
| 0.0 | 1.1 | GO:0030507 | spectrin binding(GO:0030507) |
| 0.0 | 2.9 | GO:0005496 | steroid binding(GO:0005496) |
| 0.0 | 3.0 | GO:0030674 | protein binding, bridging(GO:0030674) |
| 0.0 | 0.3 | GO:0008526 | phosphatidylinositol transporter activity(GO:0008526) |
| 0.0 | 0.6 | GO:0042975 | peroxisome proliferator activated receptor binding(GO:0042975) |
| 0.0 | 1.1 | GO:0001540 | beta-amyloid binding(GO:0001540) |
| 0.0 | 0.6 | GO:0017075 | syntaxin-1 binding(GO:0017075) |
| 0.0 | 1.3 | GO:0030552 | cAMP binding(GO:0030552) |
| 0.0 | 0.2 | GO:0004582 | dolichyl-phosphate beta-D-mannosyltransferase activity(GO:0004582) |
| 0.0 | 1.7 | GO:0048306 | calcium-dependent protein binding(GO:0048306) |
| 0.0 | 3.6 | GO:0005089 | Rho guanyl-nucleotide exchange factor activity(GO:0005089) |
| 0.0 | 0.1 | GO:0036361 | racemase and epimerase activity, acting on amino acids and derivatives(GO:0016855) racemase activity, acting on amino acids and derivatives(GO:0036361) amino-acid racemase activity(GO:0047661) |
| 0.0 | 0.3 | GO:0008474 | palmitoyl-(protein) hydrolase activity(GO:0008474) palmitoyl hydrolase activity(GO:0098599) |
| 0.0 | 2.6 | GO:0005125 | cytokine activity(GO:0005125) |
| 0.0 | 0.2 | GO:0031802 | type 5 metabotropic glutamate receptor binding(GO:0031802) |
| 0.0 | 0.2 | GO:0004984 | olfactory receptor activity(GO:0004984) |
| 0.0 | 3.2 | GO:0003774 | motor activity(GO:0003774) |
| 0.0 | 0.4 | GO:0016290 | palmitoyl-CoA hydrolase activity(GO:0016290) |
| 0.0 | 0.2 | GO:0043262 | adenosine-diphosphatase activity(GO:0043262) |
| 0.0 | 0.6 | GO:0005154 | epidermal growth factor receptor binding(GO:0005154) |
| 0.0 | 0.5 | GO:0042165 | neurotransmitter binding(GO:0042165) |
| 0.0 | 0.2 | GO:0019869 | chloride channel inhibitor activity(GO:0019869) |
| 0.0 | 1.3 | GO:0030295 | protein kinase activator activity(GO:0030295) |
| 0.0 | 0.3 | GO:0035198 | miRNA binding(GO:0035198) |
| 0.0 | 0.9 | GO:0051019 | mitogen-activated protein kinase binding(GO:0051019) |
| 0.0 | 0.8 | GO:0001205 | transcriptional activator activity, RNA polymerase II distal enhancer sequence-specific binding(GO:0001205) |
| 0.0 | 0.2 | GO:0017176 | phosphatidylinositol N-acetylglucosaminyltransferase activity(GO:0017176) |
| 0.0 | 1.6 | GO:0001158 | enhancer sequence-specific DNA binding(GO:0001158) |
| 0.0 | 2.8 | GO:0017137 | Rab GTPase binding(GO:0017137) |
| 0.0 | 0.3 | GO:0008157 | protein phosphatase 1 binding(GO:0008157) |
| 0.0 | 0.5 | GO:0004115 | 3',5'-cyclic-AMP phosphodiesterase activity(GO:0004115) |
| 0.0 | 0.1 | GO:0004711 | ribosomal protein S6 kinase activity(GO:0004711) |
| 0.0 | 1.3 | GO:0043851 | rRNA (adenine-N6,N6-)-dimethyltransferase activity(GO:0000179) rRNA (uridine-2'-O-)-methyltransferase activity(GO:0008650) rRNA (adenine-N6-)-methyltransferase activity(GO:0008988) rRNA (cytosine-C5-)-methyltransferase activity(GO:0009383) selenocysteine methyltransferase activity(GO:0016205) rRNA (adenine) methyltransferase activity(GO:0016433) rRNA (cytosine) methyltransferase activity(GO:0016434) rRNA (guanine) methyltransferase activity(GO:0016435) 1-phenanthrol methyltransferase activity(GO:0018707) protein-arginine N5-methyltransferase activity(GO:0019702) dimethylarsinite methyltransferase activity(GO:0034541) 4,5-dihydroxybenzo(a)pyrene methyltransferase activity(GO:0034807) 1-hydroxypyrene methyltransferase activity(GO:0034931) 1-hydroxy-6-methoxypyrene methyltransferase activity(GO:0034933) demethylmenaquinone methyltransferase activity(GO:0043770) cobalt-precorrin-6B C5-methyltransferase activity(GO:0043776) cobalt-precorrin-7 C15-methyltransferase activity(GO:0043777) cobalt-precorrin-5B C1-methyltransferase activity(GO:0043780) cobalt-precorrin-3 C17-methyltransferase activity(GO:0043782) dimethylamine methyltransferase activity(GO:0043791) hydroxyneurosporene-O-methyltransferase activity(GO:0043803) tRNA (adenine-57, 58-N(1)-) methyltransferase activity(GO:0043827) methylamine-specific methylcobalamin:coenzyme M methyltransferase activity(GO:0043833) trimethylamine methyltransferase activity(GO:0043834) methanol-specific methylcobalamin:coenzyme M methyltransferase activity(GO:0043851) monomethylamine methyltransferase activity(GO:0043852) P-methyltransferase activity(GO:0051994) Se-methyltransferase activity(GO:0051995) 2-phytyl-1,4-naphthoquinone methyltransferase activity(GO:0052624) tRNA (uracil-2'-O-)-methyltransferase activity(GO:0052665) tRNA (cytosine-2'-O-)-methyltransferase activity(GO:0052666) phosphomethylethanolamine N-methyltransferase activity(GO:0052667) tRNA (cytosine-3-)-methyltransferase activity(GO:0052735) rRNA (cytosine-2'-O-)-methyltransferase activity(GO:0070677) rRNA (cytosine-N4-)-methyltransferase activity(GO:0071424) trihydroxyferuloyl spermidine O-methyltransferase activity(GO:0080012) |
| 0.0 | 0.5 | GO:0001102 | RNA polymerase II activating transcription factor binding(GO:0001102) |
| 0.0 | 1.7 | GO:0035091 | phosphatidylinositol binding(GO:0035091) |
| 0.0 | 0.5 | GO:0046875 | ephrin receptor binding(GO:0046875) |
| 0.0 | 0.3 | GO:0008242 | omega peptidase activity(GO:0008242) |
| 0.0 | 0.2 | GO:0030546 | receptor activator activity(GO:0030546) |
| 0.0 | 0.2 | GO:0070530 | K63-linked polyubiquitin binding(GO:0070530) |
| 0.0 | 0.2 | GO:0008187 | poly-pyrimidine tract binding(GO:0008187) poly(U) RNA binding(GO:0008266) |
| 0.0 | 0.1 | GO:0008545 | JUN kinase kinase activity(GO:0008545) |
| 0.0 | 0.2 | GO:0044323 | retinoic acid-responsive element binding(GO:0044323) |
| 0.0 | 0.1 | GO:0045322 | unmethylated CpG binding(GO:0045322) |
| 0.0 | 0.1 | GO:0017134 | fibroblast growth factor binding(GO:0017134) |
| 0.0 | 0.3 | GO:0043548 | phosphatidylinositol 3-kinase binding(GO:0043548) |
| 0.0 | 0.3 | GO:0043015 | gamma-tubulin binding(GO:0043015) |
| 0.0 | 0.4 | GO:0061631 | ubiquitin conjugating enzyme activity(GO:0061631) |