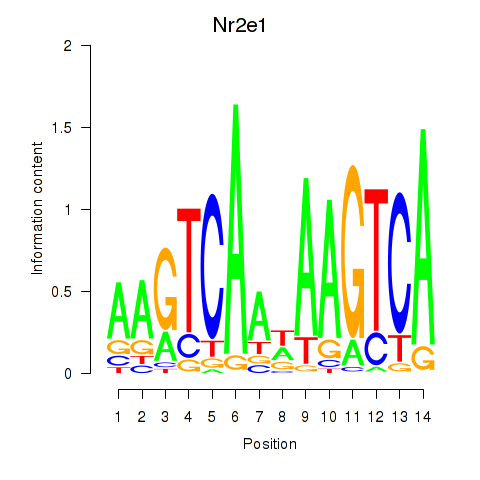
Motif ID: Nr2e1
Z-value: 0.347

Transcription factors associated with Nr2e1:
| Gene Symbol | Entrez ID | Gene Name |
|---|---|---|
| Nr2e1 | ENSMUSG00000019803.5 | Nr2e1 |
Activity-expression correlation:
| Gene Symbol | Promoter | Pearson corr. coef. | P-value | Plot |
|---|---|---|---|---|
| Nr2e1 | mm10_v2_chr10_-_42583628_42583639 | 0.11 | 5.6e-01 | Click! |
Top targets:
Gene overrepresentation in biological_process category:
| Log-likelihood per target | Total log-likelihood | Term | Description |
|---|---|---|---|
| 0.3 | 1.2 | GO:0031622 | positive regulation of fever generation(GO:0031622) |
| 0.1 | 0.5 | GO:0032911 | nerve growth factor production(GO:0032902) negative regulation of transforming growth factor beta1 production(GO:0032911) |
| 0.1 | 0.3 | GO:2000271 | positive regulation of fibroblast apoptotic process(GO:2000271) |
| 0.1 | 0.3 | GO:0050913 | sensory perception of bitter taste(GO:0050913) |
| 0.0 | 0.3 | GO:0032782 | urea transport(GO:0015840) bile acid secretion(GO:0032782) urea transmembrane transport(GO:0071918) |
| 0.0 | 0.1 | GO:0070589 | cell wall mannoprotein biosynthetic process(GO:0000032) mannoprotein metabolic process(GO:0006056) mannoprotein biosynthetic process(GO:0006057) cell wall glycoprotein biosynthetic process(GO:0031506) cell wall biogenesis(GO:0042546) cell wall macromolecule metabolic process(GO:0044036) cell wall macromolecule biosynthetic process(GO:0044038) chain elongation of O-linked mannose residue(GO:0044845) cellular component macromolecule biosynthetic process(GO:0070589) cell wall organization or biogenesis(GO:0071554) |
| 0.0 | 0.2 | GO:0042590 | antigen processing and presentation of exogenous peptide antigen via MHC class I(GO:0042590) |
| 0.0 | 0.3 | GO:1901621 | negative regulation of smoothened signaling pathway involved in dorsal/ventral neural tube patterning(GO:1901621) |
| 0.0 | 0.6 | GO:0035855 | megakaryocyte development(GO:0035855) |
| 0.0 | 0.3 | GO:0071447 | cellular response to hydroperoxide(GO:0071447) |
| 0.0 | 0.3 | GO:0046325 | negative regulation of glucose import(GO:0046325) |
Gene overrepresentation in cellular_component category:
| Log-likelihood per target | Total log-likelihood | Term | Description |
|---|---|---|---|
| 0.0 | 0.6 | GO:0031209 | SCAR complex(GO:0031209) |
| 0.0 | 0.1 | GO:0031502 | dolichyl-phosphate-mannose-protein mannosyltransferase complex(GO:0031502) |
| 0.0 | 0.2 | GO:0042825 | TAP complex(GO:0042825) |
| 0.0 | 0.5 | GO:0012510 | trans-Golgi network transport vesicle membrane(GO:0012510) |
| 0.0 | 0.3 | GO:0005952 | cAMP-dependent protein kinase complex(GO:0005952) |
| 0.0 | 0.3 | GO:0045334 | clathrin-coated endocytic vesicle(GO:0045334) |
Gene overrepresentation in molecular_function category:
| Log-likelihood per target | Total log-likelihood | Term | Description |
|---|---|---|---|
| 0.1 | 1.4 | GO:0004653 | polypeptide N-acetylgalactosaminyltransferase activity(GO:0004653) |
| 0.1 | 0.5 | GO:0048406 | nerve growth factor binding(GO:0048406) |
| 0.1 | 0.6 | GO:0030296 | protein tyrosine kinase activator activity(GO:0030296) |
| 0.1 | 0.3 | GO:0004691 | cAMP-dependent protein kinase activity(GO:0004691) |
| 0.0 | 0.3 | GO:0015265 | urea channel activity(GO:0015265) |
| 0.0 | 0.3 | GO:0031419 | cobalamin binding(GO:0031419) |
| 0.0 | 0.2 | GO:0046978 | TAP1 binding(GO:0046978) TAP2 binding(GO:0046979) |
| 0.0 | 0.3 | GO:0001206 | transcriptional repressor activity, RNA polymerase II distal enhancer sequence-specific binding(GO:0001206) |
| 0.0 | 0.1 | GO:0004169 | dolichyl-phosphate-mannose-protein mannosyltransferase activity(GO:0004169) |


