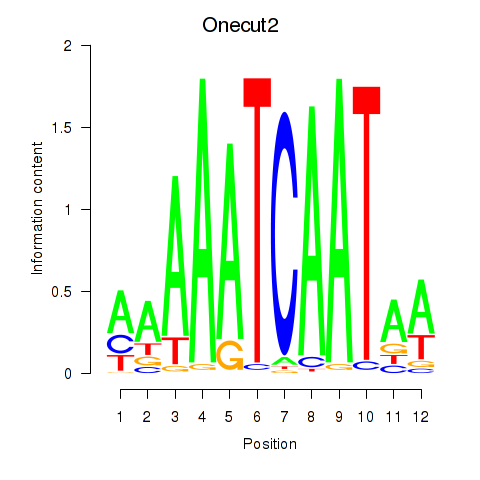
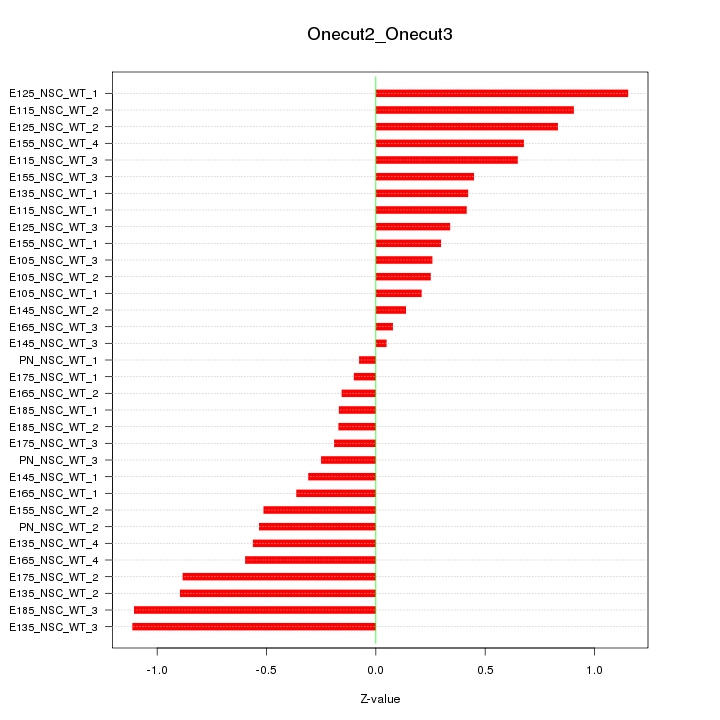
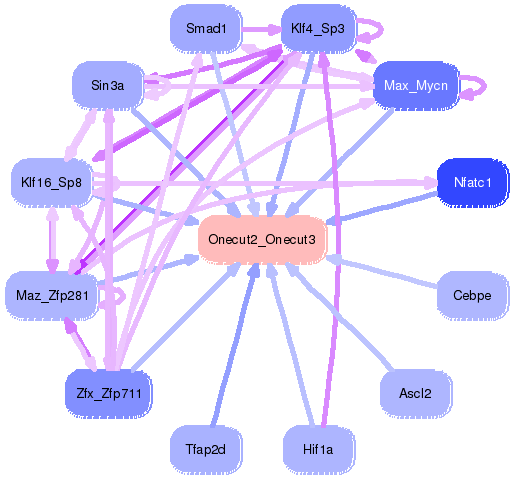
Motif ID: Onecut2_Onecut3
Z-value: 0.561

Transcription factors associated with Onecut2_Onecut3:
| Gene Symbol | Entrez ID | Gene Name |
|---|---|---|
| Onecut2 | ENSMUSG00000045991.12 | Onecut2 |
| Onecut3 | ENSMUSG00000045518.8 | Onecut3 |
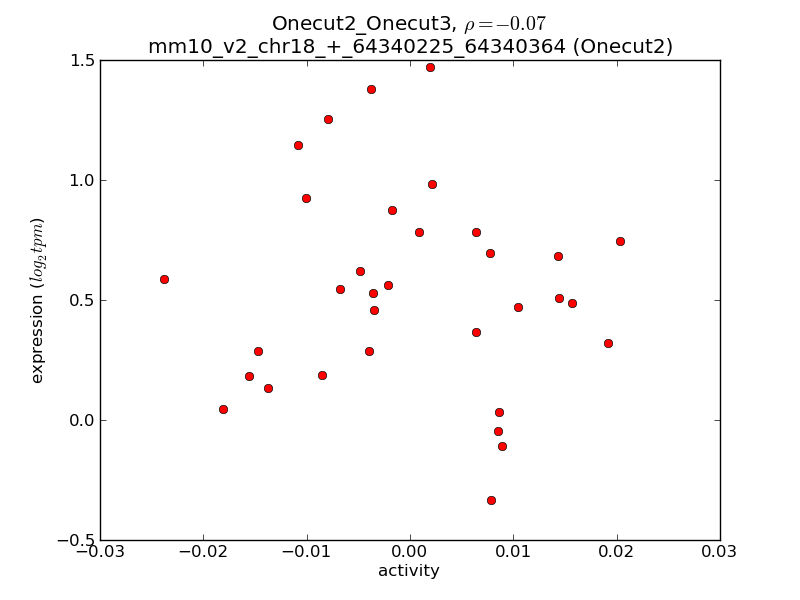
Activity-expression correlation:
| Gene Symbol | Promoter | Pearson corr. coef. | P-value | Plot |
|---|---|---|---|---|
| Onecut3 | mm10_v2_chr10_+_80494835_80494873 | -0.12 | 5.2e-01 | Click! |
| Onecut2 | mm10_v2_chr18_+_64340225_64340364 | -0.07 | 7.0e-01 | Click! |

Top targets:
Gene overrepresentation in biological_process category:
| Log-likelihood per target | Total log-likelihood | Term | Description |
|---|---|---|---|
| 0.8 | 4.8 | GO:0021797 | forebrain anterior/posterior pattern specification(GO:0021797) |
| 0.3 | 1.7 | GO:0002457 | T cell antigen processing and presentation(GO:0002457) |
| 0.3 | 1.1 | GO:0019919 | peptidyl-arginine methylation, to asymmetrical-dimethyl arginine(GO:0019919) |
| 0.2 | 0.7 | GO:0090238 | positive regulation of arachidonic acid secretion(GO:0090238) |
| 0.2 | 2.0 | GO:0010650 | positive regulation of cell communication by electrical coupling(GO:0010650) positive regulation of membrane depolarization during cardiac muscle cell action potential(GO:1900827) |
| 0.2 | 0.5 | GO:0072356 | chromosome passenger complex localization to kinetochore(GO:0072356) |
| 0.2 | 0.5 | GO:0045014 | detection of carbohydrate stimulus(GO:0009730) detection of hexose stimulus(GO:0009732) detection of monosaccharide stimulus(GO:0034287) carbon catabolite repression of transcription(GO:0045013) negative regulation of transcription by glucose(GO:0045014) detection of glucose(GO:0051594) |
| 0.2 | 3.6 | GO:0008340 | determination of adult lifespan(GO:0008340) |
| 0.1 | 1.3 | GO:0010587 | miRNA catabolic process(GO:0010587) |
| 0.1 | 2.6 | GO:0021521 | ventral spinal cord interneuron specification(GO:0021521) cell fate specification involved in pattern specification(GO:0060573) |
| 0.1 | 1.4 | GO:2001214 | positive regulation of vasculogenesis(GO:2001214) |
| 0.1 | 0.4 | GO:1902071 | regulation of hypoxia-inducible factor-1alpha signaling pathway(GO:1902071) |
| 0.1 | 0.4 | GO:1903244 | positive regulation of cardiac muscle adaptation(GO:0010615) positive regulation of cardiac muscle hypertrophy in response to stress(GO:1903244) |
| 0.1 | 0.9 | GO:0038028 | insulin receptor signaling pathway via phosphatidylinositol 3-kinase(GO:0038028) |
| 0.1 | 0.5 | GO:0045918 | negative regulation of cytolysis(GO:0045918) |
| 0.1 | 0.3 | GO:0006269 | DNA replication, synthesis of RNA primer(GO:0006269) |
| 0.1 | 1.1 | GO:0001731 | formation of translation preinitiation complex(GO:0001731) |
| 0.1 | 0.7 | GO:0048625 | myoblast fate commitment(GO:0048625) |
| 0.1 | 0.2 | GO:0030210 | heparin biosynthetic process(GO:0030210) Tie signaling pathway(GO:0048014) |
| 0.1 | 0.3 | GO:0018343 | protein farnesylation(GO:0018343) |
| 0.1 | 0.2 | GO:0070543 | response to linoleic acid(GO:0070543) |
| 0.1 | 0.3 | GO:0021993 | initiation of neural tube closure(GO:0021993) |
| 0.1 | 0.6 | GO:0097421 | liver regeneration(GO:0097421) |
| 0.1 | 1.7 | GO:0007617 | mating behavior(GO:0007617) multi-organism reproductive behavior(GO:0044705) |
| 0.1 | 0.2 | GO:1903898 | positive regulation of translation in response to endoplasmic reticulum stress(GO:0036493) negative regulation of PERK-mediated unfolded protein response(GO:1903898) |
| 0.1 | 0.2 | GO:0006788 | heme oxidation(GO:0006788) |
| 0.1 | 0.4 | GO:0045199 | maintenance of epithelial cell apical/basal polarity(GO:0045199) |
| 0.1 | 0.5 | GO:0051574 | positive regulation of histone H3-K9 methylation(GO:0051574) |
| 0.0 | 0.5 | GO:0030322 | stabilization of membrane potential(GO:0030322) |
| 0.0 | 0.3 | GO:0032929 | negative regulation of macrophage derived foam cell differentiation(GO:0010745) negative regulation of superoxide anion generation(GO:0032929) |
| 0.0 | 0.1 | GO:0019478 | D-amino acid catabolic process(GO:0019478) |
| 0.0 | 0.3 | GO:1900028 | negative regulation of ruffle assembly(GO:1900028) |
| 0.0 | 0.2 | GO:0060715 | syncytiotrophoblast cell differentiation involved in labyrinthine layer development(GO:0060715) |
| 0.0 | 0.2 | GO:0070171 | negative regulation of tooth mineralization(GO:0070171) |
| 0.0 | 0.1 | GO:0042264 | peptidyl-aspartic acid hydroxylation(GO:0042264) negative regulation of transcription from RNA polymerase II promoter in response to hypoxia(GO:0061428) |
| 0.0 | 0.3 | GO:0033353 | S-adenosylmethionine cycle(GO:0033353) |
| 0.0 | 0.1 | GO:0006419 | alanyl-tRNA aminoacylation(GO:0006419) |
| 0.0 | 0.2 | GO:0010825 | positive regulation of centrosome duplication(GO:0010825) |
| 0.0 | 0.1 | GO:0006285 | base-excision repair, AP site formation(GO:0006285) |
| 0.0 | 0.3 | GO:0051014 | actin filament severing(GO:0051014) |
| 0.0 | 0.4 | GO:0015937 | coenzyme A biosynthetic process(GO:0015937) |
| 0.0 | 0.2 | GO:1903847 | negative regulation of endothelial cell differentiation(GO:0045602) regulation of aorta morphogenesis(GO:1903847) positive regulation of aorta morphogenesis(GO:1903849) |
| 0.0 | 0.1 | GO:0002430 | complement receptor mediated signaling pathway(GO:0002430) |
| 0.0 | 0.1 | GO:0042796 | snRNA transcription from RNA polymerase III promoter(GO:0042796) positive regulation of thymocyte apoptotic process(GO:0070245) |
| 0.0 | 0.3 | GO:0045653 | negative regulation of megakaryocyte differentiation(GO:0045653) |
| 0.0 | 0.1 | GO:0051987 | positive regulation of attachment of spindle microtubules to kinetochore(GO:0051987) |
| 0.0 | 0.1 | GO:1904008 | cellular response to salt(GO:1902075) response to monosodium glutamate(GO:1904008) cellular response to monosodium glutamate(GO:1904009) |
| 0.0 | 0.1 | GO:0050957 | equilibrioception(GO:0050957) |
| 0.0 | 0.2 | GO:0034498 | early endosome to Golgi transport(GO:0034498) |
| 0.0 | 0.3 | GO:0006828 | manganese ion transport(GO:0006828) |
| 0.0 | 0.1 | GO:0046684 | response to pyrethroid(GO:0046684) |
| 0.0 | 0.2 | GO:0045722 | positive regulation of gluconeogenesis(GO:0045722) |
| 0.0 | 0.4 | GO:1903146 | regulation of mitophagy(GO:1903146) |
| 0.0 | 0.1 | GO:0006685 | sphingomyelin catabolic process(GO:0006685) |
| 0.0 | 0.2 | GO:0030574 | collagen catabolic process(GO:0030574) |
| 0.0 | 0.1 | GO:1903069 | regulation of ER-associated ubiquitin-dependent protein catabolic process(GO:1903069) |
| 0.0 | 0.1 | GO:0043488 | regulation of mRNA stability(GO:0043488) |
Gene overrepresentation in cellular_component category:
| Log-likelihood per target | Total log-likelihood | Term | Description |
|---|---|---|---|
| 0.3 | 1.4 | GO:0031466 | Cul5-RING ubiquitin ligase complex(GO:0031466) |
| 0.1 | 0.6 | GO:0048237 | rough endoplasmic reticulum lumen(GO:0048237) |
| 0.1 | 2.0 | GO:0014731 | spectrin-associated cytoskeleton(GO:0014731) |
| 0.1 | 0.3 | GO:0005965 | protein farnesyltransferase complex(GO:0005965) |
| 0.1 | 0.7 | GO:0070369 | beta-catenin-TCF7L2 complex(GO:0070369) |
| 0.1 | 0.4 | GO:0005955 | calcineurin complex(GO:0005955) |
| 0.1 | 0.2 | GO:0014802 | terminal cisterna(GO:0014802) |
| 0.1 | 0.6 | GO:1990023 | mitotic spindle midzone(GO:1990023) |
| 0.1 | 0.2 | GO:0030905 | retromer, tubulation complex(GO:0030905) |
| 0.0 | 0.5 | GO:0031362 | anchored component of external side of plasma membrane(GO:0031362) |
| 0.0 | 0.3 | GO:0097197 | tetraspanin-enriched microdomain(GO:0097197) |
| 0.0 | 0.4 | GO:0045277 | respiratory chain complex IV(GO:0045277) |
| 0.0 | 0.4 | GO:0031462 | Cul2-RING ubiquitin ligase complex(GO:0031462) |
| 0.0 | 1.5 | GO:0022627 | cytosolic small ribosomal subunit(GO:0022627) |
| 0.0 | 0.2 | GO:0005853 | eukaryotic translation elongation factor 1 complex(GO:0005853) |
| 0.0 | 0.3 | GO:0019773 | proteasome core complex, alpha-subunit complex(GO:0019773) |
| 0.0 | 0.5 | GO:0035098 | ESC/E(Z) complex(GO:0035098) |
| 0.0 | 0.2 | GO:0045298 | tubulin complex(GO:0045298) |
| 0.0 | 0.1 | GO:0060293 | P granule(GO:0043186) pole plasm(GO:0045495) germ plasm(GO:0060293) |
| 0.0 | 0.1 | GO:0005947 | mitochondrial alpha-ketoglutarate dehydrogenase complex(GO:0005947) |
| 0.0 | 0.1 | GO:0005663 | DNA replication factor C complex(GO:0005663) |
Gene overrepresentation in molecular_function category:
| Log-likelihood per target | Total log-likelihood | Term | Description |
|---|---|---|---|
| 0.2 | 1.7 | GO:0032453 | histone demethylase activity (H3-K4 specific)(GO:0032453) |
| 0.2 | 1.1 | GO:0035241 | protein-arginine omega-N monomethyltransferase activity(GO:0035241) |
| 0.2 | 0.6 | GO:0004605 | phosphatidate cytidylyltransferase activity(GO:0004605) |
| 0.1 | 0.4 | GO:0004140 | dephospho-CoA kinase activity(GO:0004140) |
| 0.1 | 0.3 | GO:0004660 | protein farnesyltransferase activity(GO:0004660) |
| 0.1 | 0.7 | GO:0047499 | calcium-independent phospholipase A2 activity(GO:0047499) |
| 0.1 | 2.0 | GO:0008093 | cytoskeletal adaptor activity(GO:0008093) |
| 0.1 | 0.2 | GO:0070892 | lipoteichoic acid receptor activity(GO:0070892) |
| 0.1 | 0.4 | GO:0033192 | calcium-dependent protein serine/threonine phosphatase activity(GO:0004723) calmodulin-dependent protein phosphatase activity(GO:0033192) |
| 0.1 | 0.3 | GO:0001849 | complement component C1q binding(GO:0001849) |
| 0.0 | 0.5 | GO:0022841 | potassium ion leak channel activity(GO:0022841) |
| 0.0 | 0.5 | GO:0001848 | complement binding(GO:0001848) |
| 0.0 | 0.3 | GO:0052630 | CTP:2,3-di-O-geranylgeranyl-sn-glycero-1-phosphate cytidyltransferase activity(GO:0043338) phospholactate guanylyltransferase activity(GO:0043814) ATP:coenzyme F420 adenylyltransferase activity(GO:0043910) UDP-N-acetylgalactosamine diphosphorylase activity(GO:0052630) |
| 0.0 | 1.0 | GO:0043539 | protein serine/threonine kinase activator activity(GO:0043539) |
| 0.0 | 0.2 | GO:0004392 | heme oxygenase (decyclizing) activity(GO:0004392) |
| 0.0 | 0.3 | GO:0004013 | adenosylhomocysteinase activity(GO:0004013) trialkylsulfonium hydrolase activity(GO:0016802) |
| 0.0 | 0.2 | GO:1990460 | leptin receptor binding(GO:1990460) |
| 0.0 | 0.4 | GO:0019871 | sodium channel inhibitor activity(GO:0019871) |
| 0.0 | 1.1 | GO:0017134 | fibroblast growth factor binding(GO:0017134) |
| 0.0 | 0.6 | GO:0001871 | pattern binding(GO:0001871) polysaccharide binding(GO:0030247) |
| 0.0 | 0.1 | GO:0004813 | alanine-tRNA ligase activity(GO:0004813) |
| 0.0 | 0.2 | GO:0004887 | thyroid hormone receptor activity(GO:0004887) |
| 0.0 | 0.1 | GO:0071532 | ankyrin repeat binding(GO:0071532) |
| 0.0 | 0.8 | GO:0032452 | histone demethylase activity(GO:0032452) |
| 0.0 | 1.7 | GO:0001102 | RNA polymerase II activating transcription factor binding(GO:0001102) |
| 0.0 | 0.3 | GO:0004143 | diacylglycerol kinase activity(GO:0004143) |
| 0.0 | 0.6 | GO:0045295 | gamma-catenin binding(GO:0045295) |
| 0.0 | 0.2 | GO:0004886 | 9-cis retinoic acid receptor activity(GO:0004886) |
| 0.0 | 4.5 | GO:0001227 | transcriptional repressor activity, RNA polymerase II transcription regulatory region sequence-specific binding(GO:0001227) |
| 0.0 | 0.3 | GO:0005522 | profilin binding(GO:0005522) |
| 0.0 | 0.3 | GO:0015279 | store-operated calcium channel activity(GO:0015279) |
| 0.0 | 0.4 | GO:0003841 | 1-acylglycerol-3-phosphate O-acyltransferase activity(GO:0003841) |
| 0.0 | 0.2 | GO:0005172 | vascular endothelial growth factor receptor binding(GO:0005172) |
| 0.0 | 0.9 | GO:0005179 | hormone activity(GO:0005179) |
| 0.0 | 0.4 | GO:0016676 | cytochrome-c oxidase activity(GO:0004129) heme-copper terminal oxidase activity(GO:0015002) oxidoreductase activity, acting on a heme group of donors, oxygen as acceptor(GO:0016676) |
| 0.0 | 0.5 | GO:0001205 | transcriptional activator activity, RNA polymerase II distal enhancer sequence-specific binding(GO:0001205) |
| 0.0 | 0.1 | GO:0043515 | kinetochore binding(GO:0043515) |
| 0.0 | 0.2 | GO:0070180 | large ribosomal subunit rRNA binding(GO:0070180) |
| 0.0 | 0.0 | GO:0004348 | glucosylceramidase activity(GO:0004348) |
| 0.0 | 0.3 | GO:0004298 | threonine-type endopeptidase activity(GO:0004298) threonine-type peptidase activity(GO:0070003) |
| 0.0 | 0.2 | GO:0044183 | protein binding involved in protein folding(GO:0044183) |
| 0.0 | 0.2 | GO:0004435 | phosphatidylinositol phospholipase C activity(GO:0004435) |
| 0.0 | 0.2 | GO:0030676 | Rac guanyl-nucleotide exchange factor activity(GO:0030676) |
| 0.0 | 0.5 | GO:0048365 | Rac GTPase binding(GO:0048365) |
|
|
|
|