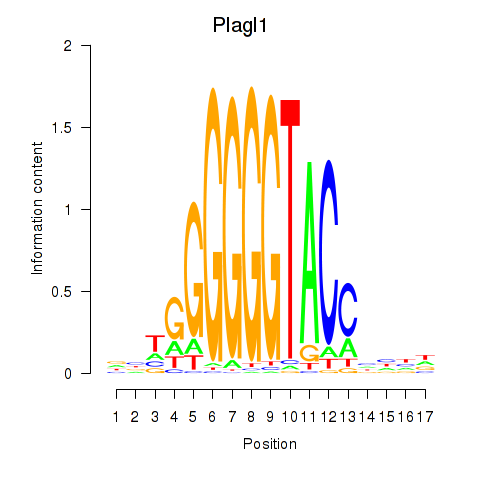
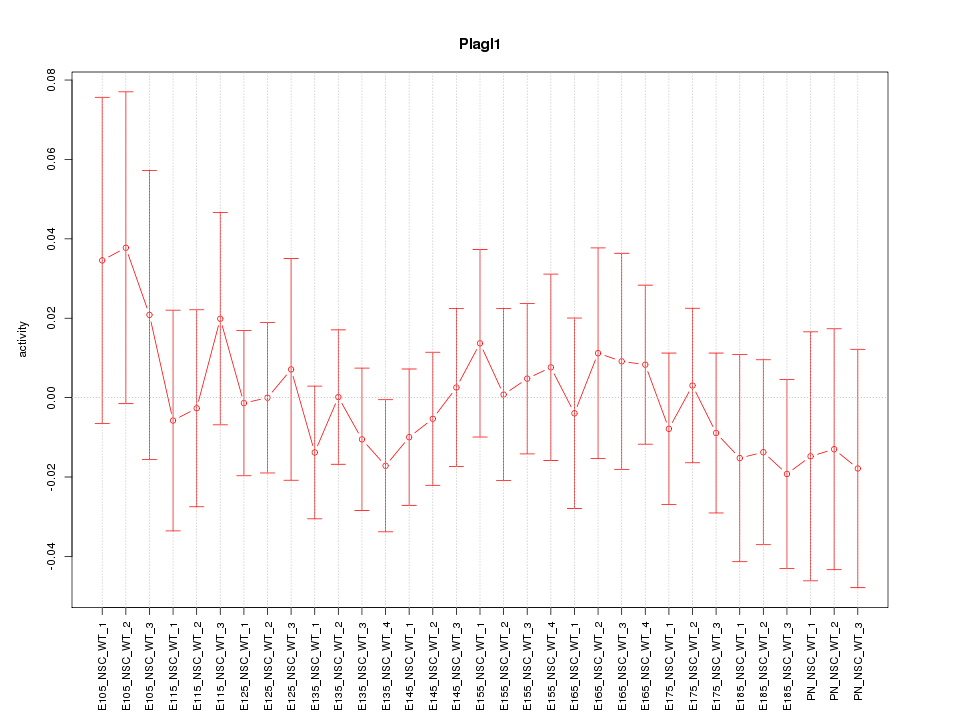
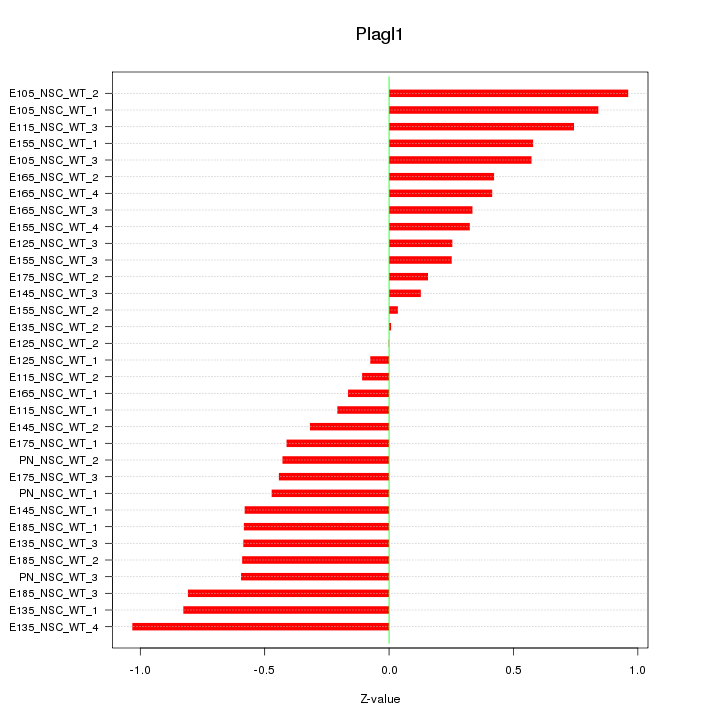
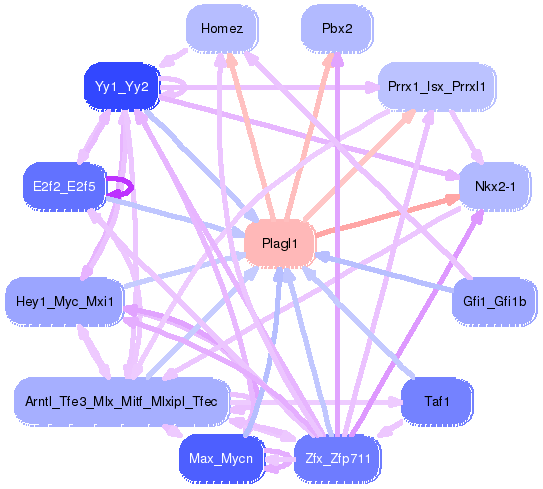
Motif ID: Plagl1
Z-value: 0.513
Transcription factors associated with Plagl1:
| Gene Symbol | Entrez ID | Gene Name |
|---|---|---|
| Plagl1 | ENSMUSG00000019817.12 | Plagl1 |
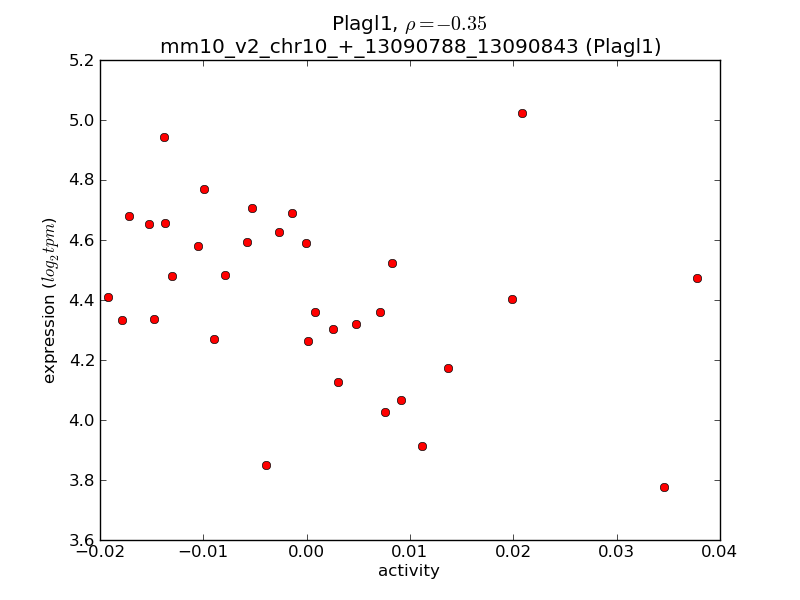
Activity-expression correlation:
| Gene Symbol | Promoter | Pearson corr. coef. | P-value | Plot |
|---|---|---|---|---|
| Plagl1 | mm10_v2_chr10_+_13090788_13090843 | -0.35 | 4.7e-02 | Click! |

Top targets:
Gene overrepresentation in biological_process category:
| Log-likelihood per target | Total log-likelihood | Term | Description |
|---|---|---|---|
| 1.1 | 3.3 | GO:0021759 | globus pallidus development(GO:0021759) |
| 0.5 | 1.6 | GO:0030300 | regulation of intestinal cholesterol absorption(GO:0030300) |
| 0.2 | 1.3 | GO:0033564 | anterior/posterior axon guidance(GO:0033564) |
| 0.2 | 2.0 | GO:0043589 | skin morphogenesis(GO:0043589) |
| 0.1 | 0.7 | GO:0051045 | negative regulation of membrane protein ectodomain proteolysis(GO:0051045) negative regulation of trophoblast cell migration(GO:1901164) |
| 0.1 | 0.5 | GO:0046898 | response to cycloheximide(GO:0046898) |
| 0.1 | 0.4 | GO:0036292 | DNA rewinding(GO:0036292) |
| 0.1 | 0.6 | GO:0030091 | protein repair(GO:0030091) |
| 0.1 | 1.3 | GO:0014883 | transition between fast and slow fiber(GO:0014883) |
| 0.1 | 1.1 | GO:0014824 | artery smooth muscle contraction(GO:0014824) |
| 0.1 | 0.3 | GO:0048208 | vesicle targeting, rough ER to cis-Golgi(GO:0048207) COPII vesicle coating(GO:0048208) |
| 0.1 | 0.5 | GO:0014886 | transition between slow and fast fiber(GO:0014886) |
| 0.1 | 1.6 | GO:0046855 | phosphorylated carbohydrate dephosphorylation(GO:0046838) inositol phosphate dephosphorylation(GO:0046855) |
| 0.1 | 0.8 | GO:0034551 | respiratory chain complex III assembly(GO:0017062) mitochondrial respiratory chain complex III assembly(GO:0034551) mitochondrial respiratory chain complex III biogenesis(GO:0097033) |
| 0.1 | 1.7 | GO:0014067 | negative regulation of phosphatidylinositol 3-kinase signaling(GO:0014067) |
| 0.1 | 0.8 | GO:0048711 | positive regulation of astrocyte differentiation(GO:0048711) |
| 0.1 | 0.2 | GO:0097309 | cap1 mRNA methylation(GO:0097309) |
| 0.1 | 0.2 | GO:0001830 | trophectodermal cell fate commitment(GO:0001830) |
| 0.1 | 0.9 | GO:0043518 | negative regulation of DNA damage response, signal transduction by p53 class mediator(GO:0043518) |
| 0.1 | 0.3 | GO:0060744 | negative regulation of mammary gland epithelial cell proliferation(GO:0033600) thelarche(GO:0042695) mammary gland branching involved in thelarche(GO:0060744) |
| 0.0 | 1.0 | GO:0031115 | negative regulation of microtubule polymerization(GO:0031115) |
| 0.0 | 0.5 | GO:0000012 | single strand break repair(GO:0000012) |
| 0.0 | 0.5 | GO:0021559 | trigeminal nerve development(GO:0021559) |
| 0.0 | 0.4 | GO:0019227 | neuronal action potential propagation(GO:0019227) action potential propagation(GO:0098870) |
| 0.0 | 0.3 | GO:0044027 | hypermethylation of CpG island(GO:0044027) |
| 0.0 | 0.2 | GO:1903755 | regulation of SUMO transferase activity(GO:1903182) positive regulation of SUMO transferase activity(GO:1903755) |
| 0.0 | 0.3 | GO:0097039 | protein linear polyubiquitination(GO:0097039) |
| 0.0 | 0.2 | GO:0051890 | regulation of cardioblast differentiation(GO:0051890) |
| 0.0 | 0.2 | GO:0021993 | initiation of neural tube closure(GO:0021993) |
| 0.0 | 1.2 | GO:0009954 | proximal/distal pattern formation(GO:0009954) |
| 0.0 | 0.4 | GO:0002227 | innate immune response in mucosa(GO:0002227) |
| 0.0 | 0.3 | GO:0031639 | plasminogen activation(GO:0031639) |
| 0.0 | 0.2 | GO:0072318 | clathrin coat disassembly(GO:0072318) |
| 0.0 | 0.3 | GO:0006105 | succinate metabolic process(GO:0006105) |
| 0.0 | 0.6 | GO:0007274 | neuromuscular synaptic transmission(GO:0007274) |
| 0.0 | 0.1 | GO:0001661 | conditioned taste aversion(GO:0001661) |
| 0.0 | 0.3 | GO:0043011 | myeloid dendritic cell differentiation(GO:0043011) |
| 0.0 | 0.2 | GO:1900194 | negative regulation of oocyte maturation(GO:1900194) |
| 0.0 | 0.8 | GO:0045746 | negative regulation of Notch signaling pathway(GO:0045746) |
| 0.0 | 0.2 | GO:0048069 | eye pigmentation(GO:0048069) |
| 0.0 | 0.1 | GO:1904749 | regulation of protein localization to nucleolus(GO:1904749) positive regulation of protein localization to nucleolus(GO:1904751) |
| 0.0 | 0.3 | GO:0071378 | growth hormone receptor signaling pathway(GO:0060396) cellular response to growth hormone stimulus(GO:0071378) |
| 0.0 | 0.2 | GO:2000786 | positive regulation of autophagosome assembly(GO:2000786) |
| 0.0 | 0.1 | GO:0006621 | protein retention in ER lumen(GO:0006621) |
| 0.0 | 0.5 | GO:0021692 | cerebellar Purkinje cell layer morphogenesis(GO:0021692) |
| 0.0 | 0.1 | GO:0061368 | behavioral response to chemical pain(GO:0061366) behavioral response to formalin induced pain(GO:0061368) |
| 0.0 | 0.3 | GO:0032402 | melanosome transport(GO:0032402) |
| 0.0 | 0.1 | GO:0070475 | nucleolus organization(GO:0007000) rRNA base methylation(GO:0070475) |
| 0.0 | 0.8 | GO:0032543 | mitochondrial translation(GO:0032543) |
| 0.0 | 0.6 | GO:0043388 | positive regulation of DNA binding(GO:0043388) |
| 0.0 | 1.5 | GO:0010811 | positive regulation of cell-substrate adhesion(GO:0010811) |
| 0.0 | 1.6 | GO:0051028 | mRNA transport(GO:0051028) |
| 0.0 | 0.1 | GO:1904491 | protein localization to ciliary transition zone(GO:1904491) |
| 0.0 | 0.4 | GO:0032728 | positive regulation of interferon-beta production(GO:0032728) |
| 0.0 | 0.3 | GO:0046834 | lipid phosphorylation(GO:0046834) |
Gene overrepresentation in cellular_component category:
| Log-likelihood per target | Total log-likelihood | Term | Description |
|---|---|---|---|
| 0.7 | 2.0 | GO:0005584 | collagen type I trimer(GO:0005584) |
| 0.3 | 1.3 | GO:0005861 | troponin complex(GO:0005861) |
| 0.2 | 1.6 | GO:0098533 | ATPase dependent transmembrane transport complex(GO:0098533) |
| 0.1 | 0.7 | GO:0005964 | phosphorylase kinase complex(GO:0005964) |
| 0.1 | 0.5 | GO:0008091 | spectrin(GO:0008091) |
| 0.1 | 0.3 | GO:1990032 | parallel fiber(GO:1990032) |
| 0.1 | 0.3 | GO:0071797 | LUBAC complex(GO:0071797) |
| 0.1 | 0.5 | GO:0097136 | Bcl-2 family protein complex(GO:0097136) |
| 0.1 | 0.4 | GO:1990726 | Lsm1-7-Pat1 complex(GO:1990726) |
| 0.1 | 0.9 | GO:0044300 | cerebellar mossy fiber(GO:0044300) |
| 0.0 | 1.8 | GO:0032420 | stereocilium(GO:0032420) |
| 0.0 | 2.8 | GO:0005581 | collagen trimer(GO:0005581) |
| 0.0 | 2.5 | GO:0016363 | nuclear matrix(GO:0016363) |
| 0.0 | 0.3 | GO:0005869 | dynactin complex(GO:0005869) |
| 0.0 | 0.1 | GO:0048787 | presynaptic active zone membrane(GO:0048787) |
| 0.0 | 0.8 | GO:0000315 | organellar large ribosomal subunit(GO:0000315) mitochondrial large ribosomal subunit(GO:0005762) |
| 0.0 | 0.4 | GO:0005666 | DNA-directed RNA polymerase III complex(GO:0005666) |
| 0.0 | 0.2 | GO:0001650 | fibrillar center(GO:0001650) |
| 0.0 | 0.7 | GO:0044295 | axonal growth cone(GO:0044295) |
| 0.0 | 0.3 | GO:0030134 | ER to Golgi transport vesicle(GO:0030134) |
| 0.0 | 0.4 | GO:0034707 | chloride channel complex(GO:0034707) |
| 0.0 | 1.1 | GO:0043198 | dendritic shaft(GO:0043198) |
| 0.0 | 1.1 | GO:0036064 | ciliary basal body(GO:0036064) |
Gene overrepresentation in molecular_function category:
| Log-likelihood per target | Total log-likelihood | Term | Description |
|---|---|---|---|
| 0.3 | 3.3 | GO:0001161 | intronic transcription regulatory region sequence-specific DNA binding(GO:0001161) |
| 0.3 | 1.3 | GO:0031014 | troponin T binding(GO:0031014) |
| 0.2 | 1.3 | GO:0005042 | netrin receptor activity(GO:0005042) |
| 0.2 | 1.0 | GO:0032767 | copper-dependent protein binding(GO:0032767) |
| 0.2 | 0.6 | GO:0004791 | thioredoxin-disulfide reductase activity(GO:0004791) |
| 0.1 | 0.6 | GO:0031800 | type 3 metabotropic glutamate receptor binding(GO:0031800) |
| 0.1 | 2.0 | GO:0048407 | platelet-derived growth factor binding(GO:0048407) |
| 0.1 | 1.6 | GO:0017127 | cholesterol transporter activity(GO:0017127) |
| 0.1 | 0.3 | GO:0016635 | oxidoreductase activity, acting on the CH-CH group of donors, quinone or related compound as acceptor(GO:0016635) |
| 0.1 | 0.7 | GO:0004689 | phosphorylase kinase activity(GO:0004689) |
| 0.1 | 0.5 | GO:1990829 | C-rich single-stranded DNA binding(GO:1990829) |
| 0.1 | 0.6 | GO:0070191 | methionine-R-sulfoxide reductase activity(GO:0070191) |
| 0.1 | 0.3 | GO:0003941 | L-serine ammonia-lyase activity(GO:0003941) |
| 0.1 | 1.6 | GO:0017161 | phosphohistidine phosphatase activity(GO:0008969) inositol-1,3,4-trisphosphate 4-phosphatase activity(GO:0017161) NADP phosphatase activity(GO:0019178) 5-amino-6-(5-phosphoribitylamino)uracil phosphatase activity(GO:0043726) phosphatidylinositol-3,5-bisphosphate 5-phosphatase activity(GO:0043813) inositol-1,3,4,5,6-pentakisphosphate 1-phosphatase activity(GO:0052825) inositol-3,4-bisphosphate 4-phosphatase activity(GO:0052828) inositol-1,3,4-trisphosphate 1-phosphatase activity(GO:0052829) inositol-1,3,4,6-tetrakisphosphate 6-phosphatase activity(GO:0052830) inositol-1,3,4,6-tetrakisphosphate 1-phosphatase activity(GO:0052831) phosphatidylinositol-1,4,5-trisphosphate 5-phosphatase activity(GO:0052867) IDP phosphatase activity(GO:1990003) |
| 0.1 | 1.3 | GO:0050750 | low-density lipoprotein particle receptor binding(GO:0050750) |
| 0.1 | 0.5 | GO:0051434 | BH3 domain binding(GO:0051434) |
| 0.1 | 0.3 | GO:0008269 | JAK pathway signal transduction adaptor activity(GO:0008269) |
| 0.1 | 0.3 | GO:1990825 | sequence-specific mRNA binding(GO:1990825) |
| 0.1 | 0.2 | GO:0016309 | 1-phosphatidylinositol-5-phosphate 4-kinase activity(GO:0016309) |
| 0.1 | 0.7 | GO:0008191 | metalloendopeptidase inhibitor activity(GO:0008191) |
| 0.1 | 0.2 | GO:0004483 | mRNA (nucleoside-2'-O-)-methyltransferase activity(GO:0004483) |
| 0.0 | 0.3 | GO:0035662 | Toll-like receptor 4 binding(GO:0035662) |
| 0.0 | 0.1 | GO:0070905 | serine binding(GO:0070905) |
| 0.0 | 0.3 | GO:0051718 | DNA (cytosine-5-)-methyltransferase activity(GO:0003886) DNA (cytosine-5-)-methyltransferase activity, acting on CpG substrates(GO:0051718) |
| 0.0 | 0.2 | GO:0061656 | SUMO conjugating enzyme activity(GO:0061656) |
| 0.0 | 0.5 | GO:0005522 | profilin binding(GO:0005522) |
| 0.0 | 0.8 | GO:0048156 | tau protein binding(GO:0048156) |
| 0.0 | 0.1 | GO:0046923 | ER retention sequence binding(GO:0046923) |
| 0.0 | 0.3 | GO:0001727 | lipid kinase activity(GO:0001727) |
| 0.0 | 0.4 | GO:0036310 | annealing helicase activity(GO:0036310) |
| 0.0 | 0.4 | GO:0005247 | voltage-gated chloride channel activity(GO:0005247) |
| 0.0 | 0.2 | GO:0005068 | transmembrane receptor protein tyrosine kinase adaptor activity(GO:0005068) |
| 0.0 | 0.2 | GO:0019869 | chloride channel inhibitor activity(GO:0019869) |
| 0.0 | 0.3 | GO:0070182 | DNA polymerase binding(GO:0070182) |
| 0.0 | 0.1 | GO:0002151 | G-quadruplex RNA binding(GO:0002151) |
| 0.0 | 0.4 | GO:0005545 | 1-phosphatidylinositol binding(GO:0005545) |
| 0.0 | 0.4 | GO:0001056 | RNA polymerase III activity(GO:0001056) |
| 0.0 | 1.2 | GO:0003730 | mRNA 3'-UTR binding(GO:0003730) |
| 0.0 | 0.3 | GO:0070628 | proteasome binding(GO:0070628) |
| 0.0 | 1.7 | GO:0005178 | integrin binding(GO:0005178) |
| 0.0 | 1.2 | GO:0035254 | glutamate receptor binding(GO:0035254) |
| 0.0 | 0.4 | GO:0071889 | 14-3-3 protein binding(GO:0071889) |
| 0.0 | 0.2 | GO:0051864 | histone demethylase activity (H3-K36 specific)(GO:0051864) |
| 0.0 | 0.3 | GO:0042605 | peptide antigen binding(GO:0042605) |
| 0.0 | 0.2 | GO:0004012 | phospholipid-translocating ATPase activity(GO:0004012) |