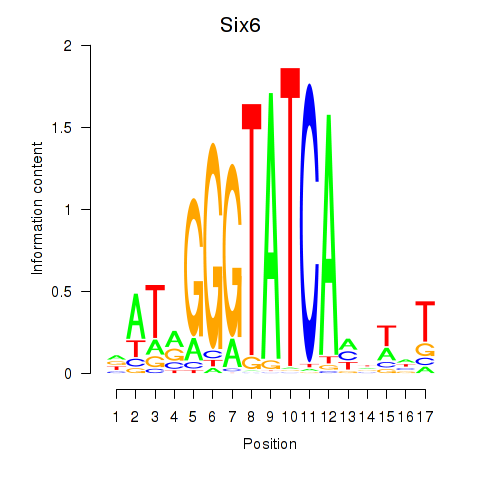
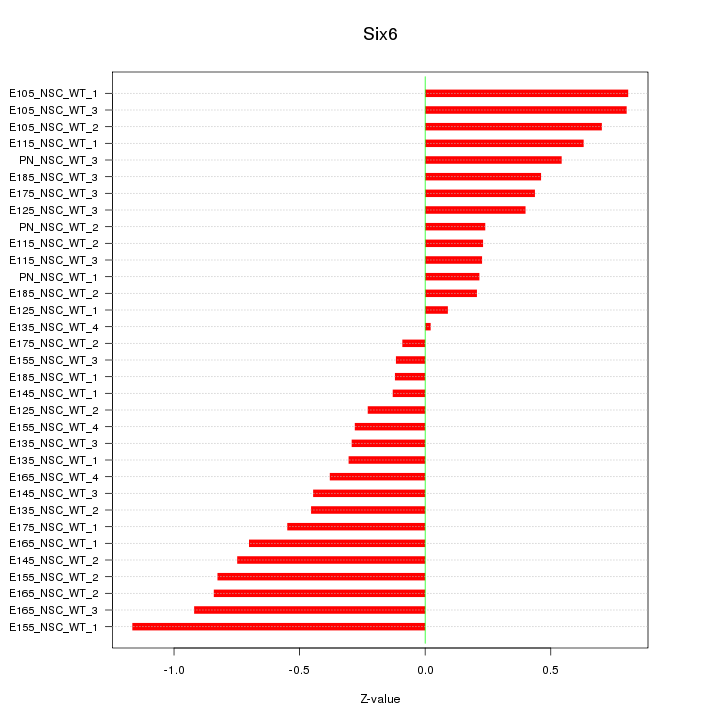
Motif ID: Six6
Z-value: 0.527
Transcription factors associated with Six6:
| Gene Symbol | Entrez ID | Gene Name |
|---|---|---|
| Six6 | ENSMUSG00000021099.5 | Six6 |
Activity-expression correlation:
| Gene Symbol | Promoter | Pearson corr. coef. | P-value | Plot |
|---|---|---|---|---|
| Six6 | mm10_v2_chr12_+_72939724_72939758 | 0.53 | 1.4e-03 | Click! |


Top targets:
Gene overrepresentation in biological_process category:
| Log-likelihood per target | Total log-likelihood | Term | Description |
|---|---|---|---|
| 0.8 | 4.9 | GO:0021797 | forebrain anterior/posterior pattern specification(GO:0021797) |
| 0.7 | 3.3 | GO:0060414 | aorta smooth muscle tissue morphogenesis(GO:0060414) |
| 0.6 | 1.9 | GO:0044849 | estrous cycle(GO:0044849) |
| 0.6 | 2.9 | GO:0072488 | ammonium transmembrane transport(GO:0072488) |
| 0.4 | 1.3 | GO:0070844 | misfolded protein transport(GO:0070843) polyubiquitinated protein transport(GO:0070844) polyubiquitinated misfolded protein transport(GO:0070845) Hsp90 deacetylation(GO:0070846) |
| 0.4 | 2.2 | GO:0034441 | plasma lipoprotein particle oxidation(GO:0034441) |
| 0.4 | 2.1 | GO:0019659 | lactate biosynthetic process from pyruvate(GO:0019244) lactate biosynthetic process(GO:0019249) glucose catabolic process to lactate(GO:0019659) glycolytic fermentation(GO:0019660) glucose catabolic process to lactate via pyruvate(GO:0019661) |
| 0.4 | 2.0 | GO:0007386 | compartment pattern specification(GO:0007386) |
| 0.4 | 1.6 | GO:0048539 | bone marrow development(GO:0048539) |
| 0.4 | 1.1 | GO:0046032 | ADP catabolic process(GO:0046032) |
| 0.3 | 3.4 | GO:0061158 | 3'-UTR-mediated mRNA destabilization(GO:0061158) |
| 0.3 | 1.2 | GO:0070318 | positive regulation of G0 to G1 transition(GO:0070318) |
| 0.3 | 1.2 | GO:0006776 | vitamin A metabolic process(GO:0006776) |
| 0.3 | 1.7 | GO:0032713 | negative regulation of interleukin-4 production(GO:0032713) |
| 0.2 | 0.7 | GO:0048496 | maintenance of organ identity(GO:0048496) |
| 0.2 | 0.9 | GO:0031581 | hemidesmosome assembly(GO:0031581) |
| 0.2 | 1.4 | GO:2000002 | negative regulation of DNA damage checkpoint(GO:2000002) |
| 0.2 | 1.3 | GO:0071474 | cellular hyperosmotic response(GO:0071474) |
| 0.2 | 0.9 | GO:0007089 | traversing start control point of mitotic cell cycle(GO:0007089) |
| 0.2 | 1.3 | GO:0071372 | cellular response to follicle-stimulating hormone stimulus(GO:0071372) |
| 0.1 | 3.1 | GO:0046685 | response to activity(GO:0014823) response to arsenic-containing substance(GO:0046685) |
| 0.1 | 1.0 | GO:0071294 | cellular response to zinc ion(GO:0071294) |
| 0.1 | 0.5 | GO:0030647 | polyketide metabolic process(GO:0030638) aminoglycoside antibiotic metabolic process(GO:0030647) daunorubicin metabolic process(GO:0044597) doxorubicin metabolic process(GO:0044598) |
| 0.1 | 1.9 | GO:0035563 | positive regulation of chromatin binding(GO:0035563) |
| 0.1 | 0.3 | GO:0001193 | maintenance of transcriptional fidelity during DNA-templated transcription elongation(GO:0001192) maintenance of transcriptional fidelity during DNA-templated transcription elongation from RNA polymerase II promoter(GO:0001193) |
| 0.1 | 0.4 | GO:0019614 | catechol-containing compound catabolic process(GO:0019614) catecholamine catabolic process(GO:0042424) |
| 0.1 | 0.5 | GO:0075525 | viral translational termination-reinitiation(GO:0075525) |
| 0.1 | 0.2 | GO:0002314 | germinal center B cell differentiation(GO:0002314) |
| 0.1 | 0.3 | GO:0060032 | notochord regression(GO:0060032) |
| 0.1 | 0.4 | GO:1900169 | regulation of glucocorticoid mediated signaling pathway(GO:1900169) |
| 0.1 | 0.3 | GO:0097428 | protein maturation by iron-sulfur cluster transfer(GO:0097428) |
| 0.1 | 0.8 | GO:1901673 | regulation of mitotic spindle assembly(GO:1901673) |
| 0.1 | 0.4 | GO:0032790 | ribosome disassembly(GO:0032790) |
| 0.1 | 0.8 | GO:0006268 | DNA unwinding involved in DNA replication(GO:0006268) |
| 0.1 | 0.5 | GO:0032836 | glomerular basement membrane development(GO:0032836) |
| 0.1 | 0.2 | GO:0071550 | death-inducing signaling complex assembly(GO:0071550) |
| 0.1 | 0.6 | GO:0045040 | protein import into mitochondrial outer membrane(GO:0045040) negative regulation of protein folding(GO:1903333) |
| 0.1 | 0.6 | GO:0019368 | fatty acid elongation, saturated fatty acid(GO:0019367) fatty acid elongation, unsaturated fatty acid(GO:0019368) fatty acid elongation, monounsaturated fatty acid(GO:0034625) fatty acid elongation, polyunsaturated fatty acid(GO:0034626) |
| 0.1 | 1.1 | GO:0032981 | NADH dehydrogenase complex assembly(GO:0010257) mitochondrial respiratory chain complex I assembly(GO:0032981) mitochondrial respiratory chain complex I biogenesis(GO:0097031) |
| 0.0 | 1.2 | GO:0018345 | protein palmitoylation(GO:0018345) |
| 0.0 | 0.3 | GO:0070989 | oxidative demethylation(GO:0070989) |
| 0.0 | 1.0 | GO:0042753 | positive regulation of circadian rhythm(GO:0042753) |
| 0.0 | 0.2 | GO:0070236 | negative regulation of activation-induced cell death of T cells(GO:0070236) |
| 0.0 | 0.3 | GO:0006729 | tetrahydrobiopterin biosynthetic process(GO:0006729) tetrahydrobiopterin metabolic process(GO:0046146) |
| 0.0 | 0.5 | GO:0009048 | dosage compensation by inactivation of X chromosome(GO:0009048) |
| 0.0 | 0.4 | GO:0030150 | protein import into mitochondrial matrix(GO:0030150) |
| 0.0 | 0.2 | GO:0006686 | sphingomyelin biosynthetic process(GO:0006686) |
| 0.0 | 0.5 | GO:0035025 | positive regulation of Rho protein signal transduction(GO:0035025) |
| 0.0 | 0.9 | GO:0048246 | macrophage chemotaxis(GO:0048246) |
| 0.0 | 0.5 | GO:0045954 | positive regulation of natural killer cell mediated cytotoxicity(GO:0045954) |
| 0.0 | 0.3 | GO:0051482 | positive regulation of cytosolic calcium ion concentration involved in phospholipase C-activating G-protein coupled signaling pathway(GO:0051482) |
| 0.0 | 0.5 | GO:0016973 | poly(A)+ mRNA export from nucleus(GO:0016973) |
| 0.0 | 0.4 | GO:0006337 | nucleosome disassembly(GO:0006337) protein-DNA complex disassembly(GO:0032986) |
| 0.0 | 0.4 | GO:0015693 | magnesium ion transport(GO:0015693) |
| 0.0 | 0.3 | GO:0043923 | positive regulation by host of viral transcription(GO:0043923) |
| 0.0 | 0.2 | GO:0006370 | 7-methylguanosine mRNA capping(GO:0006370) |
| 0.0 | 0.4 | GO:0006656 | phosphatidylcholine biosynthetic process(GO:0006656) |
| 0.0 | 0.5 | GO:0000027 | ribosomal large subunit assembly(GO:0000027) |
| 0.0 | 0.4 | GO:0034315 | regulation of Arp2/3 complex-mediated actin nucleation(GO:0034315) |
| 0.0 | 0.1 | GO:0042760 | very long-chain fatty acid catabolic process(GO:0042760) |
| 0.0 | 0.6 | GO:0007026 | negative regulation of microtubule depolymerization(GO:0007026) |
| 0.0 | 0.9 | GO:0031122 | cytoplasmic microtubule organization(GO:0031122) |
| 0.0 | 1.4 | GO:0007338 | single fertilization(GO:0007338) |
| 0.0 | 1.4 | GO:0032526 | response to retinoic acid(GO:0032526) |
| 0.0 | 1.1 | GO:0050868 | negative regulation of T cell activation(GO:0050868) |
| 0.0 | 0.2 | GO:2001214 | positive regulation of vasculogenesis(GO:2001214) |
| 0.0 | 0.3 | GO:0007019 | microtubule depolymerization(GO:0007019) |
| 0.0 | 1.8 | GO:0008203 | cholesterol metabolic process(GO:0008203) |
| 0.0 | 0.2 | GO:0046855 | phosphorylated carbohydrate dephosphorylation(GO:0046838) inositol phosphate dephosphorylation(GO:0046855) |
| 0.0 | 0.2 | GO:0006958 | complement activation, classical pathway(GO:0006958) |
| 0.0 | 0.2 | GO:0033194 | response to hydroperoxide(GO:0033194) |
| 0.0 | 0.2 | GO:0071624 | positive regulation of granulocyte chemotaxis(GO:0071624) positive regulation of neutrophil chemotaxis(GO:0090023) |
Gene overrepresentation in cellular_component category:
| Log-likelihood per target | Total log-likelihood | Term | Description |
|---|---|---|---|
| 0.5 | 0.5 | GO:0005797 | Golgi medial cisterna(GO:0005797) |
| 0.3 | 3.3 | GO:0098643 | fibrillar collagen trimer(GO:0005583) banded collagen fibril(GO:0098643) |
| 0.2 | 0.7 | GO:0097543 | ciliary inversin compartment(GO:0097543) |
| 0.2 | 0.6 | GO:0097447 | dendritic tree(GO:0097447) |
| 0.2 | 2.1 | GO:0035686 | sperm fibrous sheath(GO:0035686) |
| 0.1 | 1.9 | GO:0043219 | lateral loop(GO:0043219) |
| 0.1 | 2.2 | GO:0034362 | low-density lipoprotein particle(GO:0034362) |
| 0.1 | 1.3 | GO:0031362 | anchored component of external side of plasma membrane(GO:0031362) |
| 0.1 | 1.4 | GO:0005688 | U6 snRNP(GO:0005688) |
| 0.1 | 0.3 | GO:0032311 | angiogenin-PRI complex(GO:0032311) |
| 0.1 | 0.9 | GO:0031080 | nuclear pore outer ring(GO:0031080) |
| 0.1 | 0.8 | GO:0000815 | ESCRT III complex(GO:0000815) |
| 0.1 | 0.6 | GO:0030915 | Smc5-Smc6 complex(GO:0030915) |
| 0.1 | 0.9 | GO:0030056 | hemidesmosome(GO:0030056) |
| 0.1 | 0.2 | GO:0019815 | B cell receptor complex(GO:0019815) |
| 0.1 | 0.5 | GO:0071541 | eukaryotic translation initiation factor 3 complex, eIF3m(GO:0071541) |
| 0.1 | 0.2 | GO:0097057 | TRAF2-GSTP1 complex(GO:0097057) |
| 0.1 | 0.8 | GO:0042555 | MCM complex(GO:0042555) |
| 0.1 | 1.1 | GO:0001772 | immunological synapse(GO:0001772) |
| 0.0 | 3.6 | GO:0005881 | cytoplasmic microtubule(GO:0005881) |
| 0.0 | 3.1 | GO:0014704 | intercalated disc(GO:0014704) |
| 0.0 | 2.6 | GO:0000932 | cytoplasmic mRNA processing body(GO:0000932) |
| 0.0 | 1.0 | GO:0097038 | perinuclear endoplasmic reticulum(GO:0097038) |
| 0.0 | 0.5 | GO:0042405 | nuclear inclusion body(GO:0042405) |
| 0.0 | 1.4 | GO:0005801 | cis-Golgi network(GO:0005801) |
| 0.0 | 0.3 | GO:0072669 | tRNA-splicing ligase complex(GO:0072669) |
| 0.0 | 0.6 | GO:0005669 | transcription factor TFIID complex(GO:0005669) |
| 0.0 | 0.3 | GO:0000164 | protein phosphatase type 1 complex(GO:0000164) |
| 0.0 | 0.3 | GO:0097542 | ciliary tip(GO:0097542) |
| 0.0 | 0.3 | GO:0032797 | SMN complex(GO:0032797) |
| 0.0 | 0.8 | GO:0055038 | recycling endosome membrane(GO:0055038) |
| 0.0 | 0.2 | GO:0034518 | mRNA cap binding complex(GO:0005845) RNA cap binding complex(GO:0034518) |
| 0.0 | 0.3 | GO:0005665 | DNA-directed RNA polymerase II, core complex(GO:0005665) |
| 0.0 | 0.4 | GO:0016514 | SWI/SNF complex(GO:0016514) |
| 0.0 | 0.5 | GO:0034451 | centriolar satellite(GO:0034451) |
| 0.0 | 0.5 | GO:0031672 | A band(GO:0031672) |
| 0.0 | 0.3 | GO:0001741 | XY body(GO:0001741) |
| 0.0 | 0.5 | GO:0000315 | organellar large ribosomal subunit(GO:0000315) mitochondrial large ribosomal subunit(GO:0005762) |
| 0.0 | 0.4 | GO:0032588 | trans-Golgi network membrane(GO:0032588) |
| 0.0 | 0.2 | GO:0031143 | pseudopodium(GO:0031143) |
| 0.0 | 0.7 | GO:0016459 | myosin complex(GO:0016459) |
| 0.0 | 1.4 | GO:0000776 | kinetochore(GO:0000776) |
Gene overrepresentation in molecular_function category:
| Log-likelihood per target | Total log-likelihood | Term | Description |
|---|---|---|---|
| 0.7 | 2.0 | GO:0033829 | O-fucosylpeptide 3-beta-N-acetylglucosaminyltransferase activity(GO:0033829) |
| 0.5 | 2.1 | GO:0004459 | L-lactate dehydrogenase activity(GO:0004459) |
| 0.3 | 1.4 | GO:0008508 | bile acid:sodium symporter activity(GO:0008508) |
| 0.3 | 1.3 | GO:0042903 | tubulin deacetylase activity(GO:0042903) |
| 0.3 | 1.0 | GO:0030171 | voltage-gated proton channel activity(GO:0030171) |
| 0.3 | 1.4 | GO:0030621 | U4 snRNA binding(GO:0030621) |
| 0.2 | 2.2 | GO:0003847 | 1-alkyl-2-acetylglycerophosphocholine esterase activity(GO:0003847) calcium-independent phospholipase A2 activity(GO:0047499) |
| 0.2 | 1.9 | GO:0004716 | receptor signaling protein tyrosine kinase activity(GO:0004716) |
| 0.2 | 0.9 | GO:0031727 | CCR2 chemokine receptor binding(GO:0031727) |
| 0.2 | 2.2 | GO:0008395 | steroid hydroxylase activity(GO:0008395) |
| 0.2 | 3.3 | GO:0048407 | platelet-derived growth factor binding(GO:0048407) |
| 0.2 | 1.2 | GO:0019841 | retinol binding(GO:0019841) |
| 0.2 | 5.0 | GO:0030506 | ankyrin binding(GO:0030506) |
| 0.2 | 0.6 | GO:0010698 | acetyltransferase activator activity(GO:0010698) |
| 0.2 | 3.4 | GO:0035198 | miRNA binding(GO:0035198) |
| 0.1 | 0.4 | GO:0016206 | catechol O-methyltransferase activity(GO:0016206) |
| 0.1 | 0.4 | GO:0004307 | ethanolaminephosphotransferase activity(GO:0004307) |
| 0.1 | 1.9 | GO:0008519 | ammonium transmembrane transporter activity(GO:0008519) |
| 0.1 | 1.1 | GO:0047631 | adenosine-diphosphatase activity(GO:0043262) ADP-ribose diphosphatase activity(GO:0047631) |
| 0.1 | 1.3 | GO:0005167 | neurotrophin TRK receptor binding(GO:0005167) |
| 0.1 | 0.5 | GO:1990932 | 5.8S rRNA binding(GO:1990932) |
| 0.1 | 0.2 | GO:0035673 | oligopeptide transmembrane transporter activity(GO:0035673) |
| 0.1 | 1.2 | GO:0005520 | insulin-like growth factor binding(GO:0005520) |
| 0.1 | 0.2 | GO:0004127 | cytidylate kinase activity(GO:0004127) |
| 0.1 | 0.6 | GO:0102338 | fatty acid elongase activity(GO:0009922) 3-oxo-arachidoyl-CoA synthase activity(GO:0102336) 3-oxo-cerotoyl-CoA synthase activity(GO:0102337) 3-oxo-lignoceronyl-CoA synthase activity(GO:0102338) |
| 0.1 | 0.2 | GO:0033188 | sphingomyelin synthase activity(GO:0033188) ceramide cholinephosphotransferase activity(GO:0047493) |
| 0.0 | 0.3 | GO:0070915 | lysophosphatidic acid receptor activity(GO:0070915) |
| 0.0 | 1.2 | GO:0019706 | protein-cysteine S-palmitoyltransferase activity(GO:0019706) |
| 0.0 | 0.3 | GO:0008428 | ribonuclease inhibitor activity(GO:0008428) |
| 0.0 | 0.3 | GO:0070579 | methylcytosine dioxygenase activity(GO:0070579) |
| 0.0 | 0.5 | GO:0048038 | quinone binding(GO:0048038) |
| 0.0 | 0.1 | GO:0022865 | transmembrane electron transfer carrier(GO:0022865) |
| 0.0 | 1.4 | GO:0051539 | 4 iron, 4 sulfur cluster binding(GO:0051539) |
| 0.0 | 0.4 | GO:0015095 | magnesium ion transmembrane transporter activity(GO:0015095) |
| 0.0 | 1.4 | GO:0003743 | translation initiation factor activity(GO:0003743) |
| 0.0 | 0.4 | GO:0005078 | MAP-kinase scaffold activity(GO:0005078) |
| 0.0 | 0.5 | GO:0030676 | Rac guanyl-nucleotide exchange factor activity(GO:0030676) |
| 0.0 | 4.1 | GO:0001227 | transcriptional repressor activity, RNA polymerase II transcription regulatory region sequence-specific binding(GO:0001227) |
| 0.0 | 0.2 | GO:0015279 | store-operated calcium channel activity(GO:0015279) |
| 0.0 | 0.2 | GO:0034987 | immunoglobulin receptor binding(GO:0034987) |
| 0.0 | 0.8 | GO:0004003 | ATP-dependent DNA helicase activity(GO:0004003) |
| 0.0 | 0.5 | GO:0005487 | nucleocytoplasmic transporter activity(GO:0005487) |
| 0.0 | 0.8 | GO:0015485 | cholesterol binding(GO:0015485) |
| 0.0 | 0.2 | GO:0045236 | CXCR chemokine receptor binding(GO:0045236) |
| 0.0 | 0.2 | GO:0005035 | tumor necrosis factor-activated receptor activity(GO:0005031) death receptor activity(GO:0005035) |
| 0.0 | 0.4 | GO:0070273 | phosphatidylinositol-4-phosphate binding(GO:0070273) |
| 0.0 | 0.2 | GO:0080025 | phosphatidylinositol-3,5-bisphosphate binding(GO:0080025) |
| 0.0 | 0.2 | GO:0017161 | JUN kinase phosphatase activity(GO:0008579) phosphohistidine phosphatase activity(GO:0008969) inositol-1,3,4-trisphosphate 4-phosphatase activity(GO:0017161) NADP phosphatase activity(GO:0019178) 5-amino-6-(5-phosphoribitylamino)uracil phosphatase activity(GO:0043726) phosphatidylinositol-3,5-bisphosphate 5-phosphatase activity(GO:0043813) inositol-1,3,4,5,6-pentakisphosphate 1-phosphatase activity(GO:0052825) inositol-3,4-bisphosphate 4-phosphatase activity(GO:0052828) inositol-1,3,4-trisphosphate 1-phosphatase activity(GO:0052829) inositol-1,3,4,6-tetrakisphosphate 6-phosphatase activity(GO:0052830) inositol-1,3,4,6-tetrakisphosphate 1-phosphatase activity(GO:0052831) phosphatidylinositol-1,4,5-trisphosphate 5-phosphatase activity(GO:0052867) IDP phosphatase activity(GO:1990003) |
| 0.0 | 0.4 | GO:0031492 | nucleosomal DNA binding(GO:0031492) |
| 0.0 | 0.3 | GO:0017134 | fibroblast growth factor binding(GO:0017134) |
| 0.0 | 0.2 | GO:0017017 | MAP kinase tyrosine/serine/threonine phosphatase activity(GO:0017017) |
| 0.0 | 1.1 | GO:0004860 | protein kinase inhibitor activity(GO:0004860) |
| 0.0 | 0.2 | GO:0031434 | mitogen-activated protein kinase kinase binding(GO:0031434) |
| 0.0 | 0.2 | GO:0050136 | NADH dehydrogenase (ubiquinone) activity(GO:0008137) NADH dehydrogenase (quinone) activity(GO:0050136) |